0pt
Development & implementation of a PyMOL ‘putty’ representation
Abstract
Overview — The PyMOL molecular graphics program has been modified to introduce a new ‘putty’ cartoon representation, akin to the ‘sausage’-style representation of the MOLMOL molecular visualization (MolVis) software package. This document outlines the development and implementation of the putty representation.
Background, Motivation
PyMOL (http://pymol.org) is an open-source software package designed for molecular graphics visualization and modelling. The PyMOL code-base is written in the C programming language, and much of the higher-level, user-accessible functionality is coded in Python. This software engineering design endows PyMOL with a rich Python application programming interface (API), which end-users can utilize for achieving non-trivial tasks such as loading and analyzing MD trajectories, parsing and analyzing virus structures, and so on. In short, PyMOL is highly extensible.
My motivation for introducing ‘sausage’–style cartoons stemmed from a desire to represent arbitrary molecular properties in a cartoon format, such that the diameter of the tubular spline that traces the backbone of the biopolymer would vary proportionately with some property of interest (as encoded in the -factor field of the PDB file). The only other molecular graphics program which I am aware of as being able to render variable-width cartoons is the MOLMOL software from the Wüthrich lab (ETH-Zürich); in that case, the MolVis software is typically used to represent, say, the position-specific RMSD in a bundle of NMR structures.
In the case of MD simulations, one may wish to use such a representation style to visualize and display the coordinate root-mean-square fluctuation (RMSF) along a dynamics trajectory. Also, inclusion of ‘sausage’-style graphical representations has been on PyMOL’s ToDo list for some time (personal communication, WL DeLano).
Implementation
Creation of the new cartoon representation entailed modification of the following files in the PyMOL source code (paths are relative to the base of the source tree):
  layer1/Extrude.c
  layer1/Extrude.h
  layer1/Rep.h
  layer1/Setting.c
  layer1/Setting.h
  layer2/RepCartoon.c
  modules/pymol/setting.py
  modules/pymol/viewing.py
The new rep is termed ‘putty’ so as to avoid conflicts and confusion with preexisting ‘sausage’ objects in the PyMOL source. I had initially implemented putty via a look-up table approach, together with variable-width window smoothing of the various vectors and normals that govern the geometric and lighting characteristics of the final cartoon in the final rendered scene (specular reflections, radiance, radiosity, etc.; see the ‘rendering equation’ and texts on computer graphics rendering for more on this, such as Hanrahan’s chapter in [1]). However, in numerical benchmarking tests the initial approach of variable window smoothing was found to be less efficient than a simple C-based smoothing for real-time rendering, so the latter approach was ultimately adopted.
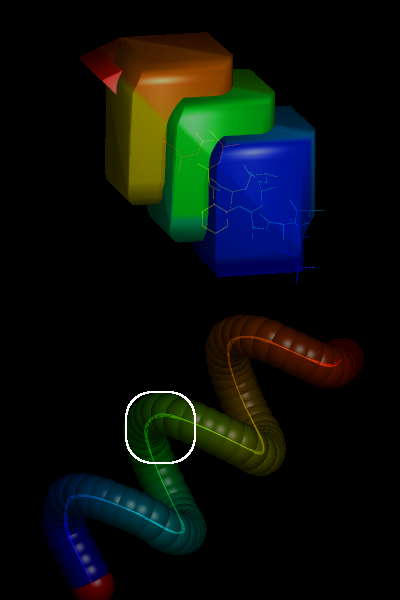
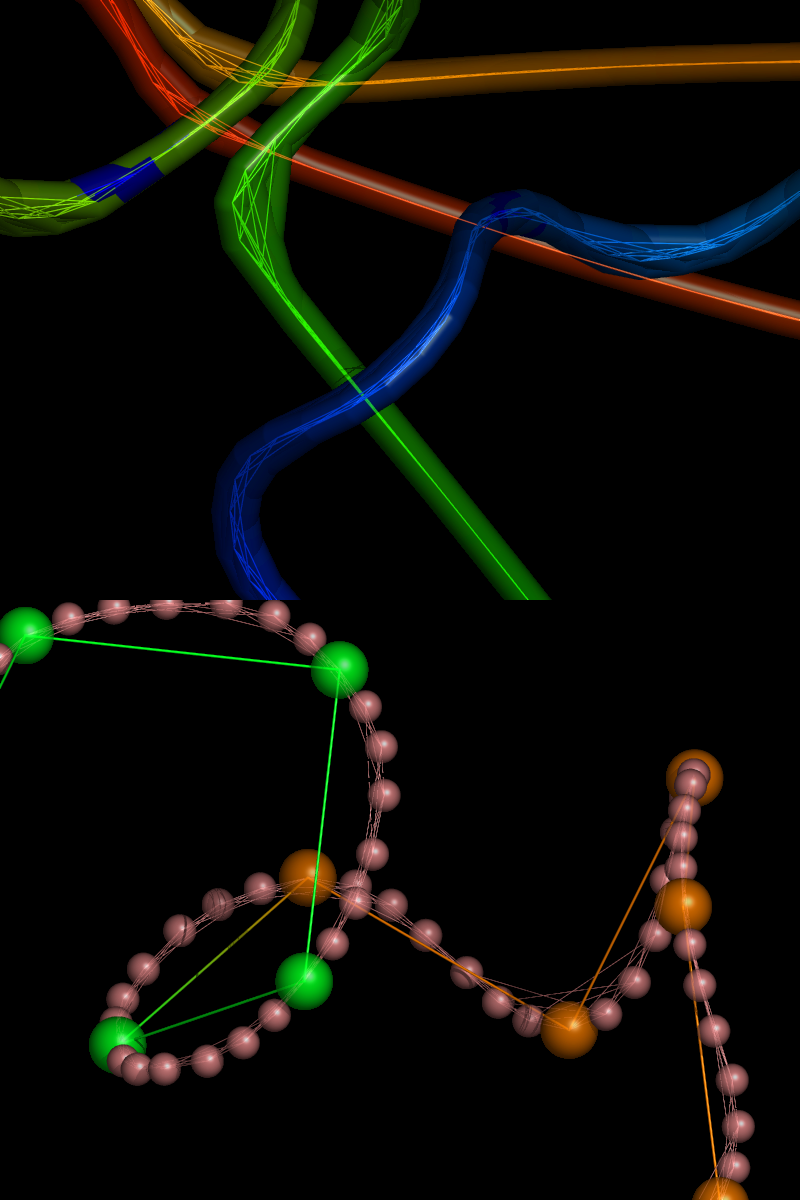
A pictorial overview of the successive stages in putty’s implementation can be found at http://muralab.org/~cmura/PyMOL/Sandbox/#putty_work and in Figs 1 & 2 below. For concrete details on putty’s implementation, ‘diff’ the codebase just before and just after the stable (v0.98) release, paying particular attention to the specific source and header files listed above.
The initial putty code included a provision for anisotropic scaling factors (i.e., non-circular cross-sections of the rendered cartoon), but this probably will have to wait for later versions of PyMOL. The current putty parameters include a few adjustable/user-input values (e.g., putty_radius, putty_quality), as well as scaling of tube diameters by statistical properties of the -factors (putty_mean, putty_stdev) such that the default range of diameters spans (i.e., 95% of the variance, assuming a normal distribution). The new putty code has been incorporated into the latest CVS versions of PyMOL and will be part of the next stable release, ca. early 2005 (v0.98).
PyMOL does not adhere to the GPL (or any other “free” license), so copyright interests have been transferred to DeLano Scientific, LLC.
Use Cases
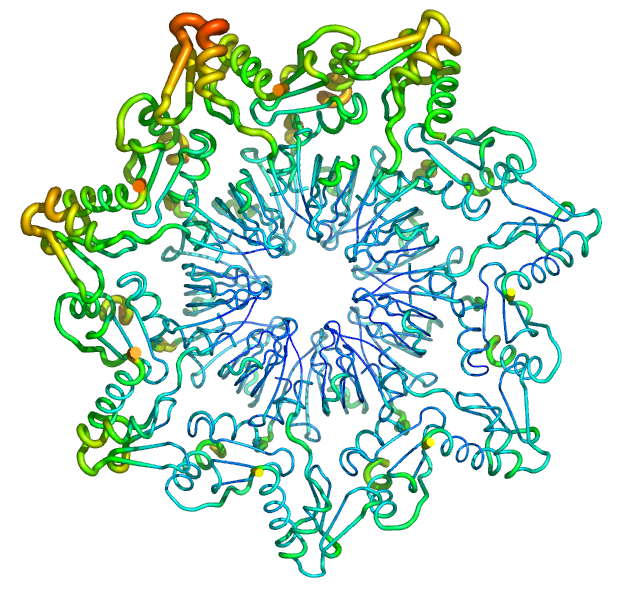
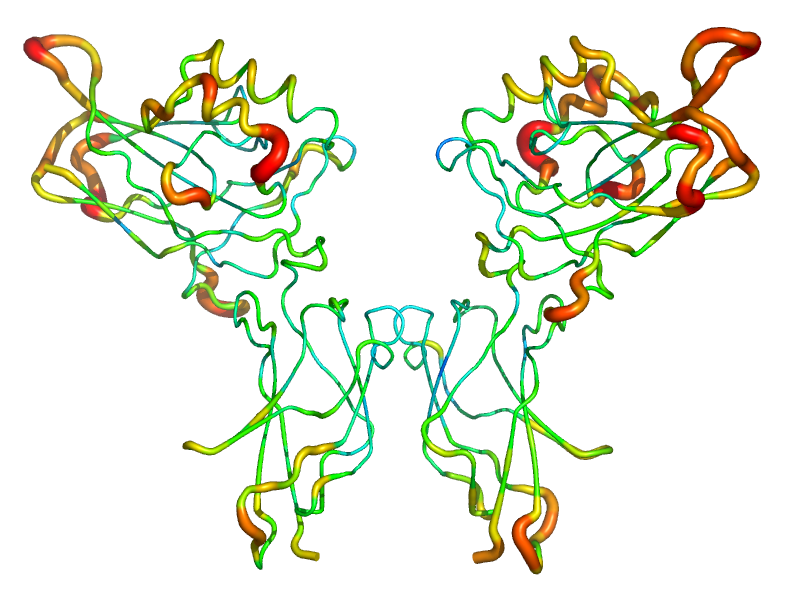
As test cases, the figures shown below demonstrate the application of the new putty-style cartoon representation to a SmAP3 tetradecamer (Fig 3; 1M5Q; [3]) and an NF-B dimer (Fig 4; 1GJI; [2]). The asymmetric unit of the SmAP3 crystals consists of a 28-mer, so the structure illustrated in this figure represents only half of the ASU. Not surprisingly, residues with the highest -factors in both the SmAP3 and c-Rel/NF-B crystal structures are located either near the periphery of the oligomer in the case of SmAP3 (on a face that mediates weak crystal contacts [upper-left]; not the 14-mer14-mer interface area [lower-right]), or else in the irregular/‘loopy’ regions (distal to the central DNA-binding cleft) in the case of the c-Rel transcription factor.
Acknowledgements
WL DeLano, creator and chief author of PyMOL, is thanked for answering questions about the source code and for helping seamlessly integrate the putty modifications into the final code-base prior to its production release. This work was done in the McCammon group at UCSD and was partly funded by a Sloan/DOE postdoctoral fellowship in computational molecular biology.
References
- [1] Michael F. Cohen, John Wallace, and Pat Hanrahan. Radiosity and realistic image synthesis. Academic Press Professional, Inc., San Diego, CA, USA, 1993.
- [2] D.-B. Huang, Y.-Q. Chen, M. Ruetsche, C. B. Phelps, and G. Ghosh. X-ray crystal structure of proto-oncogene product c-Rel bound to the CD28 response element of IL-2. Structure, 9:669–678, 2001.
- [3] Cameron Mura, Martin Phillips, Anna Kozhukhovsky, and David Eisenberg. Structure and assembly of an augmented Sm-like archaeal protein 14-mer. Proceedings of the National Academy of Sciences, 100(8):4539–4544, 2003.