PhysReferences
Discovering Structure From Corruption for Unsupervised Image Reconstruction
Abstract
We consider solving ill-posed imaging inverse problems without access to an image prior or ground-truth examples. An overarching challenge in these inverse problems is that an infinite number of images, including many that are implausible, are consistent with the observed measurements. Thus, image priors are required to reduce the space of possible solutions to more desirable reconstructions. However, in many applications it is difficult or potentially impossible to obtain example images to construct an image prior. Hence inaccurate priors are often used, which inevitably result in biased solutions. Rather than solving an inverse problem using priors that encode the spatial structure of any one image, we propose to solve a set of inverse problems jointly by incorporating prior constraints on the collective structure of the underlying images. The key assumption of our work is that the underlying images we aim to reconstruct share common, low-dimensional structure. We show that such a set of inverse problems can be solved simultaneously without the use of a spatial image prior by instead inferring a shared image generator with a low-dimensional latent space. The parameters of the generator and latent embeddings are found by maximizing a proxy for the Evidence Lower Bound (ELBO). Once identified, the generator and latent embeddings can be combined to provide reconstructed images for each inverse problem. The framework we propose can handle general forward model corruptions, and we show that measurements derived from only a small number of ground-truth images () are sufficient for image reconstruction. We demonstrate our approach on a variety of convex and non-convex inverse problems, including denoising, phase retrieval, and black hole video reconstruction.
Index Terms:
Inverse problems, computational imaging, prior models, generative networks, Bayesian inference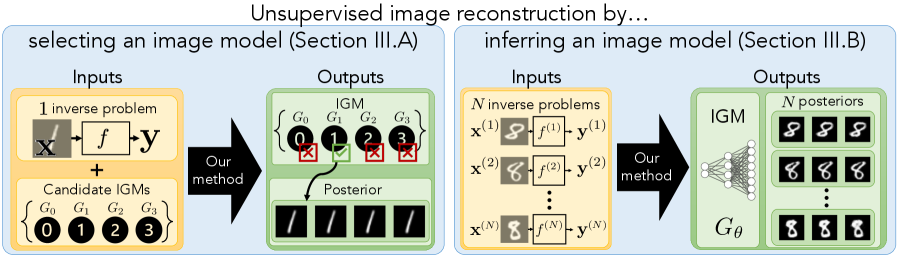
I Introduction
In imaging inverse problems, the goal is to recover an underlying image from corrupted measurements, where the measurements and image are related via an understood forward model: . Here, are measurements, is the underlying image, is a known forward model, and is noise. Such problems are ubiquitous and include denoising [6, 20], super-resolution [7], compressed sensing [8, 19], phase retrieval [21], and deconvolution [35]. Due to corruption by the forward model and noise, these problems are often ill-posed: there are many images that are consistent with the observed measurements, including ones that are implausible.
To combat the ill-posedness in imaging problems, solving for an image traditionally requires imposing additional structural assumptions to reduce the space of possible solutions. We encode these assumptions in an image generation model (IGM), whose goal is to capture the desired properties of an image’s spatial structure. IGMs are general; they encompass probabilistic spatial-domain priors (e.g., that encourage smoothness or sparsity), but also include deep image generators that are not necessarily probabilistic but are trained to primarily sample a certain class of images.
In order to define an IGM, it is necessary to have knowledge of the underlying image’s structure. If images similar to the underlying image are available, then an IGM can be learned directly [44, 56, 4]. However, an abundance of clean images is not available for many scientific imaging modalities (e.g., geophysical imaging and astronomical imaging). Collecting images in these domains can be extremely invasive, time-consuming, expensive, or even impossible. For instance, how should we define an IGM for black hole imaging without having ever seen a direct image of a black hole or knowing what one should look like? Moreover, classical approaches that utilize hand-crafted IGMs, such as total variation [26] or sparsity in a wavelet basis [37], are prone to human bias [34].
In this work, we show how one can solve a set of ill-posed image reconstruction tasks in an unsupervised fashion, i.e., without prior information about an image’s spatial structure or access to clean, example images. The key insight of our work is that knowledge of common structure across multiple diverse images can be sufficient regularization alone. In particular, suppose we have access to a collection of noisy measurements that are observed through (potentially different) forward models . The core assumption we make is that the different underlying images are drawn from the same distribution (unknown a priori) and share common, low-dimensional structure. Thus, our “prior” is not at the spatial-level, but rather exploits the collective structure of the underlying images. This assumption is satisfied in a number of applications where there is no access to an abundance of clean images. For instance, although we might not know what a black hole looks like, we might expect it to be similar in appearance over time. We show that under this assumption, the image reconstruction posteriors can be learned jointly from a small number of examples due to the common, low-dimensional structure of the collection . Specifically, our main result is that one can capitalize on this common structure by jointly solving for 1) a shared image generator and 2) low-dimensional latent distributions , such that the distribution induced by the push-forward of through approximately captures the image reconstruction posterior for each measurement example .
I-A Our Contributions
We outline the main contributions of our work, which extends our prior work presented in [22]:
-
1.
We solve a collection of ill-posed inverse problems without prior knowledge of an image’s spatial structure by exploiting the common, low-dimensional structure shared across images. This common structure is exploited when inferring a shared IGM with a low-dimensional latent space.
-
2.
To infer this IGM, we define a loss inspired by the evidence lower bound (ELBO). We motivate this loss by showing how it aids in unsupervised image reconstruction by helping select one IGM from a collection of candidate IGMs using a single measurement example.
-
3.
We apply our approach to convex and non-convex inverse problems, such as denoising, black hole compressed sensing, and phase retrieval. We establish that we can solve inverse problems without spatial-level priors and demonstrate good performance with only a small number of independent measurement examples (e.g., ).
-
4.
We theoretically analyze the inferred IGM in linear inverse problems under a linear image model to show that in this setting the inferred IGM performs dimensionality reduction akin to PCA on the collection of measurements.
II Background and Related Work
We now discuss related literature in model selection and learning-based IGMs. In order to highlight our key contributions, we emphasize the following assumptions in our framework:
-
1.
We do not have access to a set of images from the same distribution as the underlying images.
-
2.
We only have access to a collection of measurement examples, where each example comes from a different underlying image. The number of examples is small, e.g., .
-
3.
For each underlying image we wish to reconstruct, we only have access to a single measurement example . That is, we do not have multiple observations of the same underlying image. Note each can be potentially different.
II-A Model selection
Model selection techniques seek to choose a model that best explains data by balancing performance and model complexity. In supervised learning problems with sufficiently large amounts of data, this can be achieved simply by evaluating the performance of different candidate models using reserved test data [50]. However, in image reconstruction or other inverse problems with limited data, one cannot afford to hold out data. In these cases, model selection is commonly conducted using probabilistic metrics. The simplest probabilistic metric used for linear model selection is adjusted R2 [40]. It re-weights the goodness-of-fit by the number of linear model parameters, helping reject high-dimensional parameters that do not improve the data fitting accuracy. Similar metrics in nonlinear model selection are Bayesian Information Criterion (BIC) [46] and Akaike Information Criterion (AIC) [1]. AIC and BIC compute different weighted summations of a model’s log-likelihood and complexity, offering different trade-offs between bias and variance to identify the best model for a given dataset.
In our work, we consider the use of the ELBO as a model selection criterion. In [10, 11], the use of the ELBO as a model selection criterion is theoretically analyzed and rates of convergence for variational posterior estimation are shown. Additionally, [52] proposes a generalized class of evidence lower bounds leveraging an extension of the evidence score. In [51], the ELBO is used for model selection to select a few, discrete parameters modeling a physical system (e.g., parameters that govern the orbit of an exoplanet). A significant difference in our context, however, is that we use the ELBO as a model selection criterion in a high-dimensional imaging context, and we optimize the ELBO over a continuous space of possible parameters.
II-B Learning IGMs
With access to a large corpus of example images, it is possible to directly learn an IGM to help solve inverse problems. Seminal work along these lines utilizing generative networks showcased that a pre-trained Generative Adversarial Network (GAN) can be used as an IGM in the problem of compressed sensing [4]. To solve the inverse problem, the GAN was used to constrain the search space for inversion. This approach was shown to outperform sparsity-based techniques with 5-10x fewer measurements. Since then, this idea has been expanded to other inverse problems, including denoising [25], super-resolution [39], magnetic resonance imaging (MRI) [2, 48], and phase retrieval [23, 47]. However, the biggest downside to this approach is the requirement of a large dataset of example images similar to the underlying image, which is often difficult or impossible to obtain in practice. Hence, we consider approaches that are able to directly solve inverse problems without example images.
Methods that aim to learn an IGM from only noisy measurements have been proposed. The main four distinctions between our work and these methods are that these works either: 1) require multiple independent observations of the same underlying image, 2) can only be applied to certain inverse problems, 3) require significantly more observations (either through more observations of each underlying image or by observing more underlying images), or 4) require significant hyperparameter tuning based on knowledge of example images.
Noise2Noise (N2N) [33] learns to denoise images by training on a collection of noisy, independent observations of the same image. To do so, N2N learns a neural network whose goal is to map between noisy images and denoised images . Since it has no denoised image examples to supervise training, it instead employs a loss that maps between noisy examples of the same underlying image. This objective is as follows:
| (1) |
where corresponds to a noisy observation of the -th underlying image , and is a distribution of noisy images where . This N2N objective requires at least two observations of the same image and is limited by the assumption that the expected value of multiple observations of a single image is the underlying image. Thus, N2N is only applicable to denoising problems where the forward model is the identity matrix with independent noise on each pixel. Additionally, in practice N2N requires thousands of underlying images (i.e., ) to perform well. Thus, N2N’s main distinctions with our work are distinctions 1), 2), and 3).
Regularization by Artifact Removal (RARE) [36] generalizes N2N to perform image reconstruction from measurements under linear forward models. That is, the objective in Eq. (1) is modified to include a pseudo-inverse. Nonetheless, multiple observations of the same underlying image are required, such that for the pseudo-inverse matrix . Thus, RARE suffers from the same limiting distinctions as N2N (i.e., 1), 2), and 3)).
Noise2Void [30] and Noise2Self [3] assume that the image can be partitioned such that the measurement noise in one subset of the partition is independent conditioned on the measurements in the other subset. This is true for denoising, but not applicable to general forward models. For example, in black hole and MRI compressed sensing, it is not true that the measurement noise can be independently partitioned since each measurement is a linear combination of all pixels. While this makes Noise2Void and Noise2Self more restrictive in the corruptions they can handle compared to RARE, they also don’t require multiple observations of the same underlying image. Hence the main differences between these works and our own are distinctions 2) and 3).
AmbientGAN [5] and other similar approaches based on GANs [28] and Variational Autoencoders (VAEs) [41, 38] have been proposed to learn an IGM directly from noisy measurements. For instance, AmbientGAN aims to learn a generator whose images lead to simulated measurements that are indistinguishable from the observed measurements; this generator can subsequently be used as a prior to solve inverse problems. However, AmbientGAN requires many measurement examples (on the order of 10,000) to produce a high quality generator. We corroborate this with experiments in Section IV to show that they require many independent observations and/or fine tuning of learning parameters to achieve good performance. Thus, the main distinctions between AmbientGAN and our work are 3) and 4).
Deep Image Prior (DIP) [55] uses a convolutional neural network as an implicit “prior”. DIP has shown strong performance across a variety of inverse problems to perform image reconstruction without explicit probabilistic priors. However, it is prone to overfitting and requires selecting a specific stopping criterion. While this works well when example images exist, selecting this stopping condition from noisy measurements alone introduces significant human bias that can negatively impact results. Thus, the main distinction between DIP and our work is 4).
We would also like to highlight additional work done to improve certain aspects of the DIP. While the original DIP method used a U-Net architecture [45], other works such as the Deep Decoder [24] and ConvDecoder [17] used a decoder-like architecture that progressively grows a low-dimensional random tensor to a high-dimensional image. When underparameterized, such architectures have been shown to avoid overfitting and the need for early stopping. Other works mitigating early stopping include [9], which takes a Bayesian perspective to the DIP by using Langevin dynamics to perform posterior inference over the weights to improve performance and show this does not lead to overfitting.
III Approach
In this work, we propose to solve a set of inverse problems without prior access to an IGM by assuming that the set of underlying images have common, low-dimensional structure. We motivate the use of optimizing the ELBO to infer an IGM by showing that it is a good criterion for generative model selection in Section III-A. Then, by optimizing the ELBO, we show in Section III-B that one can directly infer an IGM from corrupted measurements alone by parameterizing the image model as a deep generative network with a low-dimensional latent distribution. The IGM network weights are shared across all images, capitalizing on the common structure present in the data, while the parameters of each latent distribution are learned jointly with the generator to model the image posteriors for each measurement example.
III-A Motivation for ELBO as a model selection criterion
In order to accurately infer an IGM, we motivate the use of the ELBO as a loss by showing that it provides a principled criterion for selecting an IGM to use as a prior model. Suppose we are given noisy measurements from a single image: . In order to reconstruct the image , we traditionally first require an IGM that captures the distribution was sampled from. A natural approach would be to find or select the model that maximizes the model posterior distribution That is, conditioned on the noisy measurements, find the IGM of highest likelihood. Unfortunately computing is intractable, as it requires marginalizing and integrating over all encompassed by the IGM . However, we show that this quantity can be well approximated using the ELBO.
To motivate our discussion, we first consider estimating the image posterior by learning the parameters of a variational distribution . Observe that the definition of the KL-divergence followed by an application of Bayes’ theorem gives
The ELBO of an IGM given measurements under variational distribution is defined by
| (2) |
Rearranging the previous equation, we see that by the non-negativity of the KL-divergence that
Thus, we can lower bound the model posterior as
Note that is independent of the parameters of interest, . If the variational distribution is a good approximation to the posterior , . Thus, maximizing with respect to is approximately equivalent to maximizing .
Each term in the ELBO objective encourages certain properties of the IGM . In particular, the first term in the ELBO, , requires that should lead to an image estimate that is consistent with our measurements . The second term, , encourages images sampled from to have high likelihood under our model . The final term is the entropy term, , which encourages a that leads to “fatter” minima that are less sensitive to small changes in likely images under .
III-A1 ELBOProxy
Some IGMs are explicit, which allows for direct computation of . For example, if our IGM models as isotropic Gaussian with variance , then . In this case, we can optimize the ELBO defined in Equation (2) directly and then perform model selection. However, an important class of IGMs that we are interested in are those given by deep generative networks. Such IGMs are not probabilistic in the usual Bayesian interpretation of a prior, but instead implicitly enforce structure in the data. A key characteristic of many generative network architectures (e.g., VAEs and GANs) that we leverage is that they generate high-dimensional images from low-dimensional latent representations. Bottlenecking helps the network learn global characteristics of the underlying image distribution while also respecting the low intrinsic dimensionality of natural images. However, this means that we can only compute directly if we have an injective map [29]. This architectural requirement limits the expressivity of the network.
We instead consider a proxy of the ELBO that is especially helpful for deep generative networks. That is, suppose our IGM is of the form . Introducing a variational family for our latent representations and choosing a latent prior distribution , we arrive at the following proxy of the ELBO:
| (3) |
In our experiments, we chose to be an isotropic Gaussian prior. This is a common choice in many generative modeling frameworks and has shown to be a good choice of prior in the latent space.
To motivate this proxy, it is instructive to consider the case where our variational distribution is the push-forward of a latent distribution through an injective or invertible function . To be precise, recall the following definition of the push-forward measure.
Definition 1.
Let be a measurable function and suppose is a distribution (or, more generally, a measure) on . Then the push-forward measure is the measure on that satisfies the following: for all Borel sets of , where denotes the preimage of with respect to .
The push-forward measure essentially characterizes how a distribution changes when passed through a function . It follows from the definition of the push-forward that if and only if where . In the case for an injective function , the and are equivalent, as shown in the following proposition:
Proposition 1.
Suppose is continuously differentiable and injective. For two probability distributions and on , define the measures and . Then
Proof.
It suffices to show
Let denote the Jacobian of at an input . Since is injective and continuously differentiable with , we can compute the likelihood of any point [29] via
where is the inverse of on its range. This is essentially the classical change-of-variables formula specialized to the case when is injective and we wish to access likelihoods on the range of . Note that this equation is only valid for points in the range of the injective function . Likewise, since , we can compute the entropy of for any point as
Now observe that for , as is the push-forward of through . Thus, for , we have that
By the definition of the push-forward measure, we have that implies for some . Using our previous formulas, we can compute the expectation over the difference with respect to as
∎
An important consequence of this result is that for injective generators , the inverse of (on its range) is not required for computing the . In this case, the is in fact equivalent to the . While not all generators will be injective, quality generators are largely injective over high likelihood image samples. In Section III-A2 and Fig. 3, we experimentally show that this proxy can aid in selecting potentially non-injective generative networks from corrupted measurements.
III-A2 Toy example
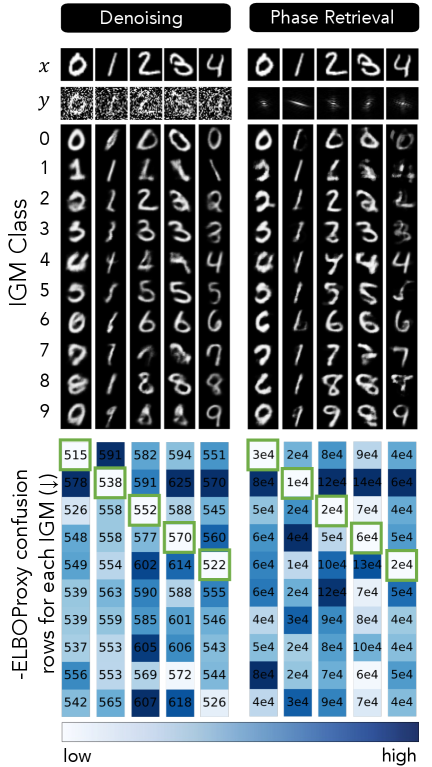
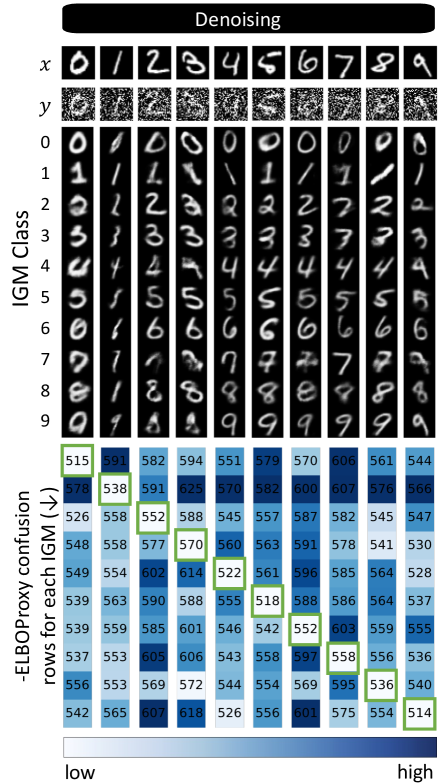
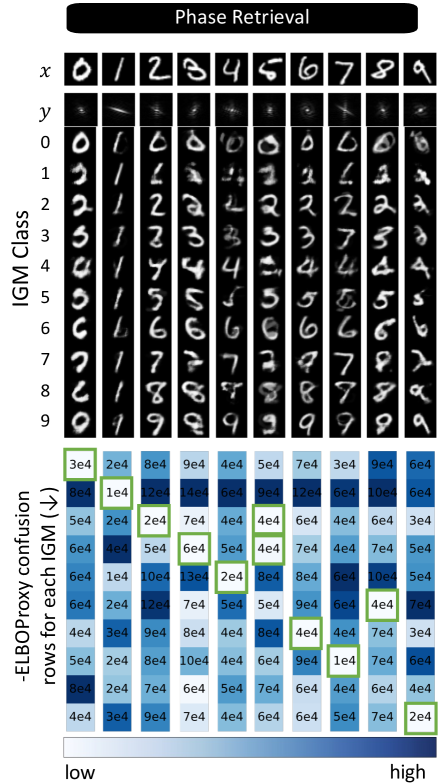
To illustrate the use of the as a model selection criterion, we conduct the following experiment that asks whether the can identify the best model from a given set of image generation models. For this experiment, we use the MNIST dataset [32] and consider two inverse problems: denoising and phase retrieval. We train a generative model on each class using the clean MNIST images directly. Hence, generates images from class via where . Then, given noisy measurements from a single image from class , we ask whether the generative model from the appropriate class would achieve the best . Each is the decoder of a VAE with a low-dimensional latent space, with no architectural constraints to ensure injectivity. For denoising, our measurements are where and . For phase retrieval, where is the Fourier transform and with .
We construct arrays for each problem, where in the -th row and -th column, we compute the negative obtained by using model to reconstruct images from class . We calculate by parameterizing with a Normalizing Flow [18] and optimizing network weights to maximize (3). The expectation in the is approximated via Monte Carlo sampling. Results from the first classes are shown in Fig. 3 and the full arrays are shown in the supplemental materials. We note that all of the correct models are chosen in both denoising and phase retrieval. We also note some interesting cases where the values are similar for certain cases, such as when recovering the or image. For example, when denoising the image, both and achieve comparable values. By carefully inspecting the noisy image of , one can see that both models are reasonable given the structure of the noise.
III-B Simultaneously solving many inverse problems
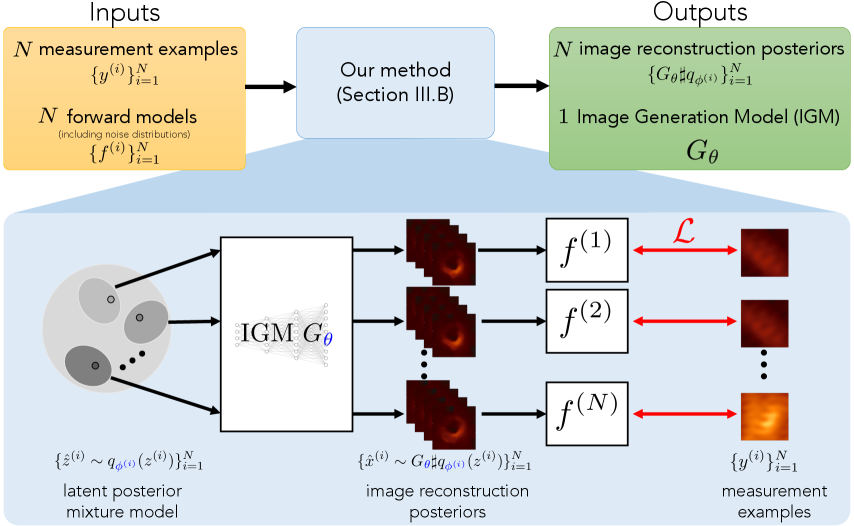
As the previous section illustrates, the provides a good criterion for choosing an appropriate IGM from noisy measurements. Here, we consider the task of directly inferring the IGM from a collection of measurement examples for , where the parameters are found by optimizing the . The key assumption we make is that common, low-dimensional structure is shared across the underlying images . We propose to find a shared generator with weights along with latent distributions that can be used to reconstruct the full posterior of each image from its corresponding measurement example . This approach is illustrated in Fig. 2. Having the generator be shared across all images helps capture their common collective structure. Each forward model corruption, however, likely induces its own complicated image posteriors. Hence, we assign each measurement example its own latent distribution to capture the differences in their posteriors. Note that because we optimize a proxy of the ELBO, the inferred distribution may not necessarily be the true image posterior, but it still captures a distribution of images that fit to the observed measurements.
Inference approach
More explicitly, given a collection of measurement examples , we jointly infer a generator and a set of variational distributions by optimizing a Monte Carlo estimate of the from Eq. (3), described by:
| (4) |
where
| (5) |
In terms of choices for , we can add additional regularization to promote particular properties of the IGM , such as having a small Lipschitz constant. Here, we consider having sparse neural network weights as a form of regularization and use dropout [49] during training to represent .
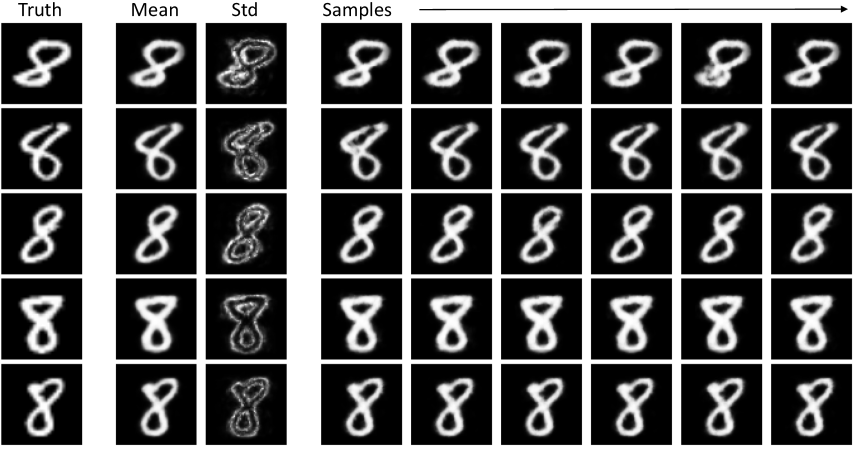
Once a generator and variational parameters have been inferred, we solve the -th inverse problem by simply sampling where or computing an average . Producing samples for each inverse problem can help visualize the range of uncertainty under the learned IGM , while the expected value of the distribution empirically provides clearer estimates with better metrics in terms of PSNR or MSE. We report PSNR outputs in our subsequent experiments and also visualize the standard deviation of our reconstructions.
IV Experimental Results
We now consider solving a set of inverse problems via the framework described in III-B. For each of these experiments, we use a multivariate Gaussian distribution to parameterize each of the posterior distributions and a Deep Decoder [24] with layers, channels in each layer, a latent size of , and a dropout of as the IGM. The multivariate Gaussian distributions are parameterized by means and covariance matrices , where with is added to the covariance matrix to help with stability of the optimization. We choose to parameterize the latent distributions using Gaussians for memory considerations. Note that the same hyperparameters are used for all experiments demonstrating our proposed method.
In our experiments, we also compare to the following baseline methods: AmbientGAN [5], Deep Image Prior (DIP) [54], and regularized maximum likelihood using total variation (TV-RML). AmbientGAN is most similar to our setup, as it constructs an IGM directly from measurement examples; however, it doesn’t aim to estimate image reconstruction posteriors, but instead aims to learn an IGM that samples from the full underlying prior. TV-RML uses explicit total variation regularization, while DIP uses an implicit convolutional neural network “prior”. As we will show, all these baseline methods require fine-tuning hyperparameters to each set of measurements in order to produce their best results. All methods can also be applied to a variety of inverse problems, making them appropriate choices as baselines.
IV-A Denoising
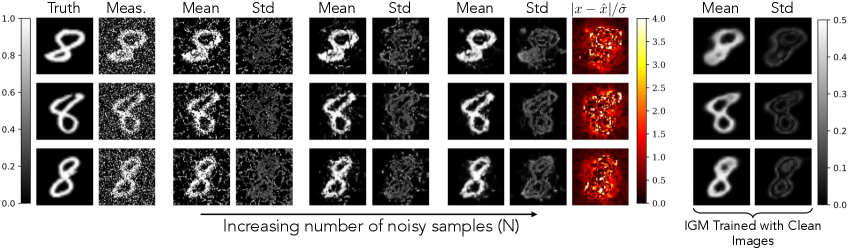
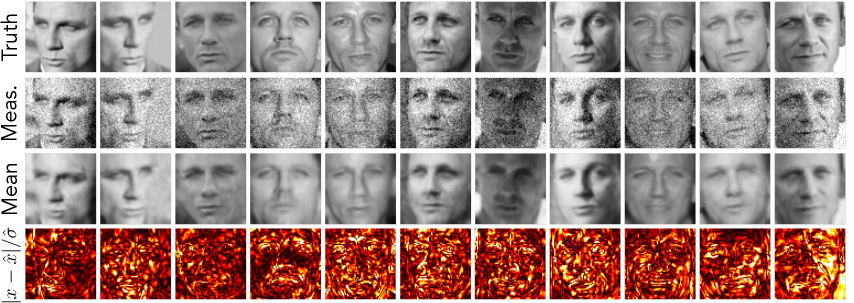
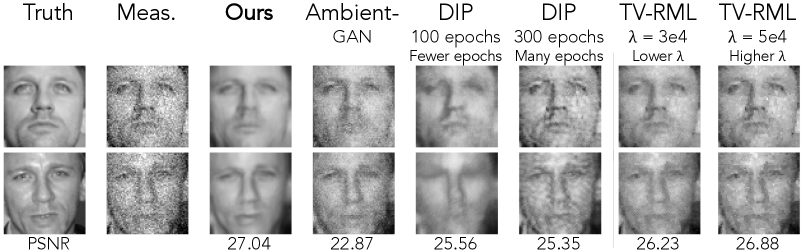
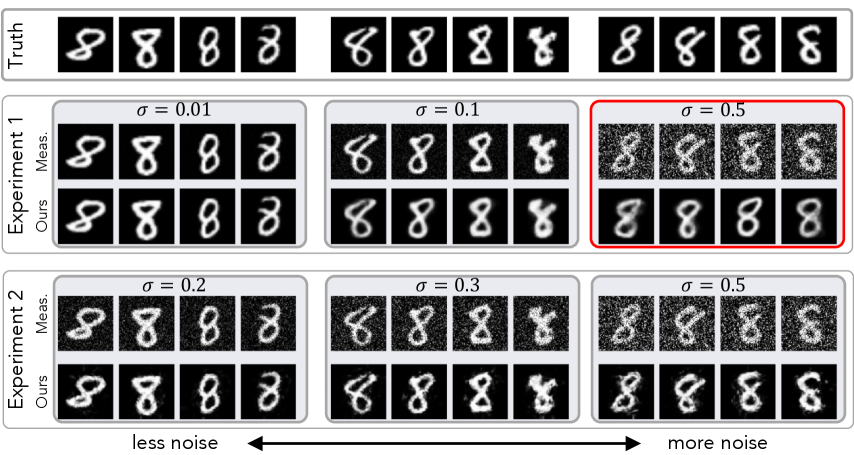
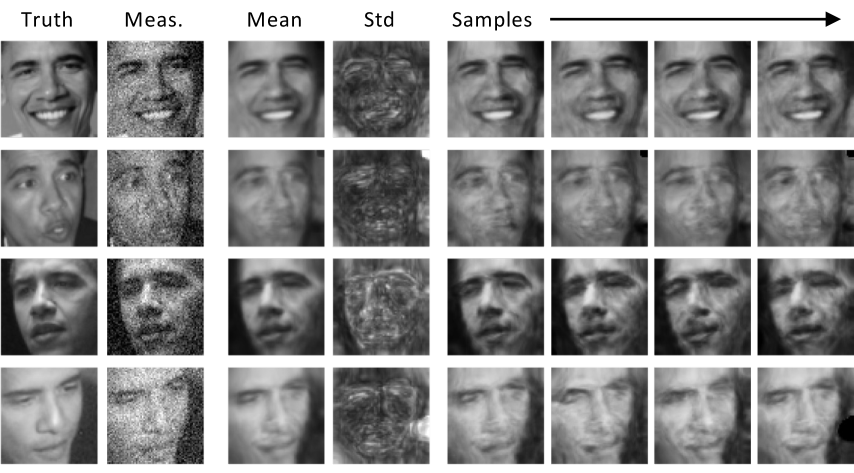
We show results on denoising a collection of noisy images of 8’s from the MNIST dataset in Fig. 4 and denoising a collection of noisy images of a single face from the PubFig [31] dataset in Fig. 5. The measurements for both datasets are defined by where with an SNR of -3 dB for the MNIST digits and an SNR of 15 dB for the faces. Our method is able to remove much of the added noise and recovers small scale features, even with only 10’s of observations. As shown in Fig. 4, the reconstructions achieved under the learned IGM improves as the number of independent observations increases. Our reconstructions also substantially outperform the baseline methods, as shown in Fig. 6. Unlike DIP, our method does not overfit and does not require early stopping. Our method does not exhibit noisy artifacts like those seen in all baselines methods, despite such methods being fine-tuned. We show quantitative comparisons in Table I.
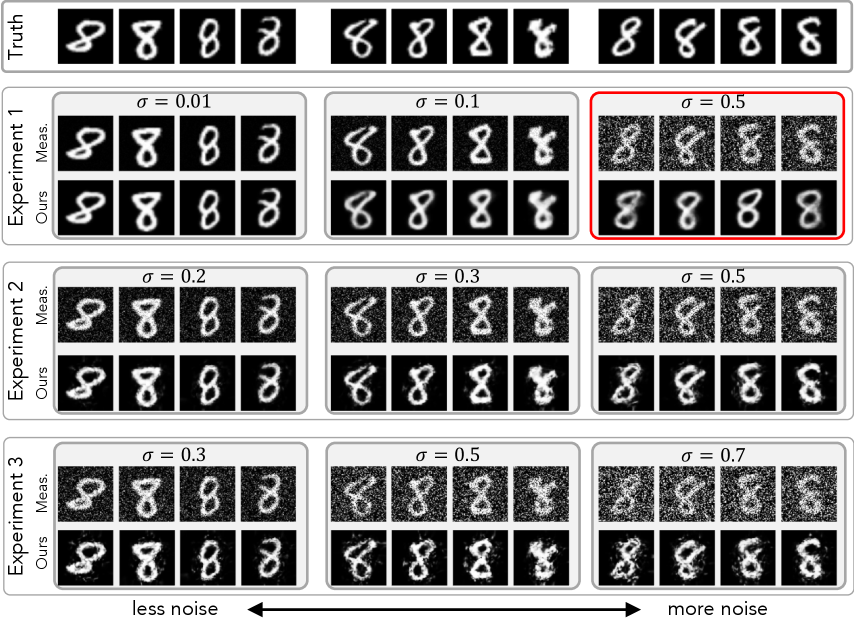
In Fig. 7 we show additional multi-noise denoising experiments where we have noisy images, which have 3 different noise levels. More formally, where and . In Experiment 1, the noise levels have a wide range, and we use standard deviations of . In Experiment 2, the noise levels are much closer together, and we use standard deviations of . When the SNRs are similar (as in Experiment 2), the reconstructions match the true underlying images well. However, when the measurements have a wide range of SNRs (i.e., Experiment 1), the reconstructions from low SNR measurements exhibit bias and poorly reconstruct the true underlying image, as shown in Fig.7. This is likely because the high SNR measurements influence the inferred IGM more strongly than the low SNR measurements. The full set of results are available in the supplemental materials.
IV-B Phase retrieval
Here we consider solving non-convex inverse problems, and demonstrate our approach on phase retrieval. Our measurements are described by where is a linear operator and . We consider two types of measurements, one where is the Fourier transform and the other when is an complex Gaussian matrix with . Since each measurement is the magnitude of complex linear measurements, there is an inherent phase ambiguity in the problem. Additionally, flipping and spatial-shifts are possible reconstructions when performing Fourier phase retrieval. Due to the severe ill-posedness of the problem, representing this complicated posterior that includes all spatial shifts is challenging. Thus, we incorporate an envelope (i.e., a centered rectangular mask) as the final layer of to encourage the reconstruction to be centered. Nonetheless, flipping and shifts are still possible within this enveloped region.
Baselines Forward model Ours AmbGAN DIP DIP TV TV Dataset fine-tuned fewer epochs many epochs lower higher celeb. A 95 27.0 22.9 25.6 25.4 26.2 26.9 celeb. B 95 26.2 19.7 24.4 25.2 25.9 26.4 MNIST 8’s 150 21.1 18.0 18.8 13.3 16.4 18.2 M87* (target) 60 29.3 25.7 29.0 28.6 24.3 25.9
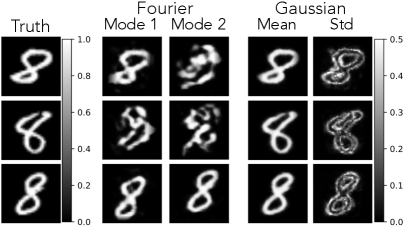
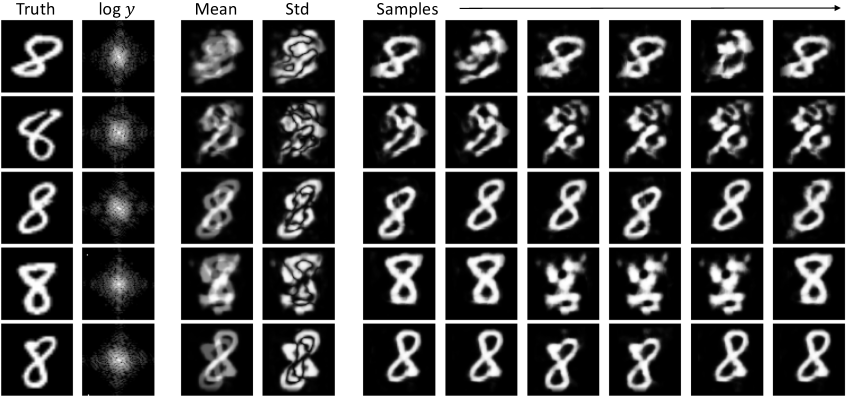
We show results from a set of noisy phase retrieval measurements from the MNIST 8’s class with a SNR of 52 dB. We consider three settings: 1) all measurements arise from a Gaussian measurement matrix, 2) all measurements arise from Fourier measurements, and 3) half of the measurements are Gaussian and the other half are Fourier. We show qualitative results for cases 1 and 2 in Fig. 8. In the Gaussian case, we note that our mean reconstructions are nearly identical to the true digits and the standard deviations exhibit uncertainty in regions we would expect (e.g., around edges). In the Fourier case, our reconstructions have features similar to the digit , but contain artifacts. These artifacts are only present in the Fourier case due to additional ambiguities, which lead to a more complex posterior [27]. We also show the average PSNR of our reconstructions for each measurement model in Table II. For more details on this experiment, please see Section XII-C of the supplemental materials.
Measurement Operator(s) Gaussian Fourier Both Gaussian 30.8 — 30.2 Fourier — 13.6 19.4
IV-C Black hole imaging
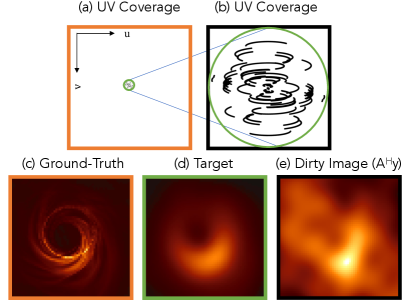
We consider a real-world inverse problem for which ground-truth data would be impossible to obtain. In particular, we consider a compressed sensing problem inspired by astronomical imaging of black holes with the Event Horizon Telescope (EHT): suppose we are given access to measurement examples of the form where is a low-rank compressed sensing matrix arising from interferometric telescope measurements and denotes noise with known properties (e.g., distributed as a zero-mean Gaussian with known covariance). The collection of images are snapshots of an evolving black hole target. This problem is ill-posed and requires the use of priors or regularizers to recover a reasonable image [13]. Moreover, it is impossible to directly acquire example images of black holes, so any pixel-level prior defined a priori will exhibit human bias. Recovering an image, or movie, of a black hole with as little human bias as possible is essential for both studying the astrophysics of black holes as well as testing fundamental physics [12, 15]. We show how our proposed method can be used to tackle this important problem. In particular, we leverage knowledge that, although the black hole evolves, it will not change drastically from minute-to-minute or day-to-day. We study two black hole targets: the black hole at the center of the Messier 87 galaxy (M87∗) and the black hole at the center of the Milky Way galaxy – Sagattarius A* (Sgr A∗).
Imaging M87∗ using the current EHT array
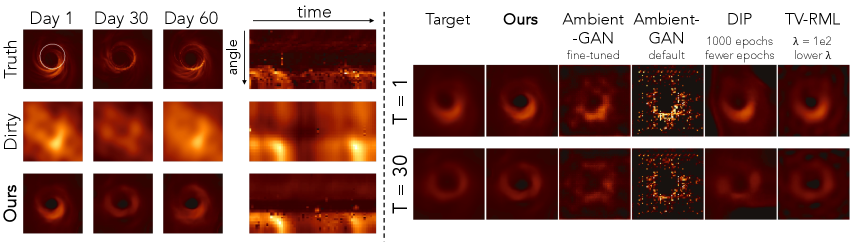
We first consider reconstructing the black hole at the center of the Messier 87 galaxy, which does not evolve noticeably within the timescale of a single day. The underlying images are from a simulated 60 frame video with a single frame for each day. We show results on frames from an evolving black hole target with a diameter of 40 microarcseconds, as was identified as the diameter of M87 according to [42, 14] in Fig. 10. In particular, the measurements are given by , where is the underlying image on day , is the forward model that represents the telescope array, which is static across different days, and the noise has a covariance of , which is a diagonal matrix with realistic variances based on the telescope properties***We leave the more challenging atmospheric noise that appears in measurements for future work.. Measurements are simulated from black hole images with a realistic flux of Jansky [57]. We also visualize a reference “target” image, which is the underlying image filtered with a low-pass filter that represents the maximum resolution achievable with the telescope array used to collect measurements – in this case the EHT array consisting of 11 telescopes (see Fig. 9 and Section IX in the supplemental materials).
As seen in Fig. 10, our method is not only able to reconstruct the large scale features of the underlying image without any aliasing artifacts, but also achieves a level of super-resolution (see Table III in the supplemental materials). Our reconstructions also achieve higher super-resolution as compared to our baselines (i.e., AmbientGAN, TV-RML, and DPI) in Fig. 10 and do not exhibit artifacts evident in the reconstructions from these baselines. The two AmbientGAN settings were qualitatively chosen to show that the final result is sensitive to the choice of hyperparameters. The default AmbientGAN parameters produce poor results, and even with fine-tuning to best fit the underlying images (i.e., cheating with knowledge of the ground-truth), the results still exhibit substantial artifacts. We outperform the baselines in terms of PSNR when compared to the target image (see Table I). Our results demonstrate that we are able to capture the varying temporal structure of the black hole, rather than just recovering a static image. It is important to note that there is no explicit temporal regularization introduced; the temporal smoothness is implicitly inferred by the constructed IGM.
Imaging Sgr A∗ from multiple forward models
The framework we introduce can also be applied to situations in which the measurements themselves are induced by different forward models. In particular, the measurements are given by an underlying image , a forward model that is specific to that observation, and noise with known properties.
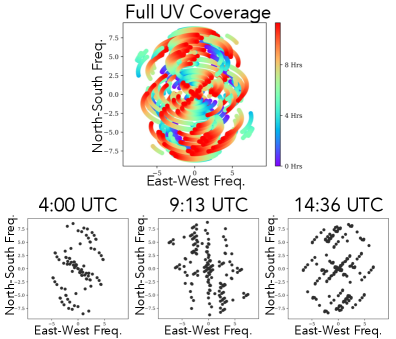
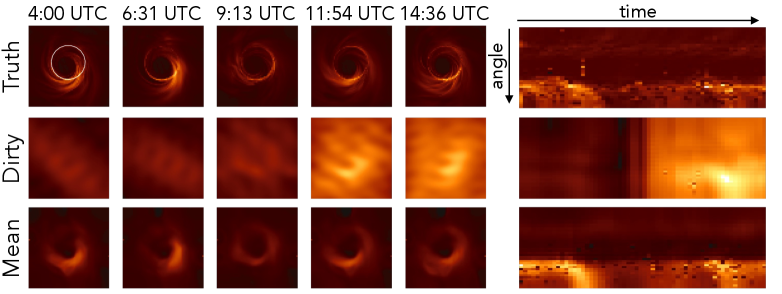
As an illustrative example, we consider the problem of reconstructing a video of the black hole at the center of the Milky Way – Sagittarius A∗ (Sgr A∗). Unlike M87∗, Sgr A∗ evolves on the order of minutes. Therefore, we can only consider that the black hole is static for only a short time when only a subset of telescopes are able to observe the black hole. This results in a different measurement forward model for each frame of the black hole “movie” [16]. In particular, the measurements are given by , where is the underlying image at time , is the forward model that incorporates the telescope configuration at that time, and is noise where is a diagonal matrix with realistic standard deviations derived from the telescopes’ physical properties. The measurement noise is consistent with a black hole with a flux of 2 Janskys. The measurement operator is illustrated in Fig. 11.
We show examples of reconstructing 60 frames of Sgr A∗ with a diameter of 50 microarcseconds using measurements simulated from a proposed future next-generation EHT (ngEHT) [43] array, which consists of 23 telescopes. These results are shown in Fig. 12. Our reconstructions remove much of the aliasing artifacts evident in the dirty images and reconstructs the primary features of the underlying image without any form of temporal regularization. These results have high fidelity especially considering that the measurements are very sparsely sampled. Although these results come from simulated measurements that do not account for all forms of noise we expect to encounter, the high-quality movie reconstructions obtained without the use of a spatio-temporal prior show great promise towards scientific discovery that could come from a future telescope array paired with our proposed reconstruction approach.
V Theory for Linear IGMs
We now introduce theoretical results on the inferred IGM for linear inverse problems. Specifically, we consider the case when the IGM is linear and the latent variational distributions are Gaussian. The goal of this section is to develop intuition for the inferred IGM in a simpler setting. While our results may not generalize to non-linear generators parameterized by deep neural networks, our results aim to provide an initial understanding on the inferred generator.
More concretely, suppose we are given measurement examples of noisy linear measurements of the form
where with and . We aim to infer with and latent distributions where , , and by minimizing the negative ELBOProxy:
| (6) |
We characterize the generator and latent parameters that are stationary points of (6). The result is proven in Section X:
Theorem 2.
Fix and let for where and has . Define the sample covariance of the measurements . Then, with probability , , , and that satisfy
for are stationary points of the objective (6) over where denotes the set of real invertible matrices. Here, denotes the matrix whose columns correspond to the top- eigenvectors of , contains the corresponding eigenvalues of , and are arbitrary orthogonal matrices. If , then for , the -th column of can be arbitrary and .
The Theorem establishes the precise form of stationary points of the objective (6). In particular, it shows that this inferred IGM performs dimensionality reduction akin to PCA [53] on the collection of measurement examples. To gain further intuition about the Theorem, in Section X-B of the supplemental materials, we analyze this result in a context where the underlying images we wish to reconstruct explicitly lie in a low-dimensional subspace. We show that, in that setting, our estimator returns an approximation of the solution found via MAP estimation, which can only be computed with complete prior knowledge of the underlying image structure. While the Theorem focused on linear IGMs, it would be interesting to theoretically analyze non-linear IGMs parameterized by deep networks. We leave this for future work.
VI Conclusion
In this work we showcased how one can solve a set of inverse problems without a pre-defined IGM (e.g., a traditional spatial image prior) by leveraging common structure present across a collection of diverse underlying images. We demonstrated that even with a small set of corrupted measurements, one can jointly solve these inverse problems by directly inferring an IGM that maximizes a proxy of the ELBO. We demonstrate our method on a number of convex and non-convex imaging problems, including the challenging problem of black hole video reconstruction from interferometric measurements. Overall, our work showcases the possibility of solving inverse problems in a completely unsupervised fashion, free from significant human bias typical of ill-posed image reconstruction. We believe our approach can aid in automatic discovery of novel structure from scientific measurements, potentially paving the way to new avenues of exploration.
References
- [1] Hirotugu Akaike. A new look at the statistical model identification. IEEE transactions on automatic control, 19(6):716–723, 1974.
- [2] Marcus Alley, Joseph Y. Cheng, William Dally, Enhao Gong, Song Hann, Morteza Mardani, John M. Pauly, Neil Thakur, Shreyas Vasanawala, Lei Xing, and Greg Zaharchuk. Deep generative adversarial networks for compressed sensing (gancs) automates mri. arXiv preprint arXiv:1706.00051, 2017.
- [3] Joshua Batson and Loic Royer. Noise2self: Blind denoising by self-supervision. In International Conference on Machine Learning, pages 524–533. PMLR, 2019.
- [4] Ashish Bora, Ajil Jalal, Eric Price, and Alexandros Dimakis. Compressed sensing using generative models. International Conference on Machine Learning (ICML), 2017.
- [5] Ashish Bora, Eric Price, and Alexandros G Dimakis. Ambientgan: Generative models from lossy measurements. In International conference on learning representations, 2018.
- [6] Harold C. Burger, Christian J. Schuler, and Stefan Harmeling. Image denoising: Can plain neural networks compete with bm3d? IEEE Conference on Computer Vision and Pattern Recognition (CVPR), 2012.
- [7] Emmanuel J. Candès and Carlos Fernandez-Granda. Towards a mathematical theory of super-resolution. Communications on Pure and Applied Mathematics, 67(6):906–956, 2013.
- [8] Emmanuel J. Candès, Justin K. Romberg, and Terence Tao. Stable signal recovery from incomplete and inaccurate measurements. Communications on Pure and Applied Mathematics, 59(8):1207–1223, 2006.
- [9] Zezhou Cheng, Matheus Gadelha, Subhransu Maji, and Daniel Sheldon. A bayesian perspective on the deep image prior. IEEE Conference on Computer Vision and Pattern Recognition (CVPR), pages 5438––5446, 2019.
- [10] Badr-Eddine Chérief-Abdellatif. Consistency of elbo maximization for model selection. Proceedings of The 1st Symposium on Advances in Approximate Bayesian Inference, 96:1–21, 2018.
- [11] Badr-Eddine Chérief-Abdellatif and Pierre Alquier. Consistency of variational bayes inference for estimation and model selection in mixtures. Electronic Journal of Statistics, 12(2):2995–3035, 2018.
- [12] The Event Horizon Telescope Collaboration. First m87 event horizon telescope results. i. the shadow of the supermassive black hole. The Astrophysical Journal Letters, 875(1):L1, Apr 2019.
- [13] The Event Horizon Telescope Collaboration. First m87 event horizon telescope results. iv. imaging the central supermassive black hole. The Astrophysical Journal Letters, 875(1):L4, 2019.
- [14] The Event Horizon Telescope Collaboration. First m87 event horizon telescope results. v. physical origin of the asymmetric ring. The Astrophysical Journal Letters, 875(1):L5, 2019.
- [15] The Event Horizon Telescope Collaboration. First sagittarius a* event horizon telescope results. i. the shadow of the supermassive black hole in the center of the milky way. The Astrophysical Journal Letters, 930(2):L12, May 2022.
- [16] The Event Horizon Telescope Collaboration. First sagittarius a* event horizon telescope results. iii. imaging of the galactic center supermassive black hole. The Astrophysical Journal Letters, 930(2):L14, 2022.
- [17] Mohammad Zalbagi Darestani and Reinhard Heckel. Accelerated mri with un-trained neural networks. IEEE Transactions of Computational Imaging, 7:724–733, 2021.
- [18] Laurent Dinh, Jascha Sohl-Dickstein, and Samy Bengio. Density estimation using real nvp. 2016.
- [19] David Donoho. For most large underdetermined systems of linear equations the minimal l1-norm solution is also the sparsest solution. Communications on Pure and Applied Mathematics, 59(6), 2006.
- [20] Laura Dyer, Andrew Parker, Keanu Paphiti, and Jeremy Sanderson. Lightsheet microscopy. Current Protocols, 2(7):e448, 2022.
- [21] Albert Fannjiang and Thomas Strohmer. The numerics of phase retrieval. Acta Numerica, 29:125 – 228, 2020.
- [22] Angela F. Gao, Oscar Leong, He Sun, and Katie L. Bouman. Image reconstruction without explicit priors. In IEEE International Conference on Acoustics, Speech, and Signal Processing (ICASSP), 2023.
- [23] Paul Hand, Oscar Leong, and Vladislav Voroninski. Phase retrieval under a generative prior. Advances in Neural Information Processing Systems (NeurIPS), 2018.
- [24] Reinhard Heckel and Paul Hand. Deep decoder: Concise image representations from untrained non-convolutional networks. International Conference on Learning Representations (ICLR), 2019.
- [25] Reinhard Heckel, Wen Huang, Paul Hand, and Vladislav Voroninski. Rate-optimal denoising with deep neural networks. Information and Inference: A Journal of the IMA, 2020.
- [26] Leonid I.Rudin, Stanley Osher, and Emad Fatemi. Nonlinear total variation based noise removal algorithms. Physica D: Nonlinear Phenomena, 60:259–268, 1992.
- [27] Kishore Jaganathan, Samet Oymak, and Babak Hassibi. Sparse phase retrieval: Convex algorithms and limitations. 2013 IEEE International Symposium on Information Theory Proceedings (ISIT), pages 1022–1026, 2013.
- [28] Maya Kabkab, Pouya Samangouei, and Rama Chellappa. Task-aware compressed sensing with generative adversarial networks. In Proceedings of the AAAI Conference on Artificial Intelligence, volume 32, 2018.
- [29] Konik Kothari, AmirEhsan Khorashadizadeh, Maarten de Hoop, and Ivan Dokmanić. Trumpets: Injective flows for inference and inverse problems. In Uncertainty in Artificial Intelligence, pages 1269–1278. PMLR, 2021.
- [30] Alexander Krull, Tim-Oliver Buchholz, and Florian Jug. Noise2void - learning denoising from single noisy images. Proceedings of the IEEE Conference on Computer Vision and Pattern Recognition, pages 2129–2137, 2019.
- [31] Neeraj Kumar, Alexander C Berg, Peter N Belhumeur, and Shree K Nayar. Attribute and simile classifiers for face verification. In 2009 IEEE 12th international conference on computer vision, pages 365–372. IEEE, 2009.
- [32] Yann LeCun, Leon Bottou, Yoshua Bengio, and Patrick Haffner. Gradient-based learning applied to document recognition. Proceedings of the IEEE, 86(11):2278––2324, 1998.
- [33] Jaakko Lehtinen, Jacob Munkberg, Jon Hasselgren, Samuli Laine, Tero Karras, Miika Aittala, and Timo Aila. Noise2noise: Learning image restoration without clean data. Proceedings of the 35th International Conference on Machine Learning, 80:2965–2974, 2018.
- [34] Anat Levin, Yair Weiss, Fredo Durand, and William T. Freeman. Understanding and evaluating blind deconvolution algorithms. IEEE Conference on Computer Vision and Pattern Recognition (CVPR), pages 1964–1971, 2009.
- [35] Xiaodong Li, Shuyang Ling, Thomas Strohmer, and Ke Wei. Rapid, robust, and reliable blind deconvolution via nonconvex optimization. arXiv preprint, arXiv:1606.04933, 2016.
- [36] Jiaming Liu, Yu Sun, Cihat Eldeniz, Weijie Gan, Hongyu An, and Ulugbek S Kamilov. Rare: Image reconstruction using deep priors learned without groundtruth. IEEE Journal of Selected Topics in Signal Processing, 14(6):1088–1099, 2020.
- [37] Stéphane Mallat. A wavelet tour of signal processing. Elsevier, 1999.
- [38] Ray Mendoza, Minh Nguyen, Judith Weng Zhu, Vincent Dumont, Talita Perciano, Juliane Mueller, and Vidya Ganapati. A self-supervised approach to reconstruction in sparse x-ray computed tomography. In NeurIPS Machine Learning and the Physical Sciences Workshop, 2022.
- [39] Sachit Menon, Alex Damian, McCourt Hu, Nikhil Ravi, and Cynthia Rudin. Pulse: Self-supervised photo upsampling via latent space exploration of generative models. In The IEEE Conference on Computer Vision and Pattern Recognition (CVPR), June 2020.
- [40] Jeremy Miles. R squared, adjusted r squared. Encyclopedia of Statistics in Behavioral Science, 2005.
- [41] Andrew Olsen, Yolanda Hu, and Vidya Ganapati. Data-driven computational imaging for scientific discovery. In NeurIPS AI for Science Workshop, 2022.
- [42] Oliver Porth, Koushik Chatterjee, Ramesh Narayan, Charles F Gammie, Yosuke Mizuno, Peter Anninos, John G Baker, Matteo Bugli, Chi-kwan Chan, Jordy Davelaar, et al. The event horizon general relativistic magnetohydrodynamic code comparison project. The Astrophysical Journal Supplement Series, 243(2):26, 2019.
- [43] Alexander W Raymond, Daniel Palumbo, Scott N Paine, Lindy Blackburn, Rodrigo Córdova Rosado, Sheperd S Doeleman, Joseph R Farah, Michael D Johnson, Freek Roelofs, Remo PJ Tilanus, et al. Evaluation of new submillimeter vlbi sites for the event horizon telescope. The Astrophysical Journal Supplement Series, 253(1):5, 2021.
- [44] Yaniv Romano, Michael Elad, and Peyman Milanfar. The little engine that could: Regularization by denoising (red). SIAM Journal on Imaging Sciences, 10(4):1804–1844, 2017.
- [45] Olaf Ronneberger, Philipp Fischer, and Thomas Brox. U-net: Convolutional networks for biomedical image segmentation. Medical Image Computing and Computer-Assisted Intervention – MICCAI 2015, 9351:234–241, 2015.
- [46] Gideon E. Schwarz. Estimating the dimension of a model. Annals of Statistics, 6(2):461–464, 1978.
- [47] Fahad Shamshad and Ali Ahmed. Compressed sensing-based robust phase retrieval via deep generative priors. IEEE Sensors Journal, 21(2):2286 – 2298, 2017.
- [48] Yang Song, Liyue Shen, Lei Xing, and Stefano Ermon. Solving inverse problems in medical imaging with score-based generative models. International Conference on Learning Representations (ICLR), 2022.
- [49] Nitish Srivastava, Geoffrey Hinton, Alex Krizhevsky, Ilya Sutskever, and Ruslan Salakhutdinov. Dropout: a simple way to prevent neural networks from overfitting. The journal of machine learning research, 15(1):1929–1958, 2014.
- [50] Mervyn Stone. Cross-validatory choice and assessment of statistical predictions. Journal of the royal statistical society: Series B (Methodological), 36(2):111–133, 1974.
- [51] He Sun, Katherine L. Bouman, Paul Tiede, Jason J. Wang, Sarah Blunt, and Dimitri Mawet. alpha-deep probabilistic inference (alpha-dpi): efficient uncertainty quantification from exoplanet astrometry to black hole feature extraction. The Astrophysical Journal, 932(2):99, 2022.
- [52] Chenyang Tao, Liqun Chen, Ruiyi Zhang, Ricardo Henao, and Lawrence Carin. Variational inference and model selection with generalized evidence bounds. International Conference on Machine Learning (ICML), 80:893–902, 2018.
- [53] Michael E. Tipping and Christopher M. Bishop. Probabilistic principal component analys. Journal of the Royal Statistical Society: Series B (Statistical Methodology), 61(3):611––622, 1999.
- [54] Dmitry Ulyanov, Andrea Vedaldi, and Victor Lempitsky. Deep image prior. In Proceedings of the IEEE conference on computer vision and pattern recognition, pages 9446–9454, 2018.
- [55] Dmitry Ulyanov, Andrea Vedaldi, and Victor Lempitsky. Deep image prior. International Journal of Computer Vision, 128:1867–1888, 2020.
- [56] Singanallur V Venkatakrishnan, Charles A Bouman, and Brendt Wohlberg. Plug-and-play priors for model based reconstruction. In 2013 IEEE Global Conference on Signal and Information Processing, pages 945–948. IEEE, 2013.
- [57] George N. Wong, Ben S. Prather, Vedant Dhruv, Benjamin R. Ryan, Monika Mościbrodzka, Chi-kwan Chan, Abhishek V. Joshi, Ricardo Yarza, Angelo Ricarte, Hotaka Shiokawa, Joshua C. Dolence, Scott C. Noble, Jonathan C. McKinney, and Charles F. Gammie. PATOKA: Simulating Electromagnetic Observables of Black Hole Accretion. The Astrophysical Journal Supplement Series, 259(2):64, April 2022.
VII Experimental details
Model selection
We parameterize the latent variational distributions with Normalizing Flows . In particular, suppose our latent variables where . Then,
where denotes the likelihood of the base distribution of , which in this case is a Gaussian. For our prior on given , we use an isotropic Gaussian prior. Then the equation becomes
Note that the expectation over is constant with respect to the parameters , so we only optimize the remaining terms.
VIII Inference Details
Optimization details for model selection
Given a generator for a class , we optimized the with respect to the parameters of the Normalizing Flow. For denoising, we optimized for epochs with Adam \citePhyskingma2014adamSupp and a learning rate of and set . For phase retrieval, we optimized for epochs with Adam and a learning rate of and set . The entire experiment took approximately hours for denoising/phase retrieval, respectively, on a single NVIDIA V100 GPU. When optimizing the flow for a particular generator , we record the parameters with the best value. This is the final value recorded in the figure. To generate the mean and standard deviation, we used samples.
Network details
The generator corresponds to the decoder part of a VAE \citePhysKingmaWelling14Supp trained on the training set of class of MNIST. We used a convolutional architecture, where the encoder and decoder architecture contained convolutional layers. There are also linear, fully-connected layers in between to learn the latent representation, which had dimension The Normalizing Flows used the RealNVP \citePhysdinh2016densitySupp architecture. In both problems, the network had affine coupling layers with linear layers, Leaky ReLU activation functions, and batch normalization. After each affine-coupling block, the dimensions were randomly permuted.
VIII-A Inferring the IGM
Variational distribution
We parameterize the posterior using Gaussian distributions due to memory constraints; the memory of the whole setup with Normalizing Flows using 75 images is around 5 times larger than the setup using a Gaussian variational family. However, the Gaussian variational family is likely not as good of a variational distribution, so there will be a wider margin between and the ELBO. Additionally, the Gaussian variational family will not be as good at capturing multimodal distributions. Note that we do not notice overfitting so there is no need for early stopping.
IGM network details
We use a Deep Decoder \citePhysHH2018Supp generator architecture as the IGM with a dropout of . The Deep Decoder has 6 layers with 150 channels each, and has a latent size of 40. There is a sigmoid activation as the final layer of the generator.
Optimization details
We train for 99,000 epochs using the Adam \citePhyskingma2014adamSupp optimizer with a learning rate of , which takes around 2 hours for 5 images, 17 hours for 75 images, and 33 hours for 150 images on a single NVIDIA RTX A6000 GPU. The memory usage is around 11000MiB for 5 images, 24000MiB for 75 images, and 39000MiB for 150 images. We use a batch size of 20 samples per measurement , and we perform batch gradient descent based on all measurements .
IX Event Horizon Telescope Array
IX-A Array used for the M87∗ results
| NAME | X | Y | Z |
|---|---|---|---|
| PDB | 4523998 | 468045 | 4460310 |
| PV | 5088968 | -301682 | 3825016 |
| SMT | -1828796 | -5054407 | 3427865 |
| SMA | -5464523 | -2493147 | 2150612 |
| LMT | -768714 | -5988542 | 2063276 |
| ALMA | 2225061 | -5440057 | -2481681 |
| APEX | 2225040 | -5441198 | -2479303 |
| JCMT | -5464585 | -2493001 | 2150654 |
| CARMA | -2397431 | -4482019 | 3843524 |
| KP | -1995679 | -5037318 | 3357328 |
| GLT | 1500692 | -1191735 | 6066409 |
IX-B Array used for the Sgr A∗ results
| NAME | X | Y | Z |
|---|---|---|---|
| ALMA | 2225061 | -5440057 | -2481681 |
| APEX | 2225040 | -5441198 | -2479303 |
| GLT | 1500692 | -1191735 | 6066409 |
| JCMT | -5464585 | -2493001 | 2150654 |
| KP | -1995679 | -5037318 | 3357328 |
| LMT | -768714 | -5988542 | 2063276 |
| SMA | -5464523 | -2493147 | 2150612 |
| SMT | -1828796 | -5054407 | 3427865 |
| BAJA | -2352576 | -4940331 | 3271508 |
| BAR | -2363000 | -4445000 | 3907000 |
| CAT | 1569000 | -4559000 | -4163000 |
| CNI | 5311000 | -1725000 | 3075000 |
| GAM | 5648000 | 1619000 | -2477000 |
| GARS | 1538000 | -2462000 | -5659000 |
| HAY | 1521000 | -4417000 | 4327000 |
| NZ | -4540000 | 719000 | -4409000 |
| OVRO | -2409598 | -4478348 | 3838607 |
| SGO | 1832000 | -5034000 | -3455000 |
| CAS | 1373000 | -3399000 | -5201000 |
| LLA | 2325338 | -5341460 | -2599661 |
| PIKE | -1285000 | -4797000 | 3994000 |
| PV | 5088968 | -301682 | 3825016 |
X Supplemental Theoretical Results
We present proofs of some of the theoretical results that appeared in the main body of the paper, along with new results that were not discussed. Throughout the proofs, we let , , and denote the Euclidean norm for vectors, the spectral norm for matrices, and the Frobenius norm for matrices, respectively. For a matrix , let and denote the -th singular value and eigenvalue, respectively (ordered in decreasing order). Let denote the identity matrix. We may use for simplicity when the size of the matrix is clear from context. To avoid cumbersome notation, we sometimes use the shorthand notation for .
X-A Proof of Theorem 2
We first focus on proving Theorem 2. To show this, we first establish that the loss can be evaluated in closed-form:
Proposition 2.
Fix and suppose for where . Then the loss in (6) can be written as
Proof of Proposition 2.
Since the loss is separable in and expectation is linear, we can consider computing the loss for a single . Dropping the indices for notational simplicity, consider a fixed where . We aim to calculate
where is Gaussian with variance , is isotropic Gaussian, and . Note that is equivalent to for . We can calculate the individual terms in the loss as follows. We first collect some useful results, whose proofs are deferred until after this proof is complete:
Lemma 1.
For any matrix , we have where . Moreover, if is invertible, then .
Now, for the first term, since the noise is Gaussian with variance , it is equal to
where we used the first part of Lemma 1 in the third equality. For the prior term, we can calculate using Lemma 1 again
Finally, we can calculate the entropy term as
where we used the second half of Lemma 1 in the last equality and in the last equality. Adding the terms achieves the desired result. ∎
Proof of Lemma 1.
For the first claim, let denote the singular value decomposition of with and square and unitary. Then by the rotational invariance of the Gaussian distribution and the -norm, we have
For the second claim, recall that where is the Hilbert-Schmidt inner product for matrices. Using linearity of the expectation and the cyclic property of the trace operator, we get
∎
We now prove Theorem 2. Our proof essentially computes the stationary conditions of the loss and computes the first-order critical points directly.
Proof of Theorem 2.
Using standard matrix calculus, the gradient of the objective with respect to each parameter is given by
For a fixed , we can directly compute which and satisfy the stationary equations and :
where is an arbitrary orthogonal matrix.
We now calculate, given such and , which satisfies the condition . For notational simplicity, let . Plugging in and into the stationary condition , this equation reads
Since has rank , is invertible, so we can multiply both sides of the equation on the left by and the right by to obtain
| (7) |
Now, consider the SVD of where and are orthogonal and is rectangular with non-zero diagonal submatrix containing the singular values of denoted by . First, observe that
This implies that where
Note that for , is invertible. Hence, our stationary equation (7) reads
Using the orthogonality of and and invertibility of , we can further simplify the above equation to
Now, suppose . Then we have that the -th column of , denoted , satisfies
That is, is an eigenvector of with eigenvalue Observe that this equation is satisfied if and only if . Since singular values are non-negative, we must have Note that if , then can be arbitrary. Thus, we obtain that in order for to satisfy the stationary condition, it must satisfy
where contains the top- eigenvectors of , is a diagonal matrix whose -th entry is with corresponding eigenvector and otherwise, and is an arbitrary orthogonal matrix.
∎
X-B Application: Denoising Data From a Subspace
In order to gain further intuition about Theorem 2, it will be useful to consider an example where the data explicitly lies in a low-dimensional subspace. We will then compare our inferred estimator with an estimator that has access to complete prior knowledge about the data.
Consider the denoising problem and suppose that each ground-truth image is drawn at random from a -dimensional subspace as follows: where and . If we had access to the ground-truth generating matrix and knew the underlying distribution in the latent space , then one could denoise the -th image by returning the following MAP estimate in the range of :
Note that this is the mean of the posterior . Now, to compare solutions, observe that our (mean) estimator given by Theorem 2 is
Recall that contains the top eigenvectors and eigenvalues of , the sample covariance of the measurements. In the case that our data , note that for sufficiently many examples , the sample covariance is close to its mean . That is, for large ,
To see this more concretely, let denote the SVD of . Then where has in the first diagonal entries and in the remaining entries. So in the limit of increasing data, estimates the top- eigenvectors of , which are precisely the top- principal components of . Moreover, the singular values of are where . As data increases, so that . Thus the singular values of also approach those of .
A natural question to consider is how large the number of examples would need to be in order for such an approximation to hold. Ideally, this approximation would hold as long as the number of examples scales like the intrinsic dimensionality of the underlying images. For example, the following result shows that in the noiseless case, this approximation holds as long as the number of examples scales like , the dimension of the subspace. The proof follows from standard matrix concentration bounds, e.g., Theorem 4.6.1 in \citePhysVershyninHDPSupp.
Proposition 3.
Fix and let where for . Then, for any , there exists positive absolute constants and such that the following holds: if , then with probability the sample covariance obeys
Hence, in the case of data lying explicitly in a low-dimensional subspace, our estimator returns an approximation of the solution found via MAP estimation, which can only be computed with complete prior knowledge of the underlying image structure. In contrast, our estimator infers this subspace from measurement information only and its performance improves as the number of examples increases. The approximation quality of the estimator is intimately related to the number of examples and the intrinsic dimensionality of the images, which we show can be quantified in simple settings. While our main result focused on IGMs inferred with linear models, it is an interesting future direction to theoretically understand properties of non-linear IGMs given by deep networks and what can be said for more complicated forward models. We leave this for future work.
X-C Additional Theoretical Results
We can further analyze properties of the model found by minimizing from Theorem 2. In particular, we can characterize specific properties of the inferred mean as a function of the amount of noise in our measurements and a fixed IGM . Specifically, given measurements and an IGM , recall that the inferred mean computed in Theorem 2 is given by
We will give an explicit form for as the amount of noise goes to and show that, in the case our IGM is correct ( for some ground-truth ), the mean recovers the ideal latent code with vanishing noise.
Proposition 4.
Suppose and with . Let where and for . Then, with probability , for any , the estimator for defined above satisfies
In the special case that and , then
Moreover, if , then we get that the following error bound holds for all with probability at least for some positive absolute constant :
Proof.
For notational simplicity, set . Then
where we note that any can be written as where . Observe that
since for . This simplifies to
To compute the limit of the expression above, we recall that the pseudoinverse of a matrix is a limit of the form
Note that this quantity is defined even if the inverses of or exist. Applying this to , we observe that
and
Combining the above two limits gives as claimed.
For the special case, since has , the pseudoinverse of is given by . Applying this to , we observe that
Now, for the error bound, we note that for , we have by the triangle inequality,
so we bound each term separately. Recall that we have shown . For the first term, observe that
Let denote the singular value decomposition of . Then . This implies that
Moreover, since is orthogonal, we have that
Thus, for , we have that
Thus, we conclude by rotational invariance of the spectral norm, we obtain
Recall that is a diagonal matrix containing the singular values of . Let denote the -th singular value of for . Then by direct calculation, we have that
Taking the limit as , we obtain
This additionally shows that for any ,
Let be the event that . By a single-tailed variant of Corollary 5.17 in \citePhysVershyninHDPSupp, we have for some absolute constant . Thus, with the same probability, we have that the following bound holds:
For the term , note that we have
where is the spectral norm. Assuming , we can apply Theorem 4.1 in \citePhysWedin1973 to bound
Combining this bound with the previous equation yields the desired inequality. ∎
X-D Further Discussion of
In Section III-A, we showed that the is equal to the for injective or invertible generators with approximate posteriors induced by . While this equality may not hold for non-injective networks , we expect this proxy to be a reasonable estimate for the ELBO via the following heuristic argument. Consider the distribution convolved with isotropic Gaussian noise: where for . If , then for some . For any small , observe that the likelihood for such an can decomposed into two terms:
For smooth generators and sufficiently small, we would expect for so that the density is constant in a neighborhood of , making the first term for some constant . Moreover, if is of sufficiently high likelihood, we would expect the second term to be negligible for so that (up to a constant).
XI Full Model Selection Results
In this section, we expand upon the model selection results using the negative in Section III-A in the main text. The experimental setup is the same, where we aim to select a generative model for a class of MNIST in two different inverse problems: denoising and phase retrieval. The full array of negative values for denoising is given in Fig. 13 and for phase retrieval in Fig. 14.
XII Additional results
In this section, we expand upon the results for inferring the IGM using the methods described in Section III-B of the main text.

XII-A Ablations
In Fig. 15, we show an ablation test to validate the usage of dropout. Although the PSNR is higher when we do not have dropout, there are noticeable artifacts from the generative architecture in the reconstructions.


XII-B Denoising
In Fig. 5 of the main body, we showed results for denoising 95 images of celebrity A. We include additional visualizations of the posterior by showing samples from multiple posteriors in Fig. 18, which are generated from the IGM trained as shown in Fig. 5 in the main body. We show additional results on denoising 95 images of celebrity face B in Fig. 16 along with samples from the posterior in Fig. 17. In both cases, our reconstructions are much less noisy than the measurements and sharpen the primary facial features.
XII-C Phase Retrieval
We show additional results from phase retrieval with 150 images of MNIST 8’s in Fig. 19 and Fig. 20. The examples shown in Fig. 19 are from the Fourier phase retrieval measurements whereas the ones in Fig. 20 are from Gaussian phase retrieval measurements. These are in addition to those shown in Fig. 8 in the main text. Note that the simple, unimodal Gaussian variational distribution is not expressive enough to capture the multimodal structure of the true posterior in the Fourier phase retrieval problem.
For Table II in the main body, we calculated the PSNRs for each measurement model in the following way: for each underlying image, we generated samples from the generator and latent variational distribution and used cross-correlation in the frequency domain to find the most plausible shift from our reconstruction to the underlying image. After shifting the image, we calculated the PSNR to the underlying image. We then took the best PSNR amongst all samples and took the average across all image examples.
Blur size 0 as 5 as 10 as 15 as 20 as 25 as 30 as 35 as PSNR () 26.8 30.6 33.0 32.4 30.7 29.3 28.1 27.3 NCC () 0.922 0.971 0.984 0.978 0.961 0.941 0.920 0.901
XII-D Multiple Forward Models
XIII IGM as a Generator
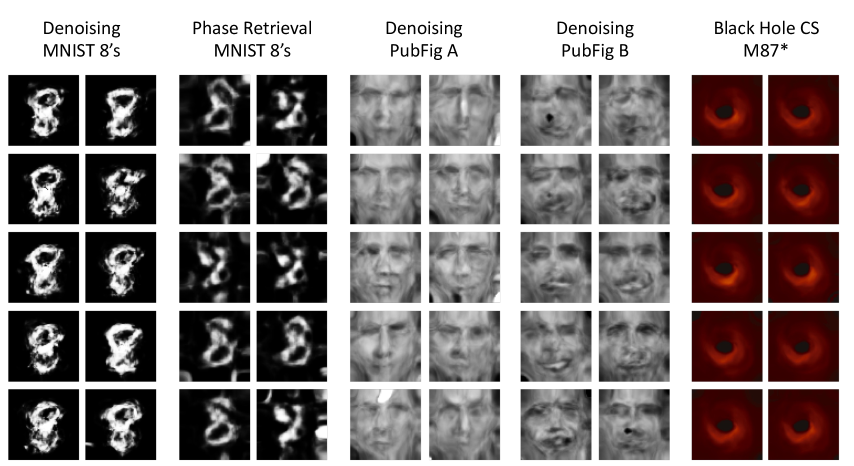
While the goal of our method is to improve performance in solving the underlying inverse problem, we can inspect what the inferred IGM has learned by generating samples. We show samples from different inferred IGMs in Fig. 22 for a variety of datasets and inverse problems. From left to right: IGM from denoising MNIST 8’s (Fig. 4 from the main body), IGM inferred from phase retrieval measurements of MNIST 8’s, IGM from denoising celebrity face A (Fig. 5 from the main body), IGM from denoising celebrity face B (Fig. 16), and IGM from video reconstruction of a black hole from the black hole compressed sensing problem (Fig. 10 from the main body).
plain\bibliographyPhyssupp.bib