2024/04/28 \Accepted2024/08/11
quasars: individual (eFEDS J082826.9–013911) — quasars: supermassive black holes — infrared: galaxies
Discovery of a hyperluminous quasar at = 1.62 with Eddington ratio 3 in the eFEDS field confirmed by KOOLS-IFU on Seimei Telescope
Abstract
We report the discovery of a hyperluminous type 1 quasar (eFEDS J082826.9–013911; eFEDSJ0828–0139) at = 1.622 with a super-Eddington ratio (). We perform the optical spectroscopic observations with KOOLS-IFU on the Seimei Telescope. The black hole mass () based on the single-epoch method with Mg ii 2798 is estimated to be . To measure the precise infrared luminosity (), we obtain submillimeter data taken by SCUBA-2 on JCMT and conduct the spectral energy distribution analysis with X-ray to submillimeter data. We find that of eFEDSJ0828–0139 is , confirming the existence of a hypeluminous infrared galaxy (HyLIRG). is estimated to be , making it one of the quasars with the highest BH mass accretion rate at cosmic noon.
1 Introduction
It is widely accepted that almost all massive galaxies contain supermassive black holes (SMBHs) with a BH mass () of 105-10 at the galaxy center and that their masses are strongly correlated with the mass of the spheroidal component of galaxies (e.g., [Magorrian et al. (1998), Ferrarese & Merritt (2000), Marconi & Hunt (2003), Kormendy & Ho (2013), McConnell & Ma (2013)]). This suggests that the formation of SMBHs is closely related to the formation of galaxies, manifesting their co-evolution with host galaxies. However, the understanding of the co-evolution mechanism between the two, which differ by 9–10 orders of magnitude on the physical scale, has not been observationally constrained.
To address this issue, we focus on hyperluminous infrared galaxies (HyLIRGs) with an infrared (IR) luminosity () of (Rowan-Robinson, 2000), most IR emission comes from hot dust heated by active galactic nuclei (AGNs) (e.g., Toba et al. (2015); Symeonidis & Page (2018)). According to the galaxy and SMBH growth scenarios resulting from galaxy mergers expected from numerical simulations, HyLIRGs “theoretically” correspond to the most interesting phases in which the growth rates of galaxies and SMBH peak (e.g., Narayanan et al. (2010); Blecha et al. (2018); Yutani et al. (2022)). Therefore, HyLIRGs are expected to serve as a crucial laboratory for probing the growth phase of co-evolution. However, AGN and host properties in HyLIRGs have still been poorly understood “observationally” because the number density of HyLIRGs is very small, and there have not been extensive multi-wavelength observations for them. To overcome this situation, deep and wide-field observation, particularly with X-ray data, is invaluable for uncovering the AGN properties of a spatially rare population, HyLIRGs, although X-ray observations of HyLIRGs are still limited (e.g., Wilman et al. (2003); Hlavacek-Larrondo et al. (2017); Ricci et al. (2017); Toba et al. (2020a, 2021b)).
Observed Properties of eFEDSJ08280139.
eFEDS J082826.9013911
ID_SRC (Brunner et al., 2022)
14050
SDSS ObjID
1237655176541241479
R.A. (LS8) [J2000.0]
08:28:27.145
Decl. (LS8) [J2000.0]
01:39:12.18
Redshift ()
1.6224 0.0007
eROSITA [mJy]
eROSITA [mJy]
GALEX FUV [mJy]
GALEX NUV [mJy]
SDSS -band [mJy]
SDSS -band [mJy]
SDSS -band [mJy]
SDSS -band [mJy]
SDSS -band [mJy]
UKIDSS -band [mJy]
UKIDSS -band [mJy]
UKIDSS -band [mJy]
UKIDSS -band [mJy]
WISE 3.4 m [mJy]
WISE 4.6 m [mJy]
2.88 0.12
WISE 12 m [mJy]
3.30 0.16
WISE 22 m [mJy]
11.2 1.29
AKARI 65 m [Jy]
∗*∗*footnotemark:
AKARI 90 m [Jy]
∗*∗*footnotemark:
AKARI 140 m [Jy]
∗*∗*footnotemark:
AKARI 160 m [Jy]
∗*∗*footnotemark:
SCUBA-2/JCMT 450 m [mJy]
∗*∗*footnotemark:
SCUBA-2/JCMT 850 m [mJy]
∗*∗*footnotemark:
(1.3 0.4)
[]
(3.9 2.0)
SFR [ yr-1]
(1.3 0.5)
[]
(6.8 1.8)
[erg s-1]
(2.9 0.1)
[]
(6.2 1.2)
{tabnote}
The SDSS ObjID is valid for SDSS Data Release 8 or later. All the flux densities from X-ray (eROSITA) to mid-IR (WISE) are corrected for Galactic extinction.
∗*∗*footnotemark: 3 upper limits.
The advent of the eROSITA X-ray satellite (Merloni et al., 2012; Predehl et al., 2021) has enabled us to systematically investigate HyLIRGs from an AGN point of view because X-ray radiation is sensitive to finding AGNs. In this paper, we report the discovery of a hyperluminous quasar, eFEDS J082826.9013911 (hereafter, eFEDSJ0828–0139), at = 1.622 with a supper-Eddington ratio of . Table 1 summarizes complete information, including photometry on this object and its physical properties obtained in this work. This is confirmed by (i) optical spectroscopic observations with the Kyoto Okayama Optical Low-dispersion Spectrograph with optical fiber IFU (KOOLS-IFU: Yoshida (2005); Matsubayashi et al. (2019)) on the Seimei Telescope (Kurita et al., 2020), and (ii) multi-wavelength data analysis from X-ray to submillimeter. In particular, because IFU data mitigate slit-loss of flux, unlike single-fiber or -slit spectroscopy, our KOOLS-IFU observation benefits not just extended sources like nearby galaxies (e.g., Toba et al. (2022a)) but also point sources like AGNs (e.g., Hoshi et al. (2024)).
The remainder of this paper is structured as follows. We describe target selection and follow-up observations using optical spectroscopy and submillimeter imaging in section 2. The derived AGN and host properties with their potential uncertainties and the characterization of eFEDSJ0828–0139 are presented in section 3. We summarize the results of this work in section 4. This work assumes a flat Universe with = 70 km s-1 Mpc-1, = 0.3, and = 0.7.
2 Data and analysis
2.1 Sample selection
The target (eFEDSJ0828–0139) was selected from the HyLIRG candidate sample provided by Toba et al. (2022b). A full description of HyLIRG candidate selection is presented by Y. Toba et al. (in preparation). Hence, we present a summary. Toba et al. (2022b) performed the spectral energy distribution (SED) analysis for Wide-field Infrared Survey Explorer (WISE: Wright et al. (2010)) 22 m-selected sources in the eROSITA Final Equatorial Depth Survey (eFEDS: Brunner et al. (2022)), According to their , 150 HyLIRG candidates were left, more than half of which have spectroscopic redshift () through the follow-up campaign, such as the Sloan Digital Sky Survey (SDSS; York et al. (2000)) V/eFRDS observations (Almeida et al., 2023).
Our target is the brightest source in the optical (-mag = 16.78) among our HyLIRG candidate sample with photometric redshift (). eFEDSJ0828–0139 is classified as an unobscured AGN (i.e., quasar) with a hydrogen column density of cm-2 through an eROSITA spectral analysis (Liu et al., 2022). This object has also been selected as an AGN/quasar candidate from a multi-wavelength photometric perspective, such as WISE (Secrest et al., 2015; Assef et al., 2018) and Gaia (Bailer-Jones et al., 2019; Wu et al., 2023). Its is estimated by some studies, for instance, (Richards et al., 2015), (Duncan, 2022) and (Salvato et al., 2022), indicating a large redshift uncertainty.
2.2 Observations and data reduction
2.2.1 KOOLS-IFU on Seimei telescope
To measure and BH properties, we observed eFEDSJ0828–0139 with the KOOLS-IFU on the Seimei Telescope in 2023 (PI: Y.Toba with proposal IDs = 23A-N-CN01 and 23B-N-CN07). The Seimei Telescope is a 3.8-meter diameter optical-IR alt-azimuth mount telescope located at Okayama Observatory, Kyoto University, Okayama Prefecture in Japan, where the typical seeing on this site is 1.2\arcsec–1.4\arcsec. The KOOLS-IFU comprises 117 fibers with a total field of view (FoV) of 8.4\arcsec111The configuration of KOOLS-IFU (such as number of fibers) was updated in October 2020.. We used the VPH-blue222http://www.o.kwasan.kyoto-u.ac.jp/inst/p-kools/performance/ among four grisms equipped with KOOLS-IFU. The wavelength coverage is 4100–8900 Å and the spectral resolution () is approximately 500. The observational log is summarized in Table 2.2.1. The total integration time is approximately 4.3 hours.
Observation log in 2023A and 2023B semester. Observing date Grism Exposure time (s) Standard star Jan. 25, 2023 VPH-blue 7200 HR1544 Jan. 27, 2023 VPH-blue 3600 HD74280 Feb. 13, 2023 VPH-blue 600 HD74280 Dec. 12, 2023 VPH-blue 4200 HD74280
We note that our target is well-fitted by a round exponential galaxy model (REX333https://www.legacysurvey.org/dr8/catalogs/#goodness-of-fits-and-morphological-type) rather than a point spread function (PSF) model according to the DESI Legacy Imaging Survey catalog (Dey et al., 2019), which could indicate that the target is a slightly extended source. The Petrosian (Petrosian, 1976) radius in -band is 1.99 0.01 arcsec (see PhotoObj table in the SDSS). Hence, our target would benefit from an IFU observation to mitigate flux loss.
The data reduction was executed with the Image Reduction and Analysis Facility (IRAF: Tody (1986)) and the pipeline tools444We downloaded a package on April 11, 2024 (see http://www.kusastro.kyoto-u.ac.jp/~iwamuro/KOOLS/). dedicated to the KOOLS-IFU. This procedure includes overscan subtraction, bad column correction, bias subtraction, flat fielding, wavelength calibration, spectral extraction, sky subtraction, flux calibration, and making a spectrum by combining spectra from all fibers on which the object is located. Ne, Hg, and Xe lamp data were used for wavelength calibration. We took a weighted mean of the spectra taken each day to obtain a spectrum with a high signal-to-noise (SN) ratio. Possible flux loss was corrected by scaling the spectrum to match the SDSS -band magnitude.
2.2.2 SCUBA-2 on JCMT
In Toba et al. (2022b), the far-IR (FIR) and submillimeter data for eFEDSJ0828–0139 were lacking, and only AKARI FIR (shallow) upper limits were provided. Because the submillimeter data are crucial for precise measurement of (Toba et al. (2018, 2020c)), we observed eFEDSJ08280139 with the Submillimetre Common User Bolometer Array 2 (SCUBA-2: Holland et al. (2013)) on the James Clerk Maxwell Telescope (JCMT), providing 450 and 850 m photometry. Our observation was executed under the Band-1 condition () on January 23, 2024, through a 24A regular program (M24AP001, PI: Y.Toba). The total on-source integration time is about 1 hour, twice the 30-minute scans by the compact “Daisy” scan pattern. During the observations, we observed a nearby radio source, 0828+046, for a pointing check. Data reduction and flux measurements at 450 and 850 m were performed in a standard manner (e.g., Wang et al. (2017); Lim et al. (2020); Gao et al. (2024)) with the aid of the Sub-Millimeter Common User Reduction Facility (Chapin et al., 2013) and the Pipeline for Combining and Analyzing Reduced Data (PICARD: Jenness et al. (2008)). A full description of SCUBA-2 data reduction and flux measurements will be provided in Y.Toba et al. (in preparation)555Our observations aim at observing seven HyLIRG candidates, including eFEDSJ08280139, which will be presented once observations are completed..
2.3 Spectral fitting
To derive AGN properties such as AGN bolometric luminosity (), , and of our quasar, spectral fitting to KOOLS-IFU spectrum was conducted using the Quasar Spectral Fitting package (QSFit v1.3.0666https://qsfit.inaf.it: Calderone et al. (2017)). We fitted the KOOLS-IFU spectrum as a combination of (i) an AGN continuum with a single power-law, (ii) a Balmer continuum modeled by Grandi (1982) and Dietrich et al. (2002), (iii) iron-blended emission lines with UV-optical templates (Véron-Cetty et al., 2004; Vestergaard & Wilkes, 2001), and (iv) emission lines with Gaussian components. QSFit fits all the components simultaneously following a Levenberg-Marquardt least-squares minimization algorithm with MPFIT (Markwardt, 2009) procedure. Spectral fitting was executed after correcting for the galactic extinction provided by Schlegel et al. (1998) with the Milky Way attenuation curve (O’Donnell, 1994).
The main purpose of this spectral fitting is to measure the full width at half maximum (FWHM) of Mg ii 2798 and continuum luminosity at 3000 Å, , that are ingredients for estimates. Based on outputs from QSFit, we estimated through a single-epoch recipe provided by Vestergaard & Osmer (2009);
| (1) |
was converted from BC where BC3000 = is the bolometric correction (Runnoe et al., 2012). Following Toba et al. (2021a), the uncertainty in is calculated through the error propagation of Equation 1 while the uncertainty in is propagated from 1 errors of and BC3000.
2.4 SED fitting
We collected the multi-wavelength data from X-ray to FIR in the same manner as Toba et al. (2022b). We refer the reader to that paper for details, but in short, we used GALEX (Martin et al., 2005) for ultraviolet (UV) data, SDSS for optical data, UKIDSS (Lawrence et al., 2007) for near-IR (NIR) data, WISE for mid-IR (MIR) data, and AKARI (Murakami et al., 2007) for FIR data. UV-to-MIR photometry is corrected for Galactic extinction (Schlegel et al., 1998). In addition, we have added photometry obtained from SCUBA-2 observation (section 2.2.2). Because our target was not detected at 450 and 850 m, we input their 3 upper limits for the SED fitting, which is crucial to pin down the FIR SED of eFEDSJ08280139.
We employed the Code Investigating GALaxy Emission (CIGALE ver.2022.1777https://cigale.lam.fr/2022/07/04/version-2022-1/; Burgarella et al. (2005); Noll et al. (2009); Boquien et al. (2019); Yang et al. (2020, 2022)). This code allows us to include values for many parameters related to, e.g., the star formation (SF) history (SFH), single stellar population (SSP), attenuation law, AGN emissions, and dust emissions by considering the energy balance between the UV/optical and IR (see, e.g., Hashiguchi et al. (2023); Toba et al. (2024)). Table 2.4 summarizes the parameter ranges used in the SED fitting with CIGALE. These parameter sets are the same as presented in Toba et al. (2021b) optimized for HyLIRG candidates. A full description of the assumed models is provided by Toba et al. (2021b); hence, we provide a summary. We assume a delayed SFH with recent starburst (Ciesla et al., 2017) with parameterizing e-folding time of the main stellar population model (), the age of the main stellar population in the galaxy, the age of the burst, and the ratio of the SF rate (SFR) after and before the burst (R_sfr). A starburst attenuation curve (Calzetti et al., 2000; Leitherer et al., 2002) is used for dust attenuation, in which we parameterize the color excess of the nebular emission lines, . We chose the SSP model (Bruzual & Charlot, 2003), assuming the initial mass function (IMF) of Chabrier (2003), and the standard nebular emission model with the implementation of the new CLOUDY HII-region model (Villa-Vélez et al., 2021) is included in CIGALE (Inoue, 2011). AGN emission is modeled by using the SKIRTOR (Stalevski et al., 2016). This torus model consists of seven parameters: torus optical depth at 9.7 m (), torus density radial parameter (), torus density angular parameter (), the angle between the equatorial plane and edge of the torus (), the ratio of the maximum to minimum radii of the torus (), viewing angle (), and AGN fraction in total IR luminosity (). Dust grain emission is modeled by Draine et al. (2014) in which we parameterize the mass fraction of PAHs (), the minimum radiation field (), the power-low slope of the radiation field distribution (), and the fraction illuminated with a variable radiation field ranging from to (). X-ray emission is modeled with a fixed power-law photon index of AGN (Liu et al., 2022), and only is parameterized.
Parameter values used in SED fitting with CIGALE Parameter Value Delayed SFH with recent starburst (Ciesla et al., 2017) [Gyr] 1.0, 4.0, 8.0, 12 age [Gyr] 0.5, 1.0, 1.5, 2.0 age of burst [Myr] 10, 50, 100 R_sfr 1, 5, 10 SSP (Bruzual & Charlot, 2003) IMF Chabrier (2003) Metallicity 0.02 Nebular emission (Inoue, 2011) 3.0, 2.0, 1.0 Dust attenuation (Calzetti et al., 2000; Leitherer et al., 2002) 0.0, 0.1, 0.2, 0.3, 0.4, 0.5, 1.0 AGN Emission (Stalevski et al., 2012, 2016) 3, 7, 11 0.5, 1.5 0.5, 1.5 [] 40 30 [] 0, 10, 20 0.4, 0.5, 0.6, 0.7, 0.8, 0.9 Dust Emission (Draine et al., 2014) 2.50, 5.26, 6.63, 7.32 10.0, 50.0 1.0, 1.5, 2.0 0.01, 0.1, 1.0 X-ray Emission (Yang et al., 2022) AGN photon index () 2.0 2.0, 1.9, 1.8, 1.7 0.5
3 Results and discussion
3.1 Results of spectral fitting and AGN properties
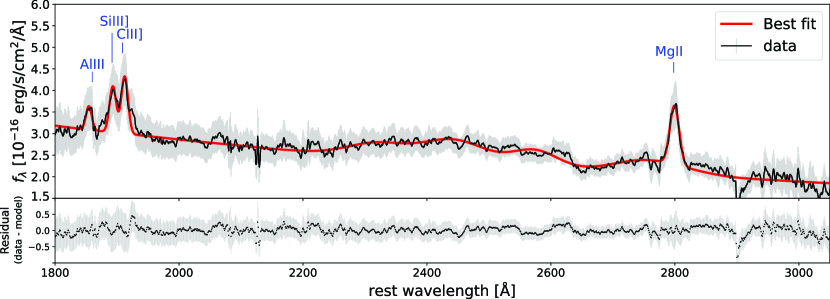
Figure 1 shows the optical spectrum of eFEDSJ08280139 taken by the KOOLS-IFU, where several emission lines such as Al iii1860, Si iii]1892, C iii]1909 and Mg ii are clearly detected. The result of the spectral fitting with QSFit is also shown in Figure 1. The spectroscopic redshift of eFEDSJ08280139 measured from Mg ii is . The FWHM of Mg ii and the continuum luminosity at 3000 Å are FWHM (Mg ii) = km s-1 and erg s-1, respectively, which results in the black hole mass of . We note that Buendia-Rios et al. (2023) recently provided a recipe for virial BH mass based on Al iii line. We find that the BH mass using their recipe is , which is roughly consistent with Mg ii-based . Eddington luminosity is erg s-1. The AGN bolometric luminosity is erg s-1, indicating a hyper-luminous quasar as similar to WISE-SDSS selected, WISSH quasars at (Duras et al., 2017). Consequently, the Eddington ratio of eFEDSJ08280139 is estimated to be , making it a prominent quasar with BH at super-Eddington accretion.
Martínez-Aldama et al. (2018) reported that such quasars with extremely-high (so-called extreme accretor (xA) quasars: Marziani & Sulentic (2014)) shows relatively strong Al iii and Si iii] emissions compared with C iii] and conspicuous Fe ii lines in their rest UV-to-optical spectra. We find that the line flux ratio for Al iii/Si iii] and C iii]/Si iii] is and , respectively. These values satisfy the selection criteria of xA quasars (Marziani & Sulentic, 2014), supporting that eFEDSJ08280139 is an extremely high quasar.
A caveat is that BH mass estimated by a single-epoch method (i.e., Equation 1) has a sizeable systematic uncertainty up to 0.4 dex (see, e.g., Shen (2013)), which has also been supported by the recent reverberation mapping with the SDSS (Shen et al., 2024). This means that the estimated Eddington ratio also potentially has a large uncertainty. We confirm the estimated BH mass is consistent with that using another emission line (albeit a single epoch) and obtain evidence of a high Eddington ratio inferred from emission line ratios. However, our and do not include the systematic errors mentioned above, which should be kept in mind for the following discussion.
3.2 Results of SED fitting and AGN host properties
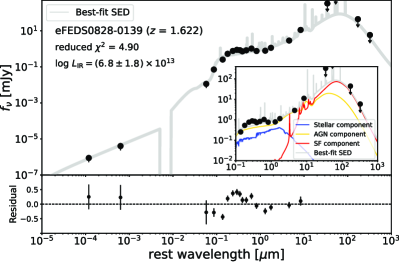
Figure 2 shows the best-fit SED of eFEDSJ08280139, demonstrating that the observed SED is moderately well-fitted by the stellar, nebular, AGN, and SF components with a reduced of 4.9. The derived total IR luminosity is , which confirms that our target is an HyLIRG. The stellar mass () and star formation rate (SFR) are and SFR = yr-1, respectively. These are typical values of HyLIRGs reported in previous works (e.g., Gao et al. (2021)). The BH mass and stellar mass ratio of eFEDSJ08280139 is = 2.8 0.2, which agrees with the results reported in Suh et al. (2020).
3.3 Potential uncertainties on IR luminosity and SFR
A potential issue caused by the SED fitting with upper limits of AKARI and SCUBA-2 data is about SF (i.e., dust emission from host galaxy) contribution to the total SED, which is also relevant to the accuracy of IR luminosity and SFR. The CIGALE takes into account energy conservation of the amount of UV/optical radiation from SF and AGN absorbed by a dust and the amount of IR radiation re-emitted by the dust when the SED fitting. Hence, FIR SED is expected to be constrained reasonably. Nevertheless, the lack of deep FIR data around the peak of the FIR SED would affect the results. To test the requirement to add an SF component to the SED fitting, we employ the Bayesian information criterion (BIC; Schwarz (1978)) for two fits that are derived with and without an SF component. The BIC is defined as BIC = + ln(), where is non-reduced chi-square, is the number of degrees of freedom (DOF), and is the number of photometric data points used for the fitting, respectively. We then compare the results of two SED fittings without/with the SF (dust emission) module by using BIC = BICwoSF – BICwSF. The BIC tells whether the SF/dust model is needed to provide a better fit by considering the difference in DOF (e.g., Ciesla et al. (2017); Buat et al. (2019); Aufort et al. (2020); Toba et al. (2020b)). If BIC is larger than two, adding the SF/dust component provides a better fit than not (Liddle, 2004; Stanley et al., 2015). The resultant value for eFEDSJ08280139 is BIC = 7.3, which suggests that the SF/dust component is required to explain the observed SED.
We also estimate IR luminosity and SFR based on the SED fitting without using SCUBA-2 data to see how even the upper limits of SCUBA-2 data are crucial to constrain those quantities. The resultant values are and SFR = yr-1, which suggests that SCUBA-2 data prevents SFR and from being overestimated. In summary, dust emission from the host galaxy requires explaining the observed SED, and SCUBA-2 data are crucial to pin down the FIR SED, even if they are upper limits. Hence, potential uncertainties on IR luminosity and SFR are expected to be small in this work.
3.4 Characterization of eFEDSJ08280139
Figure 3 shows the Eddington ratio as a function of redshift. We compare the Eddington ratio from a value-added catalog888http://quasar.astro.illinois.edu/paper_data/DR16Q/dr16q_prop_May16_2023.fits.gz (Wu & Shen, 2022) for the SDSS DR16 quasar catalog (Lyke et al., 2020), in which the continuum and emission-line properties for 750,414 broad-line quasars are provided. Note that 25 sources have among the quasars with . We visually check their spectra and find that the Eddington ratios of the majority of these quasars are poorly constrained with a large uncertainty of () partially due to the low SN of the emission lines (C iv and Mg ii). If we restrict ourselves to (that is similar to eFEDSJ08280139), only four objects remain. We also compare of WISSH quasars (Vietri et al., 2018) and extremely red quasars (ERQs: Perrotta et al. (2019)) that are also known as high quasars.
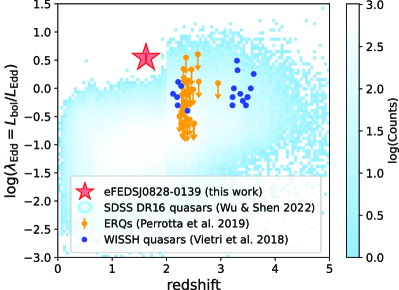
We find that eFEDSJ08280139 has the highest at 1.6, which is even higher than the ERQs and WISSH quasars at . In addition to a high BH accretion rate, this object has an extremely high SFR ( yr-1) as described in section 3.2. Given the fact that value is consistent with local relation (Suh et al., 2020), we may be witnessing the growing phase of both SMBH and its host galaxy in the course of the galaxy–SMBH co-evolution, as expected by the numerical simulation.
4 Summary
This work presents the hyper-luminous IR galaxy, eFEDSJ08280139, discovered by eROSITA. To characterize this HyLIRG candidate, we perform the optical spectroscopy with KOOLS-IFU on the Seimei Telescope and sub-mm imaging with SCUBA-2 on JCMT. From KOOLS-IFU observations, its spectroscopic redshift is measured to be . We evaluate BH mass based on the single epoch method with Mg ii line and IR luminosity based on the SED fitting. With the caveat of the potential uncertainty of the derived physical properties discussed in sections 3.1 and 3.3, we find that IR luminosity of eFEDSJ08280139 is and Eddington ratio is , confirming an HyLIRG with SMBH being supper-Eddington accretion. Its SFR is also high, yr-1. These results indicate that eFEDSJ08280139 is in a particular phase in which SMBH and its host galaxy are actively growing in the framework of galaxy-SMBH co-evolution.
Although this paper reports only one HyLIRG in the eFEDS region, several thousands of HyLIRG candidates can be selected with the aid of the eROSITA all-sky survey (Merloni et al., 2024). Spectroscopic follow-up observations with next-generation multiobject spectrographs, such as the Subaru Prime Focus Spectrograph (PFS; Takada et al. (2014); Greene et al. (2022)) provide an essential benchmark for the forthcoming systematic HyLIRG survey with eROSITA.
We acknowledge an anonymous referee for valuable suggestions that improved the paper. We thank Drs. Masafusa Onoue and Akatoki Noboriguchi for their support in data analysis. We also thank Dr. Fumihide Iwamuro for developing a data reduction pipeline for KOOLS-IFU. We are grateful to Yumiko Anraku, Yurika Matsuo, Arisa Yoshino, and the staff of the Okayama Astrophysical Observatory, a branch of the National Astronomical Observatory of Japan, for their support during our observations. Data reduction for KOOLS-IFU was carried out on the Multi-wavelength Data Analysis System operated by the Astronomy Data Center (ADC), National Astronomical Observatory of Japan.
This work is based on data from eROSITA, the soft X-ray instrument aboard SRG, a joint Russian-German science mission supported by the Russian Space Agency (Roskosmos), in the interests of the Russian Academy of Sciences represented by its Space Research Institute (IKI), and the Deutsches Zentrum für Luft- und Raumfahrt (DLR). The SRG spacecraft was built by Lavochkin Association (NPOL) and its subcontractors, and is operated by NPOL with support from the Max Planck Institute for Extraterrestrial Physics (MPE). The development and construction of the eROSITA X-ray instrument was led by MPE, with contributions from the Dr. Karl Remeis Observatory Bamberg & ECAP (FAU Erlangen-Nuernberg), the University of Hamburg Observatory, the Leibniz Institute for Astrophysics Potsdam (AIP), and the Institute for Astronomy and Astrophysics of the University of Tübingen, with the support of DLR and the Max Planck Society. The Argelander Institute for Astronomy of the University of Bonn and the Ludwig Maximilians Universität Munich also participated in the science preparation for eROSITA.
The James Clerk Maxwell Telescope is operated by the East Asian Observatory on behalf of The National Astronomical Observatory of Japan; Academia Sinica Institute of Astronomy and Astrophysics; the Korea Astronomy and Space Science Institute; the National Astronomical Research Institute of Thailand; Center for Astronomical Mega-Science (as well as the National Key R&D Program of China with No. 2017YFA0402700). Additional funding support is provided by the Science and Technology Facilities Council of the United Kingdom and participating universities and organizations in the United Kingdom and Canada. Additional funds for the construction of SCUBA-2 were provided by the Canada Foundation for Innovation.
This work is supported by JSPS KAKENHI Grant numbers JP22H01266 and JP23K22537 (Y.T.), JP20K04027 (N.O.), and JP21K03632 (M.I.). Z.K.G. and W.H.W. acknowledge support from the National Science and Technology Council of Taiwan (NSTC 111-2112-M-001-052-MY3).
References
- Almeida et al. (2023) Almeida, A. et al. 2023, ApJS, 267, 2, 44
- Assef et al. (2018) Assef, R. J., Stern, D., Noirot, G., Jun, H. D., Cutri, R. M., & Eisenhardt, P. R. M. 2018, ApJS, 234, 2, 23
- Aufort et al. (2020) Aufort, G., Ciesla, L., Pudlo, P., & Buat, V. 2020, A&A, 635, A136
- Bailer-Jones et al. (2019) Bailer-Jones, C. A. L., Fouesneau, M., & Andrae, R. 2019, MNRAS, 490, 4, 5615
- Blecha et al. (2018) Blecha, L., Snyder, G. F., Satyapal, S., & Ellison, S. L. 2018, MNRAS, 478, 3, 3056
- Boquien et al. (2019) Boquien, M., Burgarella, D., Roehlly, Y., Buat, V., Ciesla, L., Corre, D., Inoue, A. K., & Salas, H. 2019, A&A, 622, A103
- Brunner et al. (2022) Brunner, H. et al. 2022, A&A, 661, A1
- Bruzual & Charlot (2003) Bruzual, G. & Charlot, S. 2003, MNRAS, 344, 4, 1000
- Buat et al. (2019) Buat, V., Ciesla, L., Boquien, M., Małek, K., & Burgarella, D. 2019, A&A, 632, A79
- Buendia-Rios et al. (2023) Buendia-Rios, T. M., Negrete, C. A., Marziani, P., & Dultzin, D. 2023, A&A, 669, A135
- Burgarella et al. (2005) Burgarella, D., Buat, V., & Iglesias-Páramo, J. 2005, MNRAS, 360, 4, 1413
- Calderone et al. (2017) Calderone, G., Nicastro, L., Ghisellini, G., Dotti, M., Sbarrato, T., Shankar, F., & Colpi, M. 2017, MNRAS, 472, 4, 4051
- Calzetti et al. (2000) Calzetti, D., Armus, L., Bohlin, R. C., Kinney, A. L., Koornneef, J., & Storchi-Bergmann, T. 2000, ApJ, 533, 2, 682
- Chabrier (2003) Chabrier, G. 2003, PASP, 115, 809, 763
- Chapin et al. (2013) Chapin, E. L., Berry, D. S., Gibb, A. G., Jenness, T., Scott, D., Tilanus, R. P. J., Economou, F., & Holland, W. S. 2013, MNRAS, 430, 4, 2545
- Ciesla et al. (2017) Ciesla, L., Elbaz, D., & Fensch, J. 2017, A&A, 608, A41
- Dey et al. (2019) Dey, A. et al. 2019, AJ, 157, 5, 168
- Dietrich et al. (2002) Dietrich, M., Appenzeller, I., Vestergaard, M., & Wagner, S. J. 2002, ApJ, 564, 2, 581
- Draine et al. (2014) Draine, B. T. et al. 2014, ApJ, 780, 2, 172
- Duncan (2022) Duncan, K. J. 2022, MNRAS, 512, 3, 3662
- Duras et al. (2017) Duras, F. et al. 2017, A&A, 604, A67
- Ferrarese & Merritt (2000) Ferrarese, L. & Merritt, D. 2000, ApJ, 539, 1, L9
- Gao et al. (2021) Gao, F. et al. 2021, A&A, 654, A117
- Gao et al. (2024) Gao, Z.-K. et al. 2024, arXiv e-prints, arXiv:2405.20616
- Grandi (1982) Grandi, S. A. 1982, ApJ, 255, 25
- Greene et al. (2022) Greene, J., Bezanson, R., Ouchi, M., Silverman, J., & the PFS Galaxy Evolution Working Group. 2022, arXiv e-prints, arXiv:2206.14908
- Hashiguchi et al. (2023) Hashiguchi, A. et al. 2023, PASJ, 75, 6, 1246
- Hlavacek-Larrondo et al. (2017) Hlavacek-Larrondo, J. et al. 2017, MNRAS, 464, 2, 2223
- Holland et al. (2013) Holland, W. S. et al. 2013, MNRAS, 430, 4, 2513
- Hoshi et al. (2024) Hoshi, A., Yamada, T., & Ohta, K. 2024, PASJ, 76, 1, 103
- Inoue (2011) Inoue, A. K. 2011, MNRAS, 415, 3, 2920
- Jenness et al. (2008) Jenness, T., Cavanagh, B., Economou, F., & Berry, D. S., in R. W. Argyle, P. S. Bunclark, & J. R. Lewis, eds., Astronomical Data Analysis Software and Systems XVII (2008), vol. 394 of Astronomical Society of the Pacific Conference Series, p. 565
- Kormendy & Ho (2013) Kormendy, J. & Ho, L. C. 2013, ARA&A, 51, 1, 511
- Kurita et al. (2020) Kurita, M. et al. 2020, PASJ, 72, 3, 48
- Lawrence et al. (2007) Lawrence, A. et al. 2007, MNRAS, 379, 4, 1599
- Leitherer et al. (2002) Leitherer, C., Li, I. H., Calzetti, D., & Heckman, T. M. 2002, ApJS, 140, 2, 303
- Liddle (2004) Liddle, A. R. 2004, MNRAS, 351, 3, L49
- Lim et al. (2020) Lim, C.-F. et al. 2020, ApJ, 889, 2, 80
- Liu et al. (2022) Liu, T. et al. 2022, A&A, 661, A5
- Lyke et al. (2020) Lyke, B. W. et al. 2020, ApJS, 250, 1, 8
- Magorrian et al. (1998) Magorrian, J. et al. 1998, AJ, 115, 6, 2285
- Marconi & Hunt (2003) Marconi, A. & Hunt, L. K. 2003, ApJ, 589, 1, L21
- Markwardt (2009) Markwardt, C. B., in D. A. Bohlender, D. Durand, & P. Dowler, eds., Astronomical Data Analysis Software and Systems XVIII (2009), vol. 411 of Astronomical Society of the Pacific Conference Series, p. 251
- Martin et al. (2005) Martin, D. C. et al. 2005, ApJ, 619, 1, L1
- Martínez-Aldama et al. (2018) Martínez-Aldama, M. L., del Olmo, A., Marziani, P., Sulentic, J. W., Negrete, C. A., Dultzin, D., D’Onofrio, M., & Perea, J. 2018, A&A, 618, A179
- Marziani & Sulentic (2014) Marziani, P. & Sulentic, J. W. 2014, MNRAS, 442, 2, 1211
- Matsubayashi et al. (2019) Matsubayashi, K. et al. 2019, PASJ, 71, 5, 102
- McConnell & Ma (2013) McConnell, N. J. & Ma, C.-P. 2013, ApJ, 764, 2, 184
- Merloni et al. (2012) Merloni, A. et al. 2012, arXiv e-prints, arXiv:1209.3114
- Merloni et al. (2024) Merloni, A. et al. 2024, A&A, 682, A34
- Murakami et al. (2007) Murakami, H. et al. 2007, PASJ, 59, S369
- Narayanan et al. (2010) Narayanan, D. et al. 2010, MNRAS, 407, 3, 1701
- Noll et al. (2009) Noll, S., Burgarella, D., Giovannoli, E., Buat, V., Marcillac, D., & Muñoz-Mateos, J. C. 2009, A&A, 507, 3, 1793
- O’Donnell (1994) O’Donnell, J. E. 1994, ApJ, 422, 158
- Perrotta et al. (2019) Perrotta, S., Hamann, F., Zakamska, N. L., Alexandroff, R. M., Rupke, D., & Wylezalek, D. 2019, MNRAS, 488, 3, 4126
- Petrosian (1976) Petrosian, V. 1976, ApJ, 210, L53
- Predehl et al. (2021) Predehl, P. et al. 2021, A&A, 647, A1
- Ricci et al. (2017) Ricci, C. et al. 2017, ApJ, 835, 1, 105
- Richards et al. (2015) Richards, G. T. et al. 2015, ApJS, 219, 2, 39
- Rowan-Robinson (2000) Rowan-Robinson, M. 2000, MNRAS, 316, 4, 885
- Rudolf et al. (2016) Rudolf, N., Günther, H. M., Schneider, P. C., & Schmitt, J. H. M. M. 2016, A&A, 585, A113
- Runnoe et al. (2012) Runnoe, J. C., Brotherton, M. S., & Shang, Z. 2012, MNRAS, 422, 1, 478
- Salvato et al. (2022) Salvato, M. et al. 2022, A&A, 661, A3
- Schlegel et al. (1998) Schlegel, D. J., Finkbeiner, D. P., & Davis, M. 1998, ApJ, 500, 2, 525
- Schwarz (1978) Schwarz, G. 1978, Annals of Statistics, 6, 2, 461
- Secrest et al. (2015) Secrest, N. J., Dudik, R. P., Dorland, B. N., Zacharias, N., Makarov, V., Fey, A., Frouard, J., & Finch, C. 2015, ApJS, 221, 1, 12
- Shen (2013) Shen, Y. 2013, Bulletin of the Astronomical Society of India, 41, 1, 61
- Shen et al. (2024) Shen, Y. et al. 2024, ApJS, 272, 2, 26
- Stalevski et al. (2012) Stalevski, M., Fritz, J., Baes, M., Nakos, T., & Popović, L. Č. 2012, MNRAS, 420, 4, 2756
- Stalevski et al. (2016) Stalevski, M., Ricci, C., Ueda, Y., Lira, P., Fritz, J., & Baes, M. 2016, MNRAS, 458, 3, 2288
- Stanley et al. (2015) Stanley, F., Harrison, C. M., Alexander, D. M., Swinbank, A. M., Aird, J. A., Del Moro, A., Hickox, R. C., & Mullaney, J. R. 2015, MNRAS, 453, 1, 591
- Suh et al. (2020) Suh, H., Civano, F., Trakhtenbrot, B., Shankar, F., Hasinger, G., Sanders, D. B., & Allevato, V. 2020, ApJ, 889, 1, 32
- Symeonidis & Page (2018) Symeonidis, M. & Page, M. J. 2018, MNRAS, 479, 1, L91
- Takada et al. (2014) Takada, M. et al. 2014, PASJ, 66, 1, R1
- Toba et al. (2018) Toba, Y., Ueda, J., Lim, C.-F., Wang, W.-H., Nagao, T., Chang, Y.-Y., Saito, T., & Kawabe, R. 2018, ApJ, 857, 1, 31
- Toba et al. (2015) Toba, Y. et al. 2015, PASJ, 67, 5, 86
- Toba et al. (2020a) Toba, Y. et al. 2020a, ApJ, 888, 1, 8
- Toba et al. (2020b) Toba, Y. et al. 2020b, ApJ, 899, 1, 35
- Toba et al. (2020c) Toba, Y. et al. 2020c, ApJ, 889, 2, 76
- Toba et al. (2021a) Toba, Y. et al. 2021a, ApJ, 912, 2, 91
- Toba et al. (2021b) Toba, Y. et al. 2021b, A&A, 649, L11
- Toba et al. (2022a) Toba, Y. et al. 2022a, PASJ, 74, 6, 1356
- Toba et al. (2022b) Toba, Y. et al. 2022b, A&A, 661, A15
- Toba et al. (2024) Toba, Y. et al. 2024, ApJ, 967, 1, 65
- Tody (1986) Tody, D., in D. L. Crawford, ed., Instrumentation in astronomy VI (1986), vol. 627 of Society of Photo-Optical Instrumentation Engineers (SPIE) Conference Series, p. 733
- Véron-Cetty et al. (2004) Véron-Cetty, M. P., Joly, M., & Véron, P. 2004, A&A, 417, 515
- Vestergaard & Osmer (2009) Vestergaard, M. & Osmer, P. S. 2009, ApJ, 699, 1, 800
- Vestergaard & Wilkes (2001) Vestergaard, M. & Wilkes, B. J. 2001, ApJS, 134, 1, 1
- Vietri et al. (2018) Vietri, G. et al. 2018, A&A, 617, A81
- Villa-Vélez et al. (2021) Villa-Vélez, J. A., Buat, V., Theulé, P., Boquien, M., & Burgarella, D. 2021, A&A, 654, A153
- Wang et al. (2017) Wang, W.-H. et al. 2017, ApJ, 850, 1, 37
- Wilman et al. (2003) Wilman, R. J., Fabian, A. C., Crawford, C. S., & Cutri, R. M. 2003, MNRAS, 338, 1, L19
- Wright et al. (2010) Wright, E. L. et al. 2010, AJ, 140, 6, 1868
- Wu et al. (2023) Wu, Q., Liao, S., Qi, Z., Luo, H., Tang, Z., & Cao, Z. 2023, Research in Astronomy and Astrophysics, 23, 2, 025006
- Wu & Shen (2022) Wu, Q. & Shen, Y. 2022, ApJS, 263, 2, 42
- Yang et al. (2020) Yang, G. et al. 2020, MNRAS, 491, 1, 740
- Yang et al. (2022) Yang, G. et al. 2022, ApJ, 927, 2, 192
- York et al. (2000) York, D. G. et al. 2000, AJ, 120, 3, 1579
- Yoshida (2005) Yoshida, M. 2005, Journal of Korean Astronomical Society, 38, 2, 117
- Yutani et al. (2022) Yutani, N., Toba, Y., Baba, S., & Wada, K. 2022, ApJ, 936, 2, 118