Discovery of Very High Energy Gamma Rays from 1ES 1440+122
Abstract
The BL Lacertae object 1ES 1440+122 was observed in the energy range from 85 GeV to 30 TeV by the VERITAS array of imaging atmospheric Cherenkov telescopes. The observations, taken between 2008 May and 2010 June and totalling 53 hours, resulted in the discovery of -ray emission from the blazar, which has a redshift =0.163. 1ES 1440+122 is detected at a statistical significance of 5.5 standard deviations above the background with an integral flux of (2.8) 10-12 cm-2 s-1 (1.2% of the Crab Nebula’s flux) above 200 GeV. The measured spectrum is described well by a power law from 0.2 TeV to 1.3 TeV with a photon index of 3.1 0.4stat 0.2sys. Quasi-simultaneous multi-wavelength data from the Fermi Large Area Telescope (0.3–300 GeV) and the Swift X-ray Telescope (0.2–10 keV) are additionally used to model the properties of the emission region. A synchrotron self-Compton model produces a good representation of the multi-wavelength data. Adding an external-Compton or a hadronic component also adequately describes the data.
keywords:
Very High Energy Gamma Rays – 1ES 1440+122 – VER J1443+1201 Introduction
Active galactic nuclei (AGN) are observed to emit electromagnetic radiation from radio waves up to very high energy (VHE; GeV) -rays. These objects, which make up only a small fraction of the total number of observed galaxies, are very luminous, extremely compact, and can exhibit large luminosity variability. Although AGN differ widely in their observed characteristics, a unified picture has emerged in which AGN are powered by accretion onto a super-massive black hole (107–10M⊙). Near the black hole is a hot accretion disc surrounded by a thick torus of gas and dust. In some AGN (the radio-loud population, 15%), a highly-relativistic outflow of energetic particles form a highly collimated jet generating non-thermal emission. Blazars are thought to be the case where the jet is aligned with our line of sight (Urry & Padovani, 1995).
Blazar spectral energy distributions (SEDs) are dominated by non-thermal radiation. This emission has a flat radio spectrum, radio and optical polarisation, and is often highly variable. 1ES 1440+122 belongs to the BL Lacertae (BL Lac) subclass of blazars. BL Lacs do not have broad emission lines present, unlike flat-spectrum radio quasars. Blazar SEDs are characterised by two broad peaks, with a significant fraction of the power often being emitted in the -ray band. The low-energy peak in the SED is well understood as synchrotron emission from relativistic electrons. However, there are competing models to explain the high-energy peak emission as dominated by either leptonic or hadronic interactions (Blandford & Levinson, 1995; Bloom & Marscher, 1996; Mannheim, 1998; Pohl & Schlickeiser, 2000; Aharonian et al., 2000). BL Lacs have been further classified depending on the position of their lower-energy peak. Padovani & Giommi (1995) originally proposed two classes. Class definitions were extended to include an intermediate case by Nieppola et al. (2006) and Abdo et al. (2010), though there is not agreement on where to place the boundaries between classes. Based on a parabolic fit in log-log space to archival data, Nieppola et al. (2006) determined the location of synchrotron peak in 1ES 1440+122 to be at Hz, lying near the border between their intermediate-frequency-peaked and high-frequency-peaked BL Lac (IBL and HBL, respectively) class definitions. According to the classification scheme in Abdo et al. (2010), this synchrotron-peak frequency sets the classification of the source as a high synchrotron peaked (HSP) BL Lac.
1ES 1440+122 was initially classified as an AGN in X-rays in the Einstein Slew Survey (Elvis et al., 1992). It is surrounded by 20 galaxies within approximately 200 kpc (Heidt et al., 1999), which suggests that it may belong to a small cluster of galaxies. Indeed it is likely that the blazar is interacting with an elliptical galaxy with a projected separation of 4 kpc (Sbarufatti et al., 2006). The host galaxy has been resolved in several imaging studies, and high-resolution HST imaging (Scarpa et al., 1999) reveals a very close companion () now known to be a foreground star (Giovannini et al., 2004). The optical spectrum of 1ES 1440+122 is well measured, and a redshift of =0.163 is obtained from the identification of three spectral lines (Sbarufatti et al., 2006).
1ES 1440+122 was identified as a likely VHE emitter on the basis of its SED (Costamante & Ghisellini, 2002). It was observed by the H.E.S.S. array of imaging atmospheric Cherenkov telescopes (IACTs) for 11.2 hr between 2004 and 2009 resulting in a 99.9% confidence level integral flux upper limit of 1.66 10-12 cm-2 s-1 (1.0% of the Crab Nebula’s flux) above 290 GeV (Abramowski et al., 2014). 1ES 1440+122 belongs to the 3FGL catalogue (3FGL J1442.8+1200) with spectral index, = 1.80 0.12 (Acero et al., 2015). The Fermi Large Area Telescope (LAT) spectrum shows no sign for a cutoff, and its extrapolation to the VHE band predicts a 2% Crab Nebula flux between 200 GeV and 1 TeV, including extragalactic background light (EBL) absorption effects (Franceschini et al., 2008). The 3FGL lists the source as being non-variable (Acero et al., 2015).
VHE -ray emission from 1ES 1440+122 was discovered by VERITAS (Ong et al., 2010) during the 2008–2010 observing seasons. After the confirmation of the initial excess from this source, Swift X-ray Telescope (XRT) target of opportunity observations were triggered in order to provide a detailed X-ray spectrum, which is crucial for constraining models of emission. In combination with Fermi-LAT data, all data were used to construct an SED spanning 10 decades in energy.
2 VERITAS observations
VERITAS consists of four 12-m diameter IACTs located in southern Arizona (Holder et al., 2006). The array detects -ray emission from astrophysical objects in the energy range from 85 GeV to 30 TeV. VERITAS has an energy resolution of 15% and angular resolution (68% containment) of 0.1∘ per event. The current sensitivity of the array allows for a 1% Crab Nebula flux source detection in 25 hours (5 detection), while a 10% Crab Nebula flux is detected in 0.5 hours. Note that for sources with a softer spectrum than the Crab, the observing time required for detection will be longer. The field of view of the VERITAS telescope has a diameter of 3.5∘. More information on VERITAS and the IACT technique can be found in Holder et al. (2008).
VERITAS observed 1ES 1440+122 for about 78 hours from 2008 May to 2010 June, which includes two observing seasons, 2008–2009 and 2009–2010. The earlier data were taken with the original VERITAS telescope configuration, while the later data were taken after one of the telescopes was relocated in order to increase the array sensitivity (Perkins et al., 2009). These observations cover the zenith angle range from 19∘ to 38∘. All the observations were performed in a mode where the source is offset by 0.5∘ from the centre of the field of view. This offset allows for simultaneous background estimation with good precision while maintaining a high signal efficiency. This is known as “wobble” mode (Fomin et al., 1994). Observations affected by poor weather or hardware problems were removed, and the remaining 53 hours of data were processed with two independent analysis packages (Daniel et al., 2007) yielding consistent results.
Images of the showers were first calibrated in gain and timing at the pixel level using nightly calibration data using an artificial light source. Following calibration, images from each telescope were parameterized using fits to two-dimensional Gaussian distributions. This technique is similar to the frequently-used moment analysis (Hillas, 1985). Tests performed using -ray simulations have shown that the use of the Gaussian fit leads to several improvements with respect to the moment analysis. Truncated images, where some part of the shower is not contained in the field of view of the camera, are reconstructed with better angular and energy resolution. This also leads to an increase in the rate of events passing selection at high energy. No image cleaning (thresholding) was used, but a constant offset represents the night-sky background. As a result, background rejection was improved at low energy. More details of this image-fitting technique are given in Christiansen et al. (2012).
From the results of the image fits, parameters were calculated and used for event reconstruction and selection. The event selection criteria were optimised beforehand using observations of the Crab Nebula with the excess counts scaled to match a 1% Crab Nebula flux source. The source region was defined by a 0.1∘ radius circle centred on the source coordinates, and all the -ray-like events within this region were considered the ON counts. The reflected-region model (Berge et al., 2007) was used for background subtraction, where the background was estimated from eleven identically-sized regions reflected from the source region around the camera centre. The events found in these regions were considered the OFF counts. The Li & Ma Formula 17 (Li & Ma, 1983) was used to calculate the significance at the source location.
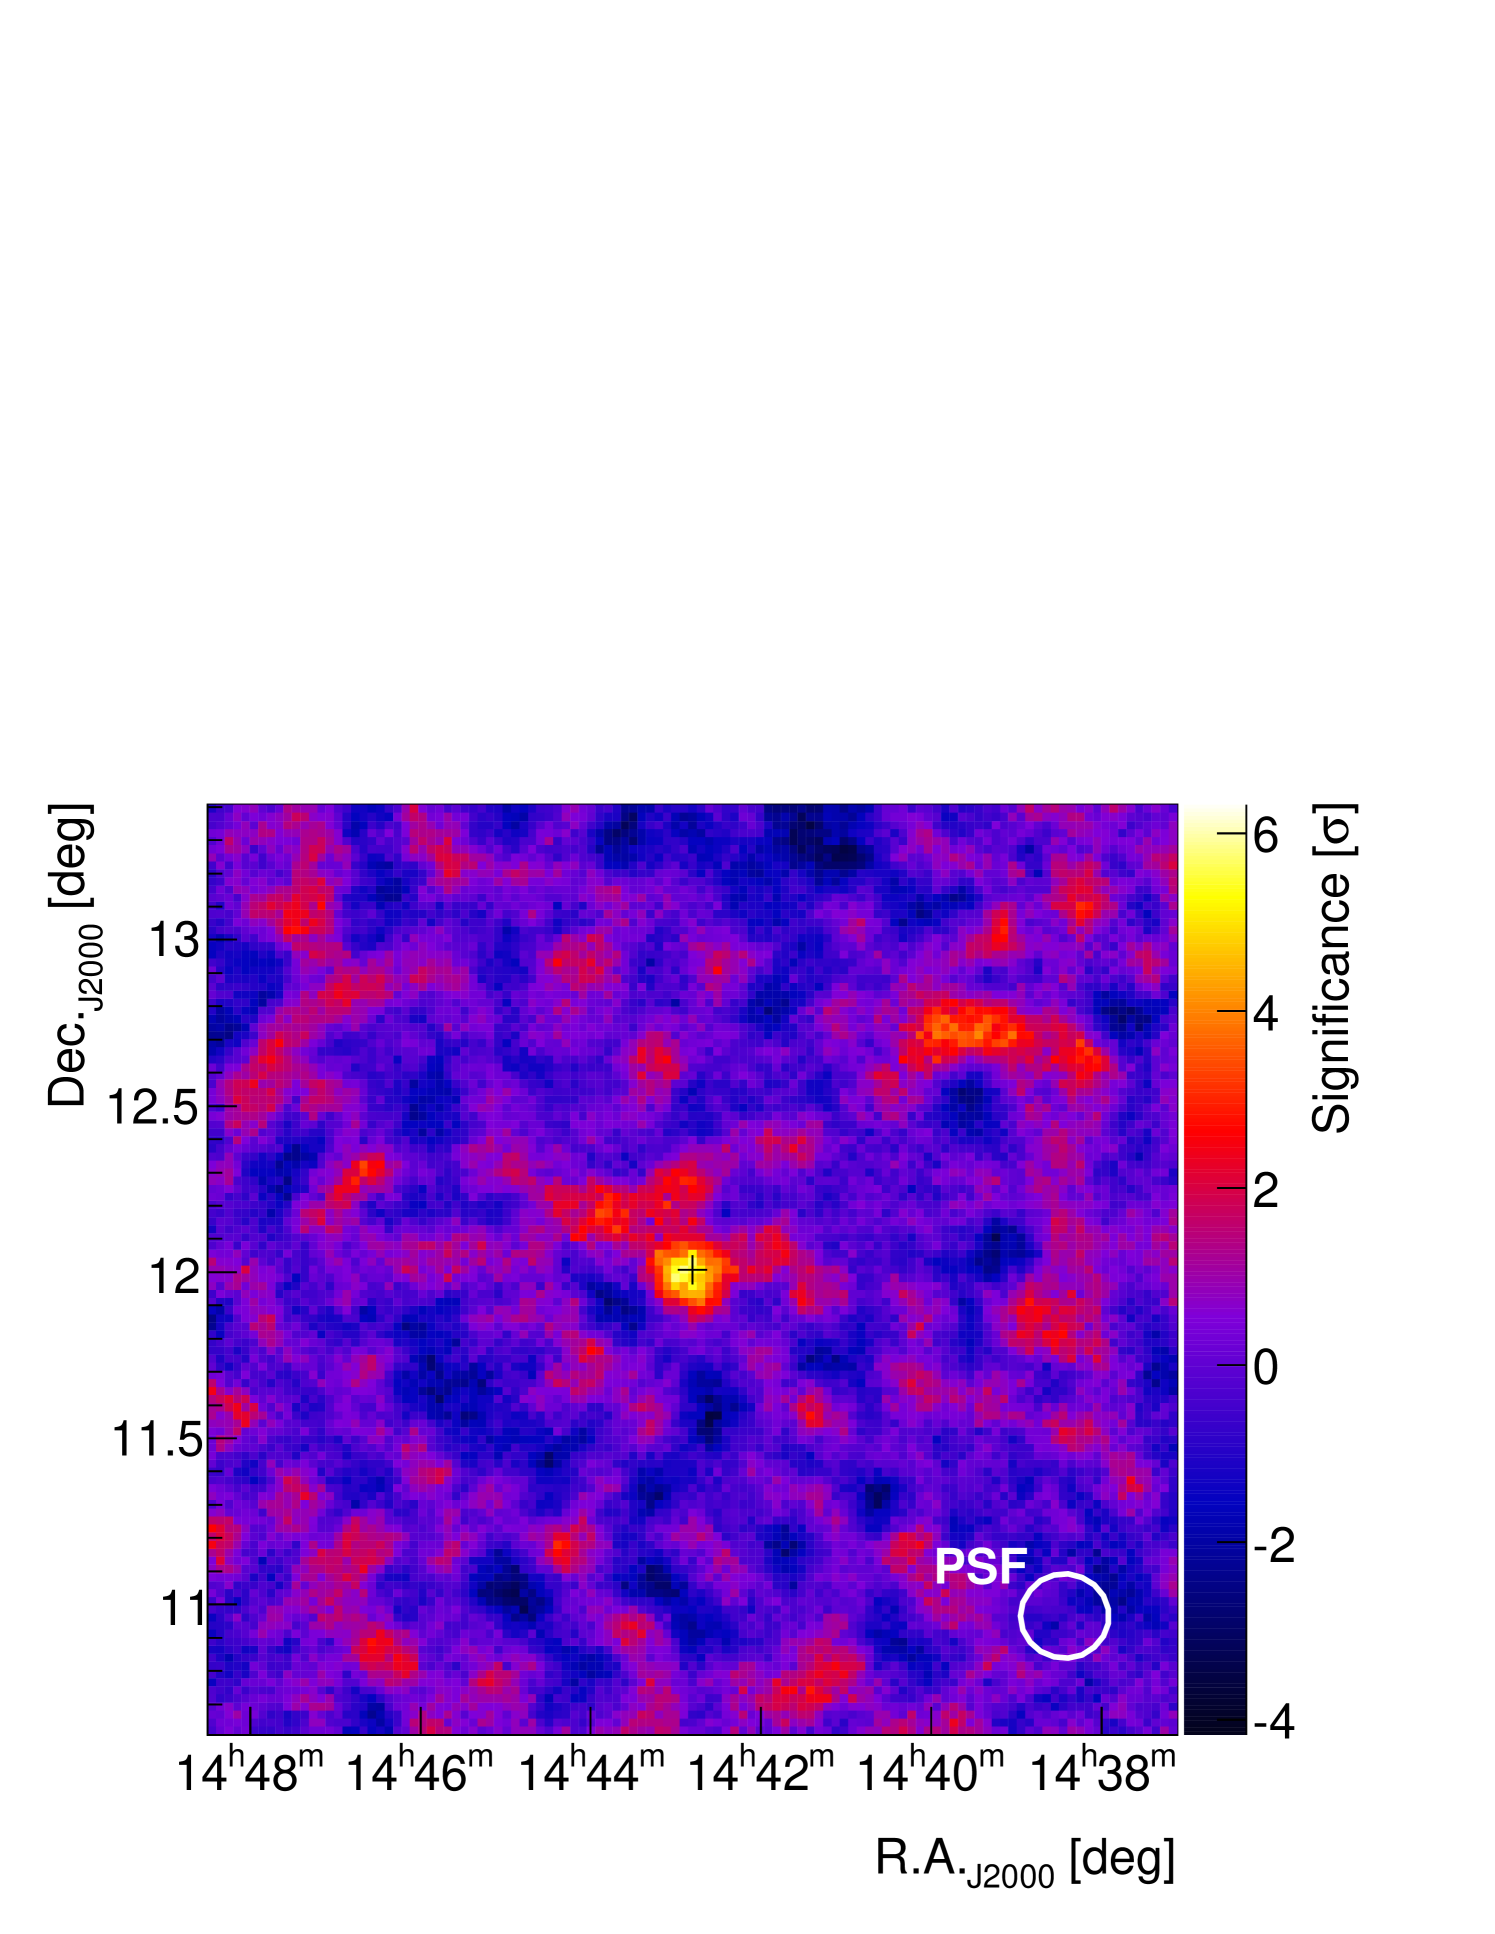
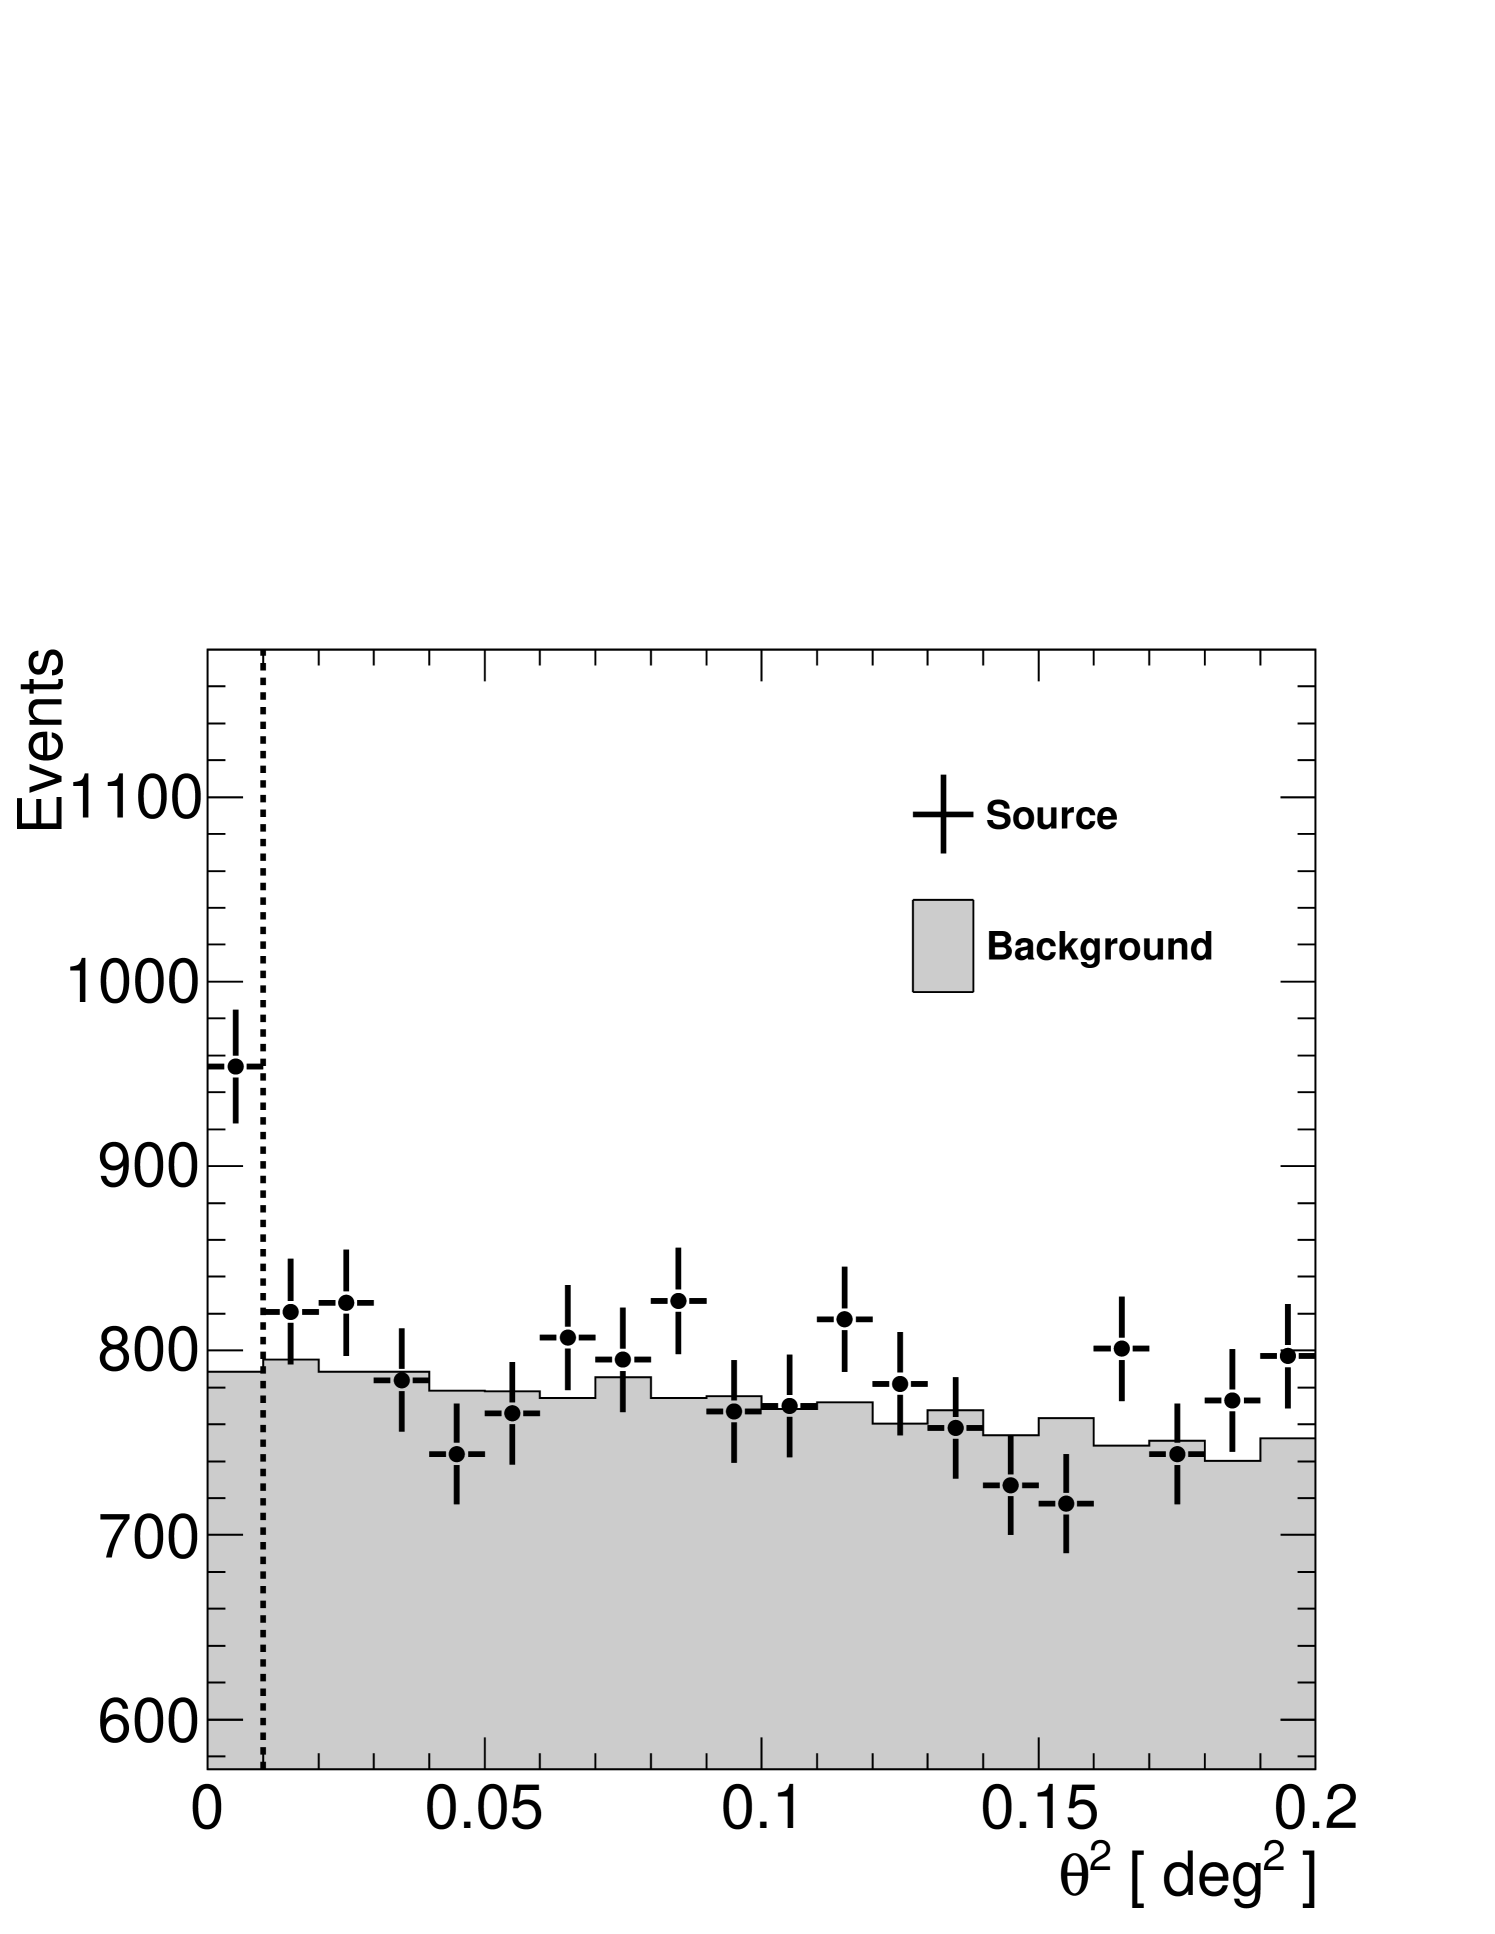
An excess of 166 events was observed in VERITAS data from the direction of 1ES 1440+122 (954 ON events, 8673 OFF events with an off-source normalisation ratio of ). The excess corresponds to a statistical significance of 5.5. The significance map in the vicinity of 1ES 1440+122 is shown in Figure 1 while the distribution of events with respect to the source location is shown in Figure 2. The VERITAS point spread function is 6′ for 68% containment radius at these zenith angles making the distribution of events consistent with a point-like source. Fitting a symmetric 2-dimensional Gaussian to the uncorrelated excess counts map results in a best-fit centroid at R.A. = 14h 43m 15s and Dec. = +12∘ 00′ 11′′. The new TeV source is catalogued as VER J1443+120. The statistical uncertainty in the position of 1′ and systematic uncertainty of 25′′ make the -ray emission consistent with the position of 1ES 1440+122, which is reported in the SDSS111http://www.sdss.org/dr5/ as R.A. = 14h 42m 48.3s and Dec. = +12∘ 00′ 40′′. We fitted the integrated flux light curve 200 GeV in monthly bins with a constant-flux hypothesis, resulting in no statistically significant evidence of variability (/dof =15.2/9 or a 9% chance of being generated given a constant flux hypothesis).
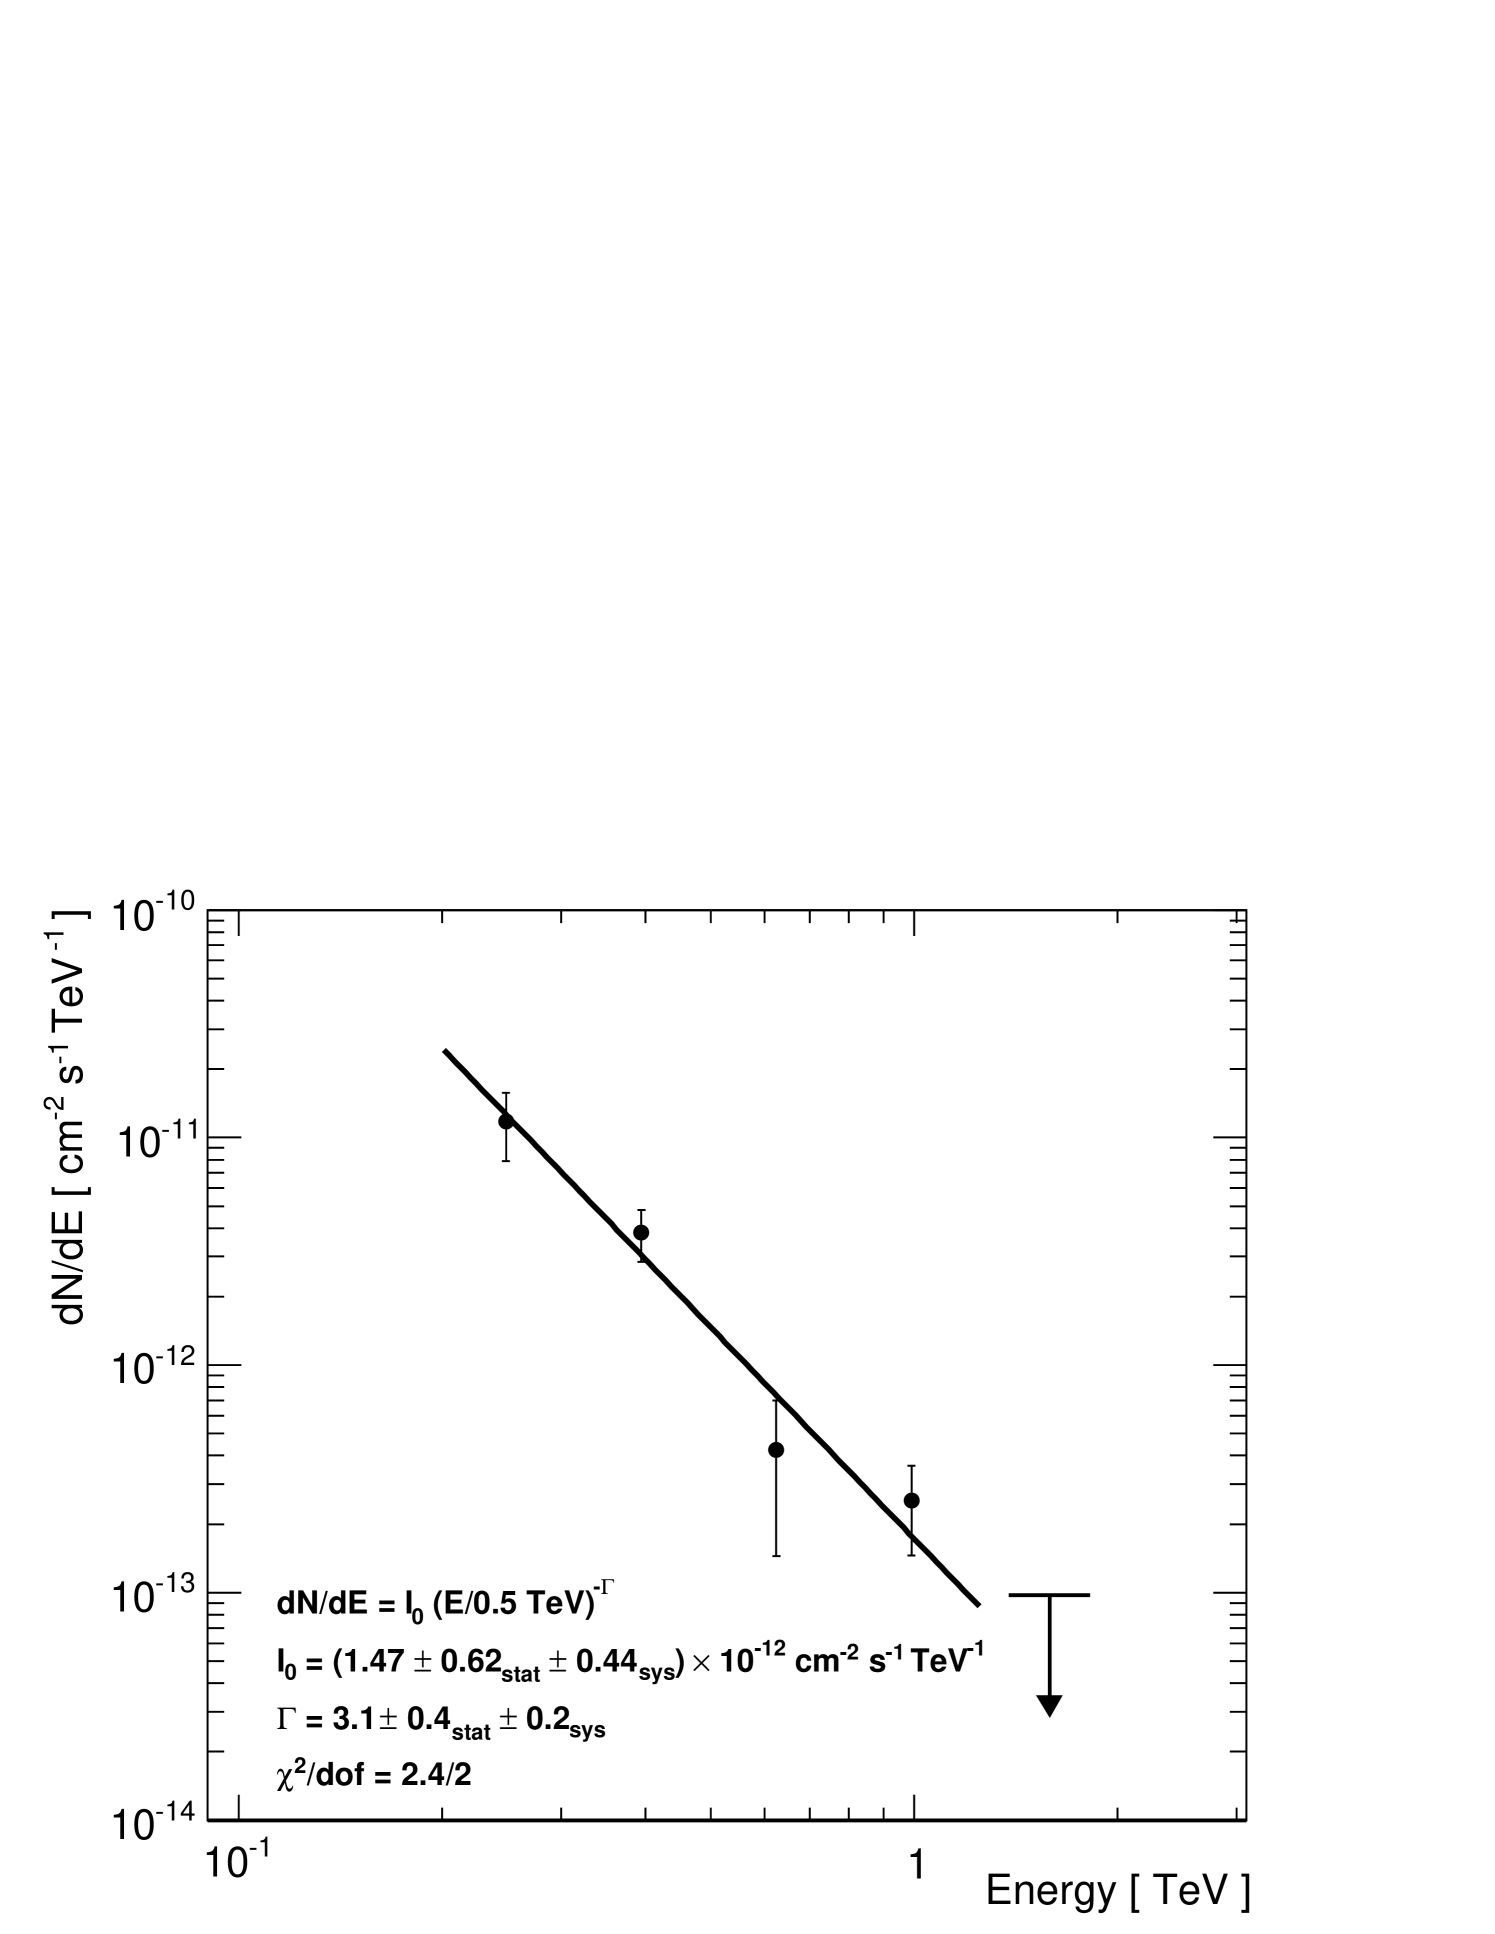
The spectrum of 1ES 1440+122 is described well by a power law of the form , with cm-2 s-1 TeV-1 and , resulting in /dof = 2.4/2.
The integral photon flux above 200 GeV is cm-2 s-1. Using the parameterization by Aharonian et al. (2006), this is equivalent to 1.2% of the flux from the Crab Nebula above 200 GeV. We estimate the systematic errors on the flux normalisation constant and the photon index to be /I0 = 30% and . The VERITAS spectral points are shown in Figure 3. For a strict comparison with the H.E.S.S integral flux upper limit of 1.66 10-12 cm-2 s-1 above 290 GeV (Abramowski et al., 2014), we recalculate our integral flux above the same energy threshold to be 10-12 cm-2 s-1, which shows they are consistent with one another.
3 Fermi-LAT Observations
The Fermi-LAT is a pair-conversion -ray detector sensitive to photons in the energy range from about 30 MeV to 300 GeV (Atwood et al., 2009). The Fermi-LAT data for this analysis were taken between 2008 August 04 and 2010 August 02. We used the likelihood tools distributed with the standard Science Tools v9r32p5 package available from the Fermi Science Support Center222http://fermi.gsfc.nasa.gov/ssc. Events were required to have zenith angle 105∘ in order to limit contamination by the Earth albedo effect. Only events in the energy range of 300 MeV to 100 GeV and within a circular region of 12∘ radius centred on the source were selected. The background was modelled with a galactic diffuse emission model333gll_iem_v02.fit and an isotropic component. Catalogued sources within 17∘ of the target location were included in the model. The fluxes were determined using the instrument response functions P7REP_SOURCE_V15 (a check was performed using updated response functions released after modeling was complete but these did not yield significant changes). The systematic uncertainty on the flux is approximately 5% at 560 MeV and under 10% at 10 GeV and above (Ackermann et al., 2012a).
A point source was detected at the position of 1ES 1440+122 with a significance of more than 9 standard deviations (TS89.6). The highest-energy photon detected by the Fermi-LAT with a high probability of association with the source (99.3%) has an energy of 62 GeV. The time-averaged Fermi-LAT spectrum computed assuming a constant power law includes five points and is shown in Figure 4. The spectrum is fit by a power law that can be described as , where , photons , 1 GeV and 100 GeV. The values reported in the 3FGL are: and photons with the same min and max energy (Acero et al., 2015). There is some tension between the spectral index we found and the 3FGL value. The period of our observations matches the 2FGL catalogue more closely, and our spectral index is in agreement with the 2FGL value of (Nolan et al., 2012).
4 Swift-XRT Observations
Swift-XRT (Gehrels et al., 2004) observations of 1ES 1440+122 were performed on 2008 June 12 and 2010 March 9. The Swift-XRT data were analysed with HEAsoft444http://heasarc.nasa.gov/lheasoft 6.13. Both observations were completed in photon-counting mode, showing count rates of 0.40 0.01 and 0.38 0.02 counts s-1. With these low count rates, photon pile-up is negligible and systematic uncertainties on the flux are negligible compared to the statistical errors.
XSPEC version 12.8.0 was used for the XRT spectral analysis. The data were combined and grouped into bins with a minimum of counts per bin, enabling the use of spectral-model fitting. The time-averaged 0.3-10 keV data were fitted with an absorbed power-law model (tbabs(po) in XSPEC) where the hydrogen column density was fixed at 1.58 1020 cm-2, taken from the LAB survey of Galactic HI (Kalberla et al., 2005). The data were reasonably well fit (dof ) by an absorbed power law with normalisation at 1 keV of (3.2 0.1) 10-3 s-1 keV-1 and photon index of 1.95 0.04. In order to represent the intrinsic X-ray emission, the absorption-corrected spectrum was used for SED modelling. The fluxes during both periods are consistent with one another, so an average was used.
5 Swift-UVOT Observations
The Ultraviolet/Optical Telescope (UVOT; Roming et al. (2005)) onboard Swift observed 1ES 1440+122 simultaneously with the Swift-XRT time periods. Source photons in each of six filters (V, B, U, UVW2, UVM2, and UVW1) were extracted from a circular aperture of radius 5.0′′ centred on the source. The background was estimated in a 30′′ radius circular region located away from the blazar. The fluxes were computed using the uvotsource555HEASOFT v6.13, Swift_Rel4.0(Bld29)_14Dec2012 with calibrations from Breeveld et al. (2011). tool. Corrections for interstellar absorption were made using the extinction curve of Fitzpatrick (1999) and assuming an value of 0.02390.0006, determined from the IPAC Extragalactic Database (Schlafly & Finkbeiner, 2011). The average fluxes from the two observations were used for the SED modelling.
6 Modelling and Discussion
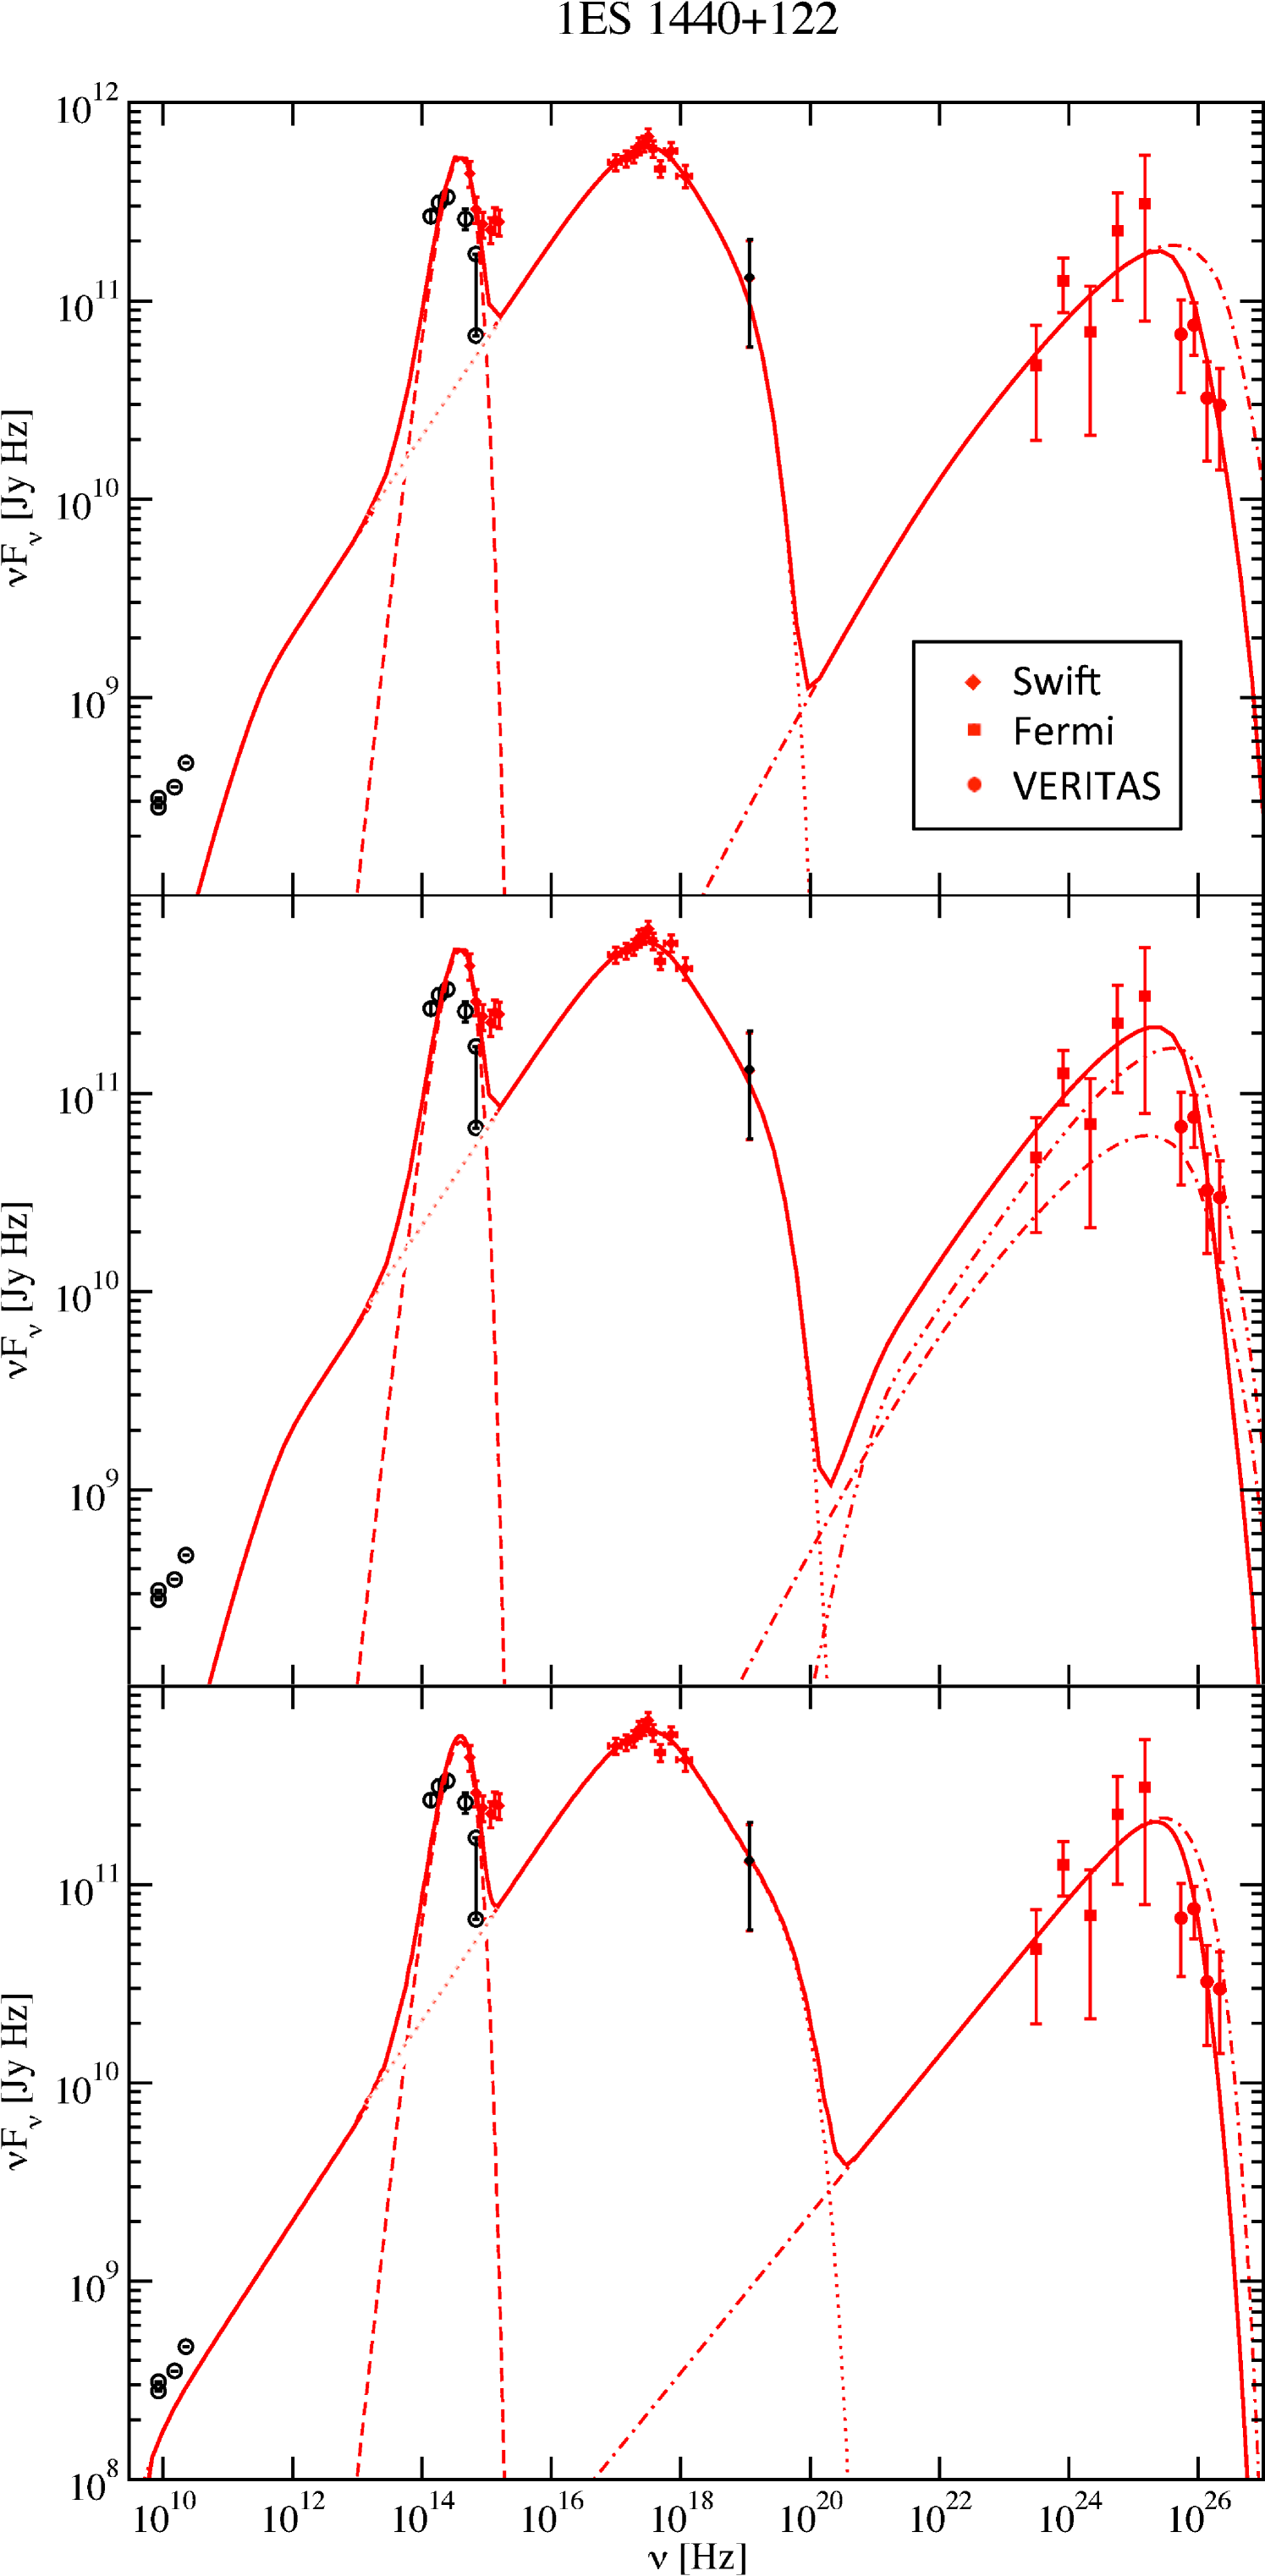
The quasi-simultaneous SED of 1ES 1440+122 with data from VERITAS, Fermi-LAT, and Swift-XRT is shown in Figure 4 and parameters of the three models, discussed below, are listed in Table 1. To these data, we added archival low-frequency radio and optical data from the NED666http://nedwww.ipac.caltech.edu as well as a Swift-BAT point777http://tools.asdc.asi.it. The vertical bar between the two B-band points illustrates the amount of historical variability at that frequency. The IR-through-optical emission of 1ES 1440+122 is clearly dominated by thermal emission from the host galaxy, modelled as a blackbody spectrum here. The UV data are under-represented in all models that we investigated. This could be additional contamination from the host galaxy (whose emission has been parametrized by a simple blackbody though it is known to be more complex) or extended jets unrelated to the VHE emission. The latter scenario has been considered for PKS 2155-304, which does not show correlated variability between the two bands (Abramowski et al., 2012). Optical polarisation data may be useful for disentangling contamination from other parts of the jet (de Almeida et al., 2014).
We produce models of the SED of 1ES 1440+122 with both leptonic and hadronic jet models. The VHE emission is corrected for EBL absorption according to Franceschini et al. (2008), which is in agreement with the most recent constraints from gamma-ray observations (Abramowski et al., 2013; Ackermann et al., 2012b; Biteau & Williams, 2015). In leptonic models for blazar emission, a population of relativistic electrons is responsible for both the lower-frequency component of the SED (via synchrotron emission) as well as the higher-frequency emission (via Compton scattering). Potential soft photon fields that can serve as targets for Compton scattering are either the synchrotron photons (SSC = synchrotron self-Compton), or radiation fields produced externally to the jet (EC = External Compton). For our models, we use a steady-state scenario in the fast-cooling regime based on the time-dependent blazar jet radiation transfer code of Böttcher & Chiang (2002), as described in detail in Böttcher et al. (2013). In this model, the emission originates from a spherical region of radius , moving along the jet with a Lorentz factor , corresponding to a jet speed . The jet is oriented at an angle with respect to the line of sight, resulting in Doppler boosting characterised by the Doppler factor .
Non-thermal electrons are injected and accelerated into a power-law distribution at a rate between a low- and high-energy cutoff, . A value of was chosen for all models, though it is not well constrained by the observations and can take a wide range of values depending on the obliquity and shock velocity (Summerlin & Baring, 2012). An equilibrium between this particle injection, radiative cooling and particle escape is established self-consistently with the radiation mechanisms considered. Particle escape was parameterized through an escape parameter such that the escape time scale . The resulting particle distribution will correspond to a power in electrons streaming along the jet (see Acciari et al., 2009). The synchrotron emission is evaluated assuming the presence of a tangled magnetic field , corresponding to a power in Poynting flux, . For each model calculation, our code evaluates the equipartition parameter . Because of a lack of observational constraints and in order to reduce the number of free parameters, we choose the observing angle as the critical angle, for which , i.e., .
| Parameter | SSC | EC | lepto-had. |
| [erg s-1] | |||
| [G] | |||
| 1000 | 100 | 3 | |
| [cm] | |||
| [erg cm-3] | — | — | |
| [K] | — | — | |
| [erg s-1] | — | — | |
| — | — | ||
| — | — | ||
| — | — | ||
| — | — | ||
| — | — | ||
| [hr] | — |
In a pure SSC model, only synchrotron photons play the role as targets for Compton scattering. The SSC model satisfactorily produces the non-thermal SED with plausible parameters. The size of the emission region used in the model implies a minimum variability time scale allowed by the model given by hours. The required magnetic field energy density is a factor of approximately 35 below equipartition with the non-thermal electron distribution.
For a model including an external radiation field as target for Compton scattering, we have improved the model presented in Acciari et al. (2009) by allowing for isotropic (in the rest frame of the AGN) radiation fields with arbitrary spectra. Guided by recent results of EC modelling of SEDs of other VERITAS-detected IBLs, such as W Comae (Acciari et al., 2008, 2009) and 3C66A (Abdo et al., 2011), we consider a thermal infrared radiation field, possibly originating in a dusty torus around the central engine, as an appropriate choice for an external radiation field. The energy density of this photon field and temperature of the dusty torus used in the model are poorly constrained but consistent with expectations. This model also satisfactorily represents the SED and allows for the choice of parameters very close to equipartition between the magnetic-field and non-thermal electron energy densities. The minimum variability time scale is 4.2 hours.
In addition to the purely leptonic models described above, we also consider a lepto-hadronic model, in which ultrarelativistic protons contribute significantly to the high-energy emission through proton-synchrotron radiation and pion production. The spectra of decay photons as well as the final decay products of charged pions are evaluated using the templates of Kelner & Aharonian (2008), accounting for secondary cascades as described in Böttcher (2010). In our model, in addition to the SSC model outlined above, we assume a power-law distribution of relativistic protons, between a low- and high-energy cutoff, , normalised to a total kinetic luminosity of the proton population propagating along the jet. We then evaluate the energy partition fractions and . As for the other models, the result is shown in Figure 4, and the model parameters are listed in Table 1. This model also adequately produces the non-thermal SED. It requires a strongly-magnetically dominated jet with and . Under these conditions, -ray emission is dominated by proton-synchrotron radiation. The minimum variability time scale from the size of the emission region is just 4.2 hours. However, the radiative cooling time of ultrarelativistic protons is on the order of several days, excluding variability on shorter time scales (not yet seen) under this model.
7 Conclusions
1ES 1440+122 was detected by VERITAS at a significance level of 5.5 during the 2008–2010 observing seasons. In this paper, we described VHE observations of 1ES 1440+122 along with the quasi-simultaneous observations with Swift in optical, UV, and X-rays and Fermi-LAT in high-energy -rays. The observed non-thermal SED of 1ES 1440+122 is consistent with purely leptonic (SSC and EC) models as well as with a hadronic origin. A leptonic model with an external infrared radiation field as target for Compton scattering allowed for parameters close to equipartition between the relativistic electron population and the magnetic field. The other models did not allow for partition fractions near unity. The model parameters are comparable to those obtained from other studies of VHE BL Lacs.
Our model SEDs all result in synchrotron peak frequencies contained in the Swift-XRT band, very close to Hz, classifying the source as an HBL according to the scheme of Nieppola et al. (2006) or an HSP according to Abdo et al. (2010). The Compton-peak frequencies are all close to Hz. The SED is dominated by the lower synchrotron peak (i.e. low Compton dominance), which is generally observed in other VHE HBLs (Fossati et al., 1998; Ghisellini et al., 1998).
Our results show that the SED alone does not allow us to confidently distinguish between different models for the high-energy emission from 1ES 1440+122. Future observations, such as probing for intraday variability of VHE -rays, may aid in distinguishing leptonic and hadronic models. The radiative cooling time scales of ultrarelativistic protons are of the order of several days, whereas those of ultrarelativistic electrons are typically of the order of hours or less. Therefore rapid (intraday) VHE -ray variability would be an indication of leptonic processes dominating the -ray output.
As a VHE source with a relatively hard spectrum for its redshift, 1ES 1440+122 could be useful in studies of the EBL. Several studies have used similar blazar spectra to examine lower limits on the intergalactic magnetic fields (Neronov & Vovk, 2010; Huan et al., 2011; Dermer et al., 2011; Arlen & Vassiliev, 2012). These studies look for emission in the Fermi-LAT band that might have cascaded down from the VERITAS band. However, there is an ongoing debate in the literature regarding the validity of these limits given the possibility of plasma instability energy losses dominating over the inverse Compton losses, resulting in less lower-energy cascade emission (Broderick et al., 2012; Schlickeiser et al., 2012; Miniati & Elyiv, 2013).
Acknowledgements
This research is supported by grants from the U.S. Department of Energy Office of Science, the U.S. National Science Foundation and the Smithsonian Institution, by NSERC in Canada, by Science Foundation Ireland (SFI 10/RFP/AST2748) and by STFC in the U.K. We acknowledge the excellent work of the technical support staff at the Fred Lawrence Whipple Observatory and at the collaborating institutions in the construction and operation of the instrument. M. Böttcher acknowledges support by the South African Department of Science and Technology through the National Research Foundation under NRF SARChI Chair grant no. 64789. The VERITAS Collaboration is grateful to Trevor Weekes for his seminal contributions and leadership in the field of VHE gamma-ray astrophysics, which made this study possible.
References
- Abdo et al. (2010) Abdo A. A., et al., 2010, Astrophys.J., 716, 30
- Abdo et al. (2011) Abdo A. A., et al., 2011, ApJ, 726, 43
- Abramowski et al. (2012) Abramowski A., et al., 2012, A&A, 539, A149
- Abramowski et al. (2013) Abramowski A., et al., 2013, A&A, 550, A4
- Abramowski et al. (2014) Abramowski A., et al., 2014, A&A, 564, A9
- Acciari et al. (2008) Acciari V. A., et al., 2008, ApJL, 684, L73
- Acciari et al. (2009) Acciari V. A., et al., 2009, ApJ, 707, 612
- Acero et al. (2015) Acero F., et al., 2015, ApJS, 218, 23
- Ackermann et al. (2012a) Ackermann M., et al., 2012a, ApJS, 203, 4
- Ackermann et al. (2012b) Ackermann M., et al., 2012b, Science, 338, 1190
- Aharonian et al. (2000) Aharonian F., et al., 2000, A&A, 353, 847
- Aharonian et al. (2006) Aharonian F., et al., 2006, A&A, 457, 899
- Arlen & Vassiliev (2012) Arlen T. C., Vassiliev V. V., 2012, in Aharonian F. A., Hofmann W., Rieger F. M., eds, American Institute of Physics Conference Series Vol. 1505, American Institute of Physics Conference Series. pp 606–609, doi:10.1063/1.4772333
- Atwood et al. (2009) Atwood W. B., et al., 2009, ApJ, 697, 1071
- Berge et al. (2007) Berge D., Funk S., Hinton J., 2007, A&A, 466, 1219
- Biteau & Williams (2015) Biteau J., Williams D. A., 2015, ApJ, 812, 60
- Blandford & Levinson (1995) Blandford R. D., Levinson A., 1995, ApJ, 441, 79
- Bloom & Marscher (1996) Bloom S. D., Marscher A. P., 1996, ApJ, 461, 657
- Böttcher (2010) Böttcher M., 2010, in proc. of “Fermi Meets Jansky”, p. 41
- Böttcher & Chiang (2002) Böttcher M., Chiang J., 2002, ApJ, 581, 127
- Böttcher et al. (2013) Böttcher M., et al., 2013, ApJ, 768, 54
- Breeveld et al. (2011) Breeveld A. A., et al., 2011, in McEnery J. E., Racusin J. L., Gehrels N., eds, American Institute of Physics Conference Series Vol. 1358, American Institute of Physics Conference Series. pp 373–376 (arXiv:1102.4717), doi:10.1063/1.3621807
- Broderick et al. (2012) Broderick A. E., Chang P., Pfrommer C., 2012, ApJ, 752, 22
- Christiansen et al. (2012) Christiansen J., et al., 2012, AIP Conf. Proc., 1505, 709
- Costamante & Ghisellini (2002) Costamante L., Ghisellini G., 2002, A&A, 384, 56
- Daniel et al. (2007) Daniel M. K., et al., 2007, 30th ICRC, 3, 1325
- Dermer et al. (2011) Dermer C. D., et al., 2011, ApJ, 733, L21
- Elvis et al. (1992) Elvis M., et al., 1992, ApJS, 80, 257
- Fitzpatrick (1999) Fitzpatrick E. L., 1999, PASP, 111, 63
- Fomin et al. (1994) Fomin V. P., et al., 1994, Astropart. Phys., 2, 137
- Fossati et al. (1998) Fossati G., et al., 1998, Mon.Not.Roy.Astron.Soc., 299, 433
- Franceschini et al. (2008) Franceschini A., Rodighiero G., Vaccari M., 2008, A&A, 487, 837
- Gehrels et al. (2004) Gehrels N., et al., 2004, ApJ, 611, 1005
- Ghisellini et al. (1998) Ghisellini G., et al., 1998, Mon.Not.Roy.Astron.Soc., 301, 451
- Giovannini et al. (2004) Giovannini G., et al., 2004, ApJ, 613, 747
- Heidt et al. (1999) Heidt J., et al., 1999, A&A, 341, 683
- Hillas (1985) Hillas A. M., 1985, 19th ICRC, 3, 445
- Holder et al. (2006) Holder J., et al., 2006, Astropart.Phys., 25, 391
- Holder et al. (2008) Holder J., et al., 2008, AIP Conf. Ser., 1085, 657
- Huan et al. (2011) Huan H., et al., 2011, ApJ, 735, L28
- Kalberla et al. (2005) Kalberla P. M., et al., 2005, A&A., 440, 775
- Kelner & Aharonian (2008) Kelner S. R., Aharonian F. A., 2008, Phys. Rev. D, 78, 034013
- Li & Ma (1983) Li T. P., Ma Y. Q., 1983, ApJ, 272, 317
- Mannheim (1998) Mannheim K., 1998, Science, 279, 684
- Miniati & Elyiv (2013) Miniati F., Elyiv A., 2013, ApJ, 770, 54
- Neronov & Vovk (2010) Neronov A., Vovk I., 2010, Science, 328, 73
- Nieppola et al. (2006) Nieppola E., et al., 2006, A&A, 445, 451
- Nolan et al. (2012) Nolan P. L., et al., 2012, ApJS, 199, 31
- Ong et al. (2010) Ong R., et al., 2010, A Tel. 2786
- Padovani & Giommi (1995) Padovani P., Giommi P., 1995, Astrophys.J., 444, 567
- Perkins et al. (2009) Perkins J., et al., 2009, in eConf Proceedings C091122
- Pohl & Schlickeiser (2000) Pohl M., Schlickeiser R., 2000, A&A, 354, 395
- Roming et al. (2005) Roming P. W. A., et al., 2005, Space Sci. Rev., 120, 95
- Sbarufatti et al. (2006) Sbarufatti B., et al., 2006, A&A, 457, 35
- Scarpa et al. (1999) Scarpa R., et al., 1999, ApJ, 521, 134
- Schlafly & Finkbeiner (2011) Schlafly E. F., Finkbeiner D. P., 2011, ApJ, 737, 103
- Schlickeiser et al. (2012) Schlickeiser R., et al., 2012, ApJ, 758, 101
- Summerlin & Baring (2012) Summerlin E. J., Baring M. G., 2012, Astrophys.J., 745, 63
- Urry & Padovani (1995) Urry C. M., Padovani P., 1995, Publ. Astron. Soc. Pac., 107, 803
- de Almeida et al. (2014) de Almeida U. B., Tavecchio F., Mankuzhiyil N., 2014