Distribution Aligned Feature Clustering for Zero-Shot Sketch-Based Image Retrieval
Abstract
Zero-Shot Sketch-Based Image Retrieval (ZS-SBIR) is a challenging cross-modal retrieval task. In prior arts, the retrieval is conducted by sorting the distance between the query sketch and each image in the gallery. However, the domain gap and the zero-shot setting make neural networks hard to generalize. This paper tackles the challenges from a new perspective: utilizing gallery image features. We propose a Cluster-then-Retrieve (ClusterRetri) method that performs clustering on the gallery images and uses the cluster centroids as proxies for retrieval. Furthermore, a distribution alignment loss is proposed to align the image and sketch features with a common Gaussian distribution, reducing the domain gap. Despite its simplicity, our proposed method outperforms the state-of-the-art methods by a large margin on popular datasets, e.g., up to and relative improvement of mAP@all on the Sketchy and TU-Berlin datasets.
Introduction
Sketch-based image retrieval (SBIR) is an application-driven task aiming to retrieve similar images based on hand-drawn sketches. With the development of deep learning and large-scale labeled datasets, SBIR can achieve satisfying performance. However, with the exponential growth of image content online, the classes to be retrieved have outnumbered any existing SBIR dataset, while the evaluation methodology does not guarantee generalization on novel classes. To this end, zero-shot SBIR (ZS-SBIR) (Shen et al. 2018; Yelamarthi et al. 2018) is proposed, which aims to retrieve categories unseen at the training stage.
The essence of zero-shot sketch-based image retrieval is a generalizable mapping from sketch to image. The primary challenges of this task are twofold: huge domain gap and large intra-class variance. Early works (Guo et al. 2017; Yelamarthi et al. 2018; Zhang et al. 2018) employ generative models or leverage semantic information to alleviate the domain gap. SAKE (Liu et al. 2019) first uses the ImageNet (Deng et al. 2009) pretrained teacher model to preserve useful features learned on real-world images, which significantly boosts retrieval performance. But the two challenges are not taken into account. TVT (Tian et al. 2022) first models the global structural information in SBIR using Vision Transformer and perform inter- and intra-modal alignment using multi-modal hypersphere learning.
In the above methods, retrieval is conducted by sorting the distance between the query image and each image in the gallery. The query image is a sketch with highly abstract strokes and no color feature. In contrast, target objects in natural images appear at various angles and are surrounded by complicated backgrounds. Especially in the zero-shot setting, the model can only find images with similar geometry information, significantly harming the performance. Thanks to the ImageNet pretrained model, the gallery feature vectors generated by SBIR algorithms have highly informative local structures. Natural clusters of classes can be found in the feature space, providing valuable information for this task.
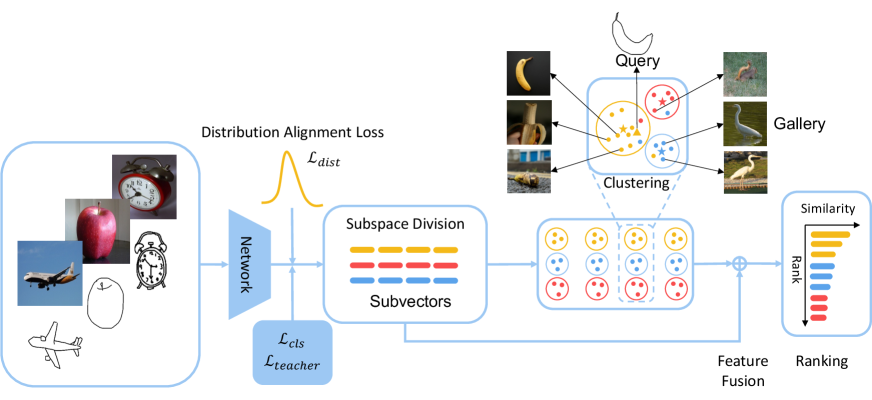
In this paper, we propose a Cluster-then-Retrieve method (ClusterRetri) that uses the structure of gallery feature space to aid the retrieval process. We use K-Means clustering algorithm to divide the gallery feature into clusters and use the centers as proxies for retrieval. Pre-clustering can effectively reduce the intra-class variance. With color and texture features, objects of different views can be grouped and retrieved. Moreover, the proposed subspace clustering can reduce the noise introduced by outliers in clusters, further improving the performance. In addition, we adopt a distribution alignment loss that minimizes the KL divergence between feature vectors and random features sampled from a Gaussian distribution. This loss can align the image and sketch features with a common Gaussian distribution, reducing the domain gap between images and sketches.
Our contributions can be summarized as follows:
-
•
This is the first study that leverages gallery information to mitigate intra-class variance in ZS-SBIR.
-
•
We propose a simple yet effective pipeline to utilize gallery information. Specifically, the pre-clustering, subspace division, and feature fusion can discover groups of images and help alleviate the domain gap.
-
•
We adopt Kullback–Leibler divergence that aligns the feature distribution of sketches and images with a prior distribution and further improves ZS-SBIR performance.
-
•
Extensive experiments conducted on two popular datasets demonstrate the effectiveness of our method. The proposed methods can provide up to 31% improvement on the baseline and outperform the state-of-the-art methods by a large margin.
Related Work
SBIR and ZS-SBIR
The fundamental problem of the SBIR task is to project the hand-drawn sketches and the real-world images into a common metric space, where samples of the same category are close to each other. The earliest works extract hand-crafted features from the sketches and match them with the edge maps of the natural images (Saavedra, Barrios, and Orand 2015; Hu and Collomosse 2013; Eitz et al. 2011; Hu, Wang, and Collomosse 2011; Eitz et al. 2010). In recent years, with the prevalence of deep neural networks (DNNs), different architectures of neural networks are introduced into this field (Yu et al. 2016b; Song et al. 2017; Sangkloy et al. 2016; Qi et al. 2016; Zhang et al. 2016; Yu et al. 2016a) and achieve superb results. However, the closed-set setting of SBIR does not meet the demand of large-scale applications. To this end, zero-shot setting of SBIR (Yelamarthi et al. 2018; Shen et al. 2018) is proposed. Following zero-shot learning approaches, ZS-SBIR studies (Shen et al. 2018; Dutta and Akata 2019) use semantic information to bridge the seen and unseen classes. Other methods employ generative models, such as generative adversarial networks (GANs) (Zhang et al. 2018) and variational auto-encoders (VAEs) (Yelamarthi et al. 2018) to learn a mapping from sketches to images. However, the inherent sparsity of sketch and intra-class variance of images make it difficult for semantic information to transfer, or for the network to learn a generalizable mapping on the unseen classes. Following works (Huang et al. 2021; Wang et al. 2021b) start to use metric losses to improve retrieval performance, but the pair-wise losses often require large batch size or complex sample mining techniques to perform well. Different from the above approaches, our Cluster-then-Retrieve method reduces intra-class variance by utilizing gallery information.
Clustering in Information Retrieval
Data clustering has been adopted for information retrieval for a long time. (Jardine and van Rijsbergen 1971) propose a hierarchic clustering method that significantly improves the efficiency of information retrieval. The study also proposes the cluster hypothesis: the associations between documents convey information about the relevance of documents to requests, and pointed out clustering’s potential of improving retrieval effectiveness. Based on this statement, many studies (Vdorhees 2017; Hearst and Pedersen 1996; Tombros, Villa, and van Rijsbergen 2002) try to investigate whether clustering can bring performance improvement to retrieval algorithms. However, although improvements could be achieved through manually selecting clusters (Sze 2004), clustering-based retrieval fails to gain better results in practice (Shaw, Burgin, and Howell 1997). In contrast, clustering has been widely applied to feature quantization (Jégou, Douze, and Schmid 2011; Ge et al. 2013; Kalantidis and Avrithis 2014) , enhancing retrieval efficiency on large-scale datasets. In the scenario of ZS-SBIR, estimating distances in a single domain could be more accurate than that between different domains, so the potential of cluster-based retrieval can be revealed.
Method
In this section, we first recap the problem formulation of ZS-SBIR, and then we examine our motivation, which is to leverage gallery information to alleviate the large intra-class variance among gallery images. We then illustrate our Cluster-then-Retrieve pipeline that uses cluster centroids as proxies for retrieval and distribution alignment loss that alleviate the domain gap between sketches and images.
Problem Formulation
Consider a dataset consisting of the training set and the testing set. We denote the training set as , where and are subsets of images and sketches. Similarly, the testing set is defined as .
Let and , where is the class label and is the set of training classes. The images and labels are used to train the model to learn discriminative features. After training, the image encoder generates feature vectors of the gallery images and query sketches, preparing for the retrieval. The testing images and sketches are , , and the corresponding feature vectors are denoted as , . During testing, given a sketch feature , its distances with gallery features are calculated and sorted, giving an optimal ranking of gallery images. In the zero-shot setting, the testing classes and the training classes do not overlap, i.e., .
Motivation: Leveraging Gallery Information in ZS-SBIR
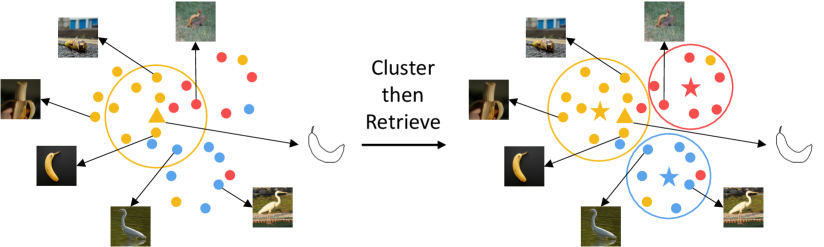
The ZS-SBIR is inherently a difficult problem because of its form: a cross-domain zero-shot metric learning task. We calculate and sort the distance between sketch and gallery images for each query. The highly abstract strokes provide merely sparse geometry information, so the model can only infer from the image edges and sketch strokes. However, as Fig.1 shows, objects in gallery images appear in various forms and are surrounded by complex backgrounds. Without the help of large pretrained models or side information, this problem seems intractable.
Thanks to the ImageNet pretrained model, we can obtain an informative feature space on the gallery images, where objects of different views can be grouped. Therefore, we perform clustering on the gallery and use the cluster centroids as proxies for retrieval.
Cluster-then-Retrieve Method
Clustering and Retrieval
Consider a gallery of images , and their features , where is the feature vector of each image in the gallery, denotes the dimension of features, and denotes the number of images. We can divide the gallery into groups as }, using clustering algorithms. Here we use K-Means because of its simplicity and efficiency. For each cluster , we can calculate a centroid of the features:
| (1) |
Given a query feature, we calculate its distances with the centroids and then rank the centroids according to this distance in ascending order. The rank of the centroids is denoted as:
| (2) |
Where stands for the index of the centroid ranked . Using the rank of the centroids, we can get a ranked image gallery grouped by clusters denoted as:
| (3) |
Random Feature Subspace Ensembling
Clustering in high-dimensional space has many problems. High-dimensional data often lie close to low-dimensional structures (Elhamifar and Vidal 2013). Many feature dimensions are irrelevant or redundant and can mask potential clusters when the data is noisy(Parsons, Haque, and Liu 2004). The famous random decision forest algorithm (Ho 1998) showed that combing multiple decision trees trained on randomly selected subspaces can substantially improve generalization. Many follow-up works also demonstrate its potential with other algorithms. Sampling random subspaces from the original feature space can reduce the dimension and increase the variety of clustering results. Therefore, we introduce the technique that randomly divides features into subspaces. For example, given a feature vector , we can divide it into subspaces as:
| (4) |
where denotes the -th dimension of , and is a random permutation of the original channel indexes.
Split the gallery feature and perform clustering in each subspace, and we get clusters with corresponding centroids, where and . In the -th subspace, we use the nearest centroid to replace :
| (5) |
Feature Fusion
In the above method, dense gallery features are replaced with sparse centroids. Representing the original feature space with a few points loses fine-grained ranks within clusters, especially when is small. Meanwhile, If a positive sample is classified into the wrong cluster, its retrieval result will deviate from the correct rank. In order to compensate, we use a convex combination to fuse the original features and cluster centers, producing the final feature for retrieval ranking.
| (6) |
Finally, for each query feature , the distance between the query and each image is given by:
| (7) |
where denotes euclidean distance function.
Distribution Alignment Loss
The Cluster-then-Retrieve method can greatly reduce the intra-class variance of gallery images, but the domain gap between sketches and images is not resolved explicitly. Inspired by (Wang et al. 2021a), we use Kullback–Leibler divergence to align the image and sketch features with a common Gaussian distribution. For each batch of training sample , we sample a random feature batch from a given Gaussian distribution . The distribution loss is formulated as:
| (8) |
where is the image encoder shared between images and sketches. As this regularization is applied to both image and sketch features, the feature distribution of the two domains can be pulled closer under the guidance of Gaussian distribution, reducing the domain gap in an indirect manner.
Network and Other Losses
The remaining part of our model is adopted from (Liu et al. 2019), where the model is initialized from a CSE-ResNet-50 network pretrained on ImageNet (Deng et al. 2009) and is supervised by the pretrained model through distillation during the training process.
The main training objective is a cross-entropy loss that classifies both sketches and natural images. For each training batch , the classification loss can be written as:
| (9) |
where and are the weight and bias of the classifier.
To preserve features learned from the ImageNet and improve the model’s discriminability on unseen classes, (Liu et al. 2019) proposes a distillation loss formulated as:
| (10) |
where and are the weight and bias terms in the ImageNet label classifier of the teacher model. denotes the classes of the teacher model prediction. , i.e., the soft label is given by . Where is the classification logit for class given by the teacher network, and is the semantic similarity between class and label class given by WordNet (Miller 1992). and control the importance of classification logit and semantic similarity.
The full objective function of our network is:
| (11) |
where , and are hyperparameters to balance the contribution of each loss.
Experiment
Datasets
To verify the effectiveness of our method, we follow the common practice of previous works and experimentally evaluate our model on two popular SBIR datasets: Sketchy (Sangkloy et al. 2016) and TU-Berlin (Eitz, Hays, and Alexa 2012).
Sketchy Dataset (Extended)
The Sketchy dataset contains a total of 75,471 sketches and 12,500 natural images of 125 categories. Liu et al.(Liu et al. 2017) collect additional 60,502 natural images, which yields in total 73,002 images. We use 25 classes as the test set following the same protocol proposed by (Shen et al. 2018).
TU-Berlin Dataset
The TU-Berlin dataset (Eitz, Hays, and Alexa 2012) consists of 250 categories, 20,000 sketches, and 204,489 natural images provided by (Zhang et al. 2016) . Compared to Sketchy, it suffers from a severe imbalance between sketches and images. The scarcity of sketches challenges the network’s generalizability on varied hand-drawn sketches. We also follow (Shen et al. 2018) and randomly select 30 classes as the test set.
Implementation Details
We implement our model on the codebase provided by (Liu et al. 2019). The SE-ResNet-50 network pre-trained on ImageNet is chosen to initialize the teacher and student networks. We train our model with the Adam optimizer with , . The learning rate is initialized as and exponentially decayed to . We set to , to and to unless stated. and are set to and for all experiments following the setting of (Liu et al. 2019). The semantic similarity is given by the WordNet python interface from nltk corpus reader. The random feature batch in our distribution alignment loss follows the distribution of . We set the batch size to 80 and train the model for 20 epochs.
For the hyperparameters of clustering, we set to and to for all experiments unless otherwise stated. Fuse coefficient is set to 0.2. The effects of different hyperparameters will be discussed in the appendix.
Comparison with Existing Methods
| Methods | Dim | Sketchy | TU-Berlin | |||
|---|---|---|---|---|---|---|
| mAP@all | Prec@100 | mAP@all | Prec@100 | |||
| SEM-PCYC (CVPR’2019) | 0.344 | 0.399 | 0.293 | 0.392 | ||
| SAKE (ICCV’2019) | 0.364 | 0.487 | 0.359 | 0.481 | ||
| SEM-PCYC (CVPR’2019) | 64 | 0.349 | 0.463 | 0.297 | 0.426 | |
| CSDB (BMVC’2019) | 64 | 0.376 | 0.484 | 0.254 | 0.355 | |
| TVT (AAAI’2022) | 0.553 | 0.727 | 0.396 | 0.606 | ||
| ClusterRetri (Ours) | 0.531 | 0.465 | 0.439 | 0.401 | ||
| ClusterRetri (Ours) | 64 | 0.585 | 0.618 | 0.498 | 0.529 | |
| SAKE (ICCV’2019) | 512 | 0.547 | 0.692 | 0.475 | 0.599 | |
| SAKE (reimp.) | 512 | 0.582 | 0.706 | 0.428 | 0.346 | |
| DSN (IJCAI’2021) | 512 | 0.583 | 0.704 | 0.481 | 0.586 | |
| RPKD (ACMMM’2021) | 512 | 0.613 | 0.723 | 0.486 | 0.612 | |
| NAVE (IJCAI’2021) | 512 | 0.613 | 0.725 | 0.493 | 0.607 | |
| TVT (AAAI’2022) | 384 | 0.648 | 0.796 | 0.484 | 0.662 | |
| SAKE w/ (Ours) | 512 | 0.613 | 0.730 | 0.498 | 0.500 | |
| ClusterRetri (Ours) | 0.781 | 0.764 | 0.672 | 0.637 | ||
| ClusterRetri (Ours) | 512 | 0.762 | 0.760 | 0.597 | 0.584 | |
We compare our ClusterRetri model with various methods of ZS-SBIR, including SEM-PCYC (Dutta and Akata 2019), SAKE (Liu et al. 2019), CSDB (Dutta and Biswas 2019), DSN (Wang et al. 2021b) and TVT (Tian et al. 2022). The results are shown in Table 1. We first retrain the baseline model, i.e., the SAKE (Liu et al. 2019). It should be noted that with batch size of 80, SAKE can achieve 0.582 mAP@all on Sketchy dataset, which surpasses the result in the original paper, so we train our models with batch size of 80.
With the proposed feature distribution loss, our baseline model can achieve 0.613 mAP@all on Sketchy dataset and 0.498 mAP@all on TU-Berlin dataset, which is comparable with state-of-the-art methods.
Apply our Cluster-then-Retrieve method to the feature generated by the distribution regulated network, and we can have a huge boost on the retrieval performance. Specifically, in 512-d real value retrieval, our method achieves 0.762 and 0.597 mAP@all on Sketchy and TU-Berlin, respectively.
Following previous works (Dutta and Akata 2019; Liu et al. 2019), we use iterative quantization (Gong et al. 2012) (ITQ) to generate binary features. Here the input of the ITQ algorithm is the reconstructed feature using clustered centroids. Specifically, the features’ subvectors are replaced with the closest centroids in corresponding subspaces. Then we calculate the hamming distance to conduct retrieval. Surprisingly, the performance is further improved, achieving 0.781 mAP@all on Sketchy dataset and 0.672 mAP@all on TU-Berlin dataset. We assume this is probably because the iterative quantization can reduce redundant features that may affect retrieval.
Using 64-d features, our method’s performance is comparable with the previous SOTA method with 512-d features, demonstrating our ClusterRetri’s effectiveness. Under the 64-d binary setting, the real value features are compact enough, so our method experiences a drop in performance, but it also outperforms other methods by a large margin.
Discussion
Qualitative Analysis
Example of Retrievals
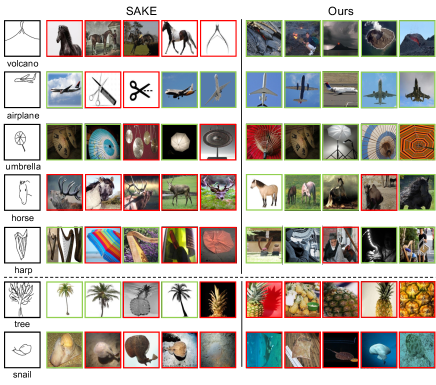
We visualize several typical results on Sketchy by our ClusterRetri and our baseline SAKE for qualitative analysis in Fig. 3. The first column of sketches in Fig. 3 are queries and their class labels. To their right are the top 5 images retrieved by baseline and our method. In both experiments, the models are trained with 512-d real value features. The images with green borders are positive samples, while those with red are negative ones.
Through comparison, we can find the superiority of our method in that we can retrieve images that are not similar in shapes. For example, in the first row of Fig. 3, our method can find volcano images that are very dissimilar to the query sketch because clustering can group the images with the color of flame and the texture of rocks together. Another example is in the -nd row, where the baseline mis-retrieved the scissors as planes because of the visual similarity of edges. Our method, however, can prevent such outliers once the clustering is successful. This observation confirms the effectiveness of leveraging color and texture information through clustering. However, our method also has drawbacks. In the last two rows, due to the poor quality of the query sketches, they are classified into the wrong clusters, negatively impacting the clustering performance.
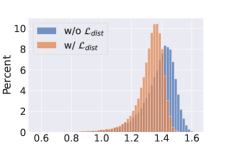
Effectiveness of Domain Adaptation
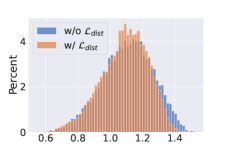
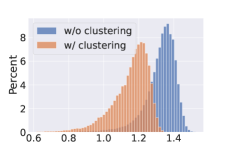
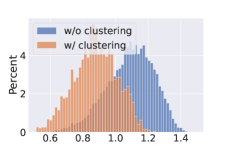
We use distance histograms to visualize the distance of the two domains. We calculate the distances between all possible sketch-image pairs in the test set of Sketchy dataset, then sample 9000 negative pairs and 1000 positive pairs to plot Fig. 4. It can be seen from Fig. 4 (a) and (b) that with the distribution alignment loss, the overall distances between sketches and images are reduced, indicating the effectiveness of domain adaptation. Moreover, as Fig.4 (c) and (d) show, with the cluster-rectified feature, the distances between sketch queries and images are also greatly reduced. Using the cluster centers as prototypes to replace the original features can filter out noises such as irrelevant background or multiple objects, facilitating the distance comparison between images and sparse sketches.
Quantitative Analysis
Clustering
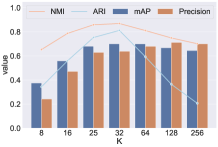
Here we experimentally validate the effectiveness of our Cluster-then-Retrieve method. We first perform K-Means clustering on the 512-d gallery features generated by our baseline model and use the clusters to perform retrieval. The results are illustrated in Fig. 5. Here we use normalized mutual information (NMI) (Strehl and Ghosh 2002) and adjusted rand score (ARI) (Hubert and Arabie 1985) to measure the performance of clustering. It can be seen that there is a strong correlation between clustering performance and retrieval mAP. This suggests that adopting better clustering algorithms in our pipeline can further improve retrieval performance. It should be noted that ideally, the best choice of K should be equal to the class number of gallery images. However, the method performs best when is around , which is slightly higher than classes in the test set of Sketchy. This can be explained by intra-class variance. Multiple small clusters may exist in a class of feature points, so grouping all the images into one cluster may affect the estimation of the feature center.
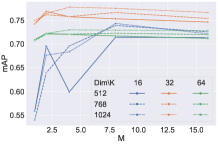
Random Subspace Ensemble
We then visualize the effect of the number of subspaces on retrieval performance in Fig. 5. We can see a large improvement when is set from to . When we directly use the K-Means centroids as proxies for retrieval, i.e., , retrieval performance heavily depends on the clustering quality of one shot. If a sample is misclassified to a cluster it does not belong to, it can hardly be placed in the proper rank. Dividing subspace softens this risk, as the distance is calculated in different subspaces, and its rank is decided through ensembled results of all the subspaces. Noted that in Fig.5, the settings and show that the ensemble results can be further improved by sampling extra random subspaces from the 512-d features.
Analysis of Efficiency Improvement
| Method | Dim | M | K | Time(s) | mAP@all | Prec@100 |
|---|---|---|---|---|---|---|
| Baseline | 512 | - | - | 82.7 | 0.582 | 0.706 |
| 64 | - | - | 9.1 | 0.364 | 0.487 | |
| Ours | 512 | 1 | 32 | 2.6 | 0.743 | 0.711 |
| 512 | 2 | 32 | 10.8 | 0.769 | 0.742 |
Our gallery feature clustering pipeline can achieve impressive results. It should be noted that the K-Means clustering and subspace division is very similar to the classical vector quantization (VQ) (Gray 1984) and product quantization (PQ) (Jégou, Douze, and Schmid 2011) algorithms in information retrieval, which focus on improving the retrieval efficiency by lookup tables.
While driven by different motivations, our method can also enjoy the speed improvement brought by PQ. We conduct experiments on a machine using Intel Xeon Silver 4215R. Table.2 shows the time usage of distance calculation and corresponding retrieval performance. The distance size is . It can be seen that our method can achieve superior performance and efficiency simultaneously. Using 512-d features and ClusterRetri, the time of distance calculation can be much faster than that of 64-d real number features.
Ablation Study
| KMeans | Fuse | Subspace | Sketchy | TU-berlin | |||
|---|---|---|---|---|---|---|---|
| mAP | Prec | mAP | Prec | ||||
| 0.582 | 0.706 | 0.428 | 0.346 | ||||
| ✓ | 0.701 | 0.639 | 0.520 | 0.471 | |||
| ✓ | ✓ | 0.706 | 0.700 | 0.528 | 0.524 | ||
| ✓ | ✓ | 0.727 | 0.683 | 0.511 | 0.473 | ||
| ✓ | ✓ | ✓ | 0.732 | 0.697 | 0.517 | 0.490 | |
| ✓ | 0.613 | 0.730 | 0.498 | 0.500 | |||
| ✓ | ✓ | 0.743 | 0.711 | 0.576 | 0.530 | ||
| ✓ | ✓ | ✓ | 0.746 | 0.742 | 0.594 | 0.600 | |
| ✓ | ✓ | ✓ | 0.769 | 0.742 | 0.583 | 0.532 | |
| ✓ | ✓ | ✓ | ✓ | 0.761 | 0.760 | 0.587 | 0.574 |
Here we evaluate the effectiveness of each component of our method. The baseline model is adopted from (Liu et al. 2019) and trained using 512 dimension features with batch size of 80. We gradually add clustering, reranking, and subspace division to the pipeline. Then we use the model trained with distribution alignment loss and repeat the above experiments to demonstrate its effectiveness. Note that the experiments are performed using and .
It can be seen from Table 3 that Simply choosing an appropriate for K-Means clustering is enough to get a huge boost on the performance. Specifically, we can achieve an mAP of when , outperforming any SOTA algorithms by a large margin. Clustering combined with feature fusion or subspace division further improves the result.
Distribution alignment loss alone can improve the baseline by and on Sketchy and TU-berlin. It can also provide 0.042 and 0.059 extra improvements when combined with K-Means clustering. This shows the potential of reducing intra-class variance and domain gap simultaneously.
Finally, our full pipeline can improve the mAP@all by and on Sketchy and TU-Berlin datasets.
Conclusion
This paper tackles the problem of zero-shot sketch-based image retrieval from a new perspective, i.e., by leveraging the gallery information. Domain gap and intra-class variance are inherent problems of ZS-SBIR. Inferring from sparse geometry information alone is inadequate for the varied natural images. Therefore, we adopt feature clustering to utilize the relationship between gallery images. The pre-processing technique can effectively use color and texture features that sketches lack, giving a huge boost to existing ZS-SBIR methods.
The proposed pipeline is flexible, as clustering can be conducted on features generated by any algorithm. State-of-the-art clustering algorithms can also be adopted to improve the overall performance further. Moreover, the idea of Cluster-then-Retrieve has great potential on other cross-modal category-level retrieval tasks.
References
- Deng et al. (2009) Deng, J.; Dong, W.; Socher, R.; Li, L.-J.; Li, K.; and Fei-Fei, L. 2009. Imagenet: A large-scale hierarchical image database. In 2009 IEEE Conference on Computer Vision and Pattern Recognition (CVPR), 248–255. IEEE.
- Dutta and Akata (2019) Dutta, A.; and Akata, Z. 2019. Semantically Tied Paired Cycle Consistency for Zero-Shot Sketch-Based Image Retrieval. In Computer Vision and Pattern Recognition.
- Dutta and Biswas (2019) Dutta, T.; and Biswas, S. 2019. Style-Guided Zero-Shot Sketch-based Image Retrieval. In BMVC.
- Eitz, Hays, and Alexa (2012) Eitz, M.; Hays, J.; and Alexa, M. 2012. How do humans sketch objects. In International Conference on Computer Graphics and Interactive Techniques.
- Eitz et al. (2010) Eitz, M.; Hildebrand, K.; Boubekeur, T.; and Alexa, M. 2010. An evaluation of descriptors for large-scale image retrieval from sketched feature lines. Comput. Graph., 34: 482–498.
- Eitz et al. (2011) Eitz, M.; Hildebrand, K.; Boubekeur, T.; and Alexa, M. 2011. Sketch-Based Image Retrieval: Benchmark and Bag-of-Features Descriptors. IEEE Transactions on Visualization and Computer Graphics, 17: 1624–1636.
- Elhamifar and Vidal (2013) Elhamifar, E.; and Vidal, R. 2013. Sparse Subspace Clustering: Algorithm, Theory, and Applications. IEEE Transactions on Pattern Analysis and Machine Intelligence, 35: 2765–2781.
- Ge et al. (2013) Ge, T.; He, K.; Ke, Q.; and Sun, J. 2013. Optimized Product Quantization for Approximate Nearest Neighbor Search. 2013 IEEE Conference on Computer Vision and Pattern Recognition, 2946–2953.
- Gong et al. (2012) Gong, Y.; Lazebnik, S.; Gordo, A.; and Perronnin, F. 2012. Iterative quantization: A procrustean approach to learning binary codes for large-scale image retrieval. IEEE transactions on pattern analysis and machine intelligence, 35(12): 2916–2929.
- Gray (1984) Gray, R. 1984. Vector quantization. IEEE ASSP Magazine, 1(2): 4–29.
- Guo et al. (2017) Guo, L.; Liu, J.; Wang, Y.; Luo, Z.; Wen, W.; and Lu, H. 2017. Sketch-based Image Retrieval using Generative Adversarial Networks. Proceedings of the 25th ACM international conference on Multimedia.
- Hearst and Pedersen (1996) Hearst, M. A.; and Pedersen, J. O. 1996. Reexamining the cluster hypothesis: scatter/gather on retrieval results. In SIGIR ’96.
- Ho (1998) Ho, T. K. 1998. The Random Subspace Method for Constructing Decision Forests. IEEE Trans. Pattern Anal. Mach. Intell., 20(8): 832–844.
- Hu and Collomosse (2013) Hu, R.; and Collomosse, J. P. 2013. A performance evaluation of gradient field HOG descriptor for sketch based image retrieval. Comput. Vis. Image Underst., 117: 790–806.
- Hu, Wang, and Collomosse (2011) Hu, R.; Wang, T.; and Collomosse, J. P. 2011. A bag-of-regions approach to sketch-based image retrieval. 2011 18th IEEE International Conference on Image Processing, 3661–3664.
- Huang et al. (2021) Huang, Z.; Sun, Y.; Han, C.; Gao, C.; and Sang, N. 2021. Modality-Aware Triplet Hard Mining for Zero-shot Sketch-Based Image Retrieval. arXiv preprint arXiv:2112.07966.
- Hubert and Arabie (1985) Hubert, L. J.; and Arabie, P. 1985. Comparing partitions. Journal of Classification, 2: 193–218.
- Jardine and van Rijsbergen (1971) Jardine, N.; and van Rijsbergen, C. J. 1971. The use of hierarchic clustering in information retrieval. Inf. Storage Retr., 7: 217–240.
- Jégou, Douze, and Schmid (2011) Jégou, H.; Douze, M.; and Schmid, C. 2011. Product Quantization for Nearest Neighbor Search. IEEE Transactions on Pattern Analysis and Machine Intelligence, 33: 117–128.
- Kalantidis and Avrithis (2014) Kalantidis, Y.; and Avrithis, Y. 2014. Locally Optimized Product Quantization for Approximate Nearest Neighbor Search. 2014 IEEE Conference on Computer Vision and Pattern Recognition, 2329–2336.
- Liu et al. (2017) Liu, L.; Shen, F.; Shen, Y.; Liu, X.; and Shao, L. 2017. Deep Sketch Hashing: Fast Free-Hand Sketch-Based Image Retrieval. 2017 IEEE Conference on Computer Vision and Pattern Recognition (CVPR), 2298–2307.
- Liu et al. (2019) Liu, Q.; Xie, L.; Wang, H.; and Yuille, A. L. 2019. Semantic-aware knowledge preservation for zero-shot sketch-based image retrieval. In Proceedings of the IEEE/CVF International Conference on Computer Vision, 3662–3671.
- Miller (1992) Miller, G. A. 1992. WordNet: a lexical database for English. In Human Language Technology.
- Parsons, Haque, and Liu (2004) Parsons, L.; Haque, E.; and Liu, H. 2004. Subspace clustering for high dimensional data: a review. SIGKDD Explor., 6: 90–105.
- Qi et al. (2016) Qi, Y.; Song, Y.-Z.; Zhang, H.; and Liu, J. 2016. Sketch-based image retrieval via Siamese convolutional neural network. In International Conference on Image Processing.
- Saavedra, Barrios, and Orand (2015) Saavedra, J. M.; Barrios, J. M.; and Orand, S. 2015. Sketch based Image Retrieval using Learned KeyShapes (LKS). In BMVC, volume 1, 7.
- Sangkloy et al. (2016) Sangkloy, P.; Burnell, N.; Ham, C.; and Hays, J. 2016. The sketchy database: learning to retrieve badly drawn bunnies. In International Conference on Computer Graphics and Interactive Techniques.
- Shaw, Burgin, and Howell (1997) Shaw, W. M.; Burgin, R.; and Howell, P. 1997. Performance Standards and Evaluations in IR Test Collections: Cluster-Based Retrieval Models. Inf. Process. Manag., 33: 1–14.
- Shen et al. (2018) Shen, Y.; Liu, L.; Shen, F.; and Shao, L. 2018. Zero-Shot Sketch-Image Hashing. 2018 IEEE/CVF Conference on Computer Vision and Pattern Recognition, 3598–3607.
- Song et al. (2017) Song, J.; Yu, Q.; Song, Y.-Z.; Xiang, T.; and Hospedales, T. M. 2017. Deep Spatial-Semantic Attention for Fine-Grained Sketch-Based Image Retrieval. In International Conference on Computer Vision.
- Strehl and Ghosh (2002) Strehl, A.; and Ghosh, J. 2002. Cluster Ensembles — A Knowledge Reuse Framework for Combining Multiple Partitions. J. Mach. Learn. Res., 3: 583–617.
- Sze (2004) Sze, R. 2004. Cluster-based information retrieval modeling. Ph.D. thesis, University of British Columbia.
- Tian et al. (2022) Tian, J.; Xu, X.; Shen, F.; Yang, Y.; and Shen, H. T. 2022. TVT: Three-Way Vision Transformer through Multi-Modal Hypersphere Learning for Zero-Shot Sketch-Based Image Retrieval. In Thirty-Sixth AAAI Conference on Artificial Intelligence, AAAI 2022, Thirty-Fourth Conference on Innovative Applications of Artificial Intelligence, IAAI 2022, The Twelveth Symposium on Educational Advances in Artificial Intelligence, EAAI 2022 Virtual Event, February 22 - March 1, 2022, 2370–2378. AAAI Press.
- Tombros, Villa, and van Rijsbergen (2002) Tombros, A.; Villa, R.; and van Rijsbergen, C. J. 2002. The effectiveness of query-specific hierarchic clustering in information retrieval. Inf. Process. Manag., 38: 559–582.
- Vdorhees (2017) Vdorhees, E. M. 2017. The Cluster Hypothesis Revisited. SIGIR Forum, 51: 35–43.
- Wang et al. (2021a) Wang, J.; Chen, J.; Lin, J.; Sigal, L.; and de Silva, C. W. 2021a. Discriminative feature alignment: Improving transferability of unsupervised domain adaptation by Gaussian-guided latent alignment. Pattern Recognition, 116: 107943.
- Wang et al. (2021b) Wang, Z.; Wang, H.; Yan, J.; Wu, A.; and Deng, C. 2021b. Domain-Smoothing Network for Zero-Shot Sketch-Based Image Retrieval. IJCAI, 1143–1149.
- Yelamarthi et al. (2018) Yelamarthi, S. K.; Reddy, S. K.; Mishra, A.; and Mittal, A. 2018. A zero-shot framework for sketch-based image retrieval. In Proceedings of the European Conference on Computer Vision (ECCV), 300–317.
- Yu et al. (2016a) Yu, Q.; Liu, F.; Song, Y.-Z.; Xiang, T.; Hospedales, T. M.; and Loy, C. C. 2016a. Sketch Me That Shoe. In Computer Vision and Pattern Recognition.
- Yu et al. (2016b) Yu, Q.; Yang, Y.; Liu, F.; Song, Y.-Z.; Xiang, T.; and Hospedales, T. M. 2016b. Sketch-a-Net: A Deep Neural Network that Beats Humans. International Journal of Computer Vision, 122: 411–425.
- Zhang et al. (2016) Zhang, H.; Liu, S.; Zhang, C.; Ren, W.; Wang, R.; and Cao, X. 2016. SketchNet: Sketch Classification with Web Images. In Computer Vision and Pattern Recognition.
- Zhang et al. (2018) Zhang, J.; Shen, F.; Liu, L.; Zhu, F.; Yu, M.; Shao, L.; Shen, H. T.; and Gool, L. V. 2018. Generative Domain-Migration Hashing for Sketch-to-Image Retrieval. In ECCV.