Distribution Regression in Duration Analysis:
an Application to Unemployment Spells
Abstract
This article proposes inference procedures for distribution regression models in duration analysis using randomly right-censored data. This generalizes classical duration models by allowing situations where explanatory variables’ marginal effects freely vary with duration time. The article discusses applications to testing uniform restrictions on the varying coefficients, inferences on average marginal effects, and others involving conditional distribution estimates. Finite sample properties of the proposed method are studied by means of Monte Carlo experiments. Finally, we apply our proposal to study the effects of unemployment benefits on unemployment duration.
Keywords: Conditional distribution; Duration models; Random Censoring; Unemployment duration; Varying coefficients model.
JEL Codes: C14, C24, C41, J64.
1 Introduction
Existing semiparametric duration models can be broadly classified into two groups: those based on the conditional hazard and those based on the quantile regression. The former includes the proportional hazard model (Cox, 1972, 1975), the proportional odds model (Clayton, 1976; Bennett, 1983; Murphy et al., 1997), and the accelerated failure time model (Kalbfleisch and Prentice, 1980); see Guo and Zeng (2014) for an overview. In these models, the conditional hazard identifies the conditional cumulative distribution expressed in terms of the error’s marginal distribution of a transformed failure time regression model (see, e.g., Hothorn et al., 2014). Censored quantile regression proposals are relatively more recent, see, e.g., Ying et al. (1995), Honore et al. (2002), Portnoy (2003), Peng and Huang (2008), and Wang and Wang (2009).
Conditional hazard and quantile regression models are alternative modeling strategies with advantages and drawbacks. Classical conditional hazard specifications impose identification conditions that are difficult to justify in some circumstances. For instance, the proportional hazard specification rules out important forms of heterogeneity, see, e.g., Portnoy (2003) and the discussion in Section 2. On the other hand, models based on quantile regression specifications avoid this problem, but impose that the underlying conditional cumulative distribution of duration time is absolutely continuous, which rules out other sampling schemes such as discrete outcomes.
The distribution regression approach was proposed by Foresi and Peracchi (1995) and formalized by Chernozhukov et al. (2013); see also Rothe and Wied (2013, 2019), Chernozhukov et al. (2019) and Chernozhukov et al. (2020) for later developments. One attractive feature of this modeling strategy is that marginal effects associated with distribution regression models are more flexible than those obtained from classical conditional hazard specifications, as they can accommodate richer forms of heterogeneity. In contrast to quantile regression, distribution regression can accommodate discrete, continuous and mixed duration data in a unified manner under fairly weak regularity conditions. Chernozhukov et al. (2013) show that distribution regression encompasses the Cox (1972) model as a special case and represents a useful alternative to quantile regression.
The distribution regression model specifies the distribution of the duration outcome variable by means of a generalized linear model with known link function and nonparametric varying coefficient depending on duration time. When data is uncensored, the varying coefficients at each duration value are consistently estimated by binary regressions. This method is also valid using censored data with known censoring time, which is an unlikely situation in duration studies, e.g., unemployment duration spells. When duration and censoring times are potentially unobserved, the standard binary regression approach lead to inconsistent estimators.
In this article, we propose a weighted binary regression procedure using Kaplan and Meier (1958) weights. The varying coefficients are identified by means of a set of moment restrictions of the duration time and covariates’ joint distribution. These moments are consistently estimated by their corresponding Kaplan-Meier integrals when the duration time is subjected to censoring; if censoring is not an issue, the Kaplan-Meier integrals reduce to the sample analogue of the moment restrictions. The resulting estimator admits a representation as a non-degenerate U-statistic of order three, whose Hájek projection is asymptotically distributed as a normal with an asymptotic variance that can be consistently estimated from the data. The resulting inference procedures on the coefficients do not rely on choosing tuning parameters such as bandwidths, imposing smoothness conditions on the censoring random variable, or using truncation arguments.
We establish the consistency and finite-dimensional distribution convergence of the varying coefficients under weak regularity conditions. Under more restrictive assumptions we justify the convergence in distribution of the estimated coefficient function as a random element of a suitable metric space. We also justify bootstrap-based inference procedures.
In order to justify the asymptotic inferences based on our proposed method, we impose restrictions on the joint distribution of the duration time, censoring time and covariates. Stute (1993, 1996) provided strong consistency and a central limit theorem for Kaplan-Meier integrals that estimate moments of (partially observed) durations time and covariates under the following identification conditions: (a) the duration and censoring times are independent, and (b) the event of being censored is conditionally independent of the covariates given the duration time. Stute shows that the two conditions suffice to identify the joint distribution of duration time and covariates from the observed censored data, and, hence, to identify corresponding moments of these conditional distributions. Of course, the identification of alternative models may require alternative regularity conditions. For instance, identification of the Cox (1972)’s hazard model, Aalen (1980)’s additive hazard model, or censored quantile regressions models (Portnoy, 2003) only requires that duration and censoring times are independent given covariates. However, as we mention in Section 2, these models usually exclude important types of heterogeneity, or restrict their attention to absolutely continuous duration data. Alternatively, one can potentially estimate the moment equations using inverse probability weighting (IPW) methods, as suggested by Robins and Rotnitzky (1992, 1995) and later extended by Wooldridge (2007) to general missing data problems. Although this path allows one to only assume that duration and censoring times are independent given covariates, it also requires that the conditional distribution of the censoring times given covariates is (uniformly) bounded away from one, which rules out discrete distributions and the most popular distribution functions used in survival analysis such as exponential, Gamma, log-normal and Weibull, among others. If one is not comfortable with these additional restrictions, truncation/trimming arguments need to be carefully introduced, and the choice of tuning parameters becomes a first-order concern. By adopting the Kaplan-Meier integrals approach, we avoid these alternative restrictions, but rely on conditions (a) and (b) above.
We illustrate the relevance of our proposal by assessing how changes in unemployment insurance benefits affect, on average, the distribution of unemployment duration, using data from the Survey of Income and Program Participation for the period 1985-2000. We find that, by allowing the distributional marginal effects to vary over the unemployment spell, our proposed method can reveal interesting insights when compared to traditional hazard models as those used by Chetty (2008). For instance, our results suggest a non-monotone marginal effect of an increase in unemployment insurance on the unemployment duration distribution. Such a finding is in sharp contrast with those obtained using classical proportional hazard models. On the other hand, our results agree with Chetty (2008) in that increases in unemployment insurance have larger effects on liquidity-constrained workers, suggesting that unemployment insurance affects unemployment duration not only through a moral hazard channel but also through a liquidity effect channel.
The rest of the article is organized as follows. Section 2 introduces the basic notation and motivates distribution regression models using duration data as an alternative to classical conditional hazard modeling. Section 3 describes our estimation procedure, whereas Section 4 introduces regularity conditions needed to justify inferences on the distribution regression varying coefficients. All the results are proved in the Supplementary Appendix. Application of the results to different contexts are placed in Section 5. Section 6 briefly summarizes the results of the Monte Carlo simulations – detailed discussion is presented in the Supplementary Appendix111The Supplementary Appendix is available at https://pedrohcgs.github.io/files/Delgado_GarciaSuaza_SantAnna_2021_EJ-Appendix.pdf. Finally, we apply the proposed techniques to investigate the effect of unemployment benefits on unemployment duration in Section 7. All our replication files are available at https://github.com/pedrohcgs/KMDR-replication.
2 Distribution Regression with Duration Outcomes
Consider the random vector defined on where is the duration outcome of interest and is a dimensional vector of time-invariant covariates, with supports and respectively. Henceforth, let and . We assume that the conditional cumulative distribution function (CDF) of given follows the distribution regression (DR) model,
| (2.1) |
where is a vector of nonparametric functions, and is a known link function.
Chernozhukov et al. (2013) point out that the DR model is a flexible alternative to classical duration models as it allows coefficients to vary with duration time. In particular, they show that it nests the Cox (1972) proportional hazard (PH) model. Model (2.1) also generalizes other traditional models commonly adopted in duration analysis such as Kalbfleisch and Prentice (1980) accelerated failure time (AFT) model, and Clayton (1976) proportional odds (PO) model.
We note that all the aforementioned classical duration models are special cases of the linear transformation model
| (2.2) |
where is a vector of unknown parameters, is a (potentially unknown) monotonically increasing transformation function, is the quantile function, and is uniformly distributed in independently of . For instance, the PH model corresponds to model (2.2) with the complementary log-log (cloglog) link function, ; the AFT model corresponds to (2.2) with commonly assumed to be the link function of a log-logistic or of a Weibull distribution; and the PO model corresponds to (2.2) with the logistic link function, ; see, e.g. Doksum and Gasko (1990), Cheng et al. (1995) and Hothorn et al. (2014). Indeed, the CDF associated with (2.2) is given by
| (2.3) |
Therefore, (2.1) is a natural generalization of (2.3) that allows all the slope coefficients varying with . Other duration models with varying slope coefficients are also special cases of (2.1). For instance, Aalen (1980) semi-parametric additive hazard model reduces to (2.1) with . The non-proportional odds model considered by McCullagh (1980) and Armstrong and Sloan (1989) can also be expressed in terms of the DR specification (2.1) when is the logistic link function.
We conclude this section by emphasizing that allowing for varying slope coefficients is particularly important to capture richer heterogeneous effects of covariates across the distribution of the duration outcome. Indeed, traditional duration specifications, such as the PH, PO or AFT models, implicitly impose that all covariates affect the CDF of in a proportional, and monotonic form. If is differentiable with Lebesgue density , partial effects for these models have the form
Thus, the sign of the marginal effect of any ’s component is not allowed to vary with , which may be too restrictive in some applications. For instance, in the context of the empirical application in Section 7, (2.3) does not allow a non-monotonic effect, e.g. U-shaped, ruling out non-stationary search models in the spirit of van den Berg (1990). The DR model (2.1) bypass such limitations since
which sign is allowed to vary with . We view this added flexibility as an attractive feature of the DR modeling approach.
3 The Kaplan-Meier Distribution Regression
The main challenge when dealing with duration data is that the outcome of interest is subject to censoring according to a variable . As so, inferences must be based on observations , with the realized (potentially censored) outcome, indicates whether or not is observed, and are independent and identically distributed () as . Henceforth, is the indicator function of the event .
Suppose for the moment that i.e., for all . In this case, the joint CDF, , is consistently estimated by its sample version , where inequalities are coordinate-wise. Therefore, following Foresi and Peracchi (1995) and Chernozhukov et al. (2013), can be consistently estimated by , the maximizer of the conditional likelihood function of
| (3.1) |
with
However, when is subject to right-censoring, i.e., , is no longer a consistent estimator of and, hence, neither is .
Since is not always observed, and must be identified from the joint distribution of the observed data on . However, this is not always possible without additional information. Henceforth, for any random variable , which can be or , define and , and let denote the (possibly empty) set of jumps. Also, for any generic function , . If no information about beyond is available from the data, identification of
is the best that one can hope for; see, e.g., Tsiatis (1975, 1981), and Stute (1993). In order to identify we impose the following assumptions.
Assumption 3.1
and are independent.
Assumption 3.2
and are conditionally independent given .
Assumption 3.1 is introduced to identify (see Tsiatis, 1975, 1981 for discussion), whereas Assumption 3.2 is introduced by Stute (1993) and allows us to incorporate covariates into the analysis. Taken together, these two assumptions imply that covariates should have no effect on the probability of being censored once is known. Of course, Assumptions 3.1 and 3.2 hold if is independent of , but can also hold under more general circumstances. See Stute (1993, 1996, 1999) for a discussion on Assumptions 3.1 and and 3.2, and the identification of and its moments. Identification can be achieved under alternative conditions, in the context of alternative conditional survival models, or alternative estimation procedures. See Introduction for further comments.
Remark 3.1
Under Assumptions 3.1 and 3.2, . Therefore, if either , or irrespective of whether is finite or not. For most duration distributions considered in the literature, ; hence, . When , in general, and cannot be consistently estimated as is not observed beyond . When depending on the local structure of and around the common endpoint. Notice that the above endpoint conditions for can be satisfied with discontinuous .
In order to identify , we ensure that by imposing the following condition; see Stute (1999) for a similar assumption in the case of nonlinear regression with randomly censored outcomes.
Assumption 3.3
or
Thus, is identified as the parameter value that maximizes under standard conditions in binary regression, e.g., Amemiya (1985, Section 9.2.2), or more recently, van der Vaart (1998, Example 5.40).
Henceforth, are the ordered , where ties within outcomes or within censoring times are ordered arbitrarily and ties among and are treated as if the former precedes the latter. For observations of a random variable , which may be or , is the concomitant of the order statistics i.e., if .
In the absence of covariates, is consistently estimated by the Kaplan and Meier (1958) product-limit estimator,
By noticing that the jumps of at are
| (3.2) |
we can express in an additive form as
When covariates are present, the natural estimator is
| (3.3) |
see, Stute (1993, 1996). Stute (1993) showed that, under Assumptions 3.1-3.3,
Thus, (3.3) is indeed a natural candidate to replace in (3.1) under censoring. This suggests estimating by the Kaplan-Meier integral,
which is a weighted version of .
The Kaplan-Meier distribution regression (KMDR) estimator of is then given by
Notice that, to compute the KMDR estimators, one simply needs to run a weighted binary regression, where the weights are the (random) Kaplan-Meier weights . In the absence of censoring, i.e., , , we have that the Kaplan-Meier weights , and reduces to
4 Asymptotic Theory
In this section, we present the asymptotic properties of our proposed KMDR estimator for .
In order to establish consistency, we impose the following fairly weak assumption which is compatible with discrete, continuous and mixed duration outcomes.
Assumption 4.4
The CDF specification holds, where is a continuously differentiable monotone function, the distribution of is not concentrated on an affine subspace of and
Next theorem, like any other result in the paper, is proved in the Supplemental Appendix. The proof applies the arguments in Example 5.40 in van der Vaart (1998) to show that
Theorem 4.1
In order to provide the finite dimensional asymptotic distribution of we need the following assumption.
Assumption 4.5
is an inner point of , which is a compact subset of Also, let ; for , is bounded away from zero and one, and admits a continuously differentiable Lebesgue density .
The restriction on in Assumption 4.5 is a classical assumption, which can be found, for instance, in Amemiya (1985) Assumption 9.2.1. The assumption is satisfied by the normal and logistic distribution (probit and logit), but also for many other distributions. In the general case, Assumption 4.5 essentially rules out extremes , since, in these cases, may be near zero or one. This assumption can be relaxed at the cost of more involved proofs.
The score function is given by
where
The conditional Fisher information that the binary variable contains about given is , where
| (4.1) |
Notice that, under our assumptions, is continuously differentiable.
We first pay attention to the asymptotic distribution of the score Applying Stute (1995, 1996) lemmata, can be expressed as an statistic of order three with Hájek projection , where
and for any function ,
| (4.2) |
| (4.3) | |||||
| (4.4) | |||||
| (4.5) |
where .
To derive the asymptotic normality of the score, we need the following extra moment conditions.
Assumption 4.6
For each ,
with
Assumption 4.6 guarantees that the variance of the leading term in is bounded, and implies that is finite. The bias of the Kaplan-Meier integral is not necessarily for any integrand function, and may decrease to zero at a polynomial rate depending on the degree of censoring, which is characterized by the function . Assumption 4.6 on guarantees that the bias is of order ; see Stute (1994), Chen and Ying (1996), and Chen and Lo (1997).
Let be a Gaussian random vector with zero mean and covariances
| (4.6) |
with .
With Assumption 4.6, we show that is asymptotically equivalent to a of order 3 with Hájek projection . Thus, is asymptotically normal with finite dimensional covariance . Theorem 4.2 below follows by applying Theorem 5.21 in van der Vaart (1998).
In order to conduct inferences on , is estimated by
where
| (4.8) | |||||
and is estimated by
| (4.9) |
where 222Alternatively, one can estimate using the Hessian of . We follow this path in our simulations..
Corollary 4.1
Under the assumptions of Theorem 4.2, and for all .
We can also justify inferences with the assistance of a multiplier bootstrap technique in the spirit of Theorem 2.3 in Stute et al. (2000) and Theorem 4 in Sant’Anna (2020), using an external resample of Once we generate random numbers independently of the data with mean , variance , and finite third moment, the “resampled” , with , forms a basis to compute the bootstrap analog of based on the asymptotic linearization (4.7),
| (4.10) |
where
is the bootstrap version of .
Theorem 4.3
Let the assumptions of Theorem 4.2 hold. Then, for , we have that converges in distribution under the bootstrap law to , with probability 1.
The theorem follows by checking the conditional version of the Linderberg-Levy conditions to show that, with probability 1, converges in distribution to under the bootstrap law, i.e., conditional on the data, with probability 1.
Next, we strengthen the pointwise results in Theorems 4.2 and 4.3 to hold uniformly in . Towards this end, let the space be the set of all vectors of bounded functions on , that is, all the functions’ vectors such that can be either an Euclidean or a functional space. We interpret the multivariate empirical process indexed by functions in as a random element in the metric space endowed with the sup-norm. The empirical process is indexed by ; in this case where is the compact interval of of interest. But can also be interpreted as an empirical process indexed by the class of functions in this case . The random process is viewed as a random element of the metric space or where is the compact subset of we are interested in.
In order to establish the weak convergence of as a random element of the metric space , we impose the following additional assumption, which is also assumed in Chernozhukov et al. (2013).
Assumption 4.7
The duration interval of interest is a compact subset of and the conditional distribution function admits a Lebesgue density that is uniformly bounded and uniformly continuous in with probability 1.
Notice that a.s., where Therefore, assuming that is a proper probability density may not be innocuous. In practice, should be bounded by the minimum and maximum value of the observed uncensored duration.
Let be a centered tight Gaussian element of with matrix of variance and covariance functions
with defined in (4.6).
Theorem 4.4
This functional CLT is proved extending Chernozhukov et al. (2013) (CFM henceforth) strategy to our setup. To this end, we first show, using Stute (1995, 1996) lemmata, that the score function and are asymptotically equivalent in the metric space , i.e.,
where is a with Hájek projection . Then, we show that
applying asymptotic results for U-process in Arcones and Giné (1993, 1995). Since the class of functions is Donsker,
converges weakly in . Then, noticing that Assumptions 4.4 - 4.7 imply Assumption DR in CFM, the functional , with , is continuously differentiable for each with which is invertible. Then, according to CFM’s Lemma E.3,
with . This result and ’s Donskerness prove the theorem.
A bootstrap version of this theorem follows by applying the multiplier CLT (see sections 2.6 and 3.6 in van der Vaart and Wellner, 1996).
Theorem 4.5
Suppose the assumptions of Theorem (4.4) hold. Then, with probability 1 converges weakly under the bootstrap law to in
In next section we discuss applications of these results to test restrictions on , as well as to make inferences on counterfactual distributions and on average distribution marginal effects.
5 Applications
5.1 Testing Linear and Nonlinear Hypothesis
A natural class of hypotheses to be tested is those of the form
for some compact subset of where , is a continuously differentiable map with derivatives such that for all in a neighborhood of . For instance, when , the null and alternative reads
which is a significance test for varying coefficients. We can also test that a linear combination of coefficients is satisfied, e.g., , where and are known and .
A natural statistic is,
By the delta-method, and applying Theorem 4.4, uniformly in
and under
Since the distribution depends on and other unknown features of the underlying data generating process, analytical critical values seems unfeasible, at least with this level of generality. However, critical values can be estimated using the bootstrapped estimator of
Applying Theorem 4.5, uniformly in for almost every sample, it follows that
Therefore, we can use the bootstrap test statistic
| (5.1) |
By Theorem 4.5, under , with probability 1, converges in distribution under the bootstrap law to . Under with probability 1.
We now describe a practical bootstrap algorithm to conduct such types of tests.
Algorithm 5.1 (Bootstrapped-based hypothesis testing)
-
Step 1.
Generate from a distribution with mean 0, variance 1 and finite third moment, e.g., Rademacher distribution.
-
Step 2.
For a grid , compute as in (4.10), using the same for all ’s.
-
Step 3.
Compute the bootstrap test statistics in (5.1)
-
Step 4.
Repeat steps 1-3 times.
-
Step 5.
Reject at the of significance if either , where is the empirical -quantile of the bootstrap draws of , or if p-val, where
An interesting application of this type of test is to testing constancy of some functional of . For instance, one can set
to test that all the slope coefficients are constant. A test statistic for this hypothesis is
with , being a known probability measure.333In practice, one can set to be equal to the empirical distribution of the censored outcome , though, in this case, the bootstrap procedure needs to be adjusted to account for this additional source of randomness. See Section 5.3 for related results. Bootstrap critical values can be obtained using the bootstrapped statistic,
with .
5.2 Inferences on
Theorems 4.4 and 4.5 can also be applied to make inferences on . The DR estimator is
with bootstrap analog,
The asymptotic distribution can be obtained using the delta-method. Applying Theorem 4.4, we have that
where is a compact subset of . Likewise, applying Theorem 4.5, with probability 1,
Given two samples , under some standard overlap conditions, we can use the conditional CDF estimator computed using sample 1, , to compute the marginal counterfactual CDF of population 1 with respect to population 2,
5.3 Average Distribution Marginal Effects
Although provides useful information about the direction/sign of the effect of changes in on in general, may not have a clear economic interpretation. In this section, we argue that this potential limitation can be easily avoided by focusing on the average distribution marginal effects (ADME) of ,444 To avoid cumbersome notation, we consider the case where the covariates are continuous, and enter the distribution regression model linearly. The asymptotic validity of all our results do not rely on this simplification.
| (5.2) |
The ADME is the distributional analogue of the popular average partial effects. From (5.2), it is clear that he natural estimator for is
In what follows, we derive the asymptotic properties of . As in Theorem 4.4, we first show that, uniformly in ,
| (5.3) |
where
with is as defined in (4.2), with , , , the vector of zero, and the -dimensional identity matrix.
Let be a centered tight Gaussian element of with matrix of variance and covariance functions
Consider the bootstrapped estimator for the ADME
| (5.5) |
where random numbers are random variables with mean and variance , generated independently of the sample, and
Theorem 5.6
Suppose that the conditions of Theorem 4.4 hold. Then,
In addition, if follows that converges weakly under the bootstrap law to in , with probability one.
We now describe a practical bootstrap algorithm to compute simultaneous confidence intervals for the ADME associated with a given covariate
Algorithm 5.2 (Bootstrapped Simultaneous Confidence Intervals)
-
Step 1.
Generate from a distribution with mean 0, variance 1 and finite third moment, e.g., Rademacher distribution.
-
Step 2.
For a grid , compute as in (5.5), using the same for all ’s.
-
Step 3.
Let and be the vectorized and , respectively, denote their --element by and , and compute
-
Step 4.
Repeat steps 1-3 times.
-
Step 5.
For each bootstrap draw, compute
-
Step 6.
Construct as the empirical -quantile of the bootstrap draws of .
-
Step 7.
Construct the bootstrapped simultaneous confidence band for , as .
6 Simulation Studies
In this section, we briefly summarize the simulation results discussed in Section LABEL:MC-appendix of the Supplementary Appendix. In short, we compare the finite sample performance of the proposed KMDR estimators with those based on the proportional hazard (PH) model and on the proportional odds (PO) model. We consider three different data generating processes (DGPs): one DGP that satisfies the PH but not the PO assumption, one DGP that satisfies the PO but not the PH assumption, and one DGP where both PH and PO assumptions are violated, though it admits a DR specification with time-varying slope coefficient. We consider different levels of random censoring, and compare the KMDR, PH and PO models based on the conditional CDF, , and the ADME as defined in (5.2). Both functionals have a clear economic interpretation.
Overall, the simulation results highlight that our proposed KMDR estimators performs nearly as well as the PH and PO model when these models are correctly specified, since KMDR nests both PH and PO specifications. On the other hand, when PH and PO models are misspecified, the proposed KMDR estimators performs better than these other popular specifications. Such gains are especially noticeable when one is interested in the ADME; see Table LABEL:tab:dgp3. When comparing DR specifications with different link functions, we notice that estimators that use the cloglog link function tend to be more robust against model misspecifications than those based on the logit link function. This is perhaps because the cloglog link function is asymmetric and adapts better to the non-central parts of the distribution where there are many zeros (left tail) or many ones (right tail). Thus, we recommend favoring the cloglog specification in detriment of the logit one, though a more formal discussion about such choices are beyond the scope of this paper.
7 The effect of unemployment benefits on unemployment duration
One of the main concerns of the design of unemployment insurance policies is their adverse effect on unemployment duration. The prevailing view of the economics literature is that increasing unemployment insurance (UI) benefits leads to higher unemployment duration driven by a moral hazard effect: higher UI increases the agent’s reservation wage and reduces the incentive to job search, see, e.g., Krueger and Meyer (2002) and the references therein. Given that moral hazard leads to a reduction of social welfare, this argument has been used against increases in UI benefits.
In a seminal paper, Chetty (2008) challenges the traditional view that the link between unemployment benefits and duration is only because of moral hazard. He shows, among many other things, that distortions cause by UI on search behavior are mostly due to a “liquidity effect”. In simple terms, UI benefits provide cash-in-hand that allows liquidity constrained agents to equalize the marginal utility of consumption when employed and unemployed. Such a liquidity effect reduces the pressure to find a new job, leading to longer unemployment spells. However, in contrast to the moral hazard effect, the liquidity effect is a socially beneficial response to the correction of market failures. Thus, if one finds support in favor of liquidity effects, increases in UI benefits may lead to improvements in total welfare.
In this section, we provide additional evidence of the existence of this liquidity effect by comparing the effect of UI on household that are liquidity constrained with those that are unconstrained. In contrast to Chetty (2008), we do not rely on the Cox proportional hazard model but rather use our proposed KMDR tools. In this context, the Cox hazard model might be too rigid as does not allow for the effect of UI benefits to vary depending on whether a worker is starting their unemployment claim or they have been unemployed for a while. As we argued before, our proposed tools allow for this richer types of heterogeneity.
As in Chetty (2008), our data comes from the Survey of Income and Program Participation (SIPP) for the period spanning 1985-2000. Each SIPP panel surveys households at four-month intervals for two-four years, collecting information on household and individual characteristics, as well as employment status. The sample consists of prime-age males who have experienced job separation and report to be job seekers, are not on temporary layoff, have at least three months of work history in the survey and took up unemployment insurance benefits within one month after job loss. These restrictions leave 4,529 unemployment spells in the sample, 21.3% of those being right-censored. Unemployment durations are measured in weeks while individuals’ UI benefits are measured using the two-step imputation method described in Chetty (2008). For further details about the data, see Chetty (2008).
To analyze the effect of UI benefits on unemployment duration, we estimate the DR model
| (7.1) |
where is the complementary log-log link function, is the worker’s weekly unemployment insurance benefits, and is a vector of controls including the worker’s age, years of education, marital status dummy, logged pre-unemployment annual wage, and total wealth. To control for local labor market conditions and systematic differences in risk and performance across sector types, also includes the state average unemployment rate and dummies for industry. We note that Chetty (2008) considers additional controls, including state, year and occupation fixed effects, resulting in a specification with almost 90 unknown parameters. For this reason, we adopt a more parsimonious specification described above. Let , and .
Our main goal is to understand the effect of changes in UI on the probability of one finding a job in weeks, where Although the sign of indicates the direction of such a change, its magnitude may not have a straightforward economic interpretation. Thus, we focus on the ADME of ,
| (7.2) |
which is easy to interpret. For instance, an estimate of equal to 0.1 suggests that, on average, raising unemployment benefits by one percent increases the probability of finding a job in weeks or less by 0.1 percentage point. As discussed in Theorem 3, we can estimate by
| (7.3) |
where , and is the KMDR estimator of . When is the cloglog link function, .
In what follows, we multiply the estimators of ADME by 10, which is interpreted as the effect of a 10% increase in UI benefits. Figure LABEL:fig.amde1 reports the estimates for the full sample (solid line), together with the 90 percent bootstrapped pointwise, and simultaneous confidence intervals (dark and light shaded area, respectively) computed using Algorithm 5.2.
The result reveals interesting effects. On average, a 10% increase in UI benefits appears to have no effect on the probability of a worker finding a job in the first seven weeks of the unemployment spell. Nonetheless, Figure LABEL:fig.amde1 shows that a change in UI is associated with a reduction of the probability of finding a job in the first weeks. Such an effect seems to be monotone until week 18, where a 10% increase in UI is associated with a two-percentage-point decrease in the average probability of finding a job until that week. After week 18, the effect of an increase in UI benefits on employment probabilities seems to weaken but remains statistically significant at the 10% level, except for . Note that the bootstrap simultaneous confidence interval is slightly wider than the pointwise one. However, it is important to mention that the bootstrap uniform confidence interval is designed to contain the entire true path of the ADME 90% of the time, which is in sharp contrast to the bootstrap pointwise confidence interval. This highlights the practical appeal of using simultaneous instead of pointwise inference procedures to better quantify the overall uncertainty in the estimation of all ADMEs. Overall, Figure LABEL:fig.amde1 shows that although an increase in UI benefits is close to zero at the beginning of the unemployment spell, they have an U-shaped effect on the unemployment duration distribution. Interestingly, estimates of ADME based on the Cox PH model with the same set of covariates as in (7.1) suggests that the effect of UI on unemployment duration distribution is monotone for . However, once the proportional hazard specification is tested using either Grambsch and Therneau (1994) procedure or our bootstrap-based testing procedure for the null hypothesis that all are constant in , as described in Section 5.1, the null of proportionality is rejected at the usual significance levels555The p-value associated with our proposed test statistics is 0.004., implying that, indeed, a proportional hazard model may not be appropriate for this application. Our KMDR model does not rely on such an assumption.
Although the results in Figure LABEL:fig.amde1 show that, on average, changes in UI have a U-shaped effect on the unemployment duration distribution, the analysis remains silent about the liquidity effects. To shed light on the importance of the liquidity effect relative to the moral hazard effect, Chetty (2008) argues that one can compare the response to an increase in UI benefits of workers who are not financially constrained with those who are constrained. Given that unconstrained workers have the ability to smooth consumption during unemployment, liquidity effects are absent and UI benefits lengthen unemployment duration only via moral hazard effects for these subgroup of individuals. To pursue this logic, we follow Chetty (2008) and use two proxy measures of liquidity constraint: liquid net wealth at the time of job loss (“net wealth”) and an indicator for having to make a mortgage payment. Chetty (2008) argues that workers with higher net wealth are less sensitive to UI benefit levels because they are less likely to be financially constrained. Similarly, workers that have to make mortgage payments before job loss have less ability to smooth consumption during unemployment because they are unlikely to sell their homes during the unemployment spell, whereas renters can adjust faster. To assess the role of liquidity effects, we divide the entire sample into four subsamples: workers with net wealth below the median, workers with net wealth above the median, workers with a mortgage, and workers without a mortgage. For each subsample, we estimate (7.1) using the KMDR approach, its corresponding estimator of ADME, as in (7.3), and construct 90% bootstrap pointwise and simultaneous confidence intervals.
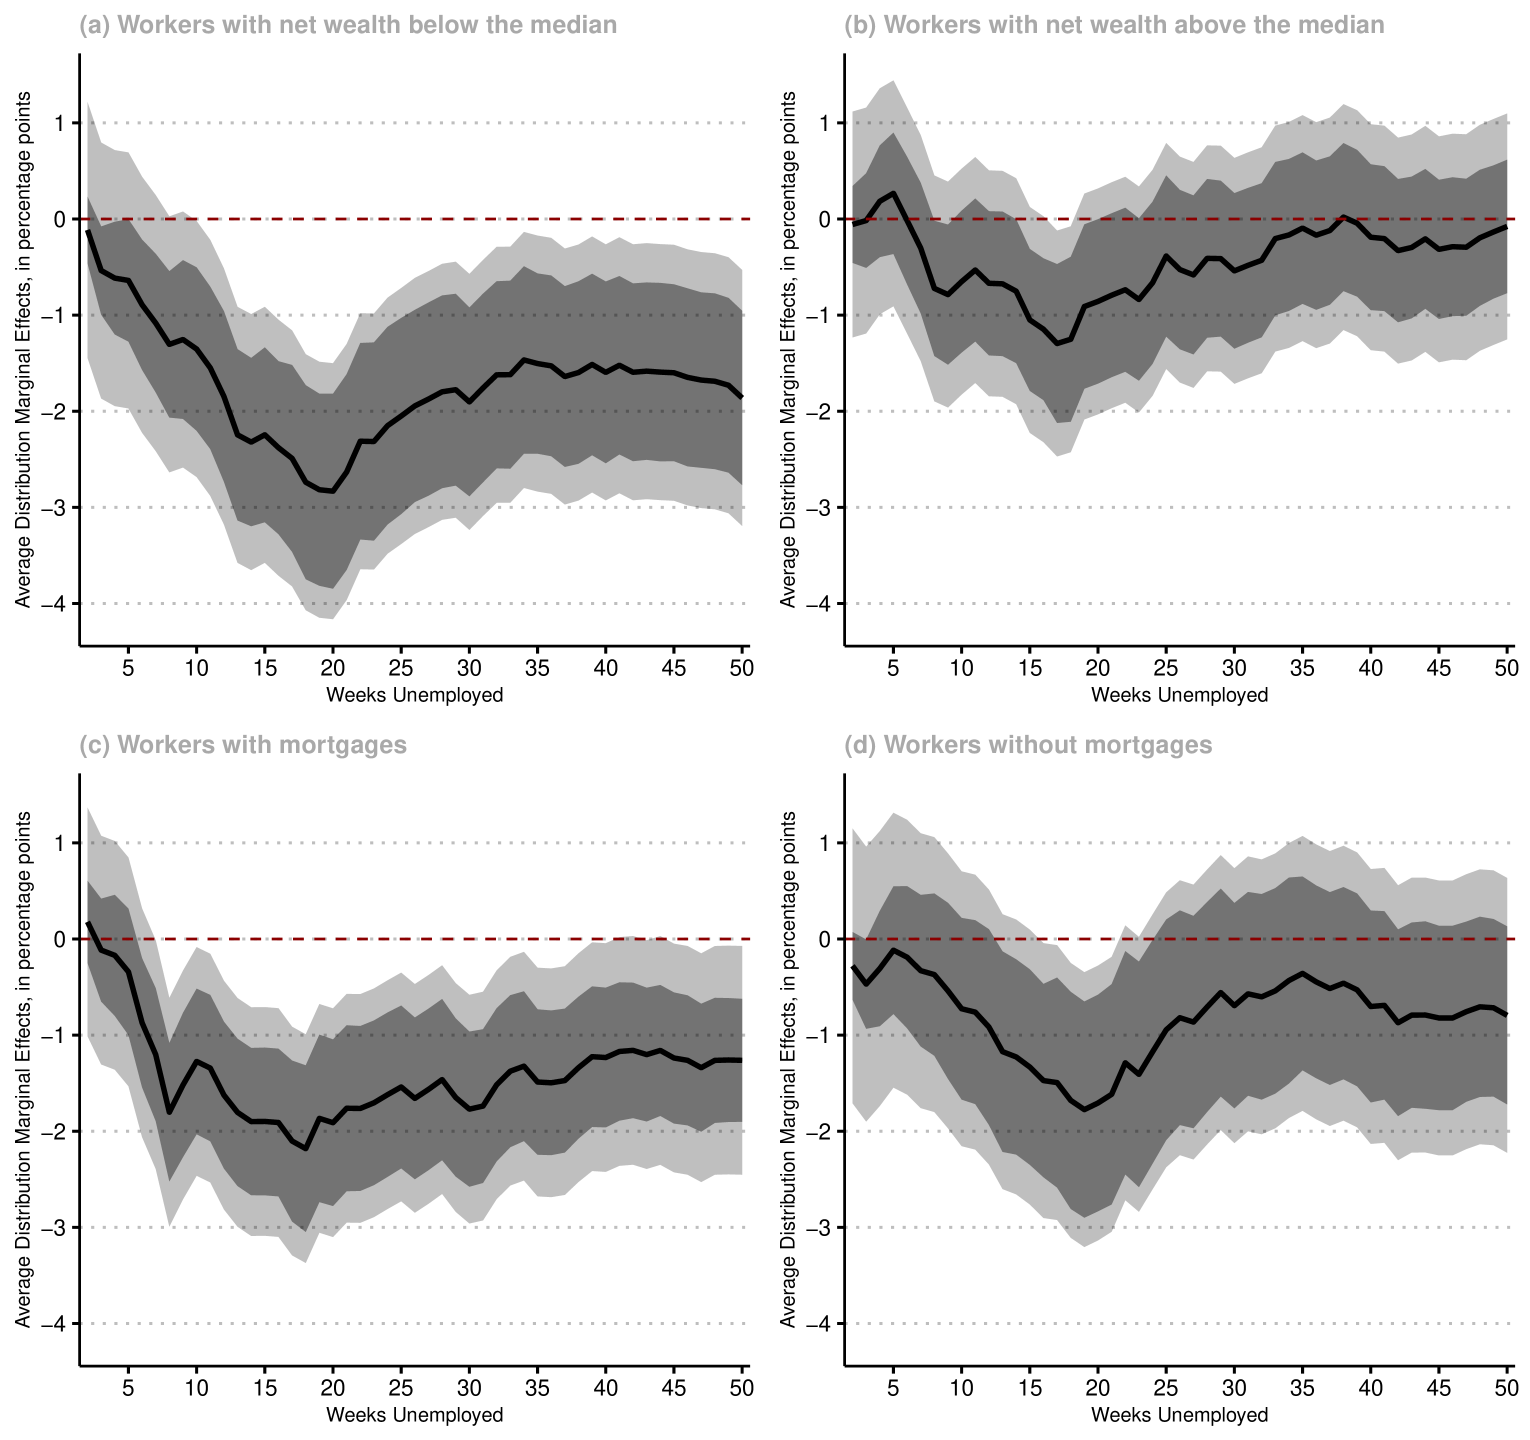
Figure 1 reports the average effects of a 10% increase in UI benefits on the unemployment duration distribution in each of the four subsamples. The solid lines are the point estimates and the dark and light shaded areas are the 90% bootstrap pointwise and simultaneous confidence intervals, respectively.
The results show interesting heterogeneity of UI benefits effects with respect to liquidity constraint proxies. For those workers with net wealth above the median, an increase in UI benefits has no statistically significant effect on the unemployment duration distribution, except for . Thus, for those workers who are not constrained (and, therefore, for whom the liquidity effect is approximately zero), the moral hazard effect seems to be close to zero. On the other hand, for those workers with net wealth below the median, an increase in UI benefits is associated with lower probabilities of finding a job. The conclusion using mortgage as a proxy for liquidity constraint is qualitatively the same. Note that our analysis suggests that the ADME of an increase of UI is non-monotone across the unemployment duration distribution, highlighting the flexibility of the DR approach. Indeed, using our proposed test for all slope coefficients being constant, the proportional hazard specification is rejected at the 10% significance levels in each subsample.
In other to further highlight that the effect of UI benefits on unemployment duration is different depending on whether a worker is likely to be liquidity constrained or not, in Figure 2 we plot the difference of the estimated ADME between liquidity constrained and not-liquidity constrained workers, together with their pointwise and simultaneous confidence bands. Panel (a) suggests that UI benefits have a more negative effect on workers with net wealth below the median than on wealthier workers, and that this difference is statistically significant at the 10% level. Panel (b) reveals a qualitatively similar pattern when one compared workers with mortgage with those without mortgage, though the magnitude of this difference is less pronounced (but we can still reject the null hypothesis that the effects are the same, at the 10% significance level.)
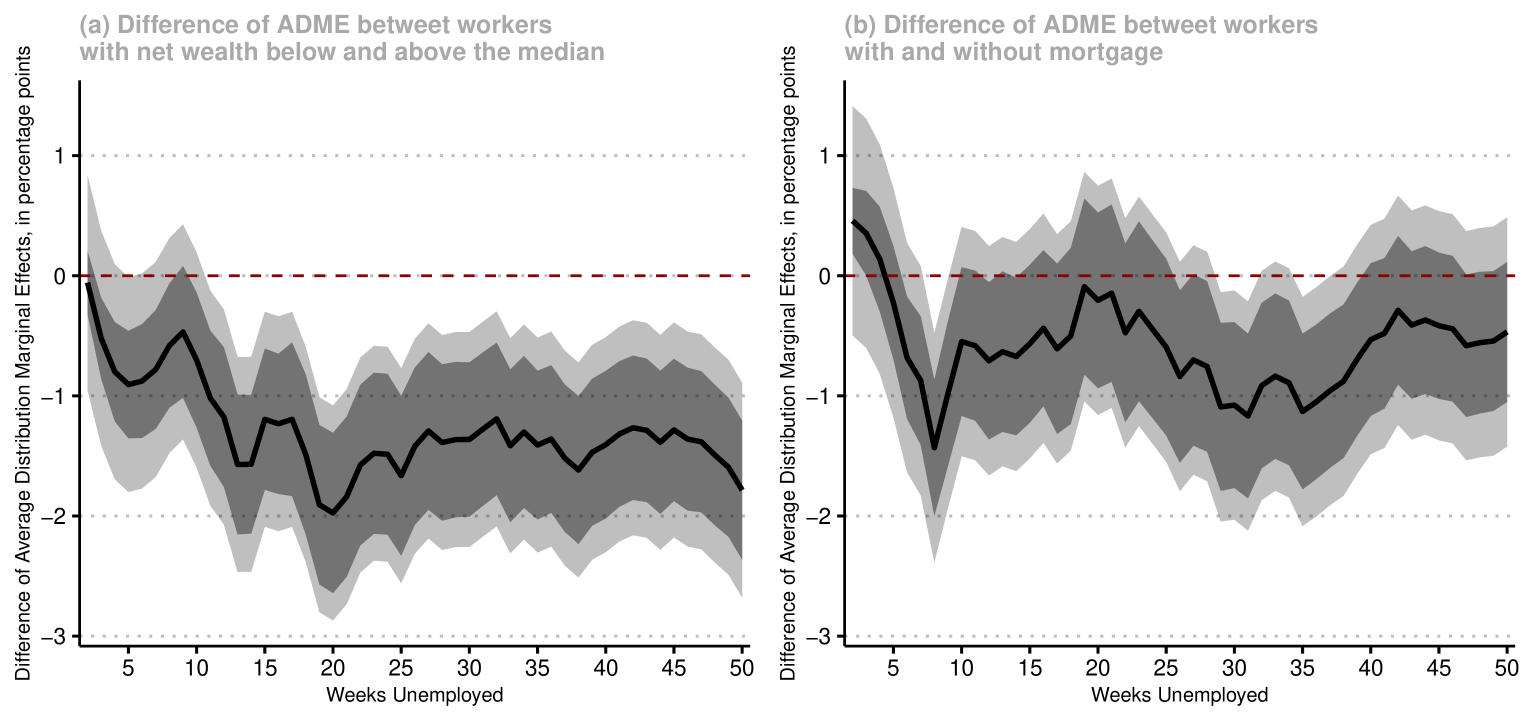
Taken together, our results provide suggestive evidence that UI benefits have a non-monotone effect on the unemployment duration distribution and that such an effect varies whether workers are likely to be liquidity constrained or not. More precisely, our results suggest that the effect of UI on unemployment duration is larger for liquidity constrained workers. Through the lens of the results of Chetty (2008), our findings suggest that an increase in UI benefits affects unemployment duration not only through moral hazard but also because of a “liquidity effect.”
Acknowledgements
We are most grateful to the editor and two referees for their constructive comments which have lead to a improved paper. Research funded by Ministerio Economía y Competitividad (Spain), ECO2-17-86675-P, and by Comunidad de Madrid (Spain), MadEco-CM S2015/HUM-3444. Andrés García-Suaza was supported by the Colombia Científica-Alianza EFI Research Program, with code 60185 and contract number FP44842-220-2018, funded by The World Bank through the call Scientific Ecosystems, managed by the Colombian Ministry of Science, Technology and Innovation. Part of this article was written when Pedro H. C. Sant’Anna was visiting the Cowles Foundation at Yale University, whose hospitality is gratefully acknowledged.
References
- Aalen (1980) Aalen, O. O. (1980). Lecture Notes in Statistics – Proceedings. In W. Klonecki, A. Kozek, and J. Rosinski (Eds.), Lecture Notes in Statistics, Volume 2, pp. 1–25. New York: Springer.
- Amemiya (1985) Amemiya, T. (1985). Advanced Econometrics. Cambridge: Harvard University Press.
- Arcones and Giné (1993) Arcones, M. A. and E. Giné (1993, jul). Limit Theorems for $U$-Processes. The Annals of Probability 21(3), 347–370.
- Arcones and Giné (1995) Arcones, M. A. and E. Giné (1995). On the law of the iterated logarithm for canonical U-statistics and processes. Journal of Theoretical Probability 58, 217–245.
- Armstrong and Sloan (1989) Armstrong, B. G. and M. Sloan (1989). Ordinal regression models for epidemiologic data. American Journal of Epidemiology 129, 191–204.
- Bennett (1983) Bennett, S. (1983). Analysis of survival data by the proportional odds model. Statistics in Medicine 2, 273–277.
- Chen and Lo (1997) Chen, K. and S.-H. Lo (1997). On the rate of uniform convergence of the product-limit estimator: strong and weak laws. Annals of Statistics 25, 1050–1087.
- Chen and Ying (1996) Chen, K. and Z. Ying (1996). A counterexample to a conjecture concerning the Hall-Wellner band. Annals of Statistics 24, 641–646.
- Cheng et al. (1995) Cheng, S. C., L. J. Wei, and Z. Ying (1995). Analysis of transformation models with censored data. Biometrika 82, 835–845.
- Chernozhukov et al. (2019) Chernozhukov, V., I. Fernández-Val, and S. Luo (2019). Distribution Regression with Sample Selection, with an Application to Wage Decompositions in the UK. arXiv preprint arXiv: 1811.11603, 1–50.
- Chernozhukov et al. (2013) Chernozhukov, V., I. Fernández-Val, and B. Melly (2013). Inference on counterfactual distributions. Econometrica 81, 2205–2268.
- Chernozhukov et al. (2020) Chernozhukov, V., I. Fernández-Val, and M. Weidner (2020). Network and Panel Quantile Effects Via Distribution Regression. Journal of Econometrics Forthcoming, 1–28.
- Chetty (2008) Chetty, R. (2008). Moral Hazard versus Liquidity and Optimal Unemployment Insurance. Journal of Political Economy 116, 173–234.
- Clayton (1976) Clayton, A. D. G. (1976). An Odds Ratio Comparison for Ordered Categorical Data with Censored Observations. Biometrika 63, 405–408.
- Cox (1975) Cox, D. (1975). Partial Likelihood. Biometrika 62, 269–276.
- Cox (1972) Cox, D. R. (1972). Regression models and life-tables (with discussion). Journal of the Royal Statistical Society: Series B (Statistical Methodology) 34, 187–220.
- Doksum and Gasko (1990) Doksum, K. and M. Gasko (1990). On a correspondence between models in binary regression and survival analysis. International Statistical Review 58, 243–252.
- Foresi and Peracchi (1995) Foresi, S. and F. Peracchi (1995). The conditional Distribution of Excess Returns : The Conditional Distribution An Empirical Analysis. Journal of the American Statistical Association 90, 451–466.
- Grambsch and Therneau (1994) Grambsch, P. and T. Therneau (1994). Proportional hazards tests and diagnostics based on weighted residuals. Biometrika 81, 515–526.
- Guo and Zeng (2014) Guo, S. and D. Zeng (2014). An overview of semiparametric models in survival analysis. Journal of Statistical Planning and Inference 151-152, 1–16.
- Honore et al. (2002) Honore, B., S. Khan, and J. Powell (2002). Quantile regression under random censoring. Journal of Econometrics 109, 67–105.
- Hothorn et al. (2014) Hothorn, T., T. Kneib, and P. Bühlmann (2014). Conditional transformation models. Journal of the Royal Statistical Society: Series B (Statistical Methodology) 76, 3–27.
- Kalbfleisch and Prentice (1980) Kalbfleisch, J. D. and R. L. Prentice (1980). The statistical analysis of failure time data (2nd ed.). Hoboken, NJ: Wiley.
- Kaplan and Meier (1958) Kaplan, E. L. and P. Meier (1958). Nonparametric estimation from incomplete observations. Journal of the American Statistical Association 53, 457–481.
- Krueger and Meyer (2002) Krueger, A. B. and B. D. Meyer (2002). Labor supply effects of social insurance. In A. J. Auerbach and M. Feldstein (Eds.), Handbook of Public Economics, Volume 4, Chapter 33, pp. 2327–2392. Amsterdam: North-Holland: Elsevier.
- McCullagh (1980) McCullagh, P. (1980). Regression Models for Ordinal Data. Journal of the Royal Statistical Society. Series B (Methodological) 42, 109–142.
- Murphy et al. (1997) Murphy, S. A., A. J. Rossini, and A. W. VanderVaart (1997). Maximum likelihood estimation in the proportional odds model. Journal of the American Statistical Association 92, 968–976.
- Peng and Huang (2008) Peng, L. and Y. Huang (2008). Survival Analysis With Quantile Regression Models. Journal of the American Statistical Association 103, 637–649.
- Portnoy (2003) Portnoy, S. (2003). Censored Regression Quantiles. Journal of the American Statistical Association 98, 1001–1012.
- Robins and Rotnitzky (1992) Robins, J. M. and A. Rotnitzky (1992). Recovery of Information and Adjustment for Dependent Censoring Using Surrogate Markers. In AIDS Epidemiology, pp. 297–331. Boston, MA: Birkhäuser Boston.
- Robins and Rotnitzky (1995) Robins, J. M. and A. Rotnitzky (1995). Semiparametric Efficiency in Multivariate Regression Models with Missing Data. Journal of the American Statistical Association 90, 122–129.
- Rothe and Wied (2013) Rothe, C. and D. Wied (2013). Misspecification Testing in a Class of Conditional Distributional Models. Journal of the American Statistical Association 108, 314–324.
- Rothe and Wied (2019) Rothe, C. and D. Wied (2019). Estimating Derivatives of Function-Valued Parameters in a Class of Moment Condition Models. Journal of Econometrics Forthcoming, 1–19.
- Sant’Anna (2020) Sant’Anna, P. H. C. (2020). Nonparametric Tests for Treatment Effect Heterogeneity with Duration Outcomes. Journal of Business and Economic Statistics Forthcoming, 1–17.
- Stute (1993) Stute, W. (1993). Consistent estimation under random censorship when covariables are present. Journal of Multivariate Analysis 45, 89 – 103.
- Stute (1994) Stute, W. (1994). The bias of Kaplan-Meier integrals. Scandinavian Journal of Statistics 21, 475–484.
- Stute (1995) Stute, W. (1995). The central limit theorem under random censorship. Annals of Statistics 23, 422–439.
- Stute (1996) Stute, W. (1996). Distributional convergence under random censorship when covariables are present. Scandinavian Journal of Statistics 23, 461–471.
- Stute (1999) Stute, W. (1999). Nonlinear censored regression. Statistica Sinica 9, 1089–1102.
- Stute et al. (2000) Stute, W., W. González-Manteiga, and C. . Sánchez Sellero (2000). Nonparametric model checks in censored regression. Communications in Statistics - Theory and Methods 29, 1611 – 1629.
- Tsiatis (1975) Tsiatis, A. A. (1975). A nonidentifiability aspect of the problem of competing risks. Proceedings of the National Academy of Sciences of the United States of America 72, 20–22.
- Tsiatis (1981) Tsiatis, A. A. (1981). A large sample study of Cox’s regression model. Annals of Statistics 9, 93–108.
- van den Berg (1990) van den Berg, G. (1990). Nonstationarity in Job Search Theory. Review of Economic Studies 57, 255–277.
- van der Vaart (1998) van der Vaart, A. W. (1998). Asymptotic Statistics. Cambridge: Cambridge University Press.
- van der Vaart and Wellner (1996) van der Vaart, A. W. and J. A. Wellner (1996). Weak Convergence and Empirical Processes. New York: Springer.
- Wang and Wang (2009) Wang, H. J. and L. Wang (2009). Locally weighted censored quantile regression. Journal of the American Statistical Association 104, 1–32.
- Wooldridge (2007) Wooldridge, J. M. (2007). Inverse probability weighted estimation for general missing data problems. Journal of Econometrics 141, 1281–1301.
- Ying et al. (1995) Ying, Z., S. Jung, and L. Wei (1995). Survival analysis with median regression models. Journal of the American Statistical Association 90, 178–184.