Do Online Courses Provide an Equal Educational Value Compared to In-Person Classroom Teaching? Evidence from US Survey Data using Quantile Regression
Abstract
Education has traditionally been classroom-oriented with a gradual growth of online courses in recent times. However, the outbreak of the COVID-19 pandemic has dramatically accelerated the shift to online classes. Associated with this learning format is the question: what do people think about the educational value of an online course compared to a course taken in-person in a classroom? This paper addresses the question and presents a Bayesian quantile analysis of public opinion using a nationally representative survey data from the United States. Our findings show that previous participation in online courses and full-time employment status favor the educational value of online courses. We also find that the older demographic and females have a greater propensity for online education. In contrast, highly educated individuals have a lower willingness towards online education vis-à-vis traditional classes. Besides, covariate effects show heterogeneity across quantiles which cannot be captured using probit or logit models.
JEL codes: A20, C11, C31, C35, I20, I29
keywords:
Bayesian quantile regression, binary quantile regression, COVID-19, educational value, Gibbs sampling, public opinion, Pew Research Center.1 Introduction
Advancements in technology have resulted in a proliferation of online educational opportunities over the last two decades. Allen and Seaman (2016) report that the growth rate of enrolments in online courses is expanding faster than the traditional classroom enrolments in the United States (US).111Roughly one in two individuals who have graduated in the last ten years have taken at least one online course in their degree program (Parker et al., 2011). Even as academic leaders remain far more positive about traditional and blended pedagogical formats than fully online learning, the outbreak of the COVID-19 pandemic has acted as a catalyst in establishing online education as an immediate substitute for in-person classrooms. This paradigm shift in education has drawn considerable attention from the media, and researchers across the globe. However, any research based on the acceptance of online education during this period of disturbance is likely to be a deviation from the natural relationship between education and technology. Instead, as institutions of higher learning integrate web-based tools into classroom instructions, we assert that it is more important to assess the attitude towards digital education and its acceptance in a state of equilibrium prior to the onset of the pandemic. With that in mind, in this paper, we analyse public opinion on the value of online education relative to traditional education using survey data from the Pew Social Trends and Demographics Project conducted by the Princeton Survey Research Associates International in 2011.
In the early 2000s, despite significant skepticism from academics and pushback from the public, several universities invested in and adopted Massive Open Online Course (MOOCs) as a teaching-learning format (Miller, 2014). Educational institutions today are compelled to rethink their pedagogical philosophies to incorporate either hybrid or fully-online teaching-learning formats, as a consequence of the ongoing pandemic. Students graduating in the current era have experienced some education using technology, either as a supplement to traditional classes, or as fully online courses. Correspondingly, faculty is expected to have the willingness and the ability to engage in pedagogy that utilises technology (Miller, 2014). While this trend towards instructional technology expands, there are ambivalent perceptions about the quality of online education (Chen et al., 2013; Otter et al., 2013; Allen and Seaman, 2011). Therefore, we specifically address public opinion about the value of online education and the factors that influence it vis-à-vis traditional classes, using a Bayesian quantile analysis.
Modelling public opinion on the value of online education presents a rich area for further study. Over the last few years, a sizeable body of literature on the demand and efficacy of online education, its scope to lower educational costs, student and faculty perceptions, and its impact on student learning outcomes have emerged (Xu and Jaggars, 2013; Goodman et al., 2019; Otter et al., 2013; Cassens, 2010; Bettinger et al., 2017; Figlio et al., 2013; Alpert et al., 2016; Joyce et al., 2015; Krieg and Henson, 2016; Kirtman, 2009). However, much of the existing research focuses on one or two specific courses, or are limited within a selective college or university. For instance, Goodman et al. (2019) compare an online and in-person degree in Master of Science in Computer Science offered at Georgia Tech and document a large demand for the online program with nearly no overlap in the applicant pools. Analysing survey data from a community college in California, Cassens (2010) finds no significant differences in students performances in online and traditional teaching methods. Contrary to this, using data from one large for-profit university, Bettinger et al. (2017) find negative effects of online courses on student academic success and progression relative to in-person courses. On similar lines, Otter et al. (2013) find significant differences upon comparison of faculty and student perceptions of online courses versus traditional courses at a large public university in the south-eastern United States. As such, mixed evidence found owing to the narrow focus of these papers often brings their external validity into question. To this end, we attempt to address the educational value of online classes by utilising a nationally representative US survey data, thereby drawing conclusions for a population at large. This is the first contribution of our paper to the existing literature on online education.
Evidence finds the proportion of faculty who believe in the legitimacy of online education to be relatively low. In addition, the proportion of faculty who perceive online education as more time intensive and requiring greater effort has seen a steady growth (Allen and Seaman, 2011). Contrary to this, students perceive such courses to be largely self-taught with minimal effort from the faculty (Chen et al., 2013; Otter et al., 2013). Such ambiguous views on the issue makes it imperative to investigate overall public opinion on the matter. That being the case, our paper also contributes to a second body of literature that points towards the differential adoption and acceptance of technology in higher education across different demographies (Cooper, 2006; Norum and Weagley, 2006; Chen and Fu, 2009; Cotten and Jelenewicz, 2006; Odell et al., 2000; Jones et al., 2009). Given that online education is a matter of individual selection, individual characteristics may vary drastically across the utility derived from it. Traditional mean regression of the effects of covariates on the preference about online classes may mask important heterogeneity in individual choices. Our study is the first, of which we are aware, to offer new insights regarding the opinion on the educational value of online courses across the quantiles and latent utility scale. These differential effects across the latent utility scale may be of direct interest to policy makers and educationists as our methodology provides a more comprehensive picture.
Utilising a nationally representative US survey data from the Pew Social Trends and Demographics Project conducted in the year 2011, we examine individual responses about the educational value derived from online classes in comparison to in-person classroom. Our paper presents an empirical application of binary quantile regression to a model of educational decision. More specifically, we model the latent utility differential between online classes and traditional classes. This may be interpreted as a propensity or a willingness index, where higher propensity towards online education are characterised by large positive values and vice versa. The results are compelling and ought to serve as a guide for future research. We find that an older demographic, individuals with full-time employment, individuals with previous online experience, and females display a propensity towards online education. Interestingly, our findings highlight that highly educated respondents have lower willingness for online education. We also note some amount of regional differences in the propensity to value online classes. All these covariates show considerable differences in covariate effects at different quantiles. Lastly, we find no convincing evidence of race or income having an effect on the propensity for online education.
The remainder of the paper is organised as follows. Section 2 outlines the data used for our analysis including a descriptive summary. This is followed by Section 3 that outlines a model of quantile regression for binary outcomes and presents a Markov chain Monte Carlo (MCMC) algorithm for its estimation. Next, we present the results of our binary quantile regressions in Section 4. Section 5 presents the concluding remarks.
2 Data
The study utilises a nationally representative US survey data from the Pew Social Trends and Demographics Project, conducted over telephone between March , 2011, by the Princeton Survey Research Associates International. The survey was primarily for higher education and housing and contains information on 2,142 adults living in the continental US. We consider a subset of variables from this survey and upon removing missing observations from our variables of interest (see Table 1), we are left with 1,591 observations available for the analysis. The dependent variable is the response to the question: “In general, do you think a course taken only online provides an equal educational value compared with a course taken in person in a classroom, or not?”. Responses are recorded either as “Yes”, “No”, or “Don’t know/Refused”. We ignore the last response category. Of the 1,591 respondents, 505 (31.74%) respondents agree that a course taken online provides an equal educational value compared to in-person classroom teaching, while the remaining 1086 respondents (68.26%) do not agree and thus believe that online courses have lesser educational value. The survey also consists of information on an array of other variables, some of which we utilise as covariates (independent variable) in our analysis. A description of the covariates and the response variable, along with the main characteristic of the data is presented in Table 1.
| variable | description | mean | std |
| Age/100 | Age (in years) divided by 100 | 0.44 | 0.18 |
| Income/100,000 | Mid-point of income category (in US dollars) divided by 100,000 | 0.63 | 0.48 |
| count | percent | ||
| Online Course | Indicates that the respondent has previously taken an online course for academic credit | 352 | 22.12 |
| (Age) Enroll | Indicates that the respondent is of age below 65 and currently enrolled in school | 291 | 18.29 |
| Female | Indicator variable for female gender | 815 | 51.23 |
| Post-Bachelors | Respondent’s highest qualification is Masters, Professional or Doctorate | 221 | 13.89 |
| Bachelors | Respondent’s highest qualification is Bachelors | 356 | 22.38 |
| Below Bachelors | Respondent holds a 2-year associate degree, went to some college with no degree, or attended technical, trade or vocational school after high school | 482 | 30.30 |
| HS and below | Respondent is a high school (HS) graduate or below | 532 | 33.44 |
| Full-time | Indicator for full-time employment | 757 | 47.58 |
| Part-time | Indicator for part-time employment | 240 | 15.08 |
| Unemployed | Indicator for either unemployed, student or retired | 594 | 37.34 |
| White | Indicator for a White respondent | 1131 | 71.09 |
| African-American | Indicator for an African-American respondent | 257 | 16.15 |
| Other Races | Indicator for a respondent who is either an Asian, Asian-American or belongs to some other race | 203 | 12.76 |
| Urban | Lives in an urban region | 626 | 39.35 |
| Suburban | Lives in a suburban region | 760 | 47.77 |
| Rural | Lives in a rural region | 205 | 12.88 |
| Northeast | Lives in the Northeast | 220 | 13.83 |
| West | Lives in the West | 362 | 22.75 |
| South | Lives in the South | 724 | 45.51 |
| Midwest | Lives in the Midwest | 285 | 17.91 |
| Opinion | Respondent answered ‘Yes’ to our question of interest | 505 | 31.74 |
| Respondent answered ‘No’ to our question of interest | 1086 | 68.26 |
In our sample, a typical individual is 44 years of age with a family income of 63 thousand US dollars. The survey recorded income as belonging to one of the following nine income categories: , , , , , , , and , where denotes a thousand dollars. We use the mid-point of each income category to represent the income variable, where $5,000 and $1,75,000 are used as the mid-point for the first and last income categories, respectively. With respect to online learning, we have a little more than one-fifth of the sample who have previously taken an online course for academic credit. A sizeable proportion of the sample, therefore, have had prior exposure to online learning. Individuals who are aged less than 65 and currently enrolled in school comprise a little less than one-fifth of the sample. Here, enrolment in school implies that the respondent is either attending high school, technical school, trade or vocational school, is a college undergraduate or in graduate school.
The sample has more females (51.23%) than males (48.77%), but both genders have approximately equal representation. Education has been classified into four categories with ‘High School (HS) and below’ forming the largest category (33.44%) followed by ‘Below Bachelors’ (30.30%). The smallest two educational categories are ‘Bachelors’ (22.38%) and ‘Post-Bachelors’ (13.89%). So, approximately two-thirds of the sample have less than bachelors education. With respect to employment status, about a little less than two-thirds (i.e., 62.66%) are either employed full-time or part-time, while the remaining percentage are either unemployed, students or retired individuals. Racial classification shows that more than two-thirds are White (71.09%), followed by African-Americans (16.15%) and all other races (12.76%). In terms of rural-urban classification, most of the sampled individuals live in the suburban areas (47.77%), followed by the urban areas (39.35%). The lowest proportion lives in the rural areas (12.88%). Regional classification as defined by the US Census Bureau shows that the largest percentage of the sample live in the South (47.77%). This is followed by the West (22.75%), Midwest (17.91%), and Northeast (13.83%) regions.
Before we formally delve into modelling the dependent variable (i.e., public opinion on educational value of online learning relative to in-person classroom teaching), we explore its relationship with some selected independent variables or covariates (see Parker et al., 2011, for a report on data summary). To explore this association, we present a stacked bar graph in Figure 1 with four panels, each portraying the relationship between the dependent variable and a single covariate. Each bar within a panel corresponds to a category of the covariate and displays the percentage of observations that says ‘Yes’ and ‘No’ to our question of interest. For example, the upper (lower) bar in Panel 1 shows that for people aged greater than (less than equal to) 30, 32.8% (29.5%) of the sample agree that online courses have the same educational value as in-person classroom teaching, while the remaining 67.2% (70.5%) do not agree. The other three panels of Figure 1 can be interpreted analogously.
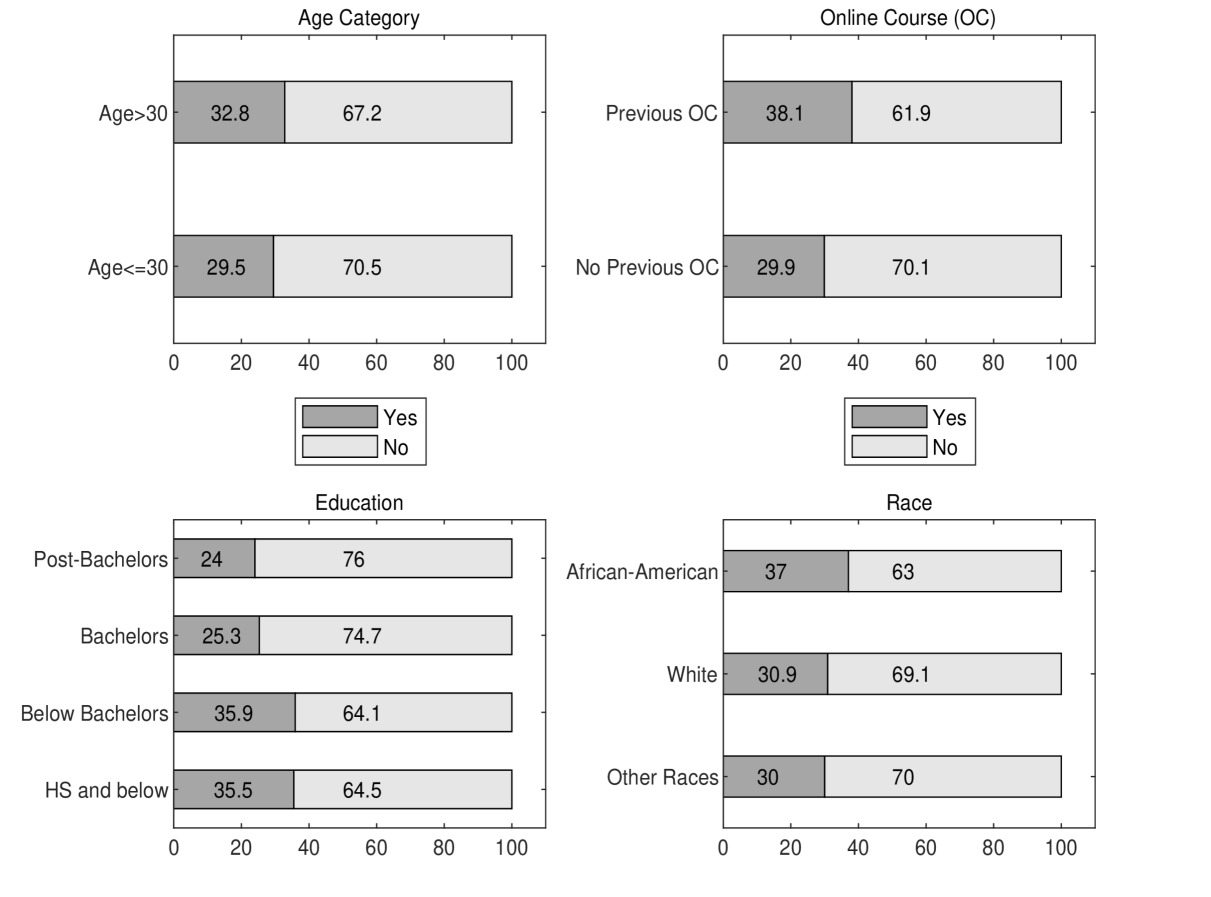
We see from the first panel of Figure 1 that the percentage of sample who says ‘Yes’ (and thus ‘No’) is approximately equal amongst the younger () and older () population. From Panel 2 we note that, amongst the sample who have taken an online course for academic credit, a higher percentage (38.1%) says ‘Yes’ compared to those (at 29.9%) who have no previous online learning experience. Panel 3 suggests that the highly educated group (Bachelors and Post-Bachelors) are less likely to agree (1 in every 4 individual) about the equal educational value of online learning and classroom teaching, as compared to the lower educated group (where 1 in every 3 agrees). Similarly, the racial classification of response shows that the African-Americans are more likely to agree (37%) as compared to White (30.9%) and Other Races (30%).
The discussion involving the stacked bar graph only presents an association between the public opinion on the educational value of online learning relative to in-person classroom teaching and one covariate at a time, namely, age, previous participation in online course, education, and race. Such an association can be captured by regressing the dependent variable on a chosen covariate/regressor. However, inference based on such an analysis is unlikely to present the true relationship because there may be other determinants of the dependent variable which are correlated with the chosen covariate. If ignored, this may lead to estimation bias and incorrect inferences. For instance, let us suppose we are interested in the relationship between public opinion on online learning relative to in-person classroom teaching and the age category. To this end, we regress the dependent variable on age category. However, this relationship is likely to change when we control for previous participation in online course owing to the correlation between previous participation in online course and age. To net out such effects and understand the actual impact of a covariate on the dependent variable, we next turn to some formal econometric modelling.
3 Quantile Regression for Binary Outcomes
Quantile regression, as introduced by Koenker and Bassett (1978), looks at quantiles of the (continuous) response variable conditional on the covariates and thus provides, amongst other things, a comprehensive picture (as compared to traditional mean regression) of the effect of covariates on the response variable. Estimation involves minimizing the quantile loss function using linear programming techniques (Koenker, 2005). Interestingly, the quantile loss function appears in the exponent of the asymmetric Laplace (AL) distribution (Yu and Zhang, 2005), which makes minimization of the quantile loss function equivalent to maximization of the AL likelihood. This characteristic allowed Yu and Moyeed (2001) to construct a working likelihood and propose Bayesian quantile regression. However, when outcomes are discrete (e.g., binary, ordinal) estimation becomes challenging because quantiles for discrete outcomes are not readily defined. With discrete outcomes, the concern is to model the latent utility differential (say, between making a choice versus not making it or occurrence of an event versus its non-occurrence) facilitated through the introduction of a latent variable (Albert and Chib, 1993; Greenberg, 2012; Rahman, 2016). This applies to both mean and quantile regressions and is useful for estimation and inference.
Quantile regression for binary outcomes (or binary quantile regression222Binary quantile regression is a special of ordinal quantile regression considered in Rahman (2016) and can be linked to the random utility theory in economics (Train, 2009; Jeliazkov and Rahman, 2012). For other developments on Bayesian quantile regression with discrete outcomes, please see Alhamzawi and Ali (2018a), Alhamzawi and Ali (2018b), Ghasemzadeh et al. (2018b), Ghasemzadeh et al. (2018a), Rahman and Vossmeyer (2019), Rahman and Karnawat (2019), Bresson et al. (2020).) was introduced in Kordas (2006) and the Bayesian framework was presented in Benoit and Poel (2012). The binary quantile model can be conveniently expressed using the latent variable as follows,
| (1) |
where is a vector of covariates, is a vector of unknown parameters at the -th quantile (henceforth, the subscript is dropped for notational convenience), follows an AL distribution i.e., , and denotes the number of observations. In our study, the latent variable can be interpreted as the latent utility differential between online learning relative to in-person classroom learning. Whenever the observed response (i.e., the respondent answers ‘Yes’ to our question of interest), propensity to online learning is likely to be high and takes a value in the positive part of the real line. Similarly, when (i.e., the respondent answers ‘No’ to our question of interest), the propensity to online learning is low and takes a value in the negative part of the real line.
We can form a working likelihood from equation (1) and directly use it to construct the posterior distribution, but this is not convenient for MCMC sampling. A preferred alternative is to employ the normal-exponential mixture of the AL distribution (Kozumi and Kobayashi, 2011). In this formulation, , and the binary quantile model is re-expressed as,
| (2) |
where and are constants, and is independently distributed of . Here, the notations and denote exponential and normal distributions, respectively. It is clear from formulation (2) that the latent variable , thus allowing access to the properties of normal distribution.
Algorithm 1 (MCMC Algorithm for Binary Quantile Regression)
-
1.
Sample , where,
-
and .
-
2.
Sample , for , where,
-
and .
-
3.
Sample the latent variable for all values of from an univariate truncated normal (TN) distribution as follows,
By the Bayes’ theorem, the complete data likelihood from equation (2) is combined with a normal prior distribution on (i.e., ) to form the complete data posterior. This yields the following expression,
| (4) |
The full conditional posterior densities for can be derived from equation (4) and the model can be estimated using the Gibbs sampler (Geman and Geman, 1984) a well known MCMC technique presented in Algorithm 1. The sampling algorithm is straightforward and involves sampling conditional on from an updated normal distribution. The latent weight conditional on is sampled from a Generalized Inverse Gaussian (GIG) distribution (Devroye, 2014). Finally, the latent variable conditional on is sampled from a truncated normal distribution (Robert, 1995).
4 Results
Table 2 presents the posterior means, and standard deviations of the parameters from the Bayesian estimation of probit model (Albert and Chib, 1993), and the binary quantile regression at the 10th, 25th, 50th, 75th and 90th quantiles. We assume the following diffuse prior distribution: , where and denote a multivariate normal distribution and an identity matrix of dimension , respectively. The results are based on 20,000 MCMC iterations after a burn-in of 5,000 iterations. The inefficiency factors were calculated using the batch-means method (Greenberg, 2012; Chib, 2013). For the five chosen quantiles, they lie in the range , , , , and . The numbers are small which indicates a low cost of working with MCMC draws. Trace plots, not shown, reveal good mixing of the chains. With respect to model comparison measures, we calculate the conditional log-likelihood, Akaike Information Criterion (AIC), and the Bayesian Information Criterion (BIC) at the posterior mean. The corresponding numbers for the probit model is , and those for the five quantiles are , , , , and . We also compute the covariate effects for the statistically significant variables in the probit model and for each of the five quantiles. These are presented in Table 3333The covariate effects for previous online course, full-time employment, post-bachelors, bachelors, Northeast and South are calculated on the respective sub-samples and are a discrete change compared to their base groups respectively. The covariate effect for female is calculated on the full sample and is a discrete change compared to male. and are calculated marginally of the remaining covariates and the parameters (Chib and Jeliazkov, 2006; Jeliazkov et al., 2008; Jeliazkov and Rahman, 2012; Jeliazkov and Vossmeyer, 2018; Rahman and Vossmeyer, 2019; Bresson et al., 2020).
While many of the results are in line with extant literature, our results provide some useful insights into the differences across quantiles. As previously noted, we are modelling the latent utility differential between online and in-person classes. The results therefore, may be interpreted as a utility index of online education. Large positive (negative) values of this index signify high (low) propensity to favour online classes, and values around zero would indicate relative indifference between the two alternatives. A bird’s-eye view of the results shows that age, past online experience, full time employment and gender have a positive effect on the propensity to favour online education. Higher level of educational degree, on the other hand, has a negative effect on the willingness towards online education. We also note some amount of regional variation in the propensity to favour online classes. To better understand the results, we focus on each variable separately.
| quantile | ||||||||||||||||||
|---|---|---|---|---|---|---|---|---|---|---|---|---|---|---|---|---|---|---|
| probit | 10th | 25th | 50th | 75th | 90th | |||||||||||||
| mean | std | mean | std | mean | std | mean | std | mean | std | mean | std | |||||||
| Intercept | ||||||||||||||||||
| Age/100 | ||||||||||||||||||
| Income/100,000 | ||||||||||||||||||
| Sq-Income | ||||||||||||||||||
| Online Course | ||||||||||||||||||
| (Age) Enroll | ||||||||||||||||||
| Female | ||||||||||||||||||
| Post-Bachelors | ||||||||||||||||||
| Bachelors | ||||||||||||||||||
| Below Bachelors | ||||||||||||||||||
| Full-time | ||||||||||||||||||
| Part-time | ||||||||||||||||||
| White | ||||||||||||||||||
| African-American | ||||||||||||||||||
| Urban | ||||||||||||||||||
| Suburban | ||||||||||||||||||
| Northeast | ||||||||||||||||||
| West | ||||||||||||||||||
| South | ||||||||||||||||||
| quantile | ||||||||
|---|---|---|---|---|---|---|---|---|
| probit | 10th | 25th | 50th | 75th | 90th | |||
| Age | ||||||||
| Online Course | ||||||||
| Female | ||||||||
| Post-Bachelors | ||||||||
| Bachelors | ||||||||
| Full-time | ||||||||
| Northeast | ||||||||
| South | ||||||||
The coefficient for age is positive across all quantiles. This is not surprising as online courses invariably attract an older demographic (Crain and Ragan, 2017). Goodman et al. (2019) find similar results highlighting that on average, the online applicants were 34 years of age compared to 24 years for in–person applicants in their study. Besides, our result is perhaps indicative of mid-career professionals favouring online classes since several online courses cater to those active in the workforce, requiring professional development or retaining by employers (Kizilcec et al., 2019). From the calculated covariate effects in Table 3, we see that the covariate effect of age is between 1.7 to 2.2 percentage points across the quantiles. Stronger effects are visible in the upper part of the latent index.
Next, we note that educational value of online classes is favoured positively by individuals with a full-time employment status compared to base category (unemployed, students or retired individuals). The coefficient for full-time employment, compared to the base category, is statistically positive across the quantiles. The coefficients for part-time employment are positive but the effects are not statistically different, implying that regardless of the latent utility for online education, part-time employment does not impact the decision. Our result for full-time employment is in agreement with the evidence that demand for online education is high for employed mid-career professionals, or those who seek professional development (Simmons, 2014; Kizilcec et al., 2019). It appears to be commonplace for employers to sponsor their employees’ enrolment into online courses for training purposes as observed by Goodman et al. (2019) and Deming et al. (2015).444The National Post Secondary Student Aid Study (NPSAS) for 2011-12 that includes a nationally representative cross-section of institutions and students shows that online students are older and more likely to be working full-time while enrolled (Deming et al. (2015). In fact, from Table 3, the covariate effect of full-time employment increases the willingness for online class by 7.8 percentage points in the 10th quantile and consistently increases across quantiles to about 8.7 percentage points in the 90th quantile. For individuals who are in the lower part of the latent index, employment impacts their valuation for online education less than those in the upper quantile.
Turning to previous exposure to digital learning, we find that individual’s propensity of valuing online education is higher for those who have had past participation in online classes for academic credit than those who have not. We find positive effects of previous exposure to online education across the quantiles of the utility scale. Astani et al. (2010); Williams (2006); Goode (2010) show similar evidence that previous online experience changes the perceptions about an online learning environment. A positive stance towards online education is therefore undeniably linked to previous exposure and use of technology. The covariate effect of previous online class ranges between 9.5 to 11.1 percentage points across the quantiles (See Table 3). Although the effect somewhat plateaus at the 75th quantile, our findings suggest that past online experience increases the probability of valuing online classes most for those with higher utility for online education.
We also find that females are more in favour of online education relative to males. This finding is in consonance with Fortson et al. (2007), who propose that female college students are more likely to go online for communicative and educational purposes while male college students are more likely to use the internet as a source of entertainment. Perhaps the noted gender differential could also be a result of differences in past usage of internet.555The proportion of individuals with previous experiences of online education is higher for females in our sample, with 55% of females having taken an online course for credit before. Furthermore, online education allows for flexible schedules that individuals can customise around their family and job constraints more easily (Goodman et al., 2019). This greater flexibility in schedule likely implies greater willingness for online education for females. The covariate effect of females, displayed in Table 3, shows that being female increases the probability of valuing online education by 5.3 to 3.5 percentage points from 10th to 90th quantiles respectively. Strongest effect of female is found in the 25th quantile and the effect reduces at the 90th quantile. At higher utility, females are more similar to males than at lower utility.
Next, we find that the coefficient for different levels of education are consistently negative, relative to the base category (HS and below), across the quantiles. In each quantile, the post-bachelors category shows a large negative propensity for online classes vis-à-vis traditional learning. The effects are also negative for those with a bachelors degree compared to those with HS education or below. While the effects are negative for below-bachelors degree, they are not statistically different in comparison to the base category. This is useful in understanding the differences in preferences between individuals with different educational qualifications. Highly educated respondents report diminished value of online classes in comparison to those with a HS degree or below. This points to some degree of stigma towards online education as the level of educational qualification rises (Kizilcec et al., 2019). The decrease in utility from online classes is likely driven by greater intensity of learning and teaching at graduate or post graduate levels. Students perceive better learning from face-to-face interactions, and visualising materials. The self-regulatory nature of physical classroom teaching perhaps enables students to track their understanding of the course. Our result finds support in Chen et al. (2013) who note more favourable student outcomes for traditional classrooms versus an online mode for advanced accounting courses, and Otter et al. (2013) who note that students believe that they must do the teaching and learning on their own in online courses in contrast to what they feel about the time and effort from faculty for traditional courses. This perhaps reduces the value they attach to online education at higher degree levels. According to O’Neill and Sai (2014), traditional classes also allow for better relationship and lines of communication with the instructor. Other studies have shown that students face difficulty in keeping up motivation in online classes. This is likely to become more prominent at higher levels of education. Findings documented in Anstine and Skidmore (2005) and Fendler et al. (2011), suggest that students perform worse in online courses compared to face-to-face classes at undergraduate and graduate levels also support our results of lower willingness for online education by them.666Individual’s prior experience with online courses and their performance likely play a role in determining the value they attach to online education. As per Parker et al. (2011), roughly 39% of those who have taken an online course before respond favourably to online educational value whereas about 27% of those with no prior online education favourably value online classes. Examining our covariate effects from Table 3, we see that the effects are negative and vary between 13.9 to 15.1 percentage points for individuals with a post-bachelors degree. The result from the 50th quantile is similar to the probit result implying a 15.1 percentage points reduction in the probability of valuing online education. The covariate effects are slightly lower for those with a bachelors degree and range between 12.1 to 13.7 percentage point decline in their opinion about online classes.
Looking at geographical locations, we note some significant regional effects in driving the opinion about online education. We find negative effects for those living in the Northeast, the South, and the West relative to the Midwest (the omitted category). However, the effects are not statistically important for those residing in the West. The largest negative effects are seen in the Northeast across all quantiles, followed by the South in comparison to the Midwest.777Use of technology in the Mid-west and the South is higher compared to the East. In fact, the East coasters are found to lag behind the rest of the country in some aspects of technology adoption as per Parker et al. (2011).. Regional differences in the popularity of online courses are likely driven by use of technology, student population, course design and support provided by the universities, as well as the philosophies of universities in the region. Educational value of online courses are thus considered higher in regions where online education is more popular.888Miller (2014) states that universities in Arizona are considered to be early adopters of online teaching techniques, in fact preferring faculty with experience in technology. Xu and Jaggars (2013) highlight the importance of the institutional state in determining the cultural capital around technology. Allen and Seaman (2007) also suggest that the Southern states represented over one-third of total online enrolments in 2005-06 and the proportion of Southern institutions with fully online programs is steadily rising.999Regions with students having high levels of technological proficiency are more likely to take courses which integrate technology, major in technology-rich disciplines, and pursue technology-rich careers (Xu and Jaggars, 2013). Our covariate effect calculations indicate that in the Northeast, the probability of favouring online classes reduces by 9.1 to 10.2 percentage points relative to the Midwest, across the quantiles. The highest negative effect is found for those in the 90th quantile. The propensity to value online education is reduces by 6.9 to 8 percentage points in the Southern regions compared to the Midwest.
We also examine the effect of race and find no noteworthy racial differences in the willingness towards online education relative to in-person education. Specifically, the coefficients for White, relative to the base category (Other Races), are statistically not different from zero. Similarly, the coefficients for African-Americans across the quantiles are statistically equivalent to zero. This likely indicates that, after controlling for different educational levels and previous exposure to online learning, individuals across racial groups seem to hold similar attitudes about the online classes as an educational tool. Our results fall in line with (Cotten and Jelenewicz, 2006; Odell et al., 2000; Jones et al., 2009; Bowen et al., 2014), who note that the digital divide upheld by race may be narrowing, and in some cases negligible among college campuses in the US. Contrary to this, Figlio et al. (2013), find negative outcomes for Hispanic students.
The coefficient for urban areas are negative and for the suburban areas are positive compared to the base group of rural residents. However, the effects are not statistically important implying that area of residence does not seem to impact the opinion about online classes. Interestingly, income levels have a positive effect across the quantiles but once again the effects are not statistically different from zero. Although, Horrigan and Rainie (2006) find that affluent families have better access to internet, we find no convincing evidence that income plays a role in determining opinion about online classes vis-à-vis traditional classes.
5 Conclusion
Technological advancements and the rising cost of higher education have rendered online education as an attractive substitute or a complementary technique for teaching and learning. With the online enrolment growth rate in the US at 9.3 percent, over 6.7 million students were estimated to have taken at least one online course in 2012 (Allen and Seaman, 2013). Considering this trend, in this paper, we examine public opinion about the value of online learning methods in comparison to in-person education across United States. Evaluating public opinion can not only serve as a guide for policy, but also help design the transformative shift away from physical classrooms as the dominant paradigm of teaching and learning. Some scholars argue that public policies should in fact be guided by public opinion, so that mass opinion and democracy is upheld (Monroe, 1998; Paletz et al., 2013).
Extant literature points to uncertainty regarding the quality and rigour of online education. While there is some degree of adaptation to specific online courses offered by traditional universities as blended learning, reservations about fully online degree programs remain. As such, we assert that the approach provided in this paper leads to a richer view of how the demographic covariates may influence public opinion about the educational value of online classes, thereby, better informing future educational policies. We find important effects of employment status, previous online experience, age and gender on the propensity towards online education across the latent utility scale. We also note that willingness towards online classes versus in-person classes is lower for highly educated individuals. While interesting regional variations exist, we find no evidence of race and income on the propensity for online education.
We conclude with three main questions for future work. First, creating an in-depth, systematic support for both faculty and students, in transitioning from traditional to online teaching-learning platforms, is not an inexpensive venture. With considerable fixed costs incurred in training, course creations and delivery methods for online education (Ginn and Hammond, 2012; Xu and Jaggars, 2013), what would be the incentives to switch back to in-person classrooms or blended formats in a post-pandemic general equilibrium? Second, evidence suggests that online education democratises and improves access to education (Goodman et al., 2019). Given this, it may be interesting to examine the trade-off between a perceived decrease in outcomes and efficacy of online education versus the increase in the exposure of education to previously inaccessible population from a policy perspective. Finally, it is well established that upward mobility in teaching colleges are largely influenced by student feedback and evaluations (Chen and Hoshower, 2003; McClain et al., 2018; Krautmann and Sander, 1999). If we consider the current health landscape across the globe as a period of deviation from the true nature of dynamics between education and technology, one ought to think about how student feedback during this phase of aberration, will contribute to upward mobility of faculty.
References
- Albert and Chib (1993) Albert, J. H. and Chib, S. (1993), “Bayesian Analysis of Binary and Polychotomous Response Data,” Journal of the American Statistical Association, 88, 669–679.
- Alhamzawi and Ali (2018a) Alhamzawi, R. and Ali, H. T. M. (2018a), “Bayesian Quantile Regression for Ordinal Longitudinal Data,” Journal of Applied Statistics, 45, 815–828.
- Alhamzawi and Ali (2018b) Alhamzawi, R. and Ali, H. T. M. (2018b), “Bayesian Single-Index Quantile Regression for Ordinal Data,” Communications in Statistics Simulation and Computation, pp. 1–15.
- Allen and Seaman (2007) Allen, I. E. and Seaman, J. (2007), “Making the Grade: Online Education in the United States, 2006,” Sloan Consortium, Feb 2007. Available: https://files.eric.ed.gov/fulltext/ED530101.pdf [Last accessed: 11 July 2020].
- Allen and Seaman (2011) Allen, I. E. and Seaman, J. (2011), “Going the Distance: Online Education in the United States, 2011.” Sloan Consortium, Nov 2011. Available: https://files.eric.ed.gov/fulltext/ED529948.pdf [Last accessed: 11 July 2020].
- Allen and Seaman (2013) Allen, I. E. and Seaman, J. (2013), “Changing Course: Ten Years of Tracking Online Education in the United States,” Sloan Consortium, Jan 2013. Available: https://files.eric.ed.gov/fulltext/ED541571.pdf [Last accessed: 11 July 2020].
- Allen and Seaman (2016) Allen, I. E. and Seaman, J. (2016), “Online Report Card: Tracking Online Education in the United States,” Babson Survey Research Group, Feb 2016. Available: https://files.eric.ed.gov/fulltext/ED572777.pdf [Last accessed: 11 July 2020].
- Alpert et al. (2016) Alpert, W. T., Couch, K. A., and Harmon, O. R. (2016), “A Randomized Assessment of Online Learning,” American Economic Review, 106, 378–82.
- Anstine and Skidmore (2005) Anstine, J. and Skidmore, M. (2005), “A Small Sample Study of Traditional and Online Courses with Sample Selection Adjustment,” The Journal of Economic Education, 36, 107–127.
- Astani et al. (2010) Astani, M., Ready, K. J., and Duplaga, E. A. (2010), “Online Course Experience Matters: Investigating Students’ Perceptions of Online Learning,” Issues in Information Systems, 11, 14–21.
- Benoit and Poel (2012) Benoit, D. F. and Poel, D. V. D. (2012), “Binary Quantile Regression: A Bayesian Approach based on the Asymmetric Laplace Distribution,” Journal of Applied Econometrics, 27, 1174–1188.
- Bettinger et al. (2017) Bettinger, E. P., Fox, L., Loeb, S., and Taylor, E. S. (2017), “Virtual Classrooms: How Online College Courses Affect Student Success,” American Economic Review, 107, 2855–2875.
- Bowen et al. (2014) Bowen, W. G., Chingos, M. M., Lack, K. A., and Nygren, T. I. (2014), “Interactive Learning Online at Public Universities: Evidence from a Six-campus Randomized Trial,” Journal of Policy Analysis and Management, 33, 94–111.
- Bresson et al. (2020) Bresson, G., Lacroix, G., and Rahman, M. A. (2020), “Bayesian Panel Quantile Regression for Binary Outcomes with Correlated Random Effects: An Application on Crime Recidivism in Canada,” Empirical Economics, (forthcoming).
- Cassens (2010) Cassens, T. S. (2010), “Comparing the Effectiveness of Online and Face-to-Face Classes among California Community College Students,” Ph.D. thesis, University of Southern California.
- Chen et al. (2013) Chen, C. C., Jones, K. T., and Moreland, K. A. (2013), “Online Accounting Education versus In-class Delivery: Does Course Level Matter?” Issues in Accounting Education, 28, 1–16.
- Chen and Fu (2009) Chen, S.-Y. and Fu, Y.-C. (2009), “Internet Use and Academic Achievement: Gender Differences in Early Adolescence,” Adolescence, 44, 797–812.
- Chen and Hoshower (2003) Chen, Y. and Hoshower, L. B. (2003), “Student Evaluation of Teaching Effectiveness: An Assessment of Student Perception and Motivation,” Assessment & Evaluation in Higher Education, 28, 71–88.
- Chib (2013) Chib, S. (2013), “Introduction to Simulation and MCMC Methods,” in The Oxford Handbook of Bayesian Econometrics, eds. J. Geweke, G. Koop, and H. V. Dijk, pp. 183–218, Oxford University Press, Oxford.
- Chib and Jeliazkov (2006) Chib, S. and Jeliazkov, I. (2006), “Inference in Semiparametric Dynamic Models for Binary Longitudinal Data,” Journal of the American Statistical Association, 101, 685–700.
- Cooper (2006) Cooper, J. (2006), “The Digital Divide: The Special case of Gender,” Journal of Computer Assisted Learning, 22, 320–334.
- Cotten and Jelenewicz (2006) Cotten, S. R. and Jelenewicz, S. M. (2006), “A Disappearing Digital Divide among College Students? Peeling away the Layers of the Digital Divide,” Social Science Computer Review, 24, 497–506.
- Crain and Ragan (2017) Crain, S. J. and Ragan, K. P. (2017), “Online Versus Face-to-Face Course Learning Effectiveness: Measured Outcomes for Intermediate Financial Management,” Journal of Financial Education, 43, 243–261.
- Deming et al. (2015) Deming, D. J., Goldin, C., Katz, L. F., and Yuchtman, N. (2015), “Can Online Learning bend the Higher Education Cost Curve?” American Economic Review, 105, 496–501.
- Devroye (2014) Devroye, L. (2014), “Random Variate Generation for the Generalized Inverse Gaussian Distribution,” Statistics and Computing, 24, 239–246.
- Fendler et al. (2011) Fendler, R. J., Ruff, C., and Shrikhande, M. (2011), “Online versus In-class Teaching: Learning Levels Explain Student Performance,” Journal of Financial Education, 37, 45–63.
- Figlio et al. (2013) Figlio, D., Rush, M., and Yin, L. (2013), “Is it Live or is it Internet? Experimental Estimates of the Effects of Online Instruction on Student Learning,” Journal of Labor Economics, 31, 763–784.
- Fortson et al. (2007) Fortson, B. L., Scotti, J. R., Chen, Y.-C., Malone, J., and Del Ben, K. S. (2007), “Internet Use, Abuse, and Dependence Among Students at a Southeastern Regional University,” Journal of American College Health, 56, 137–144.
- Geman and Geman (1984) Geman, S. and Geman, D. (1984), “Stochastic Relaxation, Gibbs Distributions, and the Bayesian Restoration of Images,” IEEE Transactions on Pattern Analysis and Machine Intelligence, 6, 721–741.
- Ghasemzadeh et al. (2018a) Ghasemzadeh, S., Ganjali, M., and Baghfalaki, T. (2018a), “Bayesian Quantile Regression for Analyzing Ordinal Longitudinal Responses in the Presence of Non-ignorable Missingness,” METRON, 76, 321–348.
- Ghasemzadeh et al. (2018b) Ghasemzadeh, S., Ganjali, M., and Baghfalaki, T. (2018b), “Bayesian Quantile Regression for Joint Modeling of Longitudinal Mixed Ordinal Continuous Data,” Communications in Statistics Simulation and Computation, pp. 1–21.
- Ginn and Hammond (2012) Ginn, M. H. and Hammond, A. (2012), “Online Education in Public Affairs: Current State and Emerging Issues,” Online Journal of Distance Learning Administration, 18, 247–270.
- Goode (2010) Goode, J. (2010), “Mind the Gap: The Digital Dimension of College Access,” The Journal of Higher Education, 81, 583–618.
- Goodman et al. (2019) Goodman, J., Melkers, J., and Pallais, A. (2019), “Can Online Delivery Increase Access to Education?” Journal of Labor Economics, 37, 1–34.
- Greenberg (2012) Greenberg, E. (2012), Introduction to Bayesian Econometrics, 2nd Edition, Cambridge University Press, New York.
- Horrigan and Rainie (2006) Horrigan, J. B. and Rainie, L. (2006), “The Internet’s growing Role in Life’s Major Moments,” Pew Internet & American Life Project, Pew Research Center, 19 April 2006. Available: https://www.pewinternet.org/wp-content/uploads/sites/9/media/Files/Reports/2006/PIP_Major-Moments_2006.pdf.pdf [Last accessed: 11 July 2020].
- Jeliazkov and Rahman (2012) Jeliazkov, I. and Rahman, M. A. (2012), “Binary and Ordinal Data Analysis in Economics: Modeling and Estimation,” in Mathematical Modeling with Multidisciplinary Applications, ed. X. S. Yang, pp. 123–150, John Wiley & Sons Inc., New Jersey.
- Jeliazkov and Vossmeyer (2018) Jeliazkov, I. and Vossmeyer, A. (2018), “The Impact of Estimation Uncertainty on Covariate Effects in Nonlinear Models,” Statistical Papers, 59, 1031–1042.
- Jeliazkov et al. (2008) Jeliazkov, I., Graves, J., and Kutzbach, M. (2008), “Fitting and Comparison of Models for Multivariate Ordinal Outcomes,” Advances in Econometrics: Bayesian Econometrics, 23, 115–156.
- Jones et al. (2009) Jones, S., Johnson-Yale, C., Millermaier, S., and Pérez, F. S. (2009), “US College Students’ Internet Use: Race, Gender and Digital Divides,” Journal of Computer-Mediated Communication, 14, 244–264.
- Joyce et al. (2015) Joyce, T., Crockett, S., Jaeger, D. A., Altindag, O., and O’Connell, S. D. (2015), “Does Classroom Time Matter?” Economics of Education Review, 46, 64–77.
- Kirtman (2009) Kirtman, L. (2009), “Online versus In-class Courses: An Examination of Differences in Learning Outcomes,” Issues in Teacher Education, 18, 103–116.
- Kizilcec et al. (2019) Kizilcec, R., Davis, D., and Wang, E. (2019), “Online Degree Stigma and Stereotypes: A new Instrument and Implications for Diversity in Higher Education,” Available at SSRN 3339768.
- Koenker (2005) Koenker, R. (2005), Quantile Regression, Cambridge University Press, Cambridge.
- Koenker and Bassett (1978) Koenker, R. and Bassett, G. (1978), “Regression Quantiles,” Econometrica, 46, 33–50.
- Kordas (2006) Kordas, G. (2006), “Smoothed Binary Regression Quantiles,” Journal of Applied Econometrics, 21, 387–407.
- Kozumi and Kobayashi (2011) Kozumi, H. and Kobayashi, G. (2011), “Gibbs Sampling Methods for Bayesian Quantile Regression,” Journal of Statistical Computation and Simulation, 81, 1565–1578.
- Krautmann and Sander (1999) Krautmann, A. C. and Sander, W. (1999), “Grades and Student Evaluations of Teachers,” Economics of Education Review, 18, 59–63.
- Krieg and Henson (2016) Krieg, J. M. and Henson, S. E. (2016), “The Educational Impact of Online Learning: How do University Students perform in Subsequent Courses?” Education Finance and Policy, 11, 426–448.
- McClain et al. (2018) McClain, L., Gulbis, A., and Hays, D. (2018), “Honesty on Student Evaluations of Teaching: Effectiveness, Purpose, and Timing Matter!” Assessment & Evaluation in Higher Education, 43, 369–385.
- Miller (2014) Miller, M. D. (2014), Minds online, Harvard University Press, Cambridge.
- Monroe (1998) Monroe, A. D. (1998), “Public Opinion and Public Policy, 1980-1993,” Public Opinion Quarterly, 62, 6–28.
- Norum and Weagley (2006) Norum, P. S. and Weagley, R. O. (2006), “College Students, Internet Use, and Protection from Online Identity Theft,” Journal of Educational Technology Systems, 35, 45–63.
- Odell et al. (2000) Odell, P. M., Korgen, K. O., Schumacher, P., and Delucchi, M. (2000), “Internet Use among Female and Male College Students,” CyberPsychology & Behavior, 3, 855–862.
- O’Neill and Sai (2014) O’Neill, D. K. and Sai, T. H. (2014), “Why not? Examining College Students’ Reasons for Avoiding an Online Course,” Higher Education, 68, 1–14.
- Otter et al. (2013) Otter, R. R., Seipel, S., Graeff, T., Alexander, B., Boraiko, C., Gray, J., Petersen, K., and Sadler, K. (2013), “Comparing Student and Faculty Perceptions of Online and Traditional Courses,” The Internet and Higher Education, 19, 27–35.
- Paletz et al. (2013) Paletz, D. L., Owen, D. M., and Cook, T. E. (2013), American Government and Politics in the Information Age, Flat World Knowledge.
- Parker et al. (2011) Parker, K., Lenhart, A., and Moore, K. (2011), “The Digital Revolution and Higher Education: College Presidents, Public Differ on Value of Online Learning.” Pew Internet & American Life Project, Pew Research Center, 28 Aug 2011. Available: https://files.eric.ed.gov/fulltext/ED524306.pdf [Last accessed: 11 July 2020].
- Rahman (2016) Rahman, M. A. (2016), “Bayesian Quantile Regression for Ordinal Models,” Bayesian Analysis, 11, 1–24.
- Rahman and Karnawat (2019) Rahman, M. A. and Karnawat, S. (2019), “Flexible Bayesian Quantile Regression in Ordinal Models,” Advances in Econometrics, 40B, 211–251.
- Rahman and Vossmeyer (2019) Rahman, M. A. and Vossmeyer, A. (2019), “Estimation and Applications of Quantile Regression for Binary Longitudinal Data,” Advances in Econometrics, 40B, 157–191.
- Robert (1995) Robert, C. P. (1995), “Simulation of Truncated Normal Variables,” Statistics and Computing, 5, 121–125.
- Simmons (2014) Simmons, G. R. (2014), “Business statistics: A Comparison of Student Performance in Three Learning Modes,” Journal of Education for Business, 89, 186–195.
- Train (2009) Train, K. (2009), Discrete Choice Methods with Simulation, Cambridge University Press, Cambridge.
- Williams (2006) Williams, S. L. (2006), “The Effectiveness of Distance Education in Allied Health Science Programs: A Meta-analysis of Outcomes,” The American Journal of Distance Education, 20, 127–141.
- Xu and Jaggars (2013) Xu, D. and Jaggars, S. S. (2013), “The Impact of Online Learning on Students’ Course Outcomes: Evidence from a Large Community and Technical College System,” Economics of Education Review, 37, 46–57.
- Yu and Moyeed (2001) Yu, K. and Moyeed, R. A. (2001), “Bayesian Quantile Regression,” Statistics and Probability Letters, 54, 437–447.
- Yu and Zhang (2005) Yu, K. and Zhang, J. (2005), “A Three Parameter Asymmetric Laplace Distribution and its Extensions,” Communications in Statistics – Theory and Methods, 34, 1867–1879.