Dynamical analysis of Maclaurin disk with velocity dispersion and its influence on bar formation
Abstract
We investigate the influence of Toomre’s parameter on the bar-forming dynamics of Maclaurin disk using -body simulations. According to the Toomre’s criterion, local velocity dispersion parametrized by is required to suppress the local axisymmetric instability but, in turn, it deviates particle orbits from nearly circular limit in which particle natural frequencies are calculated. We resolve this by including the effect of velocity dispersion, as the pressure potential, into the effective potential with the gravitational potential. With this formulation, circular orbit approximation is retrieved. The effective potential hypothesis can describe the -dependences of angular and epicyclic motions of the bar-forming processes and the established bars reasonably well provided that . This indicates the influence of initial that is imprinted in the entire disk dynamics, not only that serves as the stability indicator. In addition, we perform the stability test for the disk-in-halo systems. With the presence of halo, disks are more susceptible to the bar formation as seen by the elevated critical than that for the isolated disk. This is attributed to the differential rotation that builds the unstable non-axisymmetric spiral modes more efficiently which are the ingredients of bar instability.
1 Introduction
Barred galaxies constitute a significant fraction of observable galaxies in wide ranges of mass, size, brightness and redshift. An early survey of galaxy population discovered that approximately two-thirds of them consisted of a bar (Eskridge et al., 2000; Menéndez-Delmestre et al., 2007). Later on, by better measurement and classification of galaxy properties, the fraction of barred galaxies varied considerably from one population to another. When arranged by the redshift, it was found that the fraction at low redshift was significantly higher than the fraction at high redshift (Marinova & Jogee, 2007). Considering the dependence on the bulge-to-disk ratio, it was documented that the disk-dominated galaxies were more likely to host a bar than those that were bulge-dominated (Barazza et al., 2008; Lee et al., 2019). When color became the factor, analyses suggested that the fraction in red galaxy population was significantly higher than that for the blue galaxy population (Masters et al., 2011; Lee et al., 2012; Li et al., 2017). Those statistics give a hint that the bar instability is somewhat generic among various galaxy population. The widely accepted theory for the spontaneous bar formation is that a bar emerges in a bar-unstable disk in which the resonance between the orbital, epicyclic and perturbative forcing frequencies takes place (see Binney & Tremaine 1994 for detail). Such resonance amplifies the global linearly unstable two-armed modes to grow at first before the system reaches the next stage where the remnant bi-symmetric potential forms the persisting bar by means of the non-linear bar instability. The latter process can be understood by that the particles are trapped by the bar-like potential so that their orbital major axis aligns with the bar potential axis, yielding the barred appearance in the system that persists for long time. Those hypotheses are supported by the theoretical works on the disk instability to the multi-arm modes (Hunter, 1963; Kalnajs, 1971; Lynden-Bell & Kalnajs, 1972) and on the orbital analysis in bar potentials (Contopoulos, 1980; Contopoulos & Papayannopoulos, 1980). In numerical part, the bar instability has been tested in the pioneering simulation of disk in isolation and the barred structure has been captured (Hohl, 1971). For more compatibility with real galaxies, the method to construct the composite system in which a disk resided in a bulge or halo potential has been developed (Sellwood, 1980). This enlarged greatly the scope as the dependence on bulge/halo parameters became subject of investigation. In the following years, simulations of disks in a single spherical potential (Sellwood, 1981; Efstathiou et al., 1982; Fujii et al., 2018) and in a composite bulge-halo potential (Polyachenko et al., 2016; Kataria & Das, 2018; Saha & Elmegreen, 2018) have been carried out and the steady bars of various size and shape were spotted.
While the bar formation mechanism appeared to be generic in numerous kinds of disk simulations, the detailed analysis of the bars unveiled much of complexity as the simulated bar properties varied considerably from one system to another. For example, it was reported that the bar properties depended on the halo mass concentration such that a less concentrated halo led to a stronger bar while, on the contrary, a more concentrated one toned down the process or even stabilized the disk (Combes & Sanders, 1981; Shen & Sellwood, 2004; Jang & Kim, 2023). Not only the bar physical properties, the variation of halo concentration also affected the bar kinematics such as the pattern speed (Athanassoula, 2003; Kataria & Das, 2019) or the orbital structure (Athanassoula & Misiriotis, 2002). Specific to the live halo scheme, it allows us to investigate the halo influence that is specific to the particle nature of halo on the bar formation. For instance, it was found that the transfer of the angular momentum between disk and halo particles played an important role in the bar evolution (Athanassoula, 2002; Holley-Bockelmann et al., 2005; Dubinski et al., 2009; Long et al., 2014). Furthermore, the spinning of spherically symmetric particle halo, which cannot be implemented in the rigid halo case, has been found to affect the bar physical and kinematical properties significantly (Saha & Naab, 2013; Collier et al., 2019a, b). In the barred state, many studies revealed further complexities as the bar was actually coupled with the outer spiral arms, via the outer Lindblad resonance (Masset & Tagger, 1997; Rautiainen & Salo, 1999). Following the subsequent in-depth analysis, the interaction by means of the transfer of the kinetic energy between the corotation and the outer Lindblad resonance radii was proved important (Minchev & Quillen, 2006; Michel-Dansac & Wozniak, 2006; Quillen et al., 2011; Kim & Kim, 2014).
Despite the fruitful numerical results covering a wide range of system parameters, the dependence of the detailed disk and bar kinematics on the Toomre’s parameter has apparently not drawn much of attention. The introduction of the local radial velocity dispersion parametrized by into the disk is necessary as it suppresses the local axisymmetric instability before the linearly unstable two-armed modes come into play (Toomre, 1964). Following that conjecture, it has also been proved that can be the global stability indicator: the disk with greater than a critical value is bar-stable (Sellwood & Evans, 2001; Sellwood et al., 2019). On the other hand, the other role, specifically its functioning in the disk dynamics, is not much visited. There were reports of the correlation between the bar physical and kinematical parameters and (Rautiainen & Salo, 2000; Hozumi, 2022) but how was involved in the detailed disk dynamics that resulted in the barred state remained to be investigated. From those points, the central interest of this work is on how precisely we can describe the role of in governing the disk dynamics and how it affects the bar formation process as well as the resulting bar properties. We speculate that the velocity dispersion, which can be constructed from any model of , gives rise to the pressure and it introduces the additional pressure force in the disk that directionally opposes the gravitational force. We will develop the theoretical model of the disk dynamical structure based on that assumption.
The article is organized as follows. In Sec. 2, we describe the disk model for the initial condition and proceed on the analysis of disk dynamical structure for finite . We also introduce the effective potential hypothesis here and some parameters following that hypothesis are derived to compare with the simulations. Next, the simulation details and the important parameters to evaluate the bar strength and bi-symmetric structure are given in Sec. 3. In Sec. 4, we report the numerical results, focusing firstly on the evolution of the Maclaurin disk in isolation in the framework of the effective potential hypothesis. Various aspects such as the disk internal kinematics, bar-forming dynamics and the bar kinematical properties for different are considered. In Sec. 5, we additionally inspect the bar instability in the disk-halo systems using also the -body simulations. Finally, Sec. 6 gives the conclusion of this study and the perspective.
2 Analysis of Maclaurin disk with finite
2.1 Distribution function of the uniformly rotating disk
The initial condition in this study is the isolated two-dimensional Maclaurin disk whose surface density as a function of radial distance is given by
| (1) |
where is the density at the center and is the disk radial size (see, e.g., Freeman 1966; Schulz 2009; Roshan et al. 2016 for some examples of the structure analysis). By mass normalization, relates to the disk mass and by
| (2) |
This surface density yields the potential energy
| (3) |
for where
| (4) |
in which is the disk uniform angular frequency. Correspondingly, the uniform epicyclic frequency can be calculated by the following definition
| (5) |
For the stellar disk analogue, the uniformly rotating disk of stars in dynamical equilibrium having the surface density (1) is known as the Kalnajs disk (Kalnajs, 1972). The distribution function of that disk for the rotational frequency as a function of the radial distance , the radial velocity and the tangential velocity is given by
which is valid for the positive argument in the square root. Otherwise, . In the expression (2.1), we choose , and to be the units of length, surface density and angular frequency, respectively. Note that the distribution function (2.1) can also be expressed as a function of the energy per unit mass and the orbital angular momentum . This distribution function is also known as the -model and it can be proved that the density profile for any takes the form of Eq. (1). We limit ourselves to the prograde rotation, i.e., . The case where corresponds to the non-rotating disk while for , the disk is purely rotating with no random motion. The mean radial and tangential velocities of the -model read
| (7) |
respectively. Specific to this disk family, the velocity dispersion is isotropic thus the radial and tangential velocity dispersions are identical and they are given by
| (8) |
For the consideration of the stability problem, the radial velocity dispersion is typically parametrized by the Toomre’s parameter by
| (9) |
The numerical value is the critical value for the disk stability against the local axisymmetric perturbations at any wavelength. For simplicity, we set to be constant. This constant- profile yields that depends on only. The relation between and can be obtained via as functions of both parameters in Eq. (8) and (9). We finally obtain the relation between and to be
| (10) |
which is used in constructing the -model disk for any . From the relation (10), the purely rotating disk yields whereas the non-rotating disk has that marks the upper limit for this disk family.
2.2 Nearly-circular orbit approximation for disk with non-zero : the effective potential
In continuity with the disk physical and kinematical details in Sec. 2.1, we will analyze the validity of the nearly-circular orbit approximation when is present. When the Toomre’s criterion requiring is applied on the disk of particles, most particle orbits deviate significantly from the circular shape due to the random velocity component. On the other hand, the Lindblad analysis assumes the nearly circular orbit of particles where the frequencies are calculated. To resolve this, we first recall the axisymmetric Jeans equation that describes the interplay between the gravitational potential and the velocity moments and we express it in the following form
| (11) |
where corresponds to the mean tangential velocity written in terms of by Eq. (7). Note that the first term on the right-hand side stands for . We re-arrange Eq. (11) to be
| (12) |
where, specific to the Maclaurin/Kalnajs disk with uniform ,
| (13) |
We consider as the effective potential which corresponds to the combination of the gravitational potential and the pressure potential arising from the velocity dispersion. Eq. (12) can be interpreted by that the particle orbit remains circular with effective orbital frequency in the effective potential. The random velocity component is now regarded as it oversees the pressure potential field leading to the pressure force
| (14) |
where the term in the derivative stands for the pressure. From the definition (14), the presence of the pressure gradient always leads to the pressure force regardless of the model of velocity dispersion profile which can be chosen to depend on or not. Note that if , the disk is pressure-less and it is prone to the local gravitational instability.
From the effective potential (13), we define the effective epicyclic frequency
| (15) |
This expression differs from the standard definition of the epicyclic frequency which takes only the gravitational potential into account. By substituting from Eq. (13) into this expression, we finally obtain
| (16) |
This effective epicyclic frequency is conceptually extended from the definition of the asymmetric drift derived from the Jeans equation (11), in which the effect of the velocity dispersion shifts the orbital frequency. Here, we make a hypothesis that the same effect can similarly shift the epicyclic frequency. The main advantage of choosing the Maclaurin/Kalnajs disk in this study is that the frequencies are uniform throughout the disk. The inspection of the deviation from the original frequencies and its variation with is straightforward. The effective potential and the corresponding effective frequencies are our central frames of references to inspect the disk evolution in simulations for different . Note that in a more realistic disk, anisotropic velocity dispersion gives rise to the third term on the right-hand side of Eq. (11). We also note possible radial dependences of , or profiles for a more general disk. Despite those complications, the effective potential approach can still be applied without loss of generality as the Jeans equation (11) allows any form of those functions. The effective potential might have a more complicated form given those complexities.
3 Numerical simulation details and configuration parameters
3.1 Simulation set-up and accuracy control
For the initial disk of particles in isolation, we generate it with particle positions and velocity moments prescribed by the expressions in Sec. 2.1. For the random velocity component, we draw it from the cut-off Gaussian distribution to avoid the high velocity tail. We simulate disks of particle number and and . Although the Toomre’s criterion requires , we nevertheless inspect disks with and to test the validity of the effective potential hypothesis when the local axisymmetric instability is involved.
In addition to the isolated disk which is a system of interest to test the effective potential hypothesis, the Maclaurin disk in spherical halo potential can be of equal interest for the question of the disk stability when the dark matter halo is present. We adopt the Hernquist profile to represent the dark matter halo in which the Maclaurin disk resides whose potential as a function of radius is given by
| (17) |
where is the halo mass and is the halo scale-radius. We choose and . We perform the simulations of Maclaurin disks in both rigid and live halos. With the Hernquist potential, the composite disk-halo potential causes the Maclaurin disk to rotate differentially in dynamical equilibrium. The rotation curve and the radial profile of the angular frequency of the Maclaurin disk in Hernquist potential with our choices of mass and scale-radius is shown in Fig. 1. The tangential velocity is presented in units of that corresponds to the velocity at the isolated disk cut-off radius, while the angular frequency is presented in units of . Testing the bar instability in this composite disk-halo system not only allows us to investigate the effect from spherical halo but we are also able to inspect the effect from the differential rotation on the bar instability. This composite system is more relevant to the real galaxies because they reside in dark matter halos and they rotate differentially. We adopt the prescription of Hernquist (1993) to construct the disk-halo system in equilibrium which bases on the Jeans equations of the composite potential. The disk rotational velocity structure is constructed from the axisymmetric Jeans equation with a chosen velocity dispersion profile given by
| (18) |
where is now calculated from the composite disk-halo potential. Specific to the live halo scheme, the halo velocity dispersion is isotropic and its radial profile is numerically determined from the spherically symmetric Jeans equation
| (19) |
where is the halo radial density profile and is the total mass enclosed inside . Random velocity components are drawn from cut-off Gaussian distribution. We keep the constant- profile as employed in the case of isolated disk. In the two scenarios, disks consist of equal number of particles as in the isolated case, that is , in order to keep the same magnitude of the Poisonnian fluctuations, while for the live halo simulations, the halo consists of particles. The live halo is truncated at which is times the disk cut-off radius. We simulate the evolutions of disk-halo systems with and .

Evolution of disk of particles is simulated by GADGET-2 (see Springel et al., 2001; Springel, 2005). We employ the same choices of units as in the analysis in Sec. 2.1, i.e., the disk cut-off radius , the rotational frequency of the cold disk and the disk surface density at the center for the units of length, frequency and surface density, respectively. We choose the rotation period of the purely rotating disk, or
| (20) |
as the unit of time. To give an example of the rotation period, a Maclaurin disk of Milky Way mass and radius, i.e. and , has the rotation period equal to . For velocity unit, we adopt , as employed in Fig. 1. The gravitational force calculation is facilitated by the tree code. The gravitational force in the code is spline-softened with softening length . We adjust the opening angle equal to for simulations of isolated disks and disks in rigid halo while it is fixed to for the live halo simulations. The integration time-step is controlled to be not greater than for the cases of isolated disks and disks in rigid halo. For live halo simulations, it is controlled to be below . With this simulation setting, the accuracy of the integration is such that the deviation of the total energy from the initial value at any time is less than until the end of simulation that is fixed to for all cases.
3.2 Bar parameter
The strength of bi-symmetric modes can be evaluated by the Fourier amplitude as a function of radius given by
| (21) |
where and are the Fourier coefficients at computed from
| (22) |
The summation includes only particles in the annulus of radius , each of which has angular position and mass , with total number . In the expression (21), is the corresponding Fourier amplitude of modes. The bar strength is defined as the maximum within the bar reach, or
| (23) |
In addition, the radial phase change of is capable of capturing the presence of two-armed spiral modes. The winding degree of the two-armed modes is evaluated in terms of the logarithmic pitch angle that can be written as
| (24) |
where is the phase of the modes at . Our sign convention is that is positive and negative for the leading and trailing spiral arms, respectively.
4 Evolution and internal kinematics of isolated Maclaurin disks
4.1 Disk evolution for different
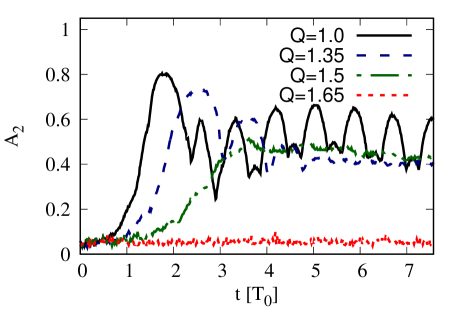
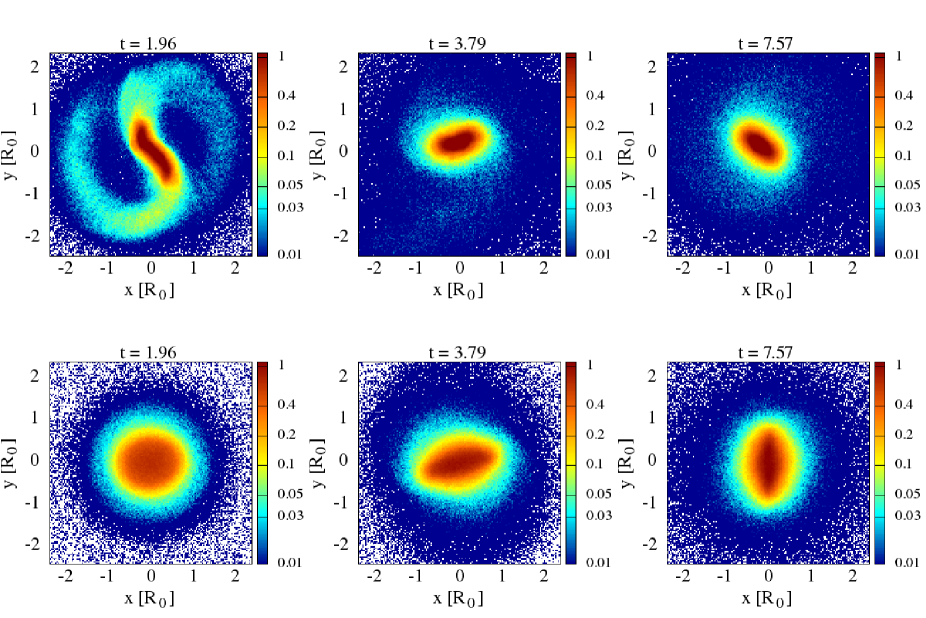
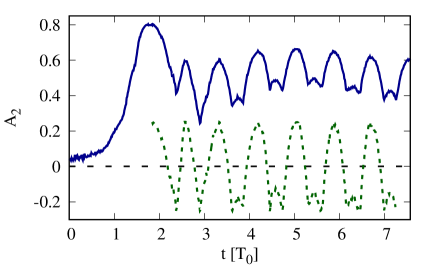
In the entire of Sec. 4, we focus on the evolution of isolated Maclaurin disks in the framework of the effective potential hypothesis. We start the section by inspecting the overall evolutions. Shown in Fig. 2 is the time evolution of bar strength for disks with different . The plots for each of and are drawn from a single realization among the three different realizations. For , only one realization is simulated. In addition, disk surface density maps at different time for some bar-unstable are depicted in Fig. 3. From the plot, it is evident that if , the disks are bar-unstable: grows from the initial state before the growth is put to an end when reaches the first maximum within a few and it remains high afterwards. The evolution of is in accordance with the development of persistent barred structures in Fig. 3 for both and . As reaches , the bar formation is not triggered as remains at the initial noise level. This implies that the critical value of to stabilize the disk is in the range of . That range is close to the value estimated by the stability analysis against the two-armed (or bar-like) modes for this disk family by Kalnajs & Athanassoula-Georgala (1974) who suggested that the numerical value , which is equivalent to , can suppress those modes. However, when concerning the same problem in a disk of particles, there are two factors that might affect the critical value. The first one is the force softening in simulations which acts as the stabilizer. Secondly, the random Poissonian noises embedded in the particle system might be another source of the perturbations in addition to the imposed multiple-armed modes perturbations as the original analysis took into account. Another analysis of the uniformly rotating disk was also performed by Christodoulou et al. (1995), using a diagnostic involving more disk physical and kinematics parameters. This analysis led to the same conclusion that the disk with lower rotation frequency tended to be more stable.
With a closer look on and morphological evolutions, we remark distinct evolution patterns for and . For , rapidly increases at first before it oscillates strongly afterwards. At , or the time around the first peak, we observe the spiral pattern in opposite directions formed by the particles driven outwards by the bi-symmetric force. The growth of the spiral pattern can be explained as follows. In a bar-unstable disk, the global linearly unstable two-armed modes are the fastest growing modes, which are initiated from the Poissonian noise. These modes dominate the early stage and grow exponentially because of its linear nature (Dubinski et al., 2009; Fujii et al., 2018; Collier, 2020). The linear instability marks an end when the two-armed modes, as quantified by , reach their peak. Then, the disk remains in a barred state by the non-linear bar instability. In this stage, particles are trapped by the bi-symmetric bar potential induced by the remnant of the preceding two-armed modes. This can be seen by the persisting bar in the following snapshots which lasts for time much longer than the formation time scale. This result is in agreement with the pioneering simulation of Hohl (1971). For the disk, increases more slowly and it oscillates more weakly in the barred state. That evolves more gently can be seen in Fig. 3 where no visible spiral trace is observed at which is the time around the peak. The case where exhibits the intermediate evolution pattern of . For and , the bar is able to be formed amidst the local instability and the overall disk evolution is qualitatively similar to that for : the two-armed spiral modes grow rapidly leading to the robust bar.
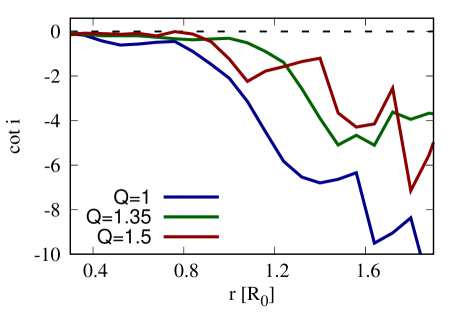
We further investigate the unstable two-armed modes by measuring profile where is the logarithmic pitch angle around the time of peak for different and the results are shown in Fig. 4. From the plot, we capture the trailing spiral two-armed modes in all cases beyond the region where , which corresponds to the barred region, although the spiral arms are not visible in configuration. It turns out that the underlying processes starting from the growth of the two-armed modes to the bar instability are generic for all . Increasing makes the perturbation evolve more slowly.
The prolonged formation time and the gentleness of the bar-forming process in higher- disks can otherwise be understood in the dynamical point of view that regards the interplay between two competing forces. First, the bi-symmetric modes perturb the disk by means of growing the two-armed spiral structure outwards that compresses the disk environment in the process. The compressed background then exerts the counteractive pressure force, i.e., , in response to the growth. As the pressure is an increasing function of , then increases with in a similar way. This explains why the high- disk develops the bar more slowly because the disk environment counteracts the growth with a stronger force. The fact that the bar is established for proves that the two-armed perturbative forces are stronger than the counteractive pressure forces from the disk background. Conversely, the situation for disk implies that the perturbative force cannot surpass .
4.2 Resonance analysis and rotational frequency of fully developed bar
In this section, we examine the -dependence of the resonance mechanism responsible for the bar formation and the resulting bar kinematics. To do this, we plot the ensemble-averaged angular frequencies of the modes before and after the fully formed bar for different in the top panel of Fig. 5. These frequencies correspond to the dominant Fourier frequencies of the bar phase calculated in the time windows of widths and before and after the first peak of , respectively. The first frequency corresponds to the angular frequency of the linearly unstable two-armed modes while the latter frequency represents the bar pattern speed. The disk effective rotational frequency as a function of from Eq. (10) is provided for comparison. In the bottom panel of Fig. 5, we plot the ensemble-averaged fraction of number of particles that are trapped by the resonance during the bar-forming stage for different . More specifically, trapped particles are those with orbital frequencies lie within near the modes axis where is the modes angular frequency. The fraction is determined in the time window of width around the first peak of .
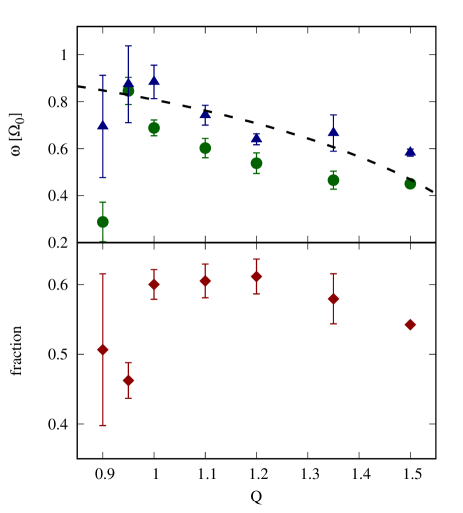
When , the two-armed modes frequency in the bar-forming stage decreases, on average, with and it is close to the effective rotational frequency from Eq. (10). That these two frequencies are close to each other implies that the corotation resonance is responsible for the growth of the linearly unstable two-armed modes for all . After the bar is fully formed, the bar angular frequency is significantly declined from the value before in all cases. This signifies the angular momentum loss during the bar formation. The correlation between the bar angular frequency and the initial effective frequency is still retained. Although the correlation between the bar angular frequency and has been pointed out in past studies (see, e.g., Athanassoula (2003); Hozumi (2022)), here we are able to give a more detailed explanation of that -dependence by the effective frequency hypothesis. On the contrary, the cases where exhibit the anomalies from the other cases. For , the rotational frequency of the fully formed bar does not decrease much from the initial frequency. As falls to , the frequencies deviate from the trend by a wide margin. We also note relatively large error bars for these . The inconsistencies with results for disks are attributed to the unstable local perturbations originated from the random Poissonian noises that disturb the collective motion differently from realization to realization. In this regime, we conclude in the breakdown of the effective potential assumption.
Considering now the fraction of number of trapped particles, the fraction tends to decrease with for . This can be explained by that the velocity is more dispersed when is higher, so there are less particles close to the modes angular frequency. At the other end of the plot where , we notice the significant drop of the fraction. This is another indication of the involvement of the unstable local fluctuations. Such fluctuations perturb the orbital motion of particles so that some of them are dragged away from the resonance and do not become part of the bar.
In past literatures, the loss of bar angular momentum has been conjectured to be caused by the dynamical friction acting on the rigid bar when it is spinning through the background particles (Weinberg, 1985). Another hypothesis is that the angular momentum loss is regulated by the transfer between the inner and outer resonances (Little & Carlberg, 1991; Athanassoula, 2003; Martinez-Valpuesta et al., 2006). In our case, the mechanism of the angular momentum loss is that the particles are trapped by the corotation resonance and some of them are transferred outwards, carrying the angular momentum away from the disk center to the outer spiral components that rotate more slowly.
4.3 Epicyclic oscillation of bar
In this section, we focus on the evolution of further from the formation phase. From Fig. 2, we remark the oscillation of after the bar is fully developed. The oscillation is more noticeable when is close to whereas it is much weakened, but still observable, for . We speculate that this oscillation is originated from the radial oscillation of particles forming the bar. Therefore, the underlying mechanism of this oscillation is the epicyclic motion. We will inspect the nature of that oscillation but the difficulty is that oscillates non-steadily that makes the determination of the oscillation frequency difficult. To resolve this, we linearly adjust relative to its adjacent principal maximum and minimum so that it oscillates in while maintaining the same frequency. An example of the pre- and post-processed for a selected case in Fig. 2 is shown in Fig. 6. The Fourier frequency of the processed is then computed in the time window of width just after the first peak and the ensemble-averaged frequency is plotted in Fig. 7, presented in units of the unperturbed epicyclic frequency . In the plot, we also provide the averaged radial oscillation frequency of particles in nearly circular orbits in the first few for each to represent the initial epicyclic frequency. Those particles correspond to particles with initial radial and tangential random velocities relative to their unperturbed orbital velocity below and for and , respectively. In addition, the averaged radial oscillation frequency of particles in more eccentric orbits, i.e., those with either of the radial or tangential random velocity ratio between , is also plotted for consideration. The effective epicyclic frequency as a function of from Eq. (16) is provided for comparison.
For , the effective explains reasonably well the radial oscillation frequency of nearly circular orbit particles in the first few . It slightly underestimates the measured but the decrease with is evident. There is not only the disk angular frequency that is shifted by finite but the epicyclic frequency is also shifted in the similar manner. The difference between the theoretical effective frequency and the simulated frequency could be explained by that the derivation takes only the initial density and velocity structures into calculation. Disks that evolve might re-adjust their internal configurations so they alter from the initial profiles. For particles in more eccentric orbits, the calculated frequencies are higher than those of particles in nearly-circular orbits but the decrease with is still evident and these frequencies are well below . It turns out that the effective epicyclic frequency provides a better description than adopting for a disk with non-zero . When , both calculated frequencies are lower than their counterparts which contradicts our assumption. These anomalies are, similar to the situation for angular motions in Fig. 5, attributed to the local instability that perturbs the particle epicyclic motion. In past literatures, it was a usual practice to derive the epicyclic frequency only from the disk gravitational potential, both in simulations (Dehnen, 1999; Rautiainen & Salo, 2000; Saha & Jog, 2014; Wu et al., 2016; Vasiliev, 2019) and in observations (Monari et al., 2019; Kawata et al., 2021; Lee et al., 2022). On the other hand, some other studies measured it directly (Athanassoula, 2003; Martinez-Valpuesta et al., 2006; Dubinski et al., 2009). We respond to those points by the fact that the radial motion of a particle in a disk of particles cannot be considered as being under the disk gravity only. It is also subject to the additional pressure force created by the velocity dispersion of particles forming a disk in equilibrium. This pressure force alters significantly and systematically the epicyclic motion as demonstrated by our simulation.
The second point captured from Fig. 7 is that the epicyclic frequency of the fully formed bar is lower than in the initial phase, although the decline is modest if , and the bar oscillation frequency keeps the same tendency with the line. This indicates that the effect from initial does not only imprint on the bar angular frequency as demonstrated in Sec. 4.2 but the final bar epicyclic frequency also depends systematically on . About the decline of the epicyclic frequency, we will seek the theoretical explanation of the transfer of the radial action. We adopt the analysis of Athanassoula (2003) for the angular momentum transfer and we will adapt it for the radial counterpart. First of all, we recall that the distribution function of a flat disk in an equilibrium can generally be expressed as a function of the two action variables, i.e., . The first one is the radial action, or , that is proportional to the epicyclic frequency and the second one is the azimuthal action and it is equal to the orbital angular momentum. The action angle and frequency of the corresponding can be derived from the unperturbed Hamiltonian as follows
| (25) |
By definition, and correspond to the epicyclic and orbital frequencies, respectively. Next, we write the disk potential with time-evolving perturbations as
| (26) |
where is the unperturbed axisymmetric component, is the non-axisymmetric perturbation and is the complex perturbation frequency. We separate into the real part that represents the pattern speed and the imaginary part that designates the growth rate provided that it is negative. We remind that the analysis in action-angle coordinates is valid if the perturbation grows slowly. The potential perturbation can then be expanded in Fourier series as
| (27) |
where is the Fourier coefficient calculated by
| (28) |
We follow the derivation of Athanassoula (2003) to obtain the rate of change of and it yields
| (29) |
For the slowly-growing perturbations, i.e., , the change of the radial action variable is possible only if
| (30) |
which corresponds to the resonance condition of particles with perturbations frequencies . From Eq. (29), the sign of depends on the sign of and in front of the derivatives. In general, the derivative of with respect to is negative. Therefore, the part that gains the radial action from the bar, or , is that with positive and , which corresponds to the outer Lindblad resonance. From the derivation, the radial action transfer from the bar to the outer component that rotates more slowly is justified. That the epicyclic frequency evolves in time during the bar formation is an important information when considering the bar evolution as the epicyclic frequency is equally important as the angular frequency. In past studies, the measurement of the oscillation frequency of the bar parameter has been performed by, for instance, Miller & Smith (1979) and Hilmi et al. (2020). The latter work concluded that the oscillation was attributed to the interaction with the spiral pattern. According to our simulation, we ascertain that the epicyclic motion takes a major role in that oscillation since it correlates with according to the effective potential assumption.
4.4 Kinematics and density profile of bar-hosting disks
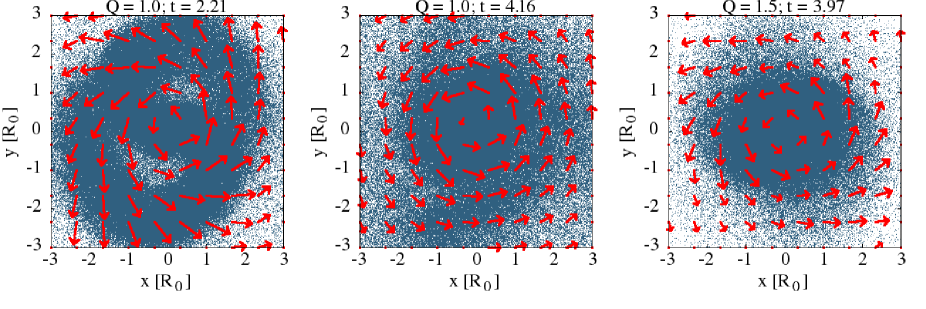
In this section, we inspect the kinematical and structural details of the disk hosting the bar. Shown in Fig. 8 is the disk intrinsic velocity fields on the face-on view, in arbitrary units, for and at different time which represent the violent and gentle bar-forming processes, respectively. The velocity field is computed by locally averaging the velocities of particles at each position. We consider first the case where . At , we note the significant radial velocity component on the spiral pattern in the linear instability phase. Later at , no prominent radial motion is observed anymore on the spiral arm. For , the radial velocity near the bar ends is weaker than the counterpart. This justifies that the radially outward motion in the linear instability phase is much suppressed if is higher.
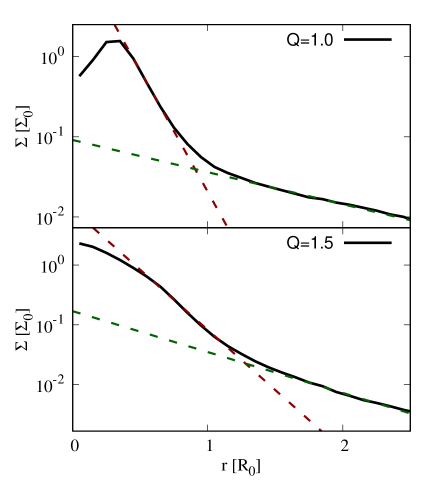
Last but not least, we examine the radial surface density profile of the disk in barred states. Shown in Fig. 9 is the annularly-averaged surface density as a function of radial distance for disks with and at . We perform the fitting with the exponential decay function for different disk parts. In general, the surface brightness of disk galaxies in observations or the surface density of disks in simulations fall into one of the three types. The Type-I profile represents the single exponential decay while for the Type-II and the Type-III profiles, they exhibit the double exponential decays separated by break radii. The Type-II (or down-tuning) profile has the density beyond the break radius decreasing more steeply than the inner part and vice versa for the Type-III (or up-tuning) profile. From Fig. 9, it turns out that both disks manifest the Type-III profile. The obtained Type-III profile is in accordance with past literatures that also obtained this profile (Mayer & Wadsley, 2004; Debattista et al., 2006). This is another indication of the common process underlying the bar formation in low- and high- regimes.
5 Bar instability in disk-halo system
5.1 Effect from spherical halo potential to critical
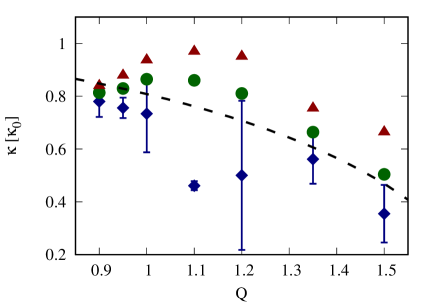
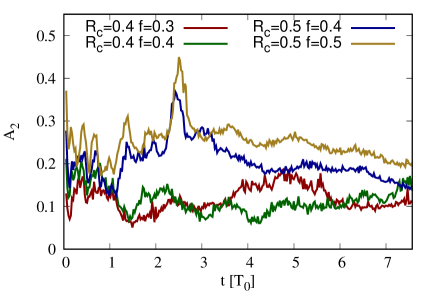
In the entire of Sec. 5, we inspect the bar instability in the composite disk-halo systems in many aspects. We examine first of all if the presence of halo affects the stability criterion for the disk with the same surface density and profile comparing to the value reported in Sec. 4.1. Shown in Fig. 10 is the time evolution of for disks in rigid and live halos and for various . In rigid halo simulations, the bar formation is observed until . When reaches , evolves quietly all along the simulation, which indicates that this case is bar-stable. For the disk in live halo, it exhibits a stronger amplification as attains, on average, to higher values. The bar formation is still observed until where is able to reach . When , the increase of is still seen but it fails to establish the prominent barred structure as the value of is too low to render the apparent barred structure according to the study of Algorry et al. (2017). It is therefore acceptable to classify this case as unbarred.
That the disk in live halo is less stable and it tends to build a stronger bar is possibly due to the particle nature of the halo. That particle halo adds up the finite- fluctuations to those of the disk, resulting in a stronger seed of the two-armed spiral modes. These additional fluctuations do not exist in the smooth rigid halo. As a consequence, the critical for both scenarios slightly differ as the value of proves sufficient to stabilize the disk in rigid halo while it has to be to suppress the amplification of modes in live halo case. Another difference is that the modest amplification of bar modes is still observed in live halo scheme although it is classified as bar-stable.
In continuity with the plots, it is evident that the disk is bar-unstable although exceeds , which was sufficient to stabilize the isolated disk (see Fig. 2). The critical for disk-halo systems is somewhere between , depending on the halo type. Because we control the disk surface density and the profile to be the same as those in the isolated cases, the elevation of critical is due to the only different factor which is the differential rotation. It engenders the swing amplification and, from that process, the spiral density waves are amplified by the disk shearing in combination with the synchronized epicyclic motion (Julian & Toomre, 1966; Toomre, 1981). Such mechanism enhances the non-axisymmetric spiral modes in addition to the exponential growth of the two-armed modes by the linear instability that was addressed in Sec. 4. This explains why the composite disk-halo system with greater than is still prone to the bar instability because the combined procedures amplify the two-armed modes more efficiently. The swing amplification is absent in isolated disks that rotate rigidly.
We compare our stability test with the past renowned criteria of bar stability. We revisit two frameworks which are the Ostriker-Peebles (OP) criterion (Ostriker & Peebles, 1973) and the Efstathiou-Lake-Negroponte (ELN) criterion (Efstathiou, Lake, & Negroponte, 1982). The former criterion proposed the ratio of the rotational kinetic energy to the potential energy as an indicator, i.e.,
| (31) |
The disk is supposed to be bar-stable when . Otherwise, the ELN indicator incorporated both the effects from the random motion and the mass concentration and it can be written as
| (32) |
where is the maximum tangential velocity, is the disk mass and is the characteristic disk radius, which is set to for our case. The disk is supposed to be stable if . We numerically calculate both indicators for our disk-halo initial states and we obtain and , and and for and , respectively. From our numerical results, it turns out that our critical is slightly above the proposed value as it is around . On the other hand, our critical is slightly below the theoretical value, being in the range of . Note that the disk family that we adopt differs from those employed in their works. Different disk physical and kinematical structures might possibly lead to the offset of critical value.
Another factor which plays an important role in the bar evolution is the vertical effect, via the buckling instability by which the kinematics of particles forming the bar evolves vertically (Combes et al., 1990; Aumer & Binney, 2017; Li et al., 2023). Apart from the buckling instability, the effect from disk thickness alone can also affect the bar-forming dynamics and the bar kinematics in many ways. For instance, the bar formation in a thick disk can be delayed (Ghosh et al., 2023) and the established bar tends to be longer and more slowly-rotating (Klypin et al., 2009) than the situation in a thin disk. Moreover, the spiral modes are more short-lived in the thick disk because of the suppressed swing amplification (Ghosh & Jog, 2018, 2022). All of these effects are important to the fate of the entire system consisting of disk, bar and spiral arms. On the contrary, our study employs the razor-thin disk in which the effect from disk thickness is absent. This might be another cause of the discrepancy with other simulations.
5.2 Bar environment and interaction with halo
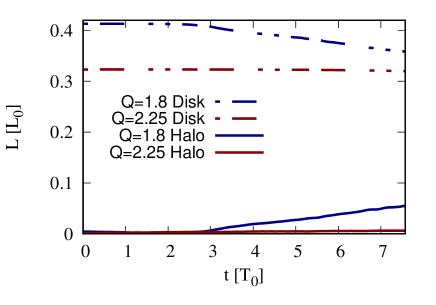
In this section, we investigate the bar evolution in live halo to a greater detail comparing to past studies. There were reports of two important mechanisms underlying the bar evolution. The first one is the angular momentum transfer between disk and halo particles that causes the bar slow-down (Athanassoula, 2003; Holley-Bockelmann et al., 2005; Athanassoula, 2014). To address this, time evolutions of disk and halo angular momenta for and are plotted in Fig. 11, in units of . The former case exhibits clearly the angular momentum transfer from disk to halo in coherence with the bar development, in line with the result of Dubinski et al. (2009). We further demonstrate that, for the case of in which the bar is not effectively formed, the angular momentum transfer does not take place.
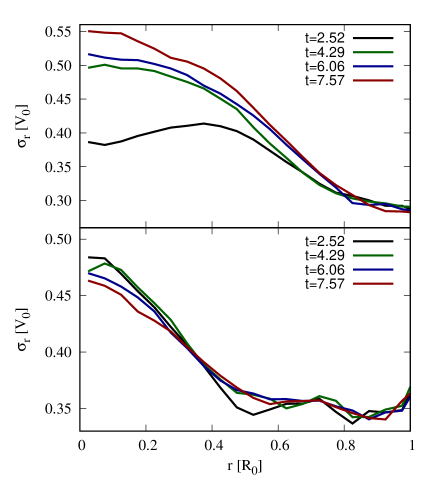
Another important mechanism is the radial heating, or the excitation of star kinematics by non-axisymmetric forces from bar or spiral arms (Minchev & Quillen, 2006; Gustafsson et al., 2016; Ghosh et al., 2023). To verify this, we plot the radial velocity dispersion profile, or , for and at different time in Fig. 12. For , profile in the bar region is elevated in accordance with the progression of . On the contrary, profile alters modestly for case which is bar-stable. These results affirm the occurrence of radial heating by the bar force as spotted in past literatures, while it is not active without the bar formation.
5.3 Breakthrough bar in supercritical- disks
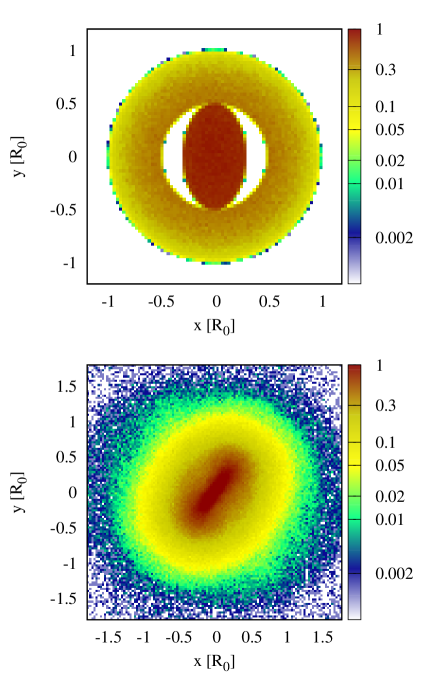
Finally, we explore the possibility of the bar formation in supercritical- disks. This inquiry aims to challenge recent observations in which barred galaxies have been spotted at redshift greater than (Guo et al., 2023). In that era, disk galaxies were typically gas-rich and turbulent. These indicated the hypothetically higher than those in the local universe. The fact that bars were spotted in such galaxies implied that they were bar-unstable, even though their kinematical conditions were not in favor. Furthermore, other observational evidences and simulations revealed the barred structures that were able to emerge in thick galactic disks, which also implied that they were kinematically hot (Kasparova et al., 2016; Martig et al., 2021; Ghosh et al., 2023). From our past results, we have shown that there existed a critical above which the circular disk was stable against the bi-symmetric perturbations in all scenarios. To resolve this puzzle, we perform further test to verify if the bar is able to be formed in supercritical regime. We employ the rigid halo framework in which the stable disk is more quiet than the live halo counterpart. We choose that is even above the highest examined in Sec. 5.1, that was equal to , and it was sufficient to stabilize the disk. In other words, the chosen disk kinematical condition here is hotter than the hottest and bar-stable disk in Sec. 5.1. This chosen almost reaches the limiting value at which the Jeans equations yield the imaginary tangential velocity. We will make some modification of the disk center in the attempt to enhance the initial bi-symmetric perturbations to see if it can trigger the bar formation in such disk environment. To do so, we modify the positions of particles inside a core radius so that they are now confined in an ellipse of semi-major axis and flattening . Finally, the velocity structure of the disk is assigned according to the new disk configuration. This modification introduces the large-scale bi-symmetric perturbations which are supposed to be stronger than those originated from the Poissonian noise alone. An example of the initial condition with modified core of and is depicted in the top panel of Fig. 13. To inspect the following evolution, time evolution of the bar strength is plotted in Fig. 14 for different and . We capture the strong breakthrough bars in the two cases as is able to reach at the maximum and it remains high afterwards. One another case also indicates a weaker bar with almost reaching . In those cases, the maximum clearly exceeds the value in the early stage which indicates the efficient bar formation. That breakthrough bar is further examined by inspecting visually the surface density map of the case in the top panel of Fig. 13 while in the bottom panel, it depicts that disk at . We spot an evident barred structure residing in that disk.
In addition to our proposed mechanism of the bar formation in supercritical- disks, the breakthrough bar was alternatively conjectured to be built by the close galactic encounter. That hypothesis has been initiated and tested by a number of simulations of the fly-by between a pair of galaxies and the bar formation in an initially bar stable disk has been reported, provided that the tidal interaction was sufficiently strong (Noguchi, 1987; Gerin et al., 1990; Gajda et al., 2017; Ghosh et al., 2021). In a larger frame, the analysis of evolution of interacting galaxies in the large-scale cosmological simulations also validated that possibility (Peschken & Łokas, 2019; Łokas, 2021). The fly-by scenario shares one similarity with our scenario: the hot disk can become unstable if it is triggered by sufficiently strong bi-symmetric perturbations of any origins. However, there is one major difference. The galactic fly-by scenario requires the perturbations from another encountering object. On the other hand, our scenario is the spontaneous scenario given an asymmetric seed. We do not rule out the possibility of this bar formation scenario as, according to some fly-by simulations (see, e.g., Lang et al. 2014; Łokas 2018), the emergence of unstable asymmetric seed was possible when the tidal interaction was not sufficiently strong to build up the tidal bar but it nevertheless left the disk center more eccentric than the initial state. It also hinted a sign of ongoing evolution. In some other cases with intermediate perturbations, the bar strength evolution exhibited a two-step pattern: it was boosted at first to a certain value by the encounter and remained there for a period of time. Afterwards, it evolved again to a higher value. We speculate that this was the secondary (or post-encounter) bar formation process that was self-induced by the asymmetric seed left by the past fly-by. This process is a distinct process from the direct tidal bar formation in which the tidal force forms the bar directly. This post-encounter scenario can potentially explain the origin of a number of observed hot barred galaxies aside the tidal bar hypothesis.
6 Conclusion
In this work, we investigate the -dependence of the bar formation and evolution in the Maclaurin/Kalnajs disk. At the first step, we consider the disk in isolation which has uniform rotational and epicyclic frequencies regardless of the radial position. In principle, particle trajectories significantly deviate from circular orbit when the velocity dispersion constructed from any model of is imposed, whereas the estimate of the particle natural frequencies bases on the nearly-circular orbit assumption. To resolve this, we propose the effective potential hypothesis as the governing potential that is the combination of the gravitational potential and the pressure potential arising from the velocity dispersion. Consequently, we retrieve the circular orbit in that effective potential and all disk natural frequencies become the functions of only with the choice of constant- model. We explore the disk evolution for a considerably wide range of covering those that are greater than which conform with the Toomre’s criterion and a few to examine how the local axisymmetric instability affects the results.
For the overview on the disk evolution in isolation, bars can be developed when . A lower leads to a more rapid bar formation and the spiral structure is prominent whereas, for the high- disk, the bar is formed gently with no visually detectable spiral pattern. Nevertheless, the inspections of the logarithmic spiral pitch angle during the early phase and the surface density in the barred stage suggest that the mechanisms underlying the bar formation are the same. The entire process from the initially bar-unstable disk to the final barred state can be described as follows. Firstly, the linearly unstable two-armed modes are the fastest-growing modes that build up the two-armed spiral pattern from the Poissonian noise. At the end of these modes, the bar is formed and remains in shape by the remnant of the bi-symmetric perturbations from the earlier process. This phase is known as the non-linear bar instability. Increasing just tunes down the whole process to a lesser degree.
With a closer look into the disk dynamics, we find that the angular frequency of the linearly unstable two-armed modes and the bar pattern speed correlate with the effective rotational frequency that is a function of if . Not only the angular frequencies of modes, the epicyclic frequencies of particles in the early phase and in the barred phase can also be described by the effective potential hypothesis in the similar way. Below that limit, the local instability becomes significant in perturbing the collective motion so the measured frequencies deviate from the theory. These results underline the importance of not only as the stability indicator but it is also imprinted in the entire disk and bar dynamics. As a final remark, although the overall evolution can reasonably be well explained in relating to for the simple Maclaurin/Kalnajs disk because the natural frequencies are uniform, a more realistic disk that rotates differentially might render more complexities as the radial dependence is additionally involved.
In addition, we examine the Maclaurin disk stability when it resides in a spherical dark matter halo. With the presence of halo, the critical is significantly shifted upward to be in the range of which is higher than the value for the isolated disks. This is attributed to the swing amplification that occurs in the differentially rotating disk. That mechanism enhances the growth of the spiral modes in addition to the linear two-armed modes instability, causing the disk to be more susceptible to the subsequent bar instability due to the combined spiral-mode amplification procedures than in the isolated disk that rotates rigidly. Also in the disk-halo system, we explore the possibility of the bar formation above critical . We demonstrate that the enhanced bi-symmetric perturbations from the modified initial disk center can trigger the bar instability effectively and the disk ends up with the bar strength comparable to the low- counterparts without disk modification. This is another hypothesis of the spontaneous bar formation in hot disk that was implied by recent observations and simulations.
References
- Algorry et al. (2017) Algorry, D. G., Navarro, J. F., Abadi, M. G., et al. 2017, MNRAS, 469, 1054
- Athanassoula (2002) Athanassoula, E. 2002, ApJ, 569, L83
- Athanassoula (2003) —. 2003, MNRAS, 341, 1179
- Athanassoula (2014) —. 2014, MNRAS, 438, L81
- Athanassoula & Misiriotis (2002) Athanassoula, E., & Misiriotis, A. 2002, MNRAS, 330, 35
- Aumer & Binney (2017) Aumer, M., & Binney, J. 2017, MNRAS, 470, 2113
- Barazza et al. (2008) Barazza, F. D., Jogee, S., & Marinova, I. 2008, ApJ, 675, 1194
- Binney & Tremaine (1994) Binney, J., & Tremaine, S. 1994, Galactic Dynamics (Princeton University Press)
- Christodoulou et al. (1995) Christodoulou, D. M., Shlosman, I., & Tohline, J. E. 1995, ApJ, 443, 551
- Collier (2020) Collier, A. 2020, MNRAS, 492, 2241
- Collier et al. (2019a) Collier, A., Shlosman, I., & Heller, C. 2019a, MNRAS, 488, 5788
- Collier et al. (2019b) —. 2019b, MNRAS, 489, 3102
- Combes et al. (1990) Combes, F., Debbasch, F., Friedli, D., & Pfenniger, D. 1990, A&A, 233, 82
- Combes & Sanders (1981) Combes, F., & Sanders, R. H. 1981, A&A, 96, 164
- Contopoulos (1980) Contopoulos, G. 1980, A&A, 81, 198
- Contopoulos & Papayannopoulos (1980) Contopoulos, G., & Papayannopoulos, T. 1980, A&A, 92, 33
- Debattista et al. (2006) Debattista, V. P., Mayer, L., Carollo, C. M., et al. 2006, ApJ, 645, 209
- Dehnen (1999) Dehnen, W. 1999, AJ, 118, 1190
- Dubinski et al. (2009) Dubinski, J., Berentzen, I., & Shlosman, I. 2009, ApJ, 697, 293
- Efstathiou et al. (1982) Efstathiou, G., Lake, G., & Negroponte, J. 1982, MNRAS, 199, 1069
- Eskridge et al. (2000) Eskridge, P. B., Frogel, J. A., Pogge, R. W., et al. 2000, AJ, 119, 536
- Freeman (1966) Freeman, K. C. 1966, MNRAS, 134, 15
- Fujii et al. (2018) Fujii, M. S., Bédorf, J., Baba, J., & Portegies Zwart, S. 2018, MNRAS, 477, 1451
- Gajda et al. (2017) Gajda, G., Łokas, E. L., & Athanassoula, E. 2017, ApJ, 842, 56
- Gerin et al. (1990) Gerin, M., Combes, F., & Athanassoula, E. 1990, A&A, 230, 37
- Ghosh et al. (2023) Ghosh, S., Fragkoudi, F., Di Matteo, P., & Saha, K. 2023, A&A, 674, A128
- Ghosh & Jog (2018) Ghosh, S., & Jog, C. J. 2018, A&A, 617, A47
- Ghosh & Jog (2022) —. 2022, A&A, 658, A171
- Ghosh et al. (2021) Ghosh, S., Saha, K., Di Matteo, P., & Combes, F. 2021, MNRAS, 502, 3085
- Guo et al. (2023) Guo, Y., Jogee, S., Finkelstein, S. L., et al. 2023, ApJ, 945, L10
- Gustafsson et al. (2016) Gustafsson, B., Church, R. P., Davies, M. B., & Rickman, H. 2016, A&A, 593, A85
- Hernquist (1993) Hernquist, L. 1993, ApJS, 86, 389
- Hilmi et al. (2020) Hilmi, T., Minchev, I., Buck, T., et al. 2020, MNRAS, 497, 933
- Hohl (1971) Hohl, F. 1971, ApJ, 168, 343
- Holley-Bockelmann et al. (2005) Holley-Bockelmann, K., Weinberg, M., & Katz, N. 2005, MNRAS, 363, 991
- Hozumi (2022) Hozumi, S. 2022, MNRAS, 510, 4394
- Hunter (1963) Hunter, C. 1963, MNRAS, 126, 299
- Jang & Kim (2023) Jang, D., & Kim, W.-T. 2023, ApJ, 942, 106
- Julian & Toomre (1966) Julian, W. H., & Toomre, A. 1966, ApJ, 146, 810
- Kalnajs (1971) Kalnajs, A. J. 1971, ApJ, 166, 275
- Kalnajs (1972) Kalnajs, A. J. 1972, ApJ, 175, 63
- Kalnajs & Athanassoula-Georgala (1974) Kalnajs, A. J., & Athanassoula-Georgala, E. 1974, MNRAS, 168, 287
- Kasparova et al. (2016) Kasparova, A. V., Katkov, I. Y., Chilingarian, I. V., et al. 2016, MNRAS, 460, L89
- Kataria & Das (2018) Kataria, S. K., & Das, M. 2018, MNRAS, 475, 1653
- Kataria & Das (2019) —. 2019, ApJ, 886, 43
- Kawata et al. (2021) Kawata, D., Baba, J., Hunt, J. A. S., et al. 2021, MNRAS, 508, 728
- Kim & Kim (2014) Kim, Y., & Kim, W.-T. 2014, MNRAS, 440, 208
- Klypin et al. (2009) Klypin, A., Valenzuela, O., Colín, P., & Quinn, T. 2009, MNRAS, 398, 1027
- Lang et al. (2014) Lang, M., Holley-Bockelmann, K., & Sinha, M. 2014, ApJ, 790, L33
- Lee et al. (2012) Lee, G.-H., Park, C., Lee, M. G., & Choi, Y.-Y. 2012, ApJ, 745, 125
- Lee et al. (2019) Lee, Y. H., Ann, H. B., & Park, M.-G. 2019, ApJ, 872, 97
- Lee et al. (2022) Lee, Y. H., Park, M.-G., Hwang, H. S., et al. 2022, ApJ, 926, 58
- Li et al. (2023) Li, X., Shlosman, I., Pfenniger, D., & Heller, C. 2023, MNRAS, 520, 1243
- Li et al. (2017) Li, Z.-Y., Ho, L. C., & Barth, A. J. 2017, ApJ, 845, 87
- Little & Carlberg (1991) Little, B., & Carlberg, R. G. 1991, MNRAS, 250, 161
- Łokas (2018) Łokas, E. L. 2018, ApJ, 857, 6
- Łokas (2021) —. 2021, A&A, 647, A143
- Long et al. (2014) Long, S., Shlosman, I., & Heller, C. 2014, ApJL, 783, L18
- Lynden-Bell & Kalnajs (1972) Lynden-Bell, D., & Kalnajs, A. J. 1972, MNRAS, 157, 1
- Marinova & Jogee (2007) Marinova, I., & Jogee, S. 2007, ApJ, 659, 1176
- Martig et al. (2021) Martig, M., Pinna, F., Falcón-Barroso, J., et al. 2021, MNRAS, 508, 2458
- Martinez-Valpuesta et al. (2006) Martinez-Valpuesta, I., Shlosman, I., & Heller, C. 2006, ApJ, 637, 214
- Masset & Tagger (1997) Masset, F., & Tagger, M. 1997, A&A, 322, 442
- Masters et al. (2011) Masters, K. L., Nichol, R. C., Hoyle, B., et al. 2011, MNRAS, 411, 2026
- Mayer & Wadsley (2004) Mayer, L., & Wadsley, J. 2004, MNRAS, 347, 277
- Menéndez-Delmestre et al. (2007) Menéndez-Delmestre, K., Sheth, K., Schinnerer, E., Jarrett, T. H., & Scoville, N. Z. 2007, ApJ, 657, 790
- Michel-Dansac & Wozniak (2006) Michel-Dansac, L., & Wozniak, H. 2006, A&A, 452, 97
- Miller & Smith (1979) Miller, R. H., & Smith, B. F. 1979, ApJ, 227, 785
- Minchev & Quillen (2006) Minchev, I., & Quillen, A. C. 2006, MNRAS, 368, 623
- Monari et al. (2019) Monari, G., Famaey, B., Siebert, A., Wegg, C., & Gerhard, O. 2019, A&A, 626, A41
- Noguchi (1987) Noguchi, M. 1987, MNRAS, 228, 635
- Ostriker & Peebles (1973) Ostriker, J. P., & Peebles, P. J. E. 1973, ApJ, 186, 467
- Peschken & Łokas (2019) Peschken, N., & Łokas, E. L. 2019, MNRAS, 483, 2721
- Polyachenko et al. (2016) Polyachenko, E. V., Berczik, P., & Just, A. 2016, MNRAS, 462, 3727
- Quillen et al. (2011) Quillen, A. C., Dougherty, J., Bagley, M. B., Minchev, I., & Comparetta, J. 2011, MNRAS, 417, 762
- Rautiainen & Salo (1999) Rautiainen, P., & Salo, H. 1999, A&A, 348, 737
- Rautiainen & Salo (2000) —. 2000, A&A, 362, 465
- Roshan et al. (2016) Roshan, M., Abbassi, S., & Khosroshahi, H. G. 2016, ApJ, 832, 201
- Saha & Elmegreen (2018) Saha, K., & Elmegreen, B. 2018, ApJ, 858, 24
- Saha & Jog (2014) Saha, K., & Jog, C. J. 2014, MNRAS, 444, 352
- Saha & Naab (2013) Saha, K., & Naab, T. 2013, MNRAS, 434, 1287
- Schulz (2009) Schulz, E. 2009, ApJ, 693, 1310
- Sellwood (1980) Sellwood, J. A. 1980, A&A, 89, 296
- Sellwood (1981) —. 1981, A&A, 99, 362
- Sellwood & Evans (2001) Sellwood, J. A., & Evans, N. W. 2001, ApJ, 546, 176
- Sellwood et al. (2019) Sellwood, J. A., Shen, J., & Li, Z. 2019, MNRAS, 486, 4710
- Shen & Sellwood (2004) Shen, J., & Sellwood, J. A. 2004, ApJ, 604, 614
- Springel (2005) Springel, V. 2005, MNRAS, 364, 1105
- Springel et al. (2001) Springel, V., Yoshida, N., & White, S. D. M. 2001, New Astron., 6, 79
- Toomre (1964) Toomre, A. 1964, ApJ, 139, 1217
- Toomre (1981) Toomre, A. 1981, in Structure and Evolution of Normal Galaxies, ed. S. M. Fall & D. Lynden-Bell, 111–136
- Vasiliev (2019) Vasiliev, E. 2019, MNRAS, 482, 1525
- Weinberg (1985) Weinberg, M. D. 1985, MNRAS, 213, 451
- Wu et al. (2016) Wu, Y.-T., Pfenniger, D., & Taam, R. E. 2016, ApJ, 830, 111