EAGLE and Illustris-TNG predictions for resolved eROSITA X-ray observations of the circumgalactic medium around normal galaxies
Abstract
We simulate stacked observations of nearby hot X-ray coronae associated with galaxies in the EAGLE and Illustris-TNG hydrodynamic simulations. A forward modeling pipeline is developed to predict 4-year eROSITA observations and stacked image analysis, including the effects of instrumental and astrophysical backgrounds. We propose an experiment to stack galaxies separated by specific star-formation rate (sSFR) to examine how the hot ( K) circumgalactic medium (CGM) differs for high- and low-sSFR galaxies. The simulations indicate that the hot CGM of low-mass (), high-sSFR (defined as the top one-third ranked by sSFR) central galaxies will be detectable to a galactocentric radius kpc. Both simulations predict lower luminosities at fixed stellar mass for the low-sSFR galaxies (the lower third of sSFR) with Illustris-TNG predicting brighter coronae around high-sSFR galaxies than EAGLE. Both simulations predict detectable emission out to kpc for stacks centered on high-mass () galaxies, with EAGLE predicting brighter X-ray halos. The extended soft X-ray luminosity correlates strongly and positively with the mass of circumgalactic gas within the virial radius (). Prior analyses of both simulations have established that is reduced by expulsive feedback driven mainly by black hole growth, which quenches galaxy growth by inhibiting replenishment of the ISM. Both simulations predict that eROSITA stacks should not only conclusively detect and resolve the hot CGM around galaxies for the first time, but provide a powerful probe of how the baryon cycle operates, for which there remains an absence of consensus between state-of-the-art simulations.
1 Introduction
Extended hot X-ray coronae have long been theorized to supply the gas necessary for star-formation in disc galaxies (Spitzer, 1956; White & Rees, 1978). White & Frenk (1991) predicted emission levels that should have been readily detected by Chandra and XMM-Newton. The initial surprise of weak or no detection of soft X-ray emission from disc galaxies (e.g. Benson et al., 2000; Li et al., 2006) has been interpreted as a signature of superwind feedback removing gas from halos and leaving behind substantially flattened central hot gas profiles (Crain et al., 2010).
Pointed observations have revealed X-ray coronae associated with individual, isolated elliptical galaxies (e.g. Forman et al., 1985; O’Sullivan et al., 2001; Goulding et al., 2016), whilst stacking ROSAT all-sky survey data about the coordinates of mainly early-type galaxies has revealed a strong correlation between the inferred CGM mass fraction and galaxy mass (Anderson et al., 2015). Detections associated with individual disc galaxies are primarily limited to rare, massive cases (e.g. Bogdán et al., 2013a, b; Li et al., 2017).
The eROSITA instrument on the Spectrum-Roentgen-Gamma mission (Merloni et al., 2012) launched in July 2019 will map the entire sky at greater sensitivity and higher spatial resolution than ROSAT, opening new possibilities to not only detect, but also resolve, the structure of emission from galaxies Milky Way-mass and below. Tenuous, diffuse X-ray halos around galaxies () are a ubiquitous prediction of realistic cosmological hydrodynamical simulations, including the EAGLE (Schaye et al., 2015; Crain et al., 2015; McAlpine et al., 2016) and Illustris-TNG (Pillepich et al., 2018; Nelson et al., 2018a, hereafter TNG) simulations.
Both these simulations broadly reproduce fundamental galaxy properties, including stellar mass functions, passive galaxy fractions, and morphological types in Mpc3 hydrodynamic volumes containing thousands of galaxies. However, EAGLE and TNG apply distinct prescriptions for stellar and super-massive black hole (SMBH) feedback that result in markedly different CGM masses at (Davies et al., 2020, hereafter D20). The feedback energy imparted over cosmic time is often enough to unbind a significant fraction of the CGM beyond the virial radius (Oppenheimer et al., 2020, D20). The notable differences in how energetic feedback operates as a function of galaxy type between EAGLE and TNG should make divergent and testable predictions for observations by X-ray telescopes with large collecting areas (Davies et al., 2019; Truong et al., 2020).
Observational characterization of the CGM has to date been driven primarily by UV absorption line observations of H i and metal ions in sightlines intersecting the gaseous environments of galaxies (e.g. Tumlinson et al., 2011; Stocke et al., 2013; Liang & Chen, 2014; Turner et al., 2014). These UV species mainly trace K gas (e.g. Ford et al., 2013; Rahmati et al., 2016), with diffuse metals indicating the presence of heavy elements transported from the ISM by superwind feedback (e.g. Aguirre et al., 2001; Oppenheimer et al., 2016; Nelson et al., 2018b). The total mass of the UV-traced CGM appears to be greater than that of the central galaxy (Werk et al., 2014; Prochaska et al., 2017), but simulations predict hot ( K) CGM masses that further outweigh the K CGM, even for disc galaxies (Ford et al., 2014; Oppenheimer et al., 2018). The hot CGM component therefore has the potential to prove more constraining for the total gaseous content of galactic halos. Additionally, the hot component almost certainly contains the vast majority of the CGM energy, which, if measured, would provide essential constraints on the ultimate fate of momentum and entropy from feedback.
The eROSITA mission will average a 2 ksec integration upon the release of its final all-sky survey (eRASS:8) comprising 4 years of observations. This letter makes eROSITA stacking predictions for nearby galaxies from the EAGLE and TNG simulations. The 15” spatial resolution of eROSITA should allow interior X-ray profiles to be resolved for nearby halos, which is why we propose stacking galaxies at .
2 Methods
2.1 Simulations
The EAGLE Ref-L100N1504 simulation (Schaye et al., 2015) is a Mpc3 smoothed particle hydrodynamics (SPH) run with a modified version of the Gadget-3 code (Springel, 2005) using a pressure-entropy implementation of SPH. It uses SPH and dark matter (DM) particles. The TNG-100 simulation (Pillepich et al., 2018) uses the AREPO (Springel, 2010) moving mesh hydro solver in a volume of Mpc3 with DM particles and initial gas cells. Both simulations have kpc gravitational softening lengths and gas and stellar mass resolutions of . The two models incorporate significantly different subgrid prescriptions for stellar and AGN feedback, but in both cases the relevant parameters were calibrated to ensure the reproduction of key observables. For EAGLE, these were present-day stellar masses (), galaxy disc sizes, and SMBH masses (). For TNG, the cosmic star formation history, galaxy star formation rates (SFR), and the gas fractions of galaxy groups were also considered. We use the snapshot that contains () central galaxies with for EAGLE (TNG).
2.2 Simulation galaxy samples
To make observationally-reproducible samples, we select simulated central galaxies based on and sSFR . We define two stellar mass bins called “low-mass” and “high-mass.” We use the EAGLE simulation to define the mass ranges, such that the low-mass (high-mass) bin spans centrals from () . Stellar mass limits can be converted to volume densities by rank-ordering central and selecting the volume density for galaxies greater than a given (e.g. in EAGLE corresponds to Mpc-3). Hence, the low-mass (high-mass) limits correspond to volume densities of () Mpc-3. To select TNG galaxies with the same volume density, we need to use appreciably higher mass limits, because TNG has dex higher average stellar masses than EAGLE at . The TNG low- and high-mass bins are and . By normalizing to volume density in two simulations that use nearly identical cosmologies, the halo masses are similar across the two simulations for each bin (Table 1).
| EAGLE | Low-Mass, | High-Mass, |
|---|---|---|
| # High-sSFR | 357 | 144 |
| sSFR Threshold | yr-1 | yr-1 |
| Range1 | ||
| # Low-sSFR | 356 | 143 |
| sSFR Threshold | yr-1 | yr-1 |
| Range | ||
| Illustris-TNG | Low-Mass, | High-Mass, |
| # High-sSFR | 482 | 200 |
| sSFR Threshold | yr-1 | yr-1 |
| Range | ||
| # Low-sSFR | 481 | 199 |
| sSFR Threshold | yr-1 | yr-1 |
| Range |
1 range for values in sample.
We create samples divided into bins of sSFR and define high and low-sSFR as the upper and lower thirds of the sSFR distribution. The resulting sSFR thresholds for each bin are listed in Table 1. The main motivation for these samples is that D20 showed that, for both EAGLE and TNG, sSFR is highly correlated with the gas content of the CGM, defined as
| (1) |
where and are respectively the radius and mass of the sphere, centered on a galaxy, with mean enclosed density of , and is the critical density for closure. A key objective of this stacking exercise will be to assess whether the diffuse X-ray luminosity of galaxies (at fixed ) indeed correlates with .
TNG has 35% more volume than EAGLE, and therefore a larger sample size for fixed . TNG has a wider range of sSFR values resulting in a larger gap in sSFR thresholds. Our aim is to design an experiment where observers can create samples of galaxies ranked by sSFR, without reliance on matching absolute values. For brevity, the intermediate sSFR bin is not discussed. We exclude halos with , which only affects high-mass samples, because our mocks indicate these X-ray halos are individually detectable by eROSITA.
We stack 100 (50) low-mass (high-mass) galaxies at a time, observed at . Based on volume densities for both sSFR bins, we expect 230 (95) low-mass (high-mass) galaxies per bin to be located at an average distance of for the entire sky with galactic latitude . We make conservatively small samples given that ground-based surveys and/or data releases may access less than half of the sky. Our goal is to create the nearest sample, limited by the volume of the local Universe, that can be used to stack and spatially resolve extended emission. Galaxies in the real Universe will reside at a variety of distances, but our stacks are representative of local galaxies where contamination from galactic sources (X-ray binaries, hot ISM) should be mostly limited to the inner ( kpc at ). We tested stacking thousands of galaxies, finding similar results but with a reduced ability to resolve the emission structure for kpc.
2.3 Forward Modeling Pipeline
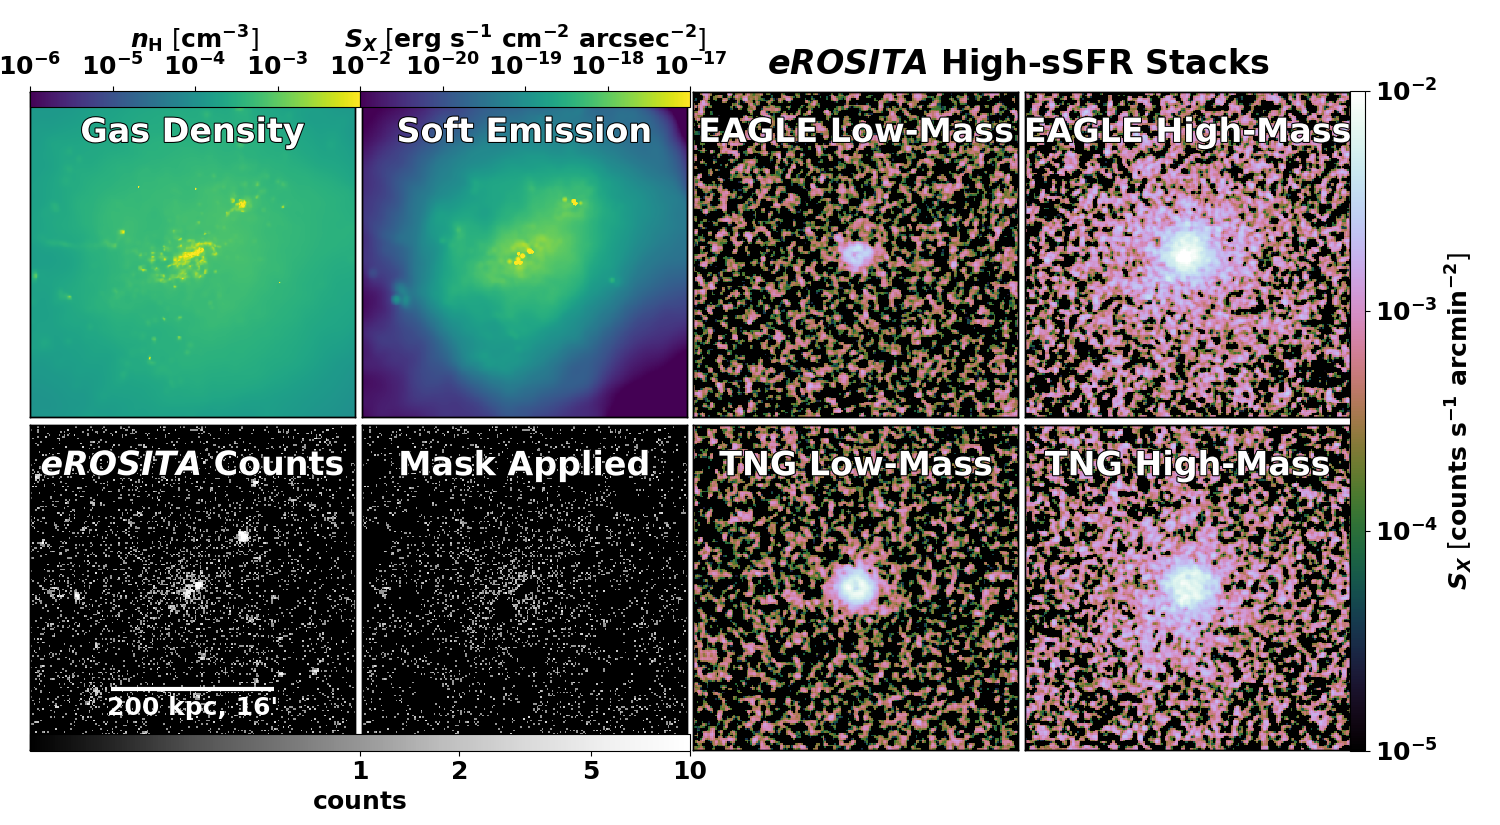
We use the pyXSIM package111http://hea-www.cfa.harvard.edu/~jzuhone/pyxsim/ (ZuHone & Hallman, 2016) to create a SIMPUT222http://hea-www.harvard.edu/heasarc/formats/simput-1.1.0.pdf file of mock photons emanating from hot, diffuse plasma out to for each halo. An example EAGLE halo is shown in the left four panels of Fig. 1. For each fluid element with and hydrogen number density within this region, pyXSIM randomly generates photons using a Monte-Carlo sampling of X-ray spectra from the Astrophysical Plasma Emission Code (APEC; Smith et al., 2001). APEC spectra assume collisional ionization equilibrium given the density, temperature, and metallicity (including 9 individually-tracked abundances) of each fluid element. We do not simulate X-rays from the ISM.
In addition to the source photons, we include simulated Galactic foreground emission and a Cosmic X-ray background (CXB) randomly-generated using the SOXS package333http://hea-www.cfa.harvard.edu/~jzuhone/soxs/; background described in http://hea-www.cfa.harvard.edu/~jzuhone/soxs/users_guide/background.html. Galactic absorption assuming a column of is applied to the source and CXB photons.
The SIXTE simulation software (Dauser et al., 2019) uses SIMPUT file inputs to create eROSITA 2 ksec observations centered at the position of the galaxy. The erosim tool generates event files for the seven eROSITA cameras and combines them into one image, as shown in Fig. 1 (lower left panel) with energy clipped to show only soft X-ray counts ( keV). The image, which includes the instrumental background and point spread function, is dominated by CXB photons.
The CIAO (Fruscione et al., 2006) wavdetect routine detects concentrated sources, including CXB sources, bright satellites, and point source-like emission at the position of the galaxy, which we then mask. Given that we do not include galactic ISM nor expected contributions from X-ray binaries, which should dominate at the position of the stellar component, we focus on emission outside a projected radius kpc at . Individual masked images with pixels are added together in our mock stacks, as are the individual exposure maps that include the wavdetect-generated masks. We make an off-source stack using the same procedure performed without galaxy halo emission. Both stacks are divided by their respective summed exposure maps to obtain , and the off-source stack is subtracted from the on-source stack. Four reduced stacks of high-sSFR galaxies, low-mass and high-mass samples for EAGLE and TNG, are shown in Fig. 1 (right panels).
3 Results
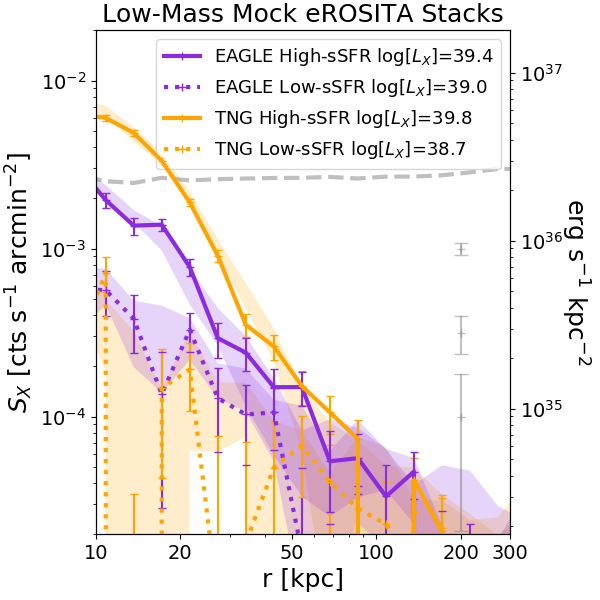
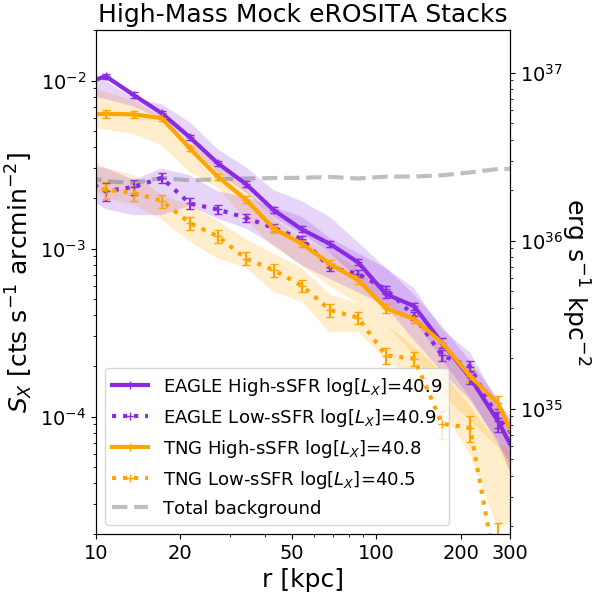
Figure 2 shows radial soft X-ray ( keV) surface brightness profiles () for the four samples of low-mass (left panel) and high-mass (right panel) galaxies. Purple (orange) lines show EAGLE (TNG) simulations for high-sSFR (solid) and low-sSFR (dotted) samples. There are 100 low-mass and 50 high-mass galaxies in each mock survey, shown along with Poisson error bars. Shaded regions correspond to spreads of 20 mock surveys. We calculate and list the average extended soft X-ray luminosity, , by integrating between 10 and 200 kpc, and converting to using eROSITA’s area response function with an average collecting area of cm2 and a mean photon energy of keV that we obtain from our SIMPUT files.
Most low-mass stacks appear to be detectable out to 50 kpc at a level of . TNG predicts high-sSFR galaxies to be brighter in the inner 50 kpc and have higher luminosities than low-sSFR galaxies. EAGLE predicts a similar trend, but a much smaller difference of . The coronae of low-mass, high-sSFR galaxies are 3 brighter in TNG than in EAGLE. All high-mass stacks appear to be detectable out to kpc with EAGLE predicting more luminous X-ray halos. Both simulations predict stronger interior ( kpc) emission around high-sSFR galaxies, but EAGLE predicts very similar profiles at kpc in contrast to TNG, which predicts stronger emission around high-sSFR galaxies everywhere.
The detection of extended hot halos relies on stable subtraction of the background, which has a level of and is indicated by the gray dashed line. Our pipeline suggests that it should be possible to detect count rates at up to below the background, which agrees well with the predicted background calculated in the eROSITA Science Booklet (Merloni et al., 2012). The error bars in Fig. 2 indicate only Poisson errors from the source and background stacks added in quadrature. The shaded regions represent an estimate of cosmic variance when stacking the galaxies contained within the simulation volumes, which can exceed Poisson errors, especially for low-mass, low-sSFR stacks.
Systematic errors that are not included in our pipeline may make it more difficult to detect source counts as low as 3% of the background level. We demonstrate the size of systematic errors using three stand-alone error bars in the left panel if we assume systematic errors of 3% the background, which is a precedent expected from previous Chandra and XMM-Newton data processing. This would raise the detectability threshold to , reducing the maximum radius out to where we can detect low-mass (high-mass), high-sSFR stacked emission to () kpc.
Smaller stacks including fewer galaxies should be able to test these models. We predict stacking only 30 low-mass galaxies will distinguish TNG high- and low-sSFR stacks, as well as EAGLE and TNG high-sSFR stacks from each other. This also means that our proposed experiment could bear similar results with less total integration time using 100 low-mass galaxies, perhaps as soon as the eRASS:2 (-year) data release.
We also perform a test where we take the median stacked instead of the mean, finding the same results, including integrated values, within 0.2 dex. This indicates extended emission is smooth, because discrete sources would create a patchy distribution and much lower medians relative to means.
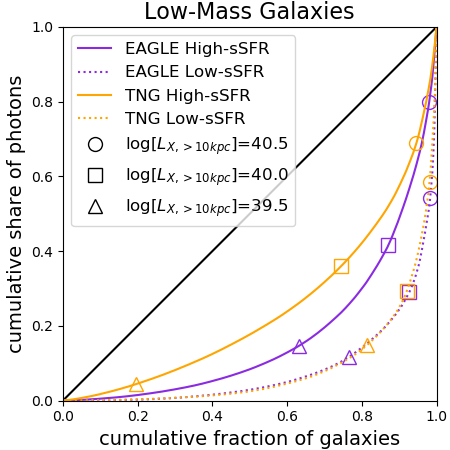
The eRASS:8 scanning pattern will provide deeper coverage at the ecliptic poles with 550 deg2 scanned at ksec; therefore we offer predictions for the distributions of individual halo emission that eROSITA should be able to probe in these deeper regions. We rank order halos by extended emission outside kpc ( at ) in each low-mass sample, and plot the cumulative photon contribution in Figure 3. The brightest low-mass stack, TNG high-sSFR galaxies, is also the most uniformly distributed, but nonetheless both simulations predict that low-sSFR galaxies are much more dominated by outliers than their high-sSFR counterparts. We quantify the inequality of using the Gini statistic
| (2) |
where is the mean extended luminosity of galaxies. We report , which is twice the geometric area between the locus of equality (solid black line) and each colored curve in Fig. 3. For EAGLE (TNG), high-sSFR galaxies (), and for low-sSFR galaxies (). Open symbols show the fraction of galaxies that have CGM luminosities smaller than the corresponding value indicated in the legend. For example, open squares show that 58% (64%) of extended emission comes from the 13% (26%) of brightest high-sSFR low-mass halos with in EAGLE (TNG). Low-sSFR halos have more diversity in , which results in the brightest halos dominating the low-mass stacks. High-mass galaxies have .
We also experiment using fixed stellar mass bins, because X-ray emission correlates with sSFR and the integrated star formation is of course encoded in . Unsurprisingly, EAGLE (TNG) luminosities increase (decrease) by dex, owing to EAGLE stellar masses increasing relative to TNG compared to the normalized volume density samples. Halo masses are higher for EAGLE than TNG when using fixed bins, while they are mainly overlapping for the normalized volume density samples (see Table 1 for mass ranges).
4 Discussion
Other publications have compared these simulations to existing X-ray observations of similar systems. Davies et al. (2019, their Appendix A) show EAGLE values are in the range of individually observed objects at , but the extended emission around more massive halos in EAGLE (mostly excluded in our samples) is too bright (see also Schaye et al., 2015). Truong et al. (2020) showed TNG predicts greater emission from galaxies at fixed mass with blue colors than red colors, which is consistent with our low-mass sSFR-divided samples; however, their approach is quite different to ours, as they concentrate on emission within the half-light radius of the galaxy and exclude the faint X-ray halos that are our focus. The Truong et al. (2020) low-mass star-forming central luminosities appear to be brighter than the late-types observed by Li & Wang (2013), but it remains to be seen how much of a discrepancy this is and how the extended emission compares.
Existing deep imaging of a handful of individual X-ray halos is capable of probing the values of our stacks, as in the cases of massive spirals (NGC 1961, (Anderson et al., 2016); NGC 6753, (Bogdán et al., 2017) and the sample of Li et al. (2017)). The emission at kpc from these halos is several times less than that of the high-mass high-sSFR stacks from both simulations. These galaxies were targeted based on being X-ray-bright and massive late-types. If they are representative of the galaxies in our eROSITA simulated stacks, the observations suggest that both EAGLE and TNG over-predict extended emission from high-mass star-forming galaxies in general. The hot gas fractions of galaxy groups in EAGLE are known to be too high (Schaye et al., 2015), and it is plausible that the expulsion of gas from galaxy-scale halos is also too weak. We also find that the metallicity of the central hot CGM of EAGLE galaxies is generally higher than the derived for NGC 1961 and NGC 6753. However, there is the possibility that these selected galaxies are not wholly representative of the local volume-selected sample (without regard to galaxy type) presented above. Hence, in the absence of extensive additional XMM-Newton or Chandra observations, only the proposed eROSITA dataset can provide definitive constraints. If eROSITA observes fainter stacked emission than either EAGLE or TNG, then future simulations of the galaxy population will need to ensure that in addition to reproducing key stellar properties of galaxies, the implementation and calibration of their feedback implementations satisfies these complementary constraints.
4.1 X-ray emission traces CGM baryon content
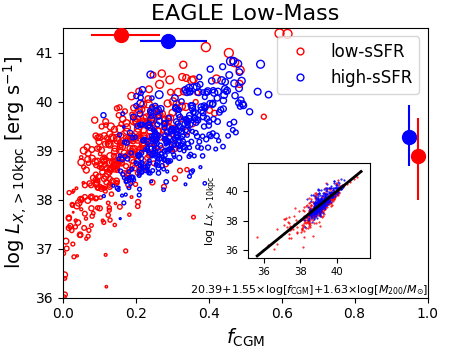
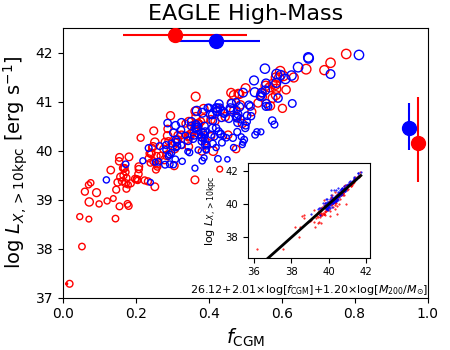
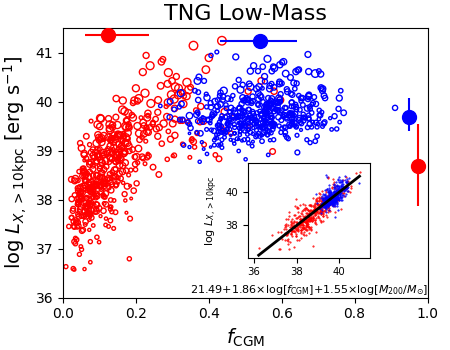
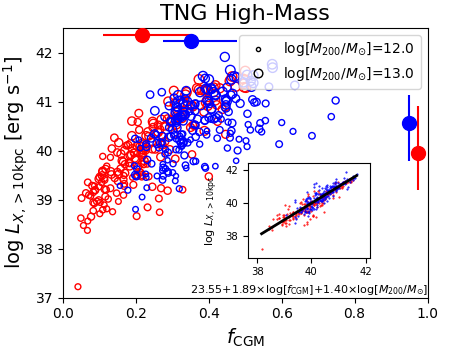
While soft X-ray emission around galaxies is strongly biased to the densest gas and is dominated by metal-line emission (Crain et al., 2013), Davies et al. (2019) showed that is highly correlated with the total CGM gas content in EAGLE. We show the extended X-ray luminosity as a function of in Fig. 4. Medians and spreads are indicated along the top () and to the right ().
We propose that extended emission in eROSITA stacks provides an effective proxy for CGM baryon content. The low-mass TNG bin has the largest difference between high and low-sSFR values ( vs. ; D20), which primarily drives the remarkable prediction from TNG that high-sSFR galaxies should have greater coronal X-ray luminosity than low-sSFR galaxies of the same . The difference in is only a factor of for EAGLE, which reflects the narrower range of (medians of vs. for these samples).
Typical halo masses in the low-mass stacks are with low-sSFR galaxies having a median halo mass dex higher than high-sSFR galaxies in both simulations. at fixed is higher for more massive halos, where is denoted by the symbol size in Fig. 4. The high-mass stacks exhibit the same overall behavior, but with galaxies occupying more massive halos (). There is also less difference between the high and low-sSFR subsamples and less scatter.
We perform linear regressions to produce least squares fits to using and in logarithmic space, and plot the results in inset panels of Fig. 4 with the best-fitting linear combinations to predict simulated values listed below the -axis. The power law exponents for range between , which are greater than that for that range between . This demonstrates that extended X-ray emission is well-described as a strong function of both variables with having a somewhat greater effect on average.
4.2 SMBH feedback can unbind gaseous halos
D20 showed that the central SMBH injects enough feedback energy over its integrated lifetime to unbind a significant fraction of the CGM gas in both simulations. In the EAGLE low-mass bin, low-sSFR galaxies have substantially higher SMBH masses (median ) than their high-sSFR counterparts (), which was shown by Davies et al. (2019) to be the signpost of AGN feedback expelling CGM gas and curtailing star formation. Oppenheimer et al. (2020) showed that the expulsion of CGM is a direct result of AGN feedback occurring primarily at in EAGLE, which results in lower values for low-sSFR, redder galaxies. EAGLE uses a thermal AGN feedback model (Booth & Schaye, 2009) that applies a single accreted rest mass-to-energy efficiency.
TNG also shows a strong anti-correlation between and , which also arises from the regulation of star formation via the SMBH expulsion of CGM gas (Terrazas et al., 2019, D20). However, the corresponding median BH masses for the high and low-sSFR low-mass TNG samples are and respectively. This smaller spread belies the much larger difference in , and arises because the kinetic mode AGN feedback, which operates when the central BH reaches a mass of , is far more efficient at ejecting halo gas than the TNG thermal mode (Weinberger et al., 2017). The small scatter and high values in TNG at appear difficult to reconcile with observations (e.g. Li et al., 2019)
4.3 Is the CGM dominated by cool or hot baryons?
COS-Halos UV detections of the inner, cool CGM indicate that metal-enriched gas at K traces an average at kpc from galaxies (Prochaska et al., 2017). Assuming pressure equilibrium with a K halo, the hot gas density at the same radii would be (Werk et al., 2014). These hot halo densities are at least dex lower than is predicted by both EAGLE and TNG at kpc, and would produce a hot CGM of much lower luminosity. Combined with the Prochaska et al. (2017) calculation that most baryons in halos are accounted for in the cool CGM, we must consider the possibility that the X-ray CGM could be dimmer than these simulations predict. Therefore, our proposed eROSITA stacking experiment provides a crucial constraint on the physical nature of the hot halo, which must dominate the CGM volume according to the low filling factor of cool absorbers (Stocke et al., 2013) but not necessarily the mass. The over-predictions of existing X-ray emission measurements discussed above may point to greater cool baryon fractions than in either simulation.
5 Summary
We develop a forward modeling pipeline that produces mock eROSITA stacked observations of X-ray emission from halos ( kpc, ) around central galaxies using the EAGLE and Illustris-TNG cosmological hydrodynamical simulations. Both simulations predict that the eROSITA 4-year all-sky survey, eRASS:8, will result in the robust detection of extended, soft X-ray emission from the hot CGM in stacking analyses. Our main results are as follows:
-
1.
X-ray halos hosting high-sSFR galaxies with should be detectable out to kpc and be brighter than for low-sSFR galaxies at fixed . Emission around more massive galaxies, , should be detectable out to kpc.
-
2.
TNG predicts a greater dichotomy between high- and low-sSFR X-ray halos at low mass than EAGLE. This is driven by a greater proportion of baryons being retained by star-forming TNG halos. EAGLE predicts brighter low-sSFR halos than TNG, driven by greater baryon fractions in low-sSFR EAGLE halos. TNG predicts brighter high-sSFR halos than EAGLE.
-
3.
Stacked X-ray luminosities are dominated by the brightest halos, more so for low-sSFR than high-sSFR galaxies at low mass. Deeper eROSITA surveying at the ecliptic poles should allow individual detections of the brightest halos and constrain the distribution of X-ray halo luminosities contributing to stacks.
-
4.
X-ray halos are sensitive probes of the baryon cycle that fuels star-formation and is disrupted by feedback, especially from SMBHs. X-ray surface brightness distributions should indicate whether the current generation of simulations ejects a sufficient fraction of the CGM, and even help to differentiate between the markedly different implementations of SMBH feedback employed by EAGLE and TNG.
Stacking eROSITA observations will probe galaxies at a variety of distances, and better signal-to-noise will be achieved by stacks of galaxies out to . Additionally, using spectral signatures (eROSITA has better than 0.1 keV resolution) to separate diffuse gas emission from background contaminants, and measure temperature and metallicity should be possible. Therefore, our proposed experiment presented here may represent the lowest hanging fruit for CGM science that eROSITA can achieve.
References
- Aguirre et al. (2001) Aguirre, A., Hernquist, L., Schaye, J., et al. 2001, ApJ, 561, 521, doi: 10.1086/323370
- Anderson et al. (2016) Anderson, M. E., Churazov, E., & Bregman, J. N. 2016, MNRAS, 455, 227, doi: 10.1093/mnras/stv2314
- Anderson et al. (2015) Anderson, M. E., Gaspari, M., White, S. D. M., Wang, W., & Dai, X. 2015, MNRAS, 449, 3806, doi: 10.1093/mnras/stv437
- Benson et al. (2000) Benson, A. J., Bower, R. G., Frenk, C. S., & White, S. D. M. 2000, MNRAS, 314, 557, doi: 10.1046/j.1365-8711.2000.03362.x
- Bogdán et al. (2017) Bogdán, Á., Bourdin, H., Forman, W. R., et al. 2017, ApJ, 850, 98, doi: 10.3847/1538-4357/aa9523
- Bogdán et al. (2013a) Bogdán, Á., Forman, W. R., Kraft, R. P., & Jones, C. 2013a, ApJ, 772, 98, doi: 10.1088/0004-637X/772/2/98
- Bogdán et al. (2013b) Bogdán, Á., Forman, W. R., Vogelsberger, M., et al. 2013b, ApJ, 772, 97, doi: 10.1088/0004-637X/772/2/97
- Booth & Schaye (2009) Booth, C. M., & Schaye, J. 2009, MNRAS, 398, 53, doi: 10.1111/j.1365-2966.2009.15043.x
- Crain et al. (2010) Crain, R. A., McCarthy, I. G., Frenk, C. S., Theuns, T., & Schaye, J. 2010, MNRAS, 407, 1403, doi: 10.1111/j.1365-2966.2010.16985.x
- Crain et al. (2013) Crain, R. A., McCarthy, I. G., Schaye, J., Theuns, T., & Frenk, C. S. 2013, MNRAS, 432, 3005, doi: 10.1093/mnras/stt649
- Crain et al. (2015) Crain, R. A., Schaye, J., Bower, R. G., et al. 2015, MNRAS, 450, 1937, doi: 10.1093/mnras/stv725
- Dauser et al. (2019) Dauser, T., Falkner, S., Lorenz, M., et al. 2019, A&A, 630, A66, doi: 10.1051/0004-6361/201935978
- Davies et al. (2019) Davies, J. J., Crain, R. A., McCarthy, I. G., et al. 2019, MNRAS, 485, 3783, doi: 10.1093/mnras/stz635
- Davies et al. (2020) Davies, J. J., Crain, R. A., Oppenheimer, B. D., & Schaye, J. 2020, MNRAS, 491, 4462, doi: 10.1093/mnras/stz3201
- Ford et al. (2014) Ford, A. B., Davé, R., Oppenheimer, B. D., et al. 2014, MNRAS, 444, 1260, doi: 10.1093/mnras/stu1418
- Ford et al. (2013) Ford, A. B., Oppenheimer, B. D., Davé, R., et al. 2013, MNRAS, 432, 89, doi: 10.1093/mnras/stt393
- Forman et al. (1985) Forman, W., Jones, C., & Tucker, W. 1985, ApJ, 293, 102, doi: 10.1086/163218
- Fruscione et al. (2006) Fruscione, A., McDowell, J. C., Allen, G. E., et al. 2006, Society of Photo-Optical Instrumentation Engineers (SPIE) Conference Series, Vol. 6270, CIAO: Chandra’s data analysis system, 62701V, doi: 10.1117/12.671760
- Goulding et al. (2016) Goulding, A. D., Greene, J. E., Ma, C.-P., et al. 2016, ApJ, 826, 167, doi: 10.3847/0004-637X/826/2/167
- Li et al. (2017) Li, J.-T., Bregman, J. N., Wang, Q. D., et al. 2017, ApJS, 233, 20, doi: 10.3847/1538-4365/aa96fc
- Li & Wang (2013) Li, J.-T., & Wang, Q. D. 2013, MNRAS, 428, 2085, doi: 10.1093/mnras/sts183
- Li et al. (2019) Li, Y., Habouzit, M., Genel, S., et al. 2019, arXiv e-prints, arXiv:1910.00017. https://arxiv.org/abs/1910.00017
- Li et al. (2006) Li, Z., Wang, Q. D., Irwin, J. A., & Chaves, T. 2006, MNRAS, 371, 147, doi: 10.1111/j.1365-2966.2006.10682.x
- Liang & Chen (2014) Liang, C. J., & Chen, H.-W. 2014, MNRAS, 445, 2061, doi: 10.1093/mnras/stu1901
- McAlpine et al. (2016) McAlpine, S., Helly, J. C., Schaller, M., et al. 2016, Astronomy and Computing, 15, 72, doi: 10.1016/j.ascom.2016.02.004
- Merloni et al. (2012) Merloni, A., Predehl, P., Becker, W., et al. 2012, ArXiv e-prints. https://arxiv.org/abs/1209.3114
- Nelson et al. (2018a) Nelson, D., Pillepich, A., Springel, V., et al. 2018a, MNRAS, 475, 624, doi: 10.1093/mnras/stx3040
- Nelson et al. (2018b) Nelson, D., Kauffmann, G., Pillepich, A., et al. 2018b, MNRAS, 477, 450, doi: 10.1093/mnras/sty656
- Oppenheimer et al. (2018) Oppenheimer, B. D., Schaye, J., Crain, R. A., Werk, J. K., & Richings, A. J. 2018, MNRAS, 481, 835, doi: 10.1093/mnras/sty2281
- Oppenheimer et al. (2016) Oppenheimer, B. D., Crain, R. A., Schaye, J., et al. 2016, MNRAS, 460, 2157, doi: 10.1093/mnras/stw1066
- Oppenheimer et al. (2020) Oppenheimer, B. D., Davies, J. J., Crain, R. A., et al. 2020, MNRAS, 491, 2939, doi: 10.1093/mnras/stz3124
- O’Sullivan et al. (2001) O’Sullivan, E., Forbes, D. A., & Ponman, T. J. 2001, MNRAS, 328, 461, doi: 10.1046/j.1365-8711.2001.04890.x
- Pillepich et al. (2018) Pillepich, A., Springel, V., Nelson, D., et al. 2018, MNRAS, 473, 4077, doi: 10.1093/mnras/stx2656
- Prochaska et al. (2017) Prochaska, J. X., Werk, J. K., Worseck, G., et al. 2017, ApJ, 837, 169, doi: 10.3847/1538-4357/aa6007
- Rahmati et al. (2016) Rahmati, A., Schaye, J., Crain, R. A., et al. 2016, MNRAS, 459, 310, doi: 10.1093/mnras/stw453
- Schaye et al. (2015) Schaye, J., Crain, R. A., Bower, R. G., et al. 2015, MNRAS, 446, 521, doi: 10.1093/mnras/stu2058
- Smith et al. (2001) Smith, R. K., Brickhouse, N. S., Liedahl, D. A., & Raymond, J. C. 2001, ApJ, 556, L91, doi: 10.1086/322992
- Spitzer (1956) Spitzer, Lyman, J. 1956, ApJ, 124, 20, doi: 10.1086/146200
- Springel (2005) Springel, V. 2005, MNRAS, 364, 1105, doi: 10.1111/j.1365-2966.2005.09655.x
- Springel (2010) —. 2010, MNRAS, 401, 791, doi: 10.1111/j.1365-2966.2009.15715.x
- Stocke et al. (2013) Stocke, J. T., Keeney, B. A., Danforth, C. W., et al. 2013, ApJ, 763, 148, doi: 10.1088/0004-637X/763/2/148
- Terrazas et al. (2019) Terrazas, B. A., Bell, E. F., Pillepich, A., et al. 2019, arXiv e-prints, arXiv:1906.02747. https://arxiv.org/abs/1906.02747
- Truong et al. (2020) Truong, N., Pillepich, A., Werner, N., et al. 2020, MNRAS, doi: 10.1093/mnras/staa685
- Tumlinson et al. (2011) Tumlinson, J., Thom, C., Werk, J. K., et al. 2011, Science, 334, 948, doi: 10.1126/science.1209840
- Turner et al. (2014) Turner, M. L., Schaye, J., Steidel, C. C., Rudie, G. C., & Strom, A. L. 2014, MNRAS, 445, 794, doi: 10.1093/mnras/stu1801
- Weinberger et al. (2017) Weinberger, R., Springel, V., Hernquist, L., et al. 2017, MNRAS, 465, 3291, doi: 10.1093/mnras/stw2944
- Werk et al. (2014) Werk, J. K., Prochaska, J. X., Tumlinson, J., et al. 2014, ApJ, 792, 8, doi: 10.1088/0004-637X/792/1/8
- White & Frenk (1991) White, S. D. M., & Frenk, C. S. 1991, ApJ, 379, 52, doi: 10.1086/170483
- White & Rees (1978) White, S. D. M., & Rees, M. J. 1978, MNRAS, 183, 341, doi: 10.1093/mnras/183.3.341
- ZuHone & Hallman (2016) ZuHone, J. A., & Hallman, E. J. 2016, pyXSIM: Synthetic X-ray observations generator. http://ascl.net/1608.002