iint \restoresymbolTXFiint
Early observations of the nearby type Ia supernova SN 2015F
Abstract
We present photometry and time-series spectroscopy of the nearby type Ia supernova (SN Ia) SN 2015F over days to days relative to maximum light, obtained as part of the Public ESO Spectroscopic Survey of Transient Objects (PESSTO). SN 2015F is a slightly sub-luminous SN Ia with a decline rate of mag, placing it in the region between normal and SN 1991bg-like events. Our densely-sampled photometric data place tight constraints on the epoch of first light and form of the early-time light curve. The spectra exhibit photospheric C ii absorption until days, and high-velocity Ca ii is particularly strong at days at expansion velocities of 23000 km s-1. At early times, our spectral modelling with syn++ shows strong evidence for iron-peak elements (Fe ii, Cr ii, Ti ii, and V ii) expanding at velocities km s-1, suggesting mixing in the outermost layers of the SN ejecta. Although unusual in SN Ia spectra, including V ii in the modelling significantly improves the spectral fits. Intriguingly, we detect an absorption feature at 6800 Å that persists until maximum light. Our favoured explanation for this line is photospheric Al ii, which has never been claimed before in SNe Ia, although detached high-velocity C ii material could also be responsible. In both cases the absorbing material seems to be confined to a relatively narrow region in velocity space. The nucleosynthesis of detectable amounts of Al ii would argue against a low-metallicity white dwarf progenitor. We also show that this 6800 Å feature is weakly present in other normal SN Ia events, and common in the SN 1991bg-like sub-class.
keywords:
supernovae: general – supernovae: individual (SN 2015F)1 Introduction
The uniformity of type Ia supernova (SN Ia) light curves allows them to be used as reliable distance indicators, providing crucial evidence for the accelerated expansion of the universe (Riess et al., 1998; Perlmutter et al., 1999). Despite many years of research and the general agreement that the progenitor stars of SNe Ia are accreting carbon-oxygen (CO) white dwarfs in binary systems, the nature of the companion star (Maoz et al., 2014), and the detailed physics of the explosion, remain uncertain.
The study of the outer layers of SN Ia ejecta can, in principle, provide important clues about the progenitor white dwarf and explosion physics by tracing the extent and amount of any unburnt material and the metallicity of the progenitor star (Höflich et al., 1998; Lentz et al., 2000; Walker et al., 2012; Maguire et al., 2012; Foley, 2013; Mazzali et al., 2014). In particular, early ultraviolet (UV) spectra are sensitive to the abundance of iron-group elements in the outermost layers, and can place important constraints on progenitor metallicity (Hachinger et al., 2013; Maguire et al., 2012; Foley, 2013; Mazzali et al., 2014). Any carbon detected in the outermost layers is particularly important, as carbon is the only element that could not be the result of thermonuclear burning, and can be directly associated with the original composition of the CO white dwarf. The amount and distribution of carbon can place strong constraints on the extension of the burning front and the degree of mixing during the explosion (Branch et al., 2003; Thomas et al., 2007; Parrent et al., 2012).
These outer layers can only be studied with early spectroscopic observations. The unburned material can be detected as absorption lines of C ii in the optical (Parrent et al., 2011; Thomas et al., 2011a; Folatelli et al., 2012; Silverman & Filippenko, 2012; Maguire et al., 2014; Cartier et al., 2014), and of C i in the near-infrared (NIR; Höflich et al., 2002; Marion et al., 2006, 2009; Hsiao et al., 2013, 2015; Marion et al., 2015). Recent studies have shown that at least 30 per cent of SNe Ia possess C ii absorption lines prior to maximum light (Thomas et al., 2011a; Folatelli et al., 2012; Silverman & Filippenko, 2012; Maguire et al., 2014).
Early spectra of SNe Ia also commonly exhibit ‘high-velocity’ (HV) features. These spectroscopic features correspond to absorption lines with expansion velocities much higher than the photospheric velocity, and usually greater than 15000 km s-1, sometimes reaching 30000 km s-1 or higher at the earliest phases. The most common HV features are of Ca ii, which seem to be a ubiquitous phenomenon at early stages (Mazzali et al., 2005; Childress et al., 2014b; Maguire et al., 2014; Silverman et al., 2015). HV features of Si ii are rarer (see Marion et al., 2013; Childress et al., 2013; Silverman et al., 2015), and HV features of other ions (S ii, Fe ii, C ii, O i) have also been claimed (Fisher et al., 1997; Hatano et al., 1999; Mazzali, 2001; Branch et al., 2003; Garavini et al., 2004; Nugent et al., 2011; Marion et al., 2013; Cartier et al., 2014).
Such high expansion velocities suggest that HV features are produced in the outermost layers of the SN ejecta. Therefore, it is reasonable to hypothesize that their origin is tightly linked to the progenitor system and/or the physics of the burning in the outermost layers of the white dwarf. HV features are ubiquitous in SN Ia spectra at about a week prior to maximum light (Mazzali et al., 2005; Marion et al., 2013; Childress et al., 2014b; Maguire et al., 2014; Silverman et al., 2015; Zhao et al., 2015), and decrease in strength with time (Maguire et al., 2014; Silverman et al., 2015; Zhao et al., 2015). Possible explanations for HV features include density enhancements from swept-up (Gerardy et al., 2004) or distant (Tanaka et al., 2006) circumstellar material, abundance enhancements in the outermost layers of the ejecta (Mazzali et al., 2005), or variations of the ionization state in the outer layers due to non ‘local thermodynamic equilibrium’ (LTE) effects (Blondin et al., 2013). Their origin remains a puzzle.
The advent of high-cadence wide-area sky surveys over the last ten years has meant that the quality and quantity of early SN discoveries has increased, and with it has come a wealth of early SN Ia spectroscopy. In this paper, we present spectroscopy and photometry of the nearby SN Ia SN 2015F. In Section 2, we introduce SN 2015F and describe the photometry and spectroscopy, beginning at d relative to peak brightness and extending to d past peak. We also estimate the distance to the host of SN 2015F (NGC 2442), the rise time, and the epoch of first light. In Section 3, we analyse the spectroscopic data, and in Section 4 we model the spectra using the syn++ code. We discuss our results in Section 5, and summarize in Section 6. Throughout, we assume a value for the Hubble constant of km s-1 Mpc-1.
2 Observations
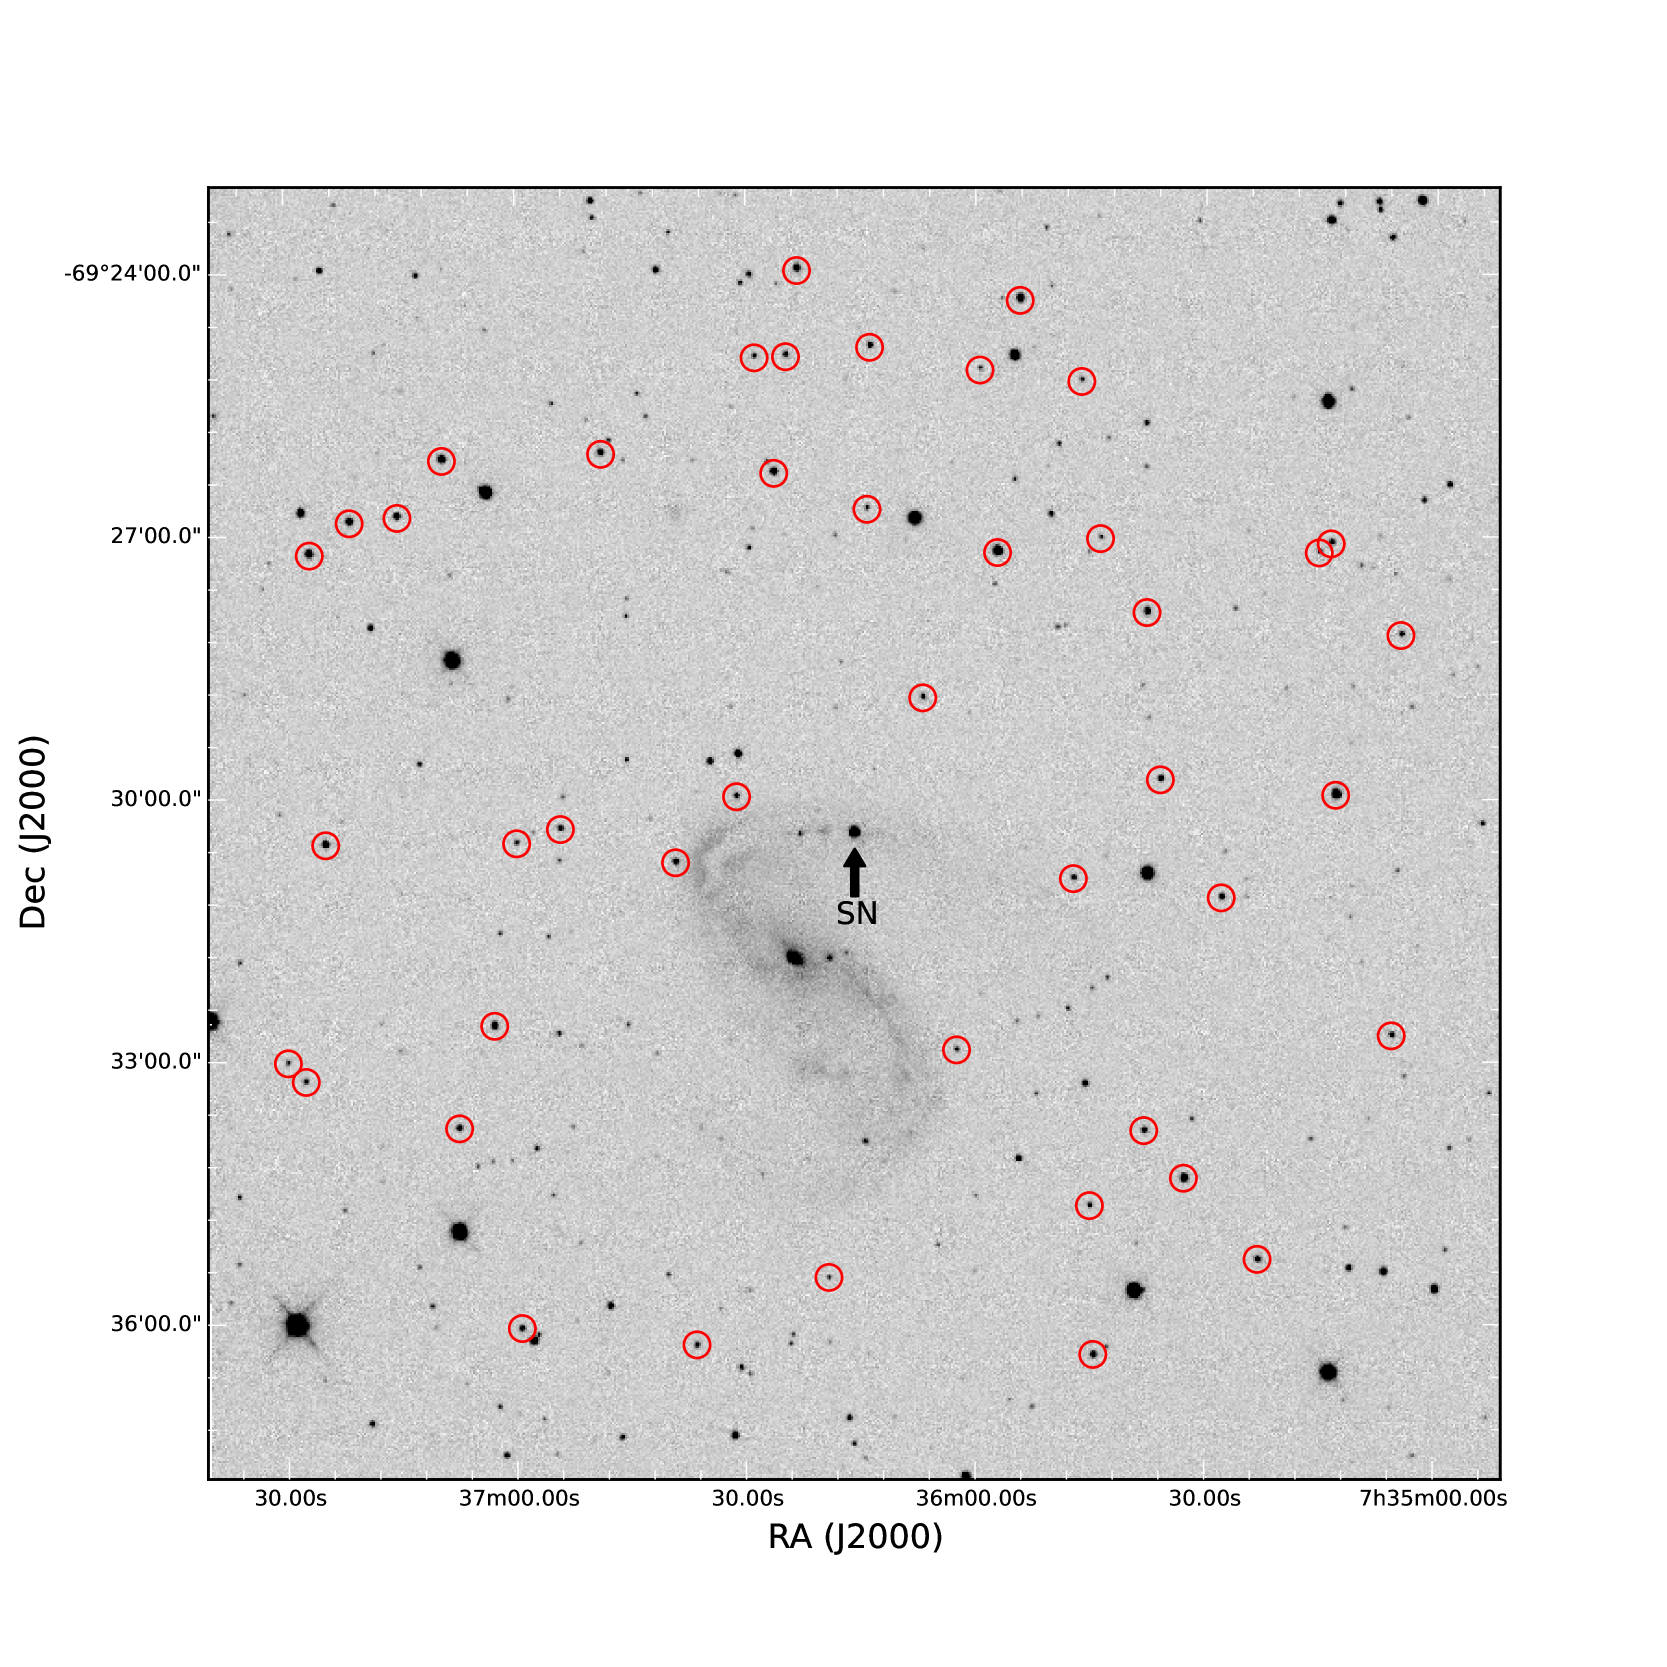
SN 2015F is located north and west of the centre of the nearby spiral galaxy NGC 2442, on the northern arm of NGC 2442, and was discovered on 2015 March 09.789 (all dates are UT) by Monard (2015) at , (see Fig. 1). The unfiltered discovery magnitude was 16.8. SN 2015F was promptly classified as a young SN Ia by the Public ESO Spectroscopic Survey of Transient Objects (PESSTO) collaboration on March 11.00 (Fraser et al., 2015). NGC 2442 is a SBbc galaxy with a recession velocity of km s-1 in HyperLeda111http://leda.univ-lyon1.fr/, and the Milky Way reddening along the line-of-sight to SN 2015F is mag (Schlafly & Finkbeiner, 2011), corresponding to a -band extinction () of 0.54 mag.
The classification of SN 2015F as a young SN sparked a detailed spectroscopic and photometric follow-up campaign, which we detail in this section.
2.1 Photometry
We used several instruments to obtain photometry of SN 2015F, the main characteristics of which are summarized in Table 1. Data obtained with the European Southern Observatory (ESO) Faint Object Spectrograph and Camera (v2) (EFOSC2) on the New Technology Telescope (NTT) were reduced with the PESSTO pipeline described in detail in Smartt et al. (2015), and the Las Cumbres Observatory Global Telescope Network (LCOGT) images were reduced using the Obsevatory Reduction and Acquisition Control Data Reduction pipeline (ORAC-DR Jenness & Economou, 2015). The reduction steps of the data obtained with the PROMPT telescopes are described in Pignata et al. (2011).
| Site | Telescope/instrument | Detector Size | Plate scale | Filters |
|---|---|---|---|---|
| (arcsec pixel-1) | ||||
| CTIO | PROMPT/CCD | |||
| La Silla | NTT/EFOSC | |||
| CTIO | 1-m LCOGT–005/SBIG | |||
| SSO | 1-m LCOGT–003/SBIG | |||
| SAAO | 1-m LCOGT–010/SBIG | |||
| SSO | 1-m LCOGT–011/SBIG | |||
| SAAO | 1-m LCOGT–012/SBIG | |||
| SAAO | 1-m LCOGT–013/SBIG | |||
| La Silla | NTT/SofI |
A optical photometric sequence of stars around the SN was calibrated in the and bandpasses against standard stars from the Landolt (1992) and Smith et al. (2002) catalogues, respectively. The magnitudes of the optical photometric sequence around SN 2015F (see Fig. 1) are presented in Table 8 in the Appendix. Point spread function (PSF) fitting photometry was performed on the SN frames using daophot (Stetson, 1987), and calibrated using the photometric sequence around the SN. The optical photometry of SN 2015F is in Table 9.
The NIR data were obtained with the Son of Isaac (SofI) camera on the NTT, and were reduced using our own IRAF222IRAF is distributed by the National Optical Astronomy Observatory, which is operated by the Association of Universities for Research in Astronomy, Inc., under cooperative agreement with the National Science Foundation. scripts to create a clean sky image, which we subtract from the science images. Pixel-to-pixel variations were removed by dividing the science images by a flat field image. We used scamp (Bertin, 2006) to obtain an astrometric solution, and swarp (Bertin et al., 2002) to combine the dithered images into a single image. The NIR photometric sequence was calibrated by observing Persson et al. (1998) standard fields close in time and in airmass to the SN observations. The photometry of the NIR photometric sequence and of SN 2015F are presented in Tables 11 and 12, respectively.
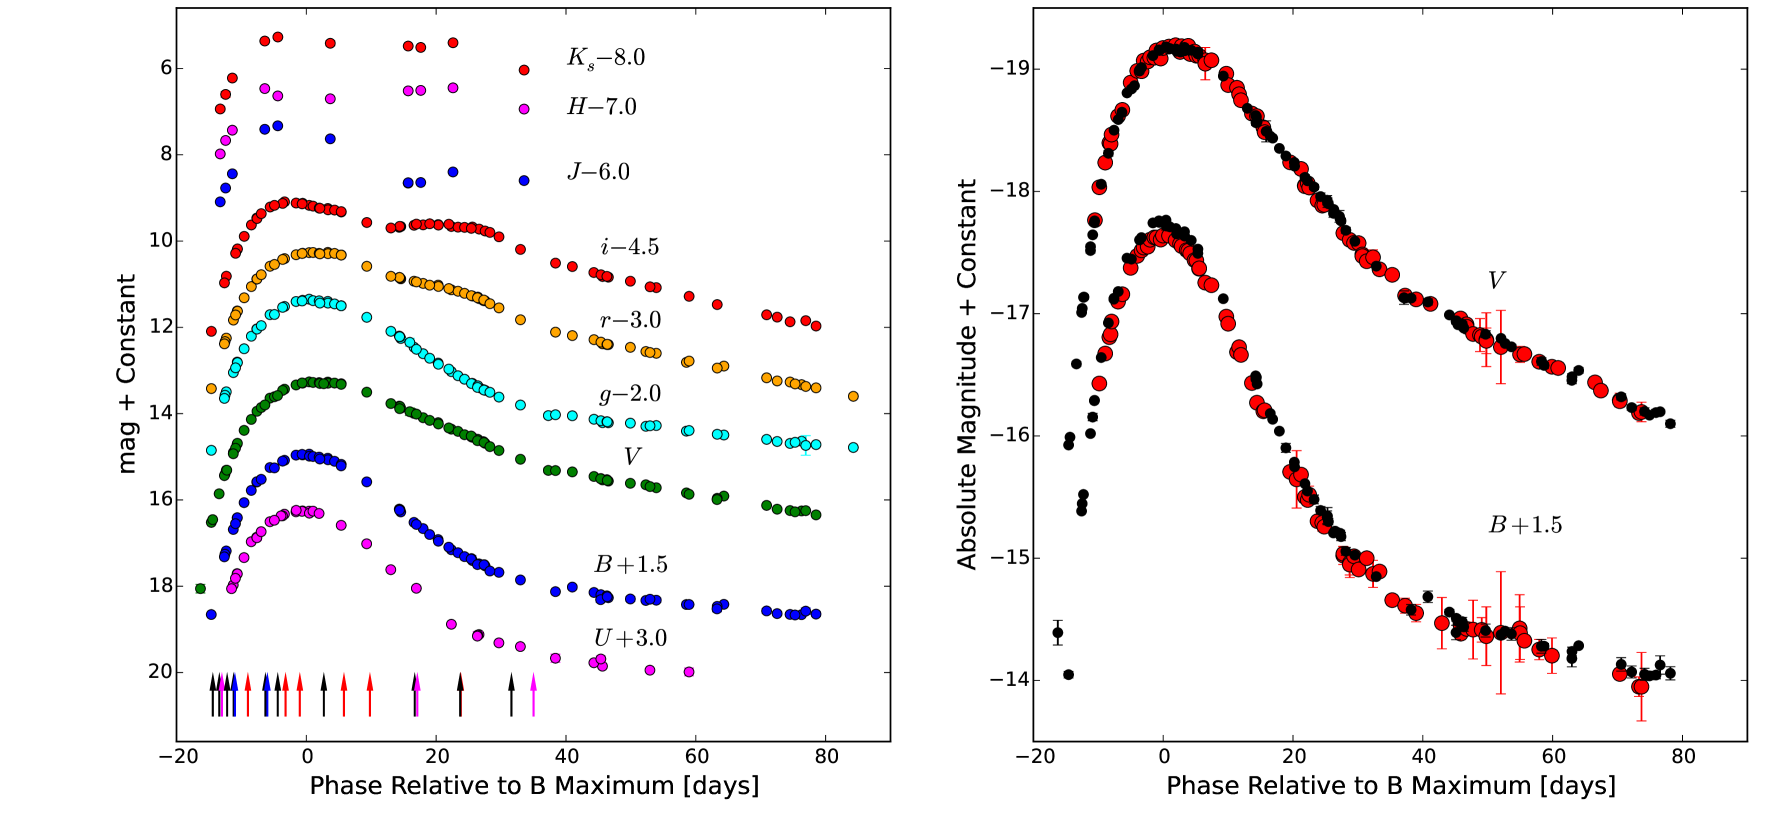
The , and light curves of SN 2015F are shown in Fig. 2. Fitting a polynomial to the -band light curve of SN 2015F, we measure a decline rate of mag, and we estimate the epoch of maximum light as MJD d (2015 March 25.4). Using the SiFTO light curve fitter (Conley et al., 2008), we determine a stretch of . A summary of the epoch of peak brightness, the peak magnitude, and the decline rate of the light curve () obtained from fitting a polynomial to the light curves of SN 2015F in each filter is presented in Table 2.
In Table 3 we summarize the values of the host galaxy reddening along the line-of-sight to SN 2015F (), calculated from the optical colours (Phillips et al., 1999), and NIR colours (Krisciunas et al., 2004) of SN 2015F. The values derived using different methods are in good agreement with each other, and the weighted average is mag; the uncertainty corresponds to the standard deviation from the weighted average.
| Filter | MJD peak | Peak | |
|---|---|---|---|
| (days) | magnitude | ||
| () | () | () | |
| () | () | () | |
| () | () | () | |
| () | () | () | |
| () | () | () | |
| () | () | () | |
| () | () | – | |
| () | () | – | |
| () | () | – |
-
•
Numbers in parenthesis correspond to 1- statistical uncertainties.
| Method | Reference | |
|---|---|---|
| () | Phillips et al. (1999) | |
| () | Phillips et al. (1999) | |
| () | Krisciunas et al. (2004) | |
| () | Krisciunas et al. (2004) | |
| Mean | () |
2.1.1 Distance to NGC 2442
| Reference | Distance modulus | Distance | Method/ |
|---|---|---|---|
| (Mpc) | / relation | ||
| This paper | () | () | SNe Ia/Phillips et al. (1999) band calibration |
| This paper | () | () | SNe Ia/Phillips et al. (1999) band calibration |
| This paper | () | () | SNe Ia/Kattner et al. (2012) band calibration |
| This paper | () | () | SNe Ia/Kattner et al. (2012) band calibration |
| Im et al. (2015) | () | () | SNe Ia/ band using MLCS2k2 (Jha et al., 2007) |
| Tully et al. (2009) | () | () | Tully-Fisher relation |
| Tully (1988) | () | () | Tully-Fisher relation |
We used the peak magnitudes of SN 2015F to estimate the distance to its host galaxy, NGC 2442 (Table 4). We corrected the observed peak magnitudes for Milky way and host-galaxy extinction assuming a Cardelli et al. (1989) reddening law (with ). We estimated the absolute peak magnitudes of SN 2015F using the Phillips et al. (1999) and Kattner et al. (2012) decline rate/peak luminosity calibrations in the optical and in the NIR, respectively. We assumed km s-1 Mpc-1 and, somewhat arbitrarily, an uncertainty of km s-1 Mpc-1, placing and its uncertainty between the two currently popular values of km s-1 Mpc-1 (Planck Collaboration et al., 2014) and km s-1 Mpc-1 (Riess et al., 2016). The 1 uncertainty in corresponds to an uncertainty of per cent in distance ( mag).
Table 4 also lists distance estimates from the literature, including Im et al. (2015) distance estimate to NGC 2442 also using SN 2015F. Im et al. (2015) measured a host galaxy extinction of mag, a peak magnitude of mag, and a decline rate of mag using snana (Kessler et al., 2009) to fit MLCS2k2 templates (Jha et al., 2007) to their observed data of SN 2015F. These light curve parameters are consistent with our values at the 1- to 2- level.
Our mean distance modulus in the optical (-filters) is , and in the NIR (-filters) is , where the uncertainties include filter-to-filter peak magnitude covariances. These are in excellent agreement, and are consistent with the Tully et al. (2009) distance estimation based on the Tully-Fisher relation. Our mean distance estimates in the optical and NIR are - and - discrepant from the Im et al. (2015) distance modulus value, respectively. Im et al. (2015) quote an uncertainty of mag in the distance modulus to NGC 2442, which appears underestimated when compared with their quoted uncertainty in the -band peak magnitude ( mag), and the typical dispersion in the absolute magnitudes of SNe Ia in the optical ( to mag; Folatelli et al., 2010).
2.1.2 Rise time and Epoch of First Light
Early observations are fundamental to place constraints on several properties of SNe Ia, such as the time of the explosion (Nugent et al., 2011; Hachinger et al., 2013; Zheng et al., 2013; Mazzali et al., 2014; Goobar et al., 2014; Zheng et al., 2014; Marion et al., 2016; Shappee et al., 2016), the radius of the progenitor (Nugent et al., 2011; Bloom et al., 2012), and to search for signs of, or rule out an interaction of the SN ejecta with a companion star (Kasen, 2010; Hayden et al., 2010; Bianco et al., 2011; Brown et al., 2012; Goobar et al., 2014; Cao et al., 2015; Olling et al., 2015; Goobar et al., 2015; Im et al., 2015; Marion et al., 2016; Shappee et al., 2016). Here, using the early -band observations of SN 2015F, we place strong constraints on the epoch of first light, the time when the first photons diffuse out from the SN ejecta. Recent very early abundance tomography of SN 2010jn (Hachinger et al., 2013) and SN 2011fe (Mazzali et al., 2014) shows that this estimated epoch of first light is in tension with the time of the explosion derived from spectral modelling, implying a dark phase for these two SNe of the order of d between the time of the explosion and the emergence of the first photons.
A non-detection of SN 2015F in the -band was reported by Im et al. (2015) on MJD 57088.511, and the first unambiguous detection (>3-) on MJD 57089.463, 22.84 h later. Im et al. (2015) also discuss a possible 2- detection of emission from the cooling of the shocked heated ejecta (Piro et al., 2010; Rabinak & Waxman, 2011) around three days before the first clear detection. Here, we report 3- non-detections to a limiting magnitude of and in the -band on MJD 57089.073 and MJD 57089.184, 9.35 h and 6.69 h before the first detection of Im et al. (2015) in the -band. Our first detection of is on MJD 57090.124, 15.87 h after the first detection of Im et al. (2015), and 22.56 h after our last non-detection.
We use a parameterization of to fit the rising -band light curve, described in detail in Firth et al. (2015), where is the time of first light, is a normalizing coefficient, and is the index of the power law. The case of is known as the ‘expanding fireball’ model (e.g., Riess et al., 1999). The early -band light curve, together with the best fit model, is shown in Fig. 3.
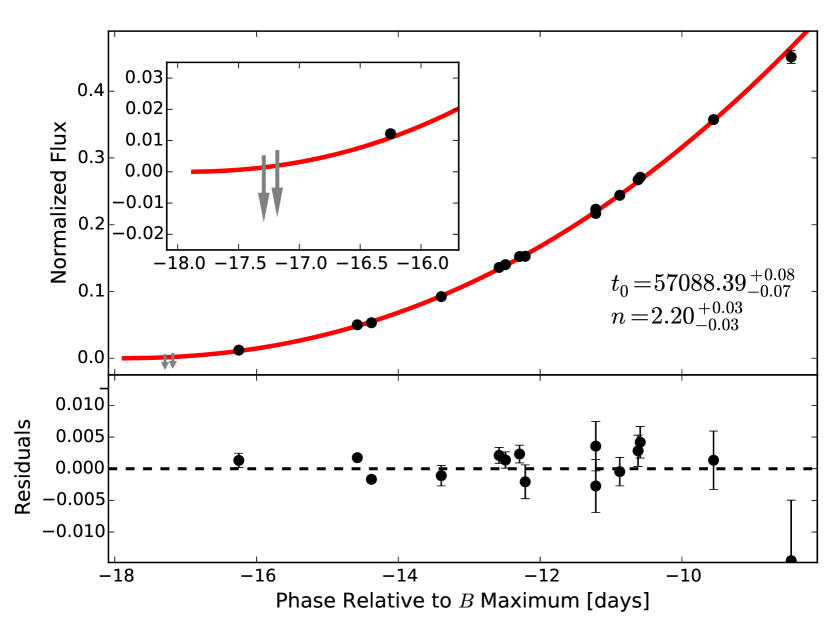
We find best fit parameters of , and . The -band rise time, corrected for time dilation, is d. The mean values obtained by Firth et al. (2015), for a sample of 18 SNe Ia with well-sampled early light curves from the Palomar Transient Factory (PTF Law et al., 2009; Rau et al., 2009) observed in the -band, and from La Silla-QUEST (Baltay et al., 2013) in the broad -band (see Baltay et al., 2013; Cartier et al., 2015), are d, and . Firth et al. (2015) showed that the and in the -band is very similar to an optical pseudo-bolometric optical light curve and the -band has a longer by d. Firth et al. (2015) also find that is longer by d and is larger by in the -band, compared to an optical pseudo-bolometric light curve. After applying these corrections, the found for SN 2015F is close to the mean value of Firth et al. (2015) sample, and is 2 lower than the mean value, although still within the range of values found by Firth et al. (2015).
The early photometry of SN 2015F does not show any evidence of shock cooling, such as an excess emission or bluer than normal colours, produced by the interaction of the SN ejecta with a companion star as in SN 2012cg (Marion et al., 2016). We will analize in detail possible progenitor scenarios of SN 2015F using the very early phase data presented here in a future work.
2.2 Spectroscopy
We obtained optical spectra of SN 2015F with EFOSC2/NTT, with the Robert Stobie Spectrograph (RSS Kobulnicky et al., 2003) on the Southern African Large Telescope (SALT), with WiFeS (Dopita et al., 2010) on the Australian National University (ANU) 2.3-m Telescope, and with the FLOYDS spectrograph on the 2-m Faulkes Telescope South (FTS) at the Siding Spring Observatory. The EFOSC2 spectra were reduced as described in Smartt et al. (2015), and the FLOYDS data were reduced with the floydsspec pipeline333https://www.authorea.com/users/598/articles/6566. The RSS is a long slit spectrograph, the spectra of SN 2015F were reduced using the pysalt pipeline which is described in detail in Crawford et al. (2010). WiFeS is an integral field unit spectrograph, one dimensional spectra were reduced and extracted from the data cube using a PSF-weighted fit using pywifes pipeline (Childress et al., 2014a). In Table 5 we summarize the optical spectroscopic observations of SN 2015F. We correct all our spectra for Galactic extinction using a Cardelli et al. (1989) extinction law with , and convert to the rest-frame using the recession velocity of the host galaxy. All reduced PESSTO data will be available from the ESO Science Archive Facility in Spectroscopic Survey Data Release 3 (SSDR3), due for submission in late 2016. Details will be posted on the PESSTO website444http://www.pessto.org. All our spectra are available from the WISeREP archive555http://wiserep.weizmann.ac.il/ (Yaron & Gal-Yam, 2012).
| Date UT | MJD | Phase | Instrument/ | Wavelength | Resolution | Exposure |
|---|---|---|---|---|---|---|
| (days) | (days) | telescope | range (Å) | (Å) | time (s) | |
| 20150311 | EFOSC/NTT | - | 18 | 300 | ||
| 20150312 | EFOSC/NTT | - | 14 | 1500 | ||
| 20150312 | WiFeS/ANU 2.3-m | - | 1.2 | 1200 | ||
| 20150313 | EFOSC/NTT | - | 14 | 1500 | ||
| 20150314 | EFOSC/NTT | - | 14 | 600 | ||
| 20150314 | FLOYDS/FTS | - | 12 | 1800 | ||
| 20150316 | RSS/SALT | - | 18 | 330 | ||
| 20150319 | EFOSC/NTT | - | 14 | 600 | ||
| 20150319 | FLOYDS/FTS | - | 12 | 1800 | ||
| 20150321 | EFOSC/NTT | - | 14 | 600 | ||
| 20150322 | RSS/SALT | - | 18 | 300 | ||
| 20150324 | RSS/SALT | - | 18 | 300 | ||
| 20150328 | EFOSC/NTT | - | 14 | 600 | ||
| 20150331 | RSS/SALT | - | 18 | 300 | ||
| 20150404 | RSS/SALT | - | 18 | 300 | ||
| 20150411 | EFOSC/NTT | - | 14 | 900 | ||
| 20150411 | WiFeS/ANU 2.3-m | - | 1.2 | 2400 | ||
| 20150418 | EFOSC/NTT | - | 14 | 900 | ||
| 20150418 | RSS/SALT | - | 18 | 300 | ||
| 20150426 | EFOSC/NTT | - | 14 | 900 | ||
| 20150429 | WiFeS/ANU 2.3-m | - | 1.2 | 2400 |
3 Spectroscopic Analysis
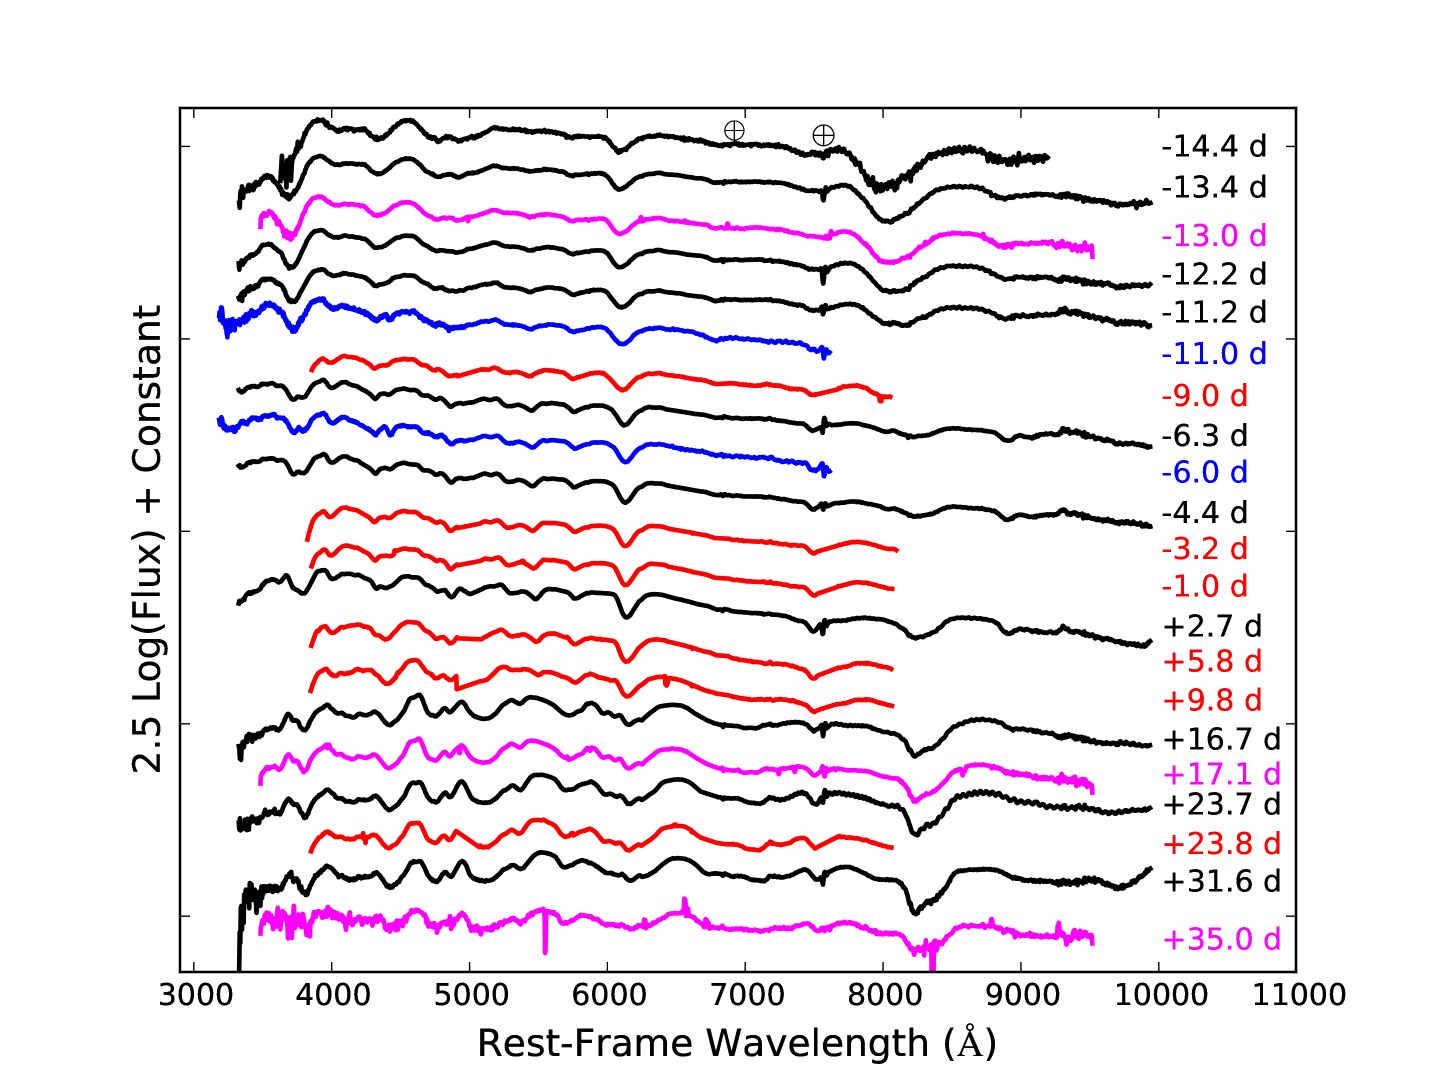
In Fig. 4 we show the spectral sequence of SN 2015F spanning to d (throughout, all phases are given relative to maximum light in the rest-frame -band). The overall characteristics of SN 2015F are those of a normal, if slightly sub-luminous, SN Ia, with properties particularly similar to SN 2004eo (see Fig 2), a transitional object between normal and sub-luminous SNe Ia (Pastorello et al., 2007). The ratio of the pseudo-equivalent widths (pEW) of the Si ii and Si ii features (; see Nugent et al., 1995; Bongard et al., 2006; Hachinger et al., 2008) is , measured from the spectrum obtained at d. For our , this is consistent with published relationships between and (e.g., Benetti et al., 2005; Blondin et al., 2012).
3.1 Expansion velocities of Si II
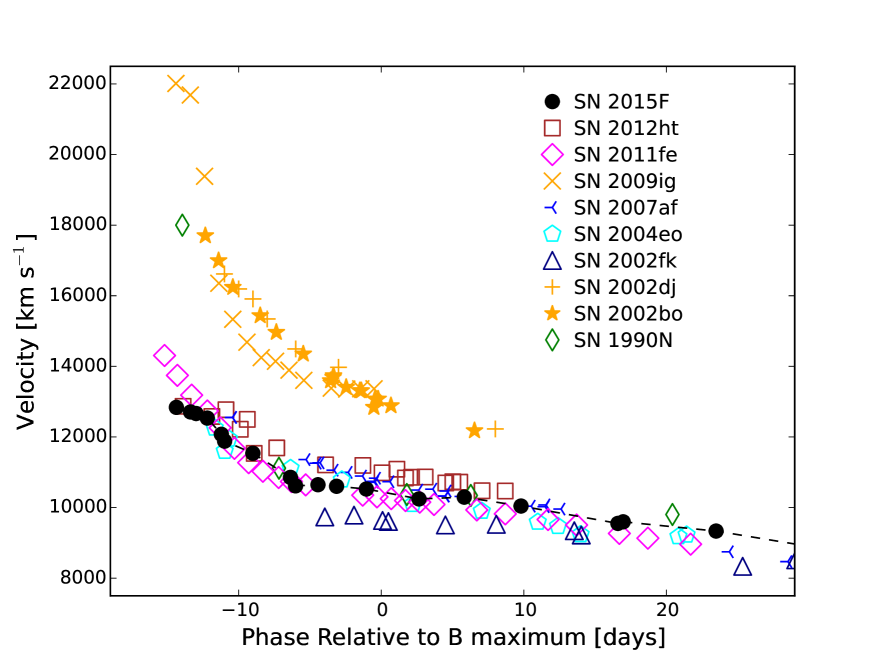
In Fig. 5 we present the Si ii velocity () measured from the minimum of the Å absorption feature observed near 6150 Å. In the figure, we compare with several low-velocity gradient (LVG) and high-velocity gradient (HVG) SNe Ia666Benetti et al. (2005) separated SNe Ia into three groups: High-velocity gradient (HVG) events, consisting of objects with a velocity gradient of Si ii km s-1 d-1 and , low-velocity gradient (LVG) events, consisting of objects with km s-1 d-1 and , and FAINT events with .. We estimate at maximum light () and , by fitting a first degree polynomial to the measurements over to d, and interpolating to obtain km s-1 and km s-1 d-1. These values place SN 2015F in the LVG group.
At phases prior to d, SN 2015F presents a slower than SN 2011fe (see Fig. 5). The difference in between these two SNe at d is 1000 km s-1. After d, SN 2015F shows a evolution similar to SN 2011fe and SN 2004eo.
3.2 Comparison to other SNe Ia
We next compare in detail the spectra of SN 2015F to other SNe Ia from the literature. We focus our analysis at phases earlier than d, and also make a comparison to sub-luminous SN 1991bg-like SNe Ia.
3.2.1 Comparison at days
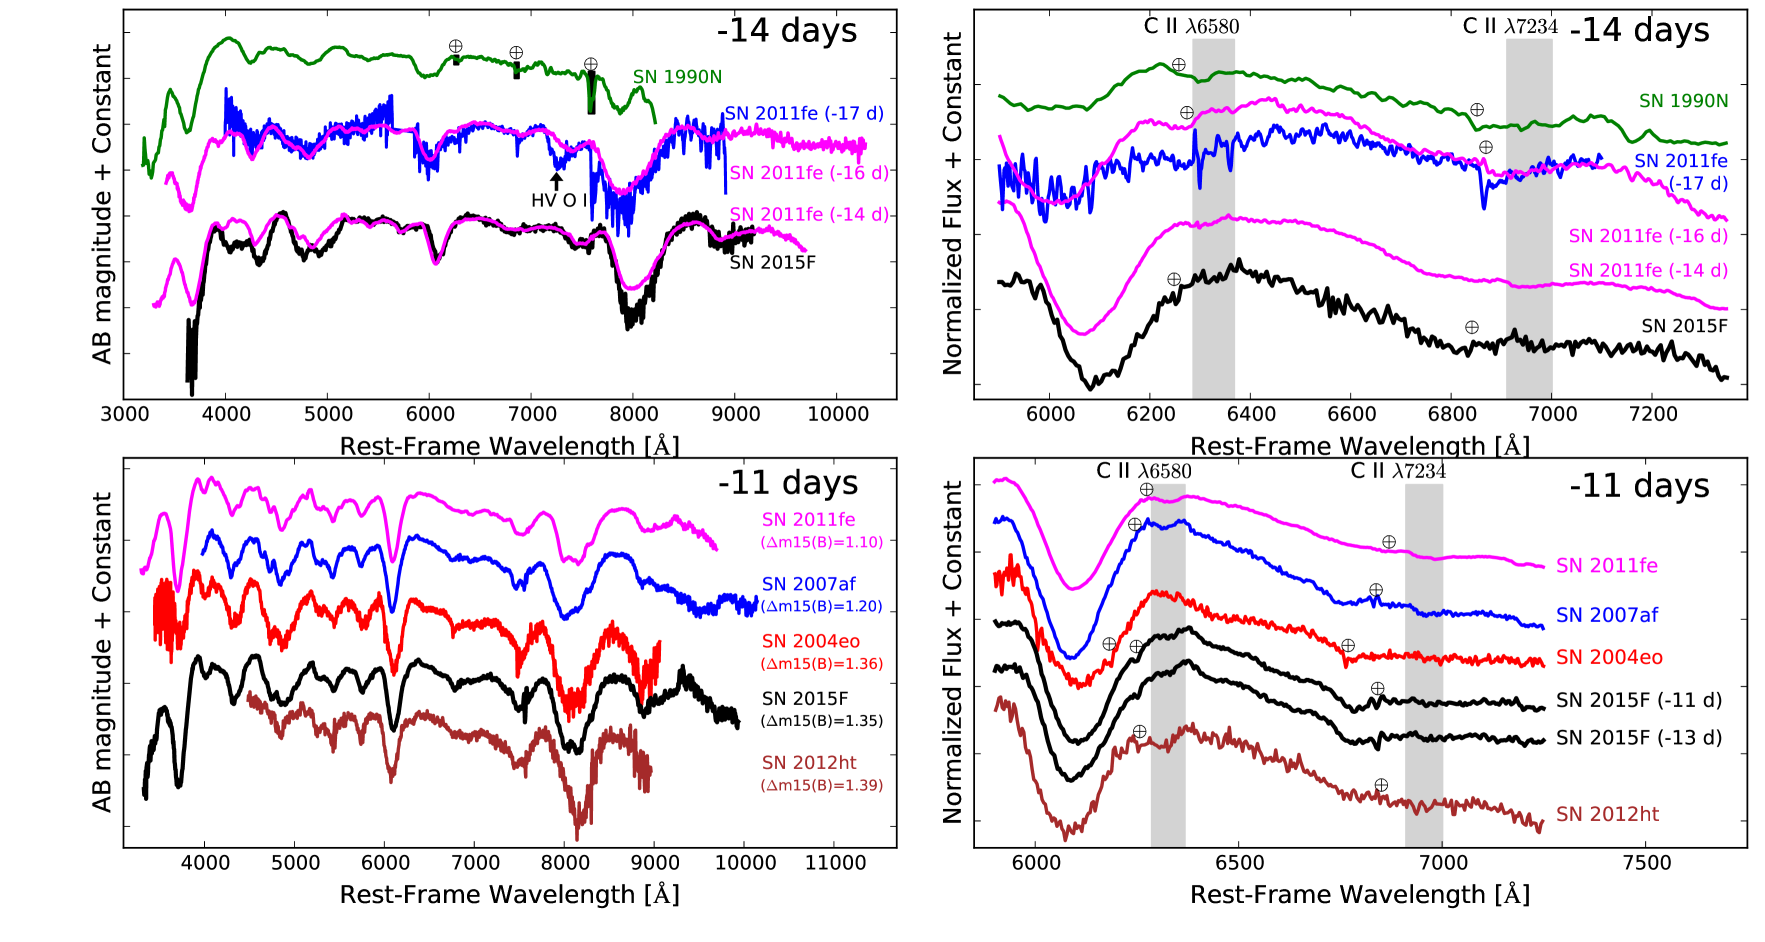
The top-left panel of Fig. 6 compares the first spectrum of SN 2015F at d, with SN 2011fe and SN 1990N at a similar phase. We also show the spectra of SN 2011fe at d and d (Nugent et al., 2011). SN 2011fe is a normal brightness SN Ia (; Pereira et al., 2013) while SN 1990N is relatively bright among the group of normal (i.e., non SN 1991T-like) SNe Ia, with (Lira et al., 1998). Most of the spectral differences can be explained as a mere temperature effect. SN 1990N is brighter/hotter, and shows fewer features in its spectrum, SN 2011fe is at an intermediate luminosity and shows a broadly similar spectrum to SN 2015F, while SN 2015F itself is fainter/cooler and shows more absorption lines below Å due to singly ionized iron-peak elements.
The top-right panel of Fig. 6 shows the same spectra in the region around the C ii and lines. In SN 2011fe, a photospheric component of both of these C ii lines is clearly observed at 13000 km s-1 (studied in Parrent et al., 2012). In SN 1990N, the lines have also been reasonably securely identified (e.g., Mazzali, 2001). Fisher et al. (1997) proposed that the flat-bottomed absorption feature at 6000 Å could also be due to C ii , this time at high velocity. Although Mazzali (2001) showed that Si ii is responsible for most of this feature (and in particular the extended blue side; see also Mazzali et al., 1993), an additional explanation may be needed for the red side, which could include a carbon shell at km s-1. The SN 2015F spectrum also shows clear absorption to the red side of the Si ii line, consistent with C ii at km s-1, a velocity similar to the photospheric C ii lines in SN 2011fe at the same phase (Parrent et al., 2012). The corresponding photospheric C ii can also be seen, although this feature is not strong in SN 2015F.
A broad absorption feature at Å is very clear (top-right Fig. 6). Possible identifications include photospheric Al ii, or C ii at km s-1. There is no indication of a corresponding C ii at about km s-1, although the inclusion of C ii in our modelling yields a slightly better fit to the red side of the Si ii absorption line (see also Cartier et al., 2014). We model the spectra in detail in Section 4, where we consider both possibilities.
3.2.2 Comparison at days
The lower-left panel of Fig. 6 shows the comparison of the LVG SNe Ia SN 2015F, SN 2011fe, SN 2007af, SN 2004eo and SN 2012ht at around d. SN 2015F shows a remarkable similarity to SN 2004eo, with the main difference being the absence of clear C ii lines in SN 2004eo (Pastorello et al., 2007; Mazzali et al., 2008). A strong feature in all the spectra is the broad Ca ii NIR triplet, extending from 10000 to 25000 km s-1 (see Section 3.3), with Ca ii HK also visible where the spectra extend to the blue. An apparent evolution in the shape and strength of the spectral features with brightness/temperature () is seen in the region dominated by iron-peak elements (wavelengths bluer than Å) and in the Ca ii NIR triplet; however, overall there is a remarkable degree of spectral similarity in this sample of LVG SNe Ia.
In Fig. 6 we also show the region around C ii and . SN 2015F, SN 2012ht, SN 2011fe and SN 2007af show clear photospheric C ii , with SN 2011fe, SN 2007af, and possibly SN 2015F showing clear photospheric C ii absorption (the spectrum of SN 2012ht is too noisy to clearly detect any weak feature). There is also clear absorption at 6800 Å present in SN 2015F, SN 2007af and perhaps SN 2004eo, although in this latter case nearby telluric features hamper a convincing identification.
3.2.3 Comparison with SN 1991bg-like type Ia SNe
SN 2015F has some similiarities with SN 2004eo (Fig. 2 and 6), a transitional object between normal and sub-luminous SNe Ia (Pastorello et al., 2007; Mazzali et al., 2008). The SN Ia sub-luminous class, often referred to as SN 1991bg-like SNe, are characterized by a fast decline in their light curves (Filippenko et al., 1992), somewhat lower expansion velocities compared to normal SNe Ia (Hachinger et al., 2009; Doull & Baron, 2011), a small amount of 56Ni synthesized during the explosion (Mazzali et al., 1997; Höflich et al., 2002; Hachinger et al., 2009), and clear Ti ii lines around maximum light (Filippenko et al., 1992; Mazzali et al., 1997; Garnavich et al., 2004; Taubenberger et al., 2008; Doull & Baron, 2011).
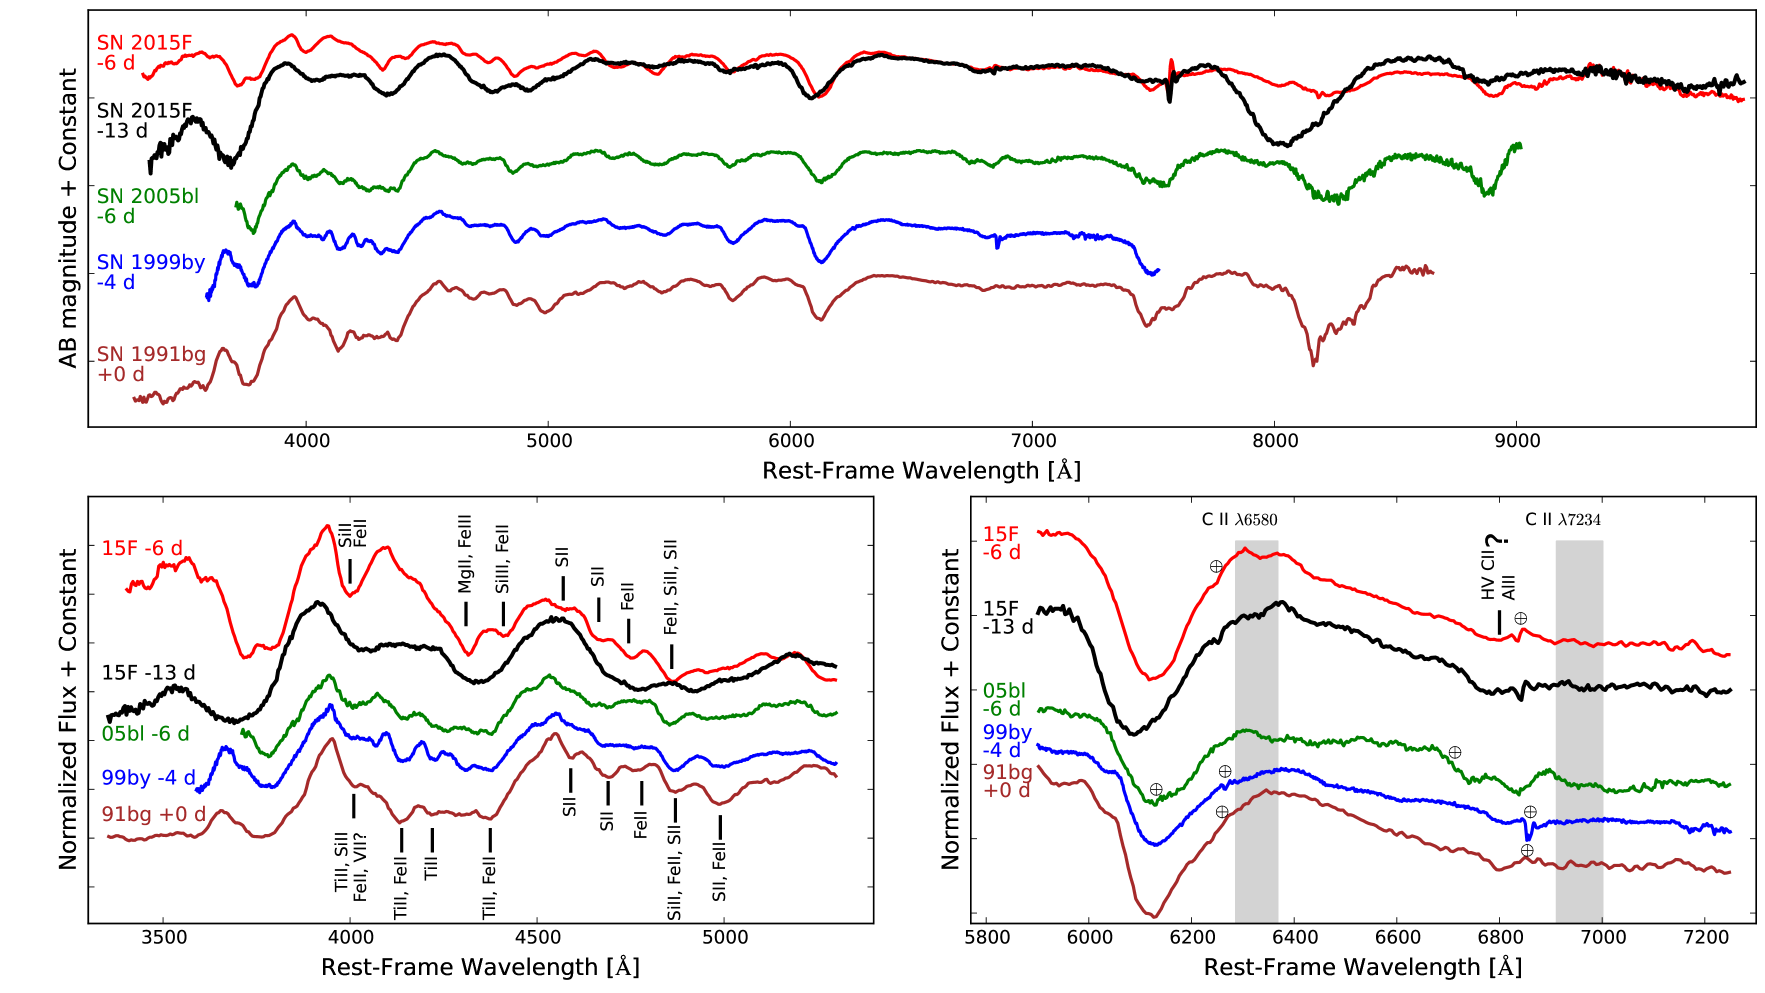
Fig. 7 compared SN 2015F to a group of well-observed SN 1991bg-like events. Although SN 2015F at -13 d has higher expansion velocities than SN 1991bg-like SNe, with SN 2015F showing very broad features formed by the blending of several lines, it shares some spectral resemblance to SN 1991bg-like events over 3900–5000 Å. This similarity is a consequence of absorption lines of iron-peak elements such as Ti ii, V ii and Cr ii, with some of these ions commonly identified in SN 1991bg-like SNe (see Doull & Baron, 2011).
In Fig. 7 we overplot the spectrum of SN 2015F at -6 d on top of the -13 d spectrum to highlight the evolution of the spectral features. We show in detail the blue part of the spectra, which are dominated by lines of iron-peak elements. In contrast to the spectrum obtained at -13 d that shows Ti ii, V ii, and Cr ii lines, by -6 d lines of Fe iii and Si iii are present, commonly seen in normal SNe Ia and which imply a higher ionization of the SN ejecta compared to previous epochs.
Fig. 7 also shows a comparison focussed on the 6800 Å feature. Although sometimes weak, this always appears present in SN 1991bg-like objects. The presence of Ti ii and Cr ii, associated with a low ejecta temperature, may also suggest that the 6800 Å feature is a product of a low ejecta temperature. However, we note that this feature is also present at -6 d and -4 d in SN 2015F, when there are also clear lines of doubly-ionized species (Fe iii, Si iii), implying a relatively high ejecta temperature. Thus temperature is unlikely to be the only parameter that explains the 6800 Å feature.
The overall appearance of the spectra of SN 2015F around maximum light shows that although SN 2015F shares some similarities with SN 1991bg-like SNe, it should be considered as a member of the group of normal SNe Ia.
3.3 Ca II high-velocity features
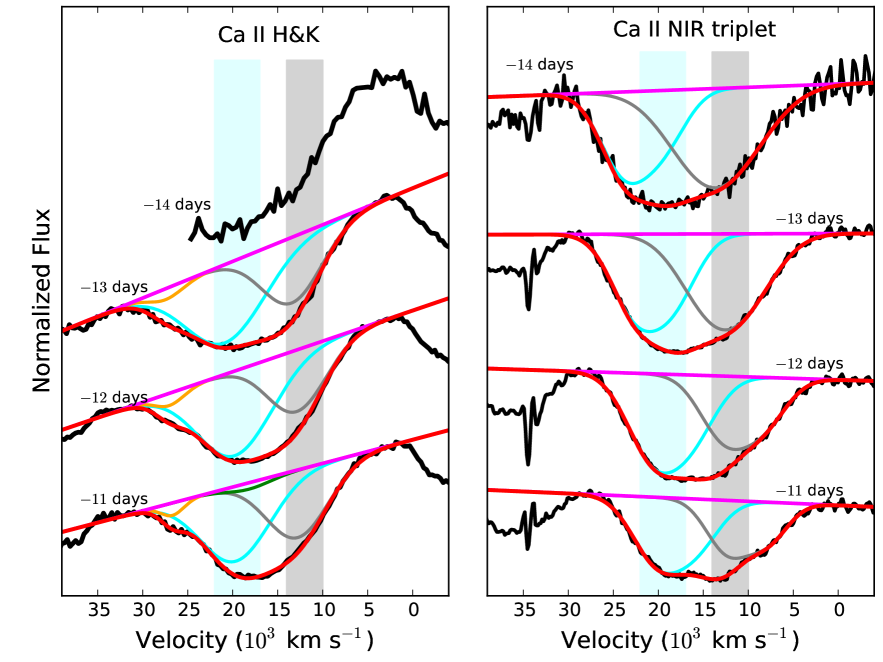
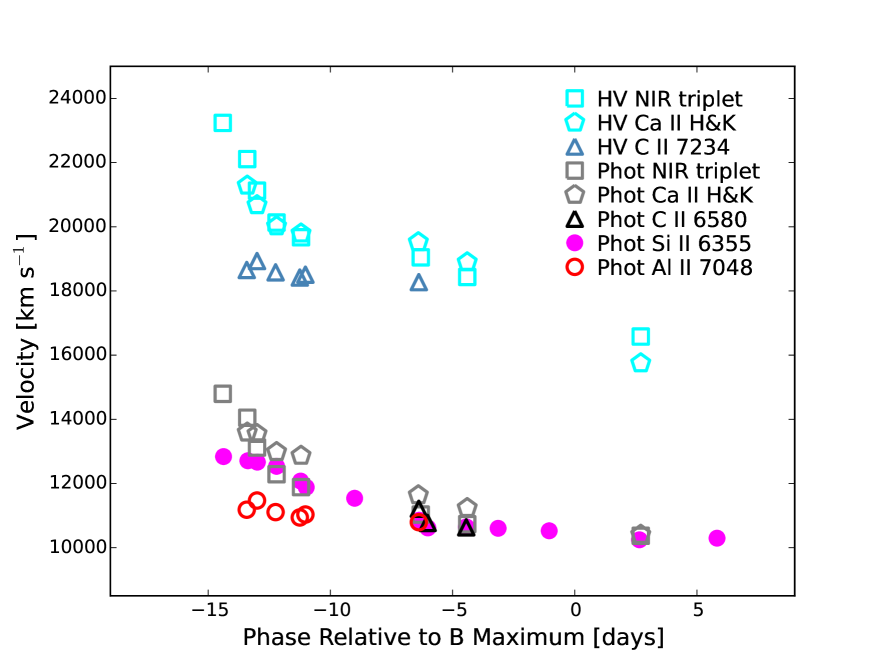
The Ca ii high velocity (HV) features are strong in the very early spectra of SN 2015F, dominating the Ca ii features until a week before maximum light. After these phases the photospheric component becomes dominant, and the HV component disappears around maximum light. In Fig. 8 we show the Ca ii H&K and the NIR triplet in velocity space for the d to d spectra. For Ca ii H&K, the expansion velocity is calculated with respect to the average wavelength of the H&K lines ( Å), while for the NIR triplet the velocity is with respect to the strongest line ( Å).
Following Childress et al. (2013); Childress et al. (2014b), Maguire et al. (2014) and Silverman et al. (2015), we fit Gaussian profiles to the Ca ii lines, defining a pseudo-continuum on either side of the profile, and using it to normalize the spectrum. To model the Ca ii NIR feature, we used both HV and photospheric components each composed of three Gaussian profiles with fixed relative positions and a common width. We allowed the relative strength of the three lines to vary, but to be the same for both components. The best-fitting parameters are listed in Table 6 and are shown in Fig. 8. The relative strengths are similar across the different epochs, and close to the theoretical values expected from atomic physics.
| Phase | HVF Component | Photospheric Component | Relative Strengths of | ||||||
|---|---|---|---|---|---|---|---|---|---|
| FWHM | pEW | FWHM | pEW | Ca II()/ | Ca II()/ | ||||
| [Days] | [km s-1] | [km s-1] | [Å] | [km s-1] | [km s-1] | [Å] | Ca II() | Ca II() | |
The Ca ii H&K region is more complex due to additional photospheric Si ii at , coupled with blanketing from iron-peak elements that makes the definition of the pseudo-continuum less reliable. Following Maguire et al. (2014) and Silverman et al. (2015), we modelled each pair of Ca ii H&K lines using two Gaussians where the relative positions and their widths were fixed, and the relative strength of the two Gaussians fixed to unity. We consider the HV and photospheric Ca ii components, the Si ii line, and a weak feature at 3600 Å, possibly caused by the blending of several lines of iron-peak elements (the feature can be seen at 27000 km s-1 in Fig. 8). We fixed the position of the Si ii line to be within 5 per cent of the photospheric velocity of the Ca ii NIR line, and the velocity of the Ca ii HV and photospheric components to be within 10 per cent of the values from the Ca ii NIR lines.
The Si ii feature is required in our fits from d. The weak feature at 3600 Å is blended with the Ca ii H&K line at early stages, but around maximum light the feature becomes more detached, becoming an independent feature on the blue side of the H&K profile around peak brightness. The extension of the Ca ii material reaches a velocity of 29000 km s-1 in the very outermost layers of SN 2015F.
3.3.1 Velocity evolution of Ca II
Fig. 9 shows the expansion velocity of the Ca ii lines as function of phase. The median difference between the HV and the photospheric components for the NIR and H&K features is km s-1 and km s-1, respectively, consistent with previous studies using larger samples (Maguire et al., 2014; Silverman et al., 2015). The HV Ca ii component shows a dramatic velocity evolution over d to d, evolving from 23000 km s-1 to 19500 km s-1 in three days. It then plateaus, decreasing only km s-1 over the next five days. This plateau is coincident with a transition from equally strong HV and photospheric components, to a dominant photospheric component (see Table 6). After d, the velocity of the HV Ca ii again declines more rapidly.
We find a very good agreement between the Si ii velocity (measured from the minimum of the feature) and the Ca ii photospheric velocities (measured with the Gaussian fitting), remarkable as the techniques are quite independent. Only at epochs prior to d do we see a departure in the behaviour of the Si ii velocity from the Ca ii photospheric velocity, with the Si ii showing a shallower evolution; this may be the result of contamination from HV C ii moving the minimum of the line profile to redder wavelengths.
Finally, we see a different behaviour in the velocity evolution of the HV Ca ii and photospheric lines, and the 6800 Å absorption feature (Fig. 9) While the other lines show a consistent evolution, the 6800 Å feature shows a evolution similar to a plateau with a small slope. We note that the velocity measurement at d is hampered by a nearby telluric line, and at later epochs the minimum of the feature is strongly affected by telluric absorption.
3.3.2 Strength of the Ca II features
Childress et al. (2014b) defined as the ratio between the pEWs of the HV and photospheric Ca ii NIR components. In Table 6 we list the evolution of as function of phase. The HV component is dominant over the photospheric feature from to d, and then declines in strength. At phases later than to d, the ‘photospheric’ Ca ii component begins to dominate. Close to maximum light, SN 2015F has consistent with the results of Childress et al. (2014b) and Maguire et al. (2014). In particular, the value for SN 2015F, and its , perfectly fits in figure 2 of Childress et al. (2014b).
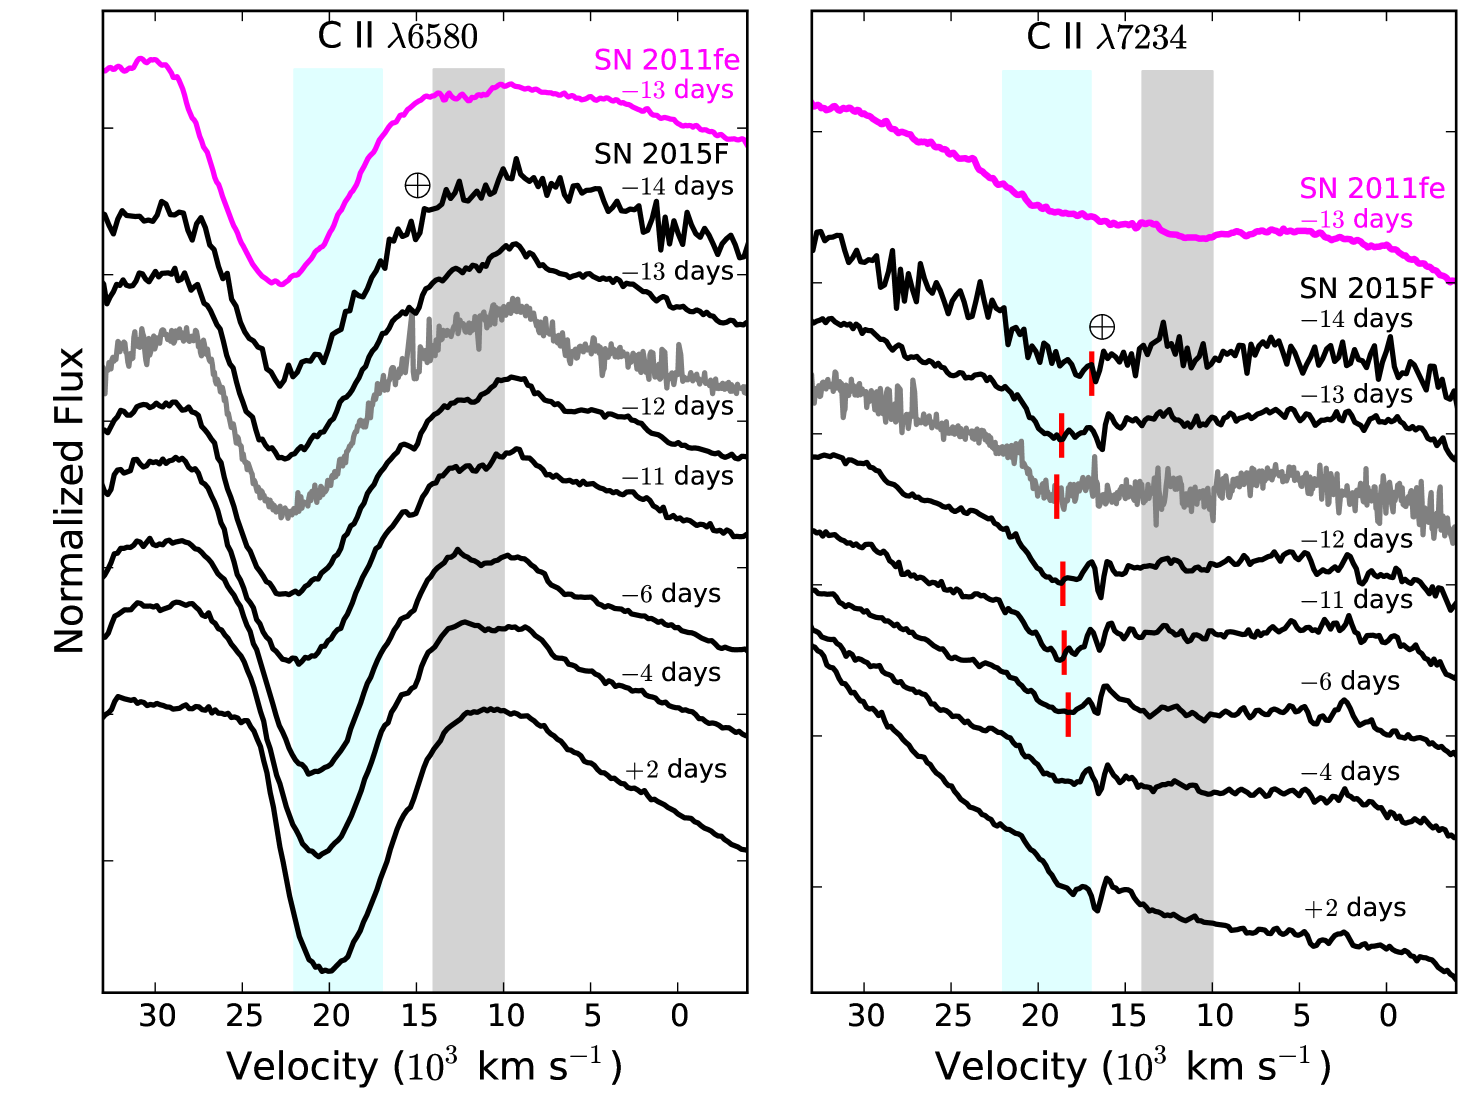
3.4 C II in SN 2015F
In Fig. 10, we present the spectral sequence of SN 2015F around the C ii and lines in velocity space, compared to SN 2011fe. The C ii photospheric absorption is detected until d at velocities similar to Si ii (see Fig. 9), although the measurement is difficult at phases prior to d as the feature does not have a well defined minimum; see Fig. 10). We also note that around maximum light, the Si ii line becomes stronger while the C ii lines become weaker; thus P-Cygni emission from Si ii may affect the C ii feature by moving the minimum to redder wavelengths (lower velocities).
Fig. 10 also presents a spectral sequence showing the evolution of the Å absorption feature. One interpretation for this feature is that it is HV C ii, which we discuss in Section 5.2.
4 Spectral Modelling
We next investigate whether simple spectral modelling can assist with further identification of the lines in the spectra of SN 2015F. We used syn++ (Thomas et al., 2011b), an updated version of synow (Fisher et al., 1997), to model the spectra. The physical assumptions of syn++ match those of synow (Fisher, 2000), so our findings are restricted to the identification of features and not quantitative abundances.
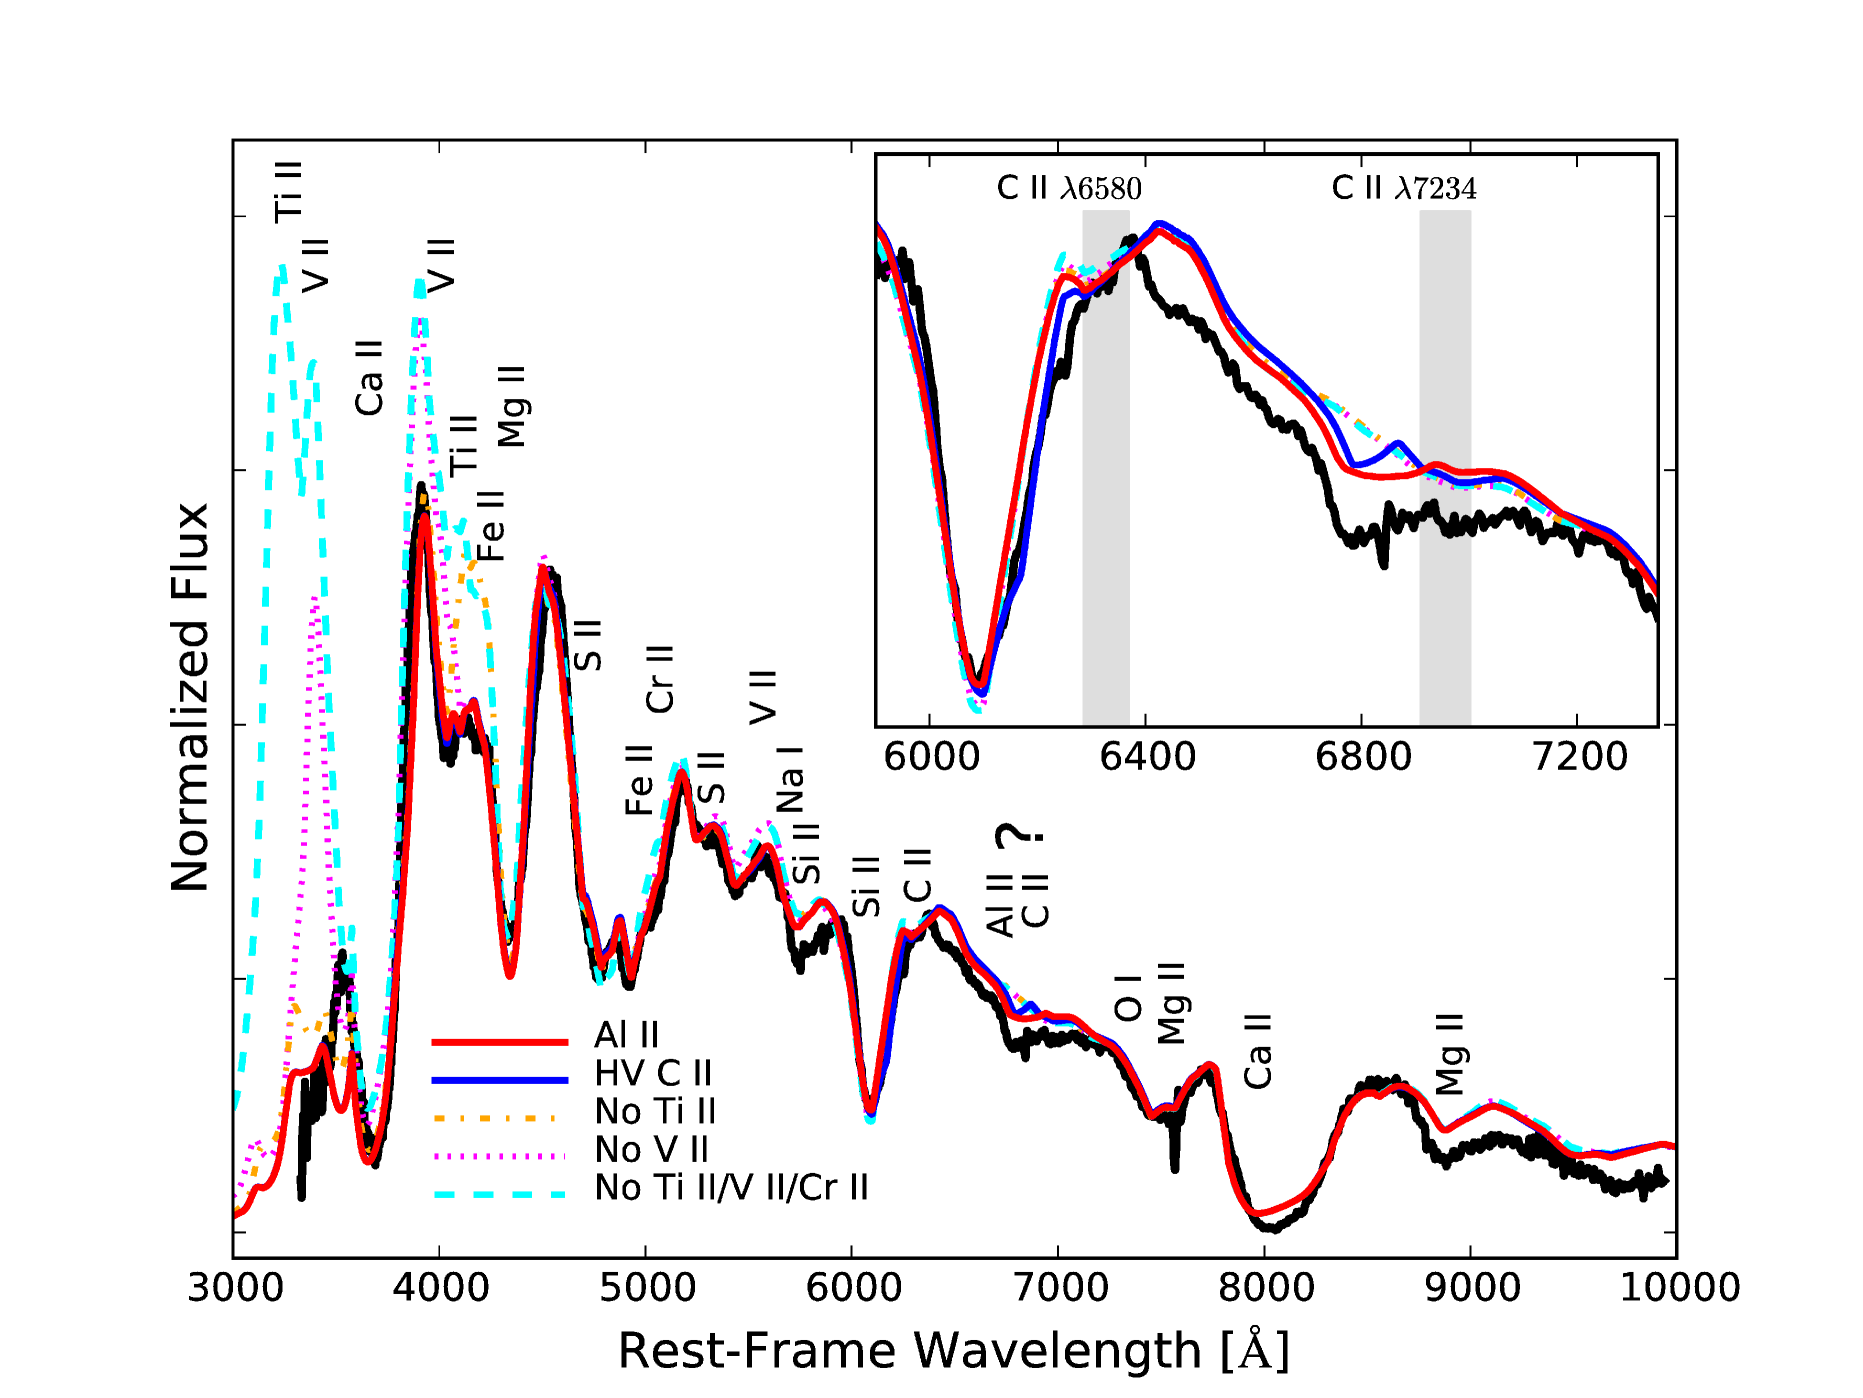
In Fig. 11 we show the spectrum of SN 2015F at d along with a syn++ model that reproduces the main spectroscopic features reasonably well. We assumed a photosphere expanding at a velocity of km s-1 and a black body temperature of K, and allowed various individual ions to be detatched from the photosphere; Table 7 lists the velocities and e-folding length scales of the main ions in our models at three representative phases; -13 d, -11 d and -4 d. We note that to reproduce the -13 d spectrum over the region from 4000 to 5000 Å, we required V ii, Ti ii, Cr ii and a significant amount of Fe ii at km s-1. The lines of these iron group elements are therefore produced at a significantly higher velocity than the photosphere, and the e-folding length-scale of Fe ii is relatively large ( km s-1). This suggests that iron-group material extends well beyond the photosphere, possibly reaching expansion velocities of km s-1. In Fig. 11, we also present various syn++ models with different combinations of the iron group lines to show the contribution of these ions in the final model.
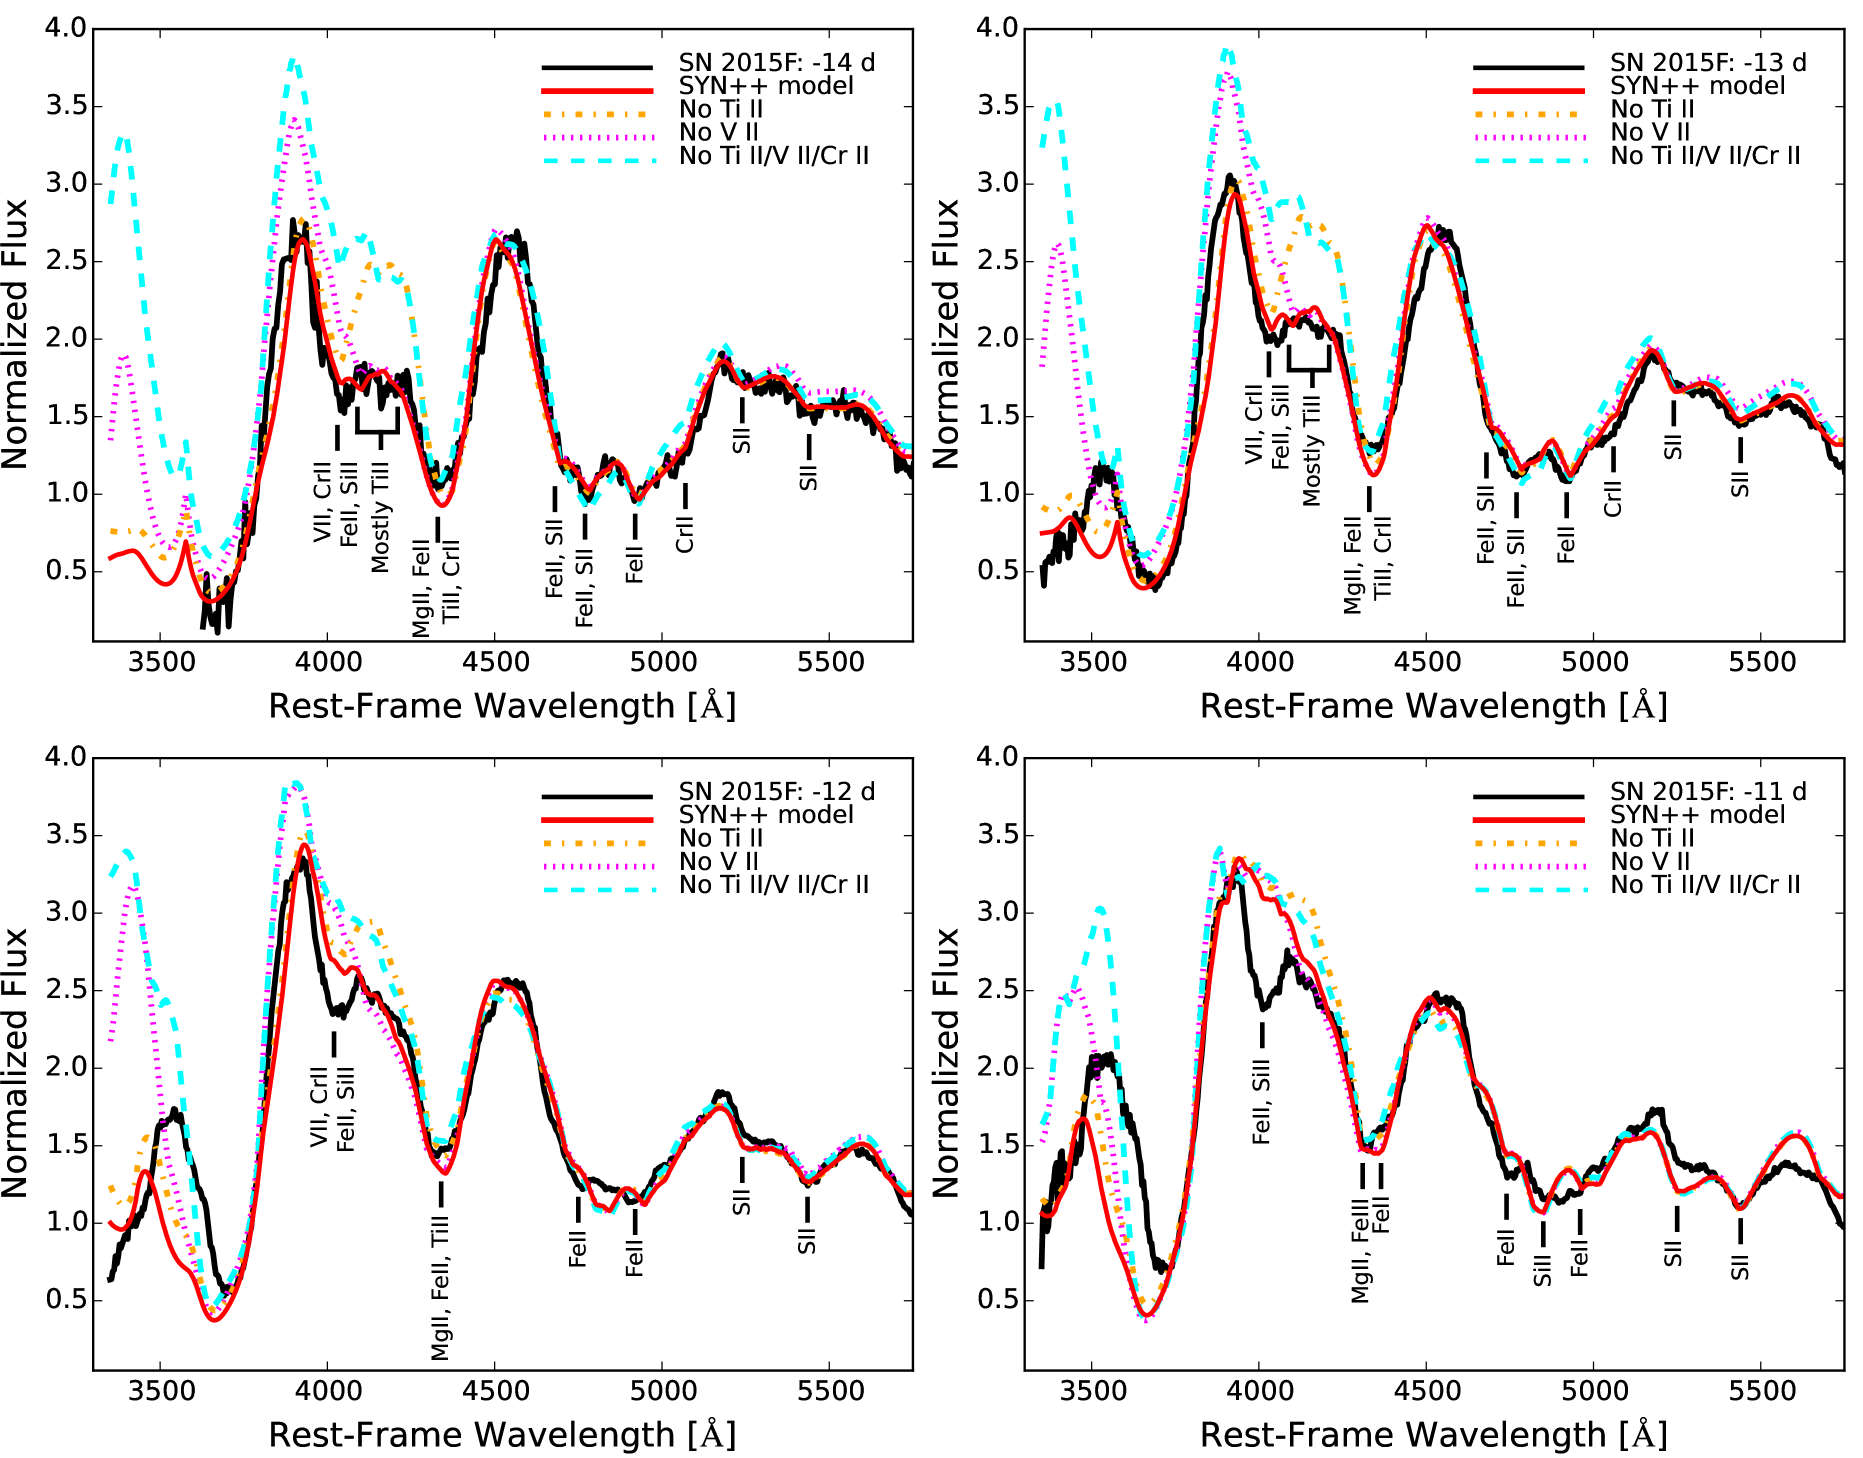
In Fig. 12 we overplot our syn++ models on top of the first four spectra of SN 2015F, and focus on the blue part of the spectra, which are dominated by lines of iron-peak elements. At -14 d and -13 d, the features are very broad, and the spectra exhibit strong absorption features from 3900–4500 Å mainly produced by iron-peak elements. At -12 d the strength of the V ii, Ti ii and Cr ii lines begin to decrease. At -11 d the line profiles become narrower, and the features produced by V ii, Ti ii and Cr ii are no longer clear. Lines of Fe iii, and possibly Si iii, begin to appear.
The strong absorption at 6800 Å can be reproduced by a HV C ii component at 20000 km s-1, or by photospheric Al ii at a velocity of 13000 km s-1. For the HV C ii component, we adjusted K to make the HV C ii line stronger than the HV C ii line, thus mimicking as closely as possible the profile in the SN 2015F spectrum. However, as for the ratio, non-LTE effects may play a role (see Nugent et al., 1995; Hachinger et al., 2008). These are not captured by the LTE assumption of syn++, and therefore the used for the HV C ii component might not be a reliable estimation of the true value. Even after this adjustment in , the HV C ii only partially reproduces the strong absorption feature seen at 6800 Å. A stronger HV component of C ii and C ii may yield a better model of the 6800 Å and the 4030 Å absorption features, respectively.
A combination of a HV C ii component and of Al ii line is also a possibility to explain the Å feature, but in terms of syn++ modelling difficult to disentangle since it yields similar results to the models displayed in Fig. 11.
| Ion | d model | d model | d model | ||||||
|---|---|---|---|---|---|---|---|---|---|
| [ km s-1] | [ K] | [ km s-1] | [ km s-1] | [ K] | [ km s-1] | [ km s-1] | [ K] | [ km s-1] | |
| Photosphere | … | … | … | ||||||
| C II | |||||||||
| O I | |||||||||
| Na I | |||||||||
| Mg II | |||||||||
| Si II | |||||||||
| Si III | … | … | … | … | … | … | |||
| S II | |||||||||
| Ca II | |||||||||
| HV Ca II | … | … | … | ||||||
| Ti II | … | … | … | ||||||
| V II | … | … | … | ||||||
| Cr II | … | … | … | … | … | … | |||
| Fe II | |||||||||
| Fe III | … | … | … | ||||||
| Al II | |||||||||
| HV C II | |||||||||
5 Discussion
The previous sections have presented a high-quality time-series of spectra and photometry of the nearby type Ia SN 2015F. Our data make it one of the best observed SNe Ia at early times, and the early spectroscopic coverage have allowed us to study the outer layers of the SN ejecta in detail. In particular, these data provide evidence for either photospheric Al ii or high-velocity C ii, as well as iron-peak elements in the outer layers. We discuss these in turn.
5.1 Photospheric Aluminium
Our favoured explanation of the Å spectral feature in SN 2015F is photospheric Al ii (see Section 4), expanding at a velocity of km s-1 (Fig. 9). The Al ii material has to be confined in a relatively narrow range of velocity, as the Å feature does not appear to evolve in velocity over 16 days (Fig. 10). However, we caution that the feature is quite weak and is affected by telluric absorption; a definitive statement about the velocity evolution is difficult to make.
Aluminium in SNe Ia has not been commonly reported in the literature. To our knowledge, the only previous claim was in the peculiar ‘.Ia’ (Bildsten et al., 2007) candiate SN 2010X (Kasliwal et al., 2010). 27Al is the only stable aluminium isotope, which according to nucleosynthesis calculations is more abundant than the radioactive 26Al isotope (Iwamoto et al., 1999; Seitenzahl et al., 2013). However, the expected mass fraction of 27Al in SNe Ia is relatively low, only to times the total mass of 28Si (Iwamoto et al., 1999; Seitenzahl et al., 2013), the latter being the most abundant silicon isotope in SNe Ia.
Given this low predicted abundance of Al, strong Al ii features seem unexpected. The yield of 27Al obtained from the W7 (Nomoto et al., 1984) nucleosyntheis models of Iwamoto et al. (1999), and the three-dimensional N100 delayed-detonation models of Seitenzahl et al. (2013), predict a strong dependence of the abundance of 27Al on metallicity. A change from zero to solar metallicity in the progenitor white dwarf produces an increase of an order of magnitude in the yield of 27Al by mass. As a comparison, the abundances of 12C and 28Si remain essentially flat as function of progenitor metallicity. Thus a relatively metal-rich progenitor may help to explain the presence of Al in SN 2015F.
In Section 3.2 we noted the common presence of the Å feature in SN 1991bg-like SNe. This class appears to explode in more massive, higher metallicity galaxies; we also note the non-detection of this feature in SN 2011fe which seems to be the result of a sub-solar metallicity progenitor (see Mazzali et al., 2014). As SN 1991bg-like SNe exhibit lower photospheric temperatures than normal SNe Ia, in principle, the presence of the Al ii lines could be explained by a temperature effect and not as a metallicity effect. However, in the case of SN 2015F a temperature effect can be ruled out by the simultaneous detection of the Å feature with Si iii lines, which are a signature of a hot SN ejecta, and are strong at -6 d and -4 d (see Section 3.2.3).
5.2 Carbon material
A second explanation for the Å feature is high-velocity (HV) C ii ; photospheric C ii is clearly detected. This suggests that the outermost layers (18000 km s-1) of SN 2015F are mostly unburned, consistent with the Mazzali et al. (2014) model for SN 2011fe, in which the outermost layers of the SN ejecta (> km s-1) are unburned, and are composed mainly of carbon. The fact that SN 2015F has a faster decline rate than SN 2011fe, and is thus a dimmer/cooler event, suggests a less efficient burning, and perhaps an even larger amount of unburned material in the outer layers than in SN 2011fe.
In recent delayed-detonation models (Seitenzahl et al., 2013), the outermost layers of the ejecta ( > km s-1) are mostly composed of carbon and oxygen, and this may explain any HV C ii. Nevertheless, we do not see a correspondingly strong HV O i line in SN 2015F. In Seitenzahl et al. (2013), carbon could also be present down to about km s-1, which may explain photospheric C ii in SN 2015F (but see also Mazzali et al., 2014).
Under the assumption that the 6800 Å absorption feature corresponds to HV C ii , we show its velocity evolution in Figs. 9 and 10. The first spectrum of SN 2015F has lower signal-to-noise ratio implying a larger uncertainty in the minimum of the feature, located at 16900 km s-1 ( Å). The feature evolves getting weaker and moving to redder wavelengths with time. We measured the minimum of this absorption feature at phases d (note the measurement is affected by telluric on the red side; see Fig. 10), and we show its expansion velocity in Fig. 9. The feature appears confined to a narrow range in velocity space from 18700 km s-1 to 17000 km s-1, but is persistent, and is still present in the spectrum at d. The feature is also observed in SN 2007af at slightly higher velocities until d, and then disappears.
The possibility that the HV features of C ii and Ca ii are produced close in velocity space may suggest a common origin for the HV material (see Fig. 9). HV Ca ii features exhibit a plateau in their velocity evolution between and d (Fig. 9). At the same phase, the velocity measured for the possible HV C ii feature is similar, but slightly lower.
5.3 Iron-group elements in SN 2015F
Using syn++ to model the spectra of SN 2015F (see Section 4), we have identified lines of Ti ii, V ii, Cr ii, and Fe ii expanding at 14800 km s-1. This implies a non-negligible amount of iron-group elements in the region between to km s-1of the SN ejecta. Hatano et al. (1999) reported strong Fe ii absorptions in the d spectrum of SN 1994D at 4300 and 4700 Å, and included in their synow model a HV Fe ii component extending from km s-1 to km s-1, to reproduce these features.
Strong and broad lines of iron-peak elements at such high-expansion velocities are generally unexpected in SNe Ia, since the pre-expansion suffered by the layers at higher velocities than to km s-1 will decrease the density too much to burn the material to iron-peak elements. Only in the case of a rapid transition in the burning speed front, from a sub-sonic deflagration to a super-sonic detonation, would the flame burn the outermost layers ( > km s-1) to iron-peak elements, yielding mainly radioactive 56Ni and not enough IMEs to reproduce the characteristic spectral features of normal SNe Ia. The decay of 56Ni mixed in the outermost layers can then heat the ejecta, producing strong lines of doubly-ionized species such as Fe iii and Si iii as in the brightest SNe. In the earliest spectra of SN 2015F ( d), this is not observed; by contrast, SN 2015F exhibits a spectrum dominated mainly by singly-ionized species (Fe ii, Si ii, S ii, Ca ii), consistent with a normal or relatively low ejecta temperature. At later phases, from about d, SN 2015F begins to exhibit Si iii and Si iii lines, now suggesting heating from the decay of radioactive material mixed in the outer layers of the SN ejecta.
The absorption features produced by iron-group elements in the very early spectra of SNe Ia could be explained by iron-peak elements synthesized during the SN explosion and mixed to the outermost layers of the SN ejecta, or as absorptions of iron-peak elements present in the white dwarf surface at the moment of the explosion (see Lentz et al., 2000) – or a combination of both. Recent three-dimensional delayed detonation models predict that freshly synthesized iron-peak elements are located mainly at intermediate velocities (3000 to 10000 km s-1; Seitenzahl et al., 2013), the latter not corresponding with the observations of SN 2015F. However, Seitenzahl et al. (2013) remark that models with a strong (turbulent) deflagration phase, which are rather symmetric under rotation on large scales, exhibit strong inhomogeneities in the burning products on small scales. This may explain pockets of iron-peak material, observed at high-velocity, mixed in the outermost layers as in the case of SN 2015F.
To disentangle the metallicity of the progenitor from the fraction of freshly synthesized iron-group elements mixed to the outermost layers would require a detailed modelling using the abundance tomography technique (Stehle et al., 2005; Mazzali et al., 2005; Tanaka et al., 2011; Hachinger et al., 2013; Mazzali et al., 2014). This is beyond the scope of this paper, and will be the subject of a future article.
6 Summary
We have presented spectroscopic and photometric data for the nearby type Ia supernova SN 2015F, obtained as part of PESSTO. In particular,
- 1.
- 2.
-
3.
We model the Ca ii H&K and NIR triplet profiles to estimate the expansion velocity and pseudo equivalent-widths of the photospheric and high-velocity componets. We find that the high-velocity Ca ii reached an expansion velocity of 23000 km s-1, decreasing to 16500 km s-1 just after maximum brightness. The expansion velocity of the photospheric Ca ii component ranges from 14500 km s-1 at d to 10300 km s-1 at maximum light.
-
4.
We identify photospheric C ii material moving at 14000 km s-1 at the earliest epochs, which remains detectable until d at an expansion velocity of 11000 km s-1.
-
5.
We identify a broad absorption feature at 6800 Å, previously unremarked upon in normal SNe Ia. We offer two possible explanations for this feature (Section 4): our favoured scenario is that it is produced by photopsheric Al ii expanding at - km s-1. An overabundance of Al ii relative to other SNe could be the result of a relatively high metallicity of the progenitor (Section 5.1). An alternative scenario is that it is produced by high-velocity (HV) C ii expanding at - km s-1 (see Section 5.2). The 6800 Å feature is also common in SN 1991bg-like SNe.
-
6.
We use syn++, to model the spectra of SN 2015F. We find lines of Fe-peak elements such as Ti ii, V ii, Cr ii, and Fe ii expanding at high velocity ( km s-1) in the outermost layers of the SN. The inclusion of V ii improves significantly our syn++ models at early times (-14 d and -13 d).
Acknowledgments
We thank to the anonymous referee for his careful review that helped to improve this manuscript. We acknowledge support from STFC grant ST/L000679/1 and EU/FP7-ERC grant No. [615929]. Support for G.P. is provided by the Ministry of Economy, Development, and Tourism’s Millennium Science Initiative through grant IC120009, awarded to The Millennium Institute of Astrophysics, MAS. K.M. acknowledges support from the STFC through an Ernest Rutherford Fellowship. A.G.-Y. is supported by the EU/FP7 via ERC grant No. [307260], the Quantum Universe I-Core program by the Israeli Committee for Planning and Budgeting and the ISF; by Minerva and ISF grants; by the Weizmann-UK “making connections” program; and by Kimmel and YeS awards. S.J.S. acknowledges funding from ERC Grant agreement No. [291222] and STFC grants ST/I001123/1 and ST/L000709/1. This material is based upon work supported by the National Science Foundation under Grant No. 1313484. We are grateful to Bruno Leibundgut and Masayuki Yamanaka for providing the spectra of SN 1990N and SN 2012ht, respectively. This work is based on observations collected at the European Organisation for Astronomical Research in the Southern Hemisphere, Chile as part of PESSTO, (the Public ESO Spectroscopic Survey for Transient Objects Survey) ESO programme 191.D-0935, and on observations obtained with the Southern African Large Telescope (SALT) under program 2014-2-SCI-070.
References
- Baltay et al. (2013) Baltay C., et al., 2013, PASP, 125, 683
- Benetti et al. (2004) Benetti S., et al., 2004, MNRAS, 348, 261
- Benetti et al. (2005) Benetti S., et al., 2005, ApJ, 623, 1011
- Bertin (2006) Bertin E., 2006, in Gabriel C., Arviset C., Ponz D., Enrique S., eds, Astronomical Society of the Pacific Conference Series Vol. 351, Astronomical Data Analysis Software and Systems XV.
- Bertin et al. (2002) Bertin E., Mellier Y., Radovich M., Missonnier G., Didelon P., Morin B., 2002, in Bohlender D. A., Durand D., Handley T. H., eds, Astronomical Society of the Pacific Conference Series Vol. 281, Astronomical Data Analysis Software and Systems XI. p. 228
- Bianco et al. (2011) Bianco F. B., et al., 2011, ApJ, 741, 20
- Bildsten et al. (2007) Bildsten L., Shen K. J., Weinberg N. N., Nelemans G., 2007, ApJ, 662, L95
- Blondin et al. (2012) Blondin S., et al., 2012, AJ, 143, 126
- Blondin et al. (2013) Blondin S., Dessart L., Hillier D. J., Khokhlov A. M., 2013, MNRAS, 429, 2127
- Bloom et al. (2012) Bloom J. S., et al., 2012, ApJ, 744, L17
- Bongard et al. (2006) Bongard S., Baron E., Smadja G., Branch D., Hauschildt P. H., 2006, ApJ, 647, 513
- Branch et al. (2003) Branch D., et al., 2003, AJ, 126, 1489
- Brown et al. (2012) Brown P. J., et al., 2012, ApJ, 753, 22
- Cao et al. (2015) Cao Y., et al., 2015, Nature, 521, 328
- Cardelli et al. (1989) Cardelli J. A., Clayton G. C., Mathis J. S., 1989, ApJ, 345, 245
- Cartier et al. (2014) Cartier R., et al., 2014, ApJ, 789, 89
- Cartier et al. (2015) Cartier R., et al., 2015, ApJ, 810, 164
- Childress et al. (2013) Childress M. J., et al., 2013, ApJ, 770, 29
- Childress et al. (2014a) Childress M. J., Vogt F. P. A., Nielsen J., Sharp R. G., 2014a, Ap&SS, 349, 617
- Childress et al. (2014b) Childress M. J., Filippenko A. V., Ganeshalingam M., Schmidt B. P., 2014b, MNRAS, 437, 338
- Conley et al. (2008) Conley A., et al., 2008, ApJ, 681, 482
- Crawford et al. (2010) Crawford S. M., et al., 2010, in Observatory Operations: Strategies, Processes, and Systems III. p. 773725, doi:10.1117/12.857000
- Dopita et al. (2010) Dopita M., et al., 2010, Ap&SS, 327, 245
- Doull & Baron (2011) Doull B. A., Baron E., 2011, PASP, 123, 765
- Filippenko et al. (1992) Filippenko A. V., et al., 1992, AJ, 104, 1543
- Firth et al. (2015) Firth R. E., et al., 2015, MNRAS, 446, 3895
- Fisher (2000) Fisher A. K., 2000, PhD thesis, THE UNIVERSITY OF OKLAHOMA
- Fisher et al. (1997) Fisher A., Branch D., Nugent P., Baron E., 1997, ApJ, 481, L89
- Folatelli et al. (2010) Folatelli G., et al., 2010, AJ, 139, 120
- Folatelli et al. (2012) Folatelli G., et al., 2012, ApJ, 745, 74
- Folatelli et al. (2013) Folatelli G., et al., 2013, ApJ, 773, 53
- Foley (2013) Foley R. J., 2013, MNRAS, 435, 273
- Foley et al. (2012) Foley R. J., et al., 2012, ApJ, 744, 38
- Fraser et al. (2015) Fraser M., et al., 2015, The Astronomer’s Telegram, 7209, 1
- Garavini et al. (2004) Garavini G., et al., 2004, AJ, 128, 387
- Garnavich et al. (2004) Garnavich P. M., et al., 2004, ApJ, 613, 1120
- Gerardy et al. (2004) Gerardy C. L., et al., 2004, ApJ, 607, 391
- Goobar et al. (2014) Goobar A., et al., 2014, ApJ, 784, L12
- Goobar et al. (2015) Goobar A., et al., 2015, ApJ, 799, 106
- Hachinger et al. (2008) Hachinger S., Mazzali P. A., Tanaka M., Hillebrandt W., Benetti S., 2008, MNRAS, 389, 1087
- Hachinger et al. (2009) Hachinger S., Mazzali P. A., Taubenberger S., Pakmor R., Hillebrandt W., 2009, MNRAS, 399, 1238
- Hachinger et al. (2013) Hachinger S., et al., 2013, MNRAS, 429, 2228
- Hatano et al. (1999) Hatano K., Branch D., Fisher A., Baron E., Filippenko A. V., 1999, ApJ, 525, 881
- Hayden et al. (2010) Hayden B. T., et al., 2010, ApJ, 722, 1691
- Höflich et al. (1998) Höflich P., Wheeler J. C., Thielemann F. K., 1998, ApJ, 495, 617
- Höflich et al. (2002) Höflich P., Gerardy C. L., Fesen R. A., Sakai S., 2002, ApJ, 568, 791
- Hsiao et al. (2013) Hsiao E. Y., et al., 2013, ApJ, 766, 72
- Hsiao et al. (2015) Hsiao E. Y., et al., 2015, A&A, 578, A9
- Im et al. (2015) Im M., Choi C., Yoon S.-C., Kim J.-W., Ehgamberdiev S. A., Monard L. A. G., Sung H.-I., 2015, ApJS, 221, 22
- Iwamoto et al. (1999) Iwamoto K., Brachwitz F., Nomoto K., Kishimoto N., Umeda H., Hix W. R., Thielemann F.-K., 1999, ApJS, 125, 439
- Jenness & Economou (2015) Jenness T., Economou F., 2015, Astronomy and Computing, 9, 40
- Jha et al. (2007) Jha S., Riess A. G., Kirshner R. P., 2007, ApJ, 659, 122
- Kasen (2010) Kasen D., 2010, ApJ, 708, 1025
- Kasliwal et al. (2010) Kasliwal M. M., et al., 2010, ApJ, 723, L98
- Kattner et al. (2012) Kattner S., et al., 2012, PASP, 124, 114
- Kessler et al. (2009) Kessler R., et al., 2009, PASP, 121, 1028
- Kobulnicky et al. (2003) Kobulnicky H. A., Nordsieck K. H., Burgh E. B., Smith M. P., Percival J. W., Williams T. B., O’Donoghue D., 2003, in Iye M., Moorwood A. F. M., eds, Proc. SPIEVol. 4841, Instrument Design and Performance for Optical/Infrared Ground-based Telescopes. pp 1634–1644, doi:10.1117/12.460315
- Krisciunas et al. (2004) Krisciunas K., et al., 2004, AJ, 127, 1664
- Landolt (1992) Landolt A. U., 1992, AJ, 104, 340
- Law et al. (2009) Law N. M., et al., 2009, PASP, 121, 1395
- Leibundgut et al. (1991) Leibundgut B., Kirshner R. P., Filippenko A. V., Shields J. C., Foltz C. B., Phillips M. M., Sonneborn G., 1991, ApJ, 371, L23
- Lentz et al. (2000) Lentz E. J., Baron E., Branch D., Hauschildt P. H., Nugent P. E., 2000, ApJ, 530, 966
- Lira et al. (1998) Lira P., et al., 1998, AJ, 115, 234
- Maguire et al. (2012) Maguire K., et al., 2012, MNRAS, 426, 2359
- Maguire et al. (2014) Maguire K., et al., 2014, MNRAS, 444, 3258
- Maoz et al. (2014) Maoz D., Mannucci F., Nelemans G., 2014, ARA&A, 52, 107
- Marion et al. (2006) Marion G. H., Höflich P., Wheeler J. C., Robinson E. L., Gerardy C. L., Vacca W. D., 2006, ApJ, 645, 1392
- Marion et al. (2009) Marion G. H., Höflich P., Gerardy C. L., Vacca W. D., Wheeler J. C., Robinson E. L., 2009, AJ, 138, 727
- Marion et al. (2013) Marion G. H., et al., 2013, ApJ, 777, 40
- Marion et al. (2015) Marion G. H., et al., 2015, ApJ, 798, 39
- Marion et al. (2016) Marion G. H., et al., 2016, ApJ, 820, 92
- Mazzali (2001) Mazzali P. A., 2001, MNRAS, 321, 341
- Mazzali et al. (1993) Mazzali P. A., Lucy L. B., Danziger I. J., Gouiffes C., Cappellaro E., Turatto M., 1993, A&A, 269, 423
- Mazzali et al. (1997) Mazzali P. A., Chugai N., Turatto M., Lucy L. B., Danziger I. J., Cappellaro E., della Valle M., Benetti S., 1997, MNRAS, 284, 151
- Mazzali et al. (2005) Mazzali P. A., et al., 2005, ApJ, 623, L37
- Mazzali et al. (2008) Mazzali P. A., Sauer D. N., Pastorello A., Benetti S., Hillebrandt W., 2008, MNRAS, 386, 1897
- Mazzali et al. (2014) Mazzali P. A., et al., 2014, MNRAS, 439, 1959
- Monard (2015) Monard B., 2015, CBET, 4081
- Nomoto et al. (1984) Nomoto K., Thielemann F.-K., Yokoi K., 1984, ApJ, 286, 644
- Nugent et al. (1995) Nugent P., Phillips M., Baron E., Branch D., Hauschildt P., 1995, ApJ, 455, L147
- Nugent et al. (2011) Nugent P. E., et al., 2011, Nature, 480, 344
- Olling et al. (2015) Olling R. P., et al., 2015, Nature, 521, 332
- Parrent et al. (2011) Parrent J. T., et al., 2011, ApJ, 732, 30
- Parrent et al. (2012) Parrent J. T., et al., 2012, ApJ, 752, L26
- Pastorello et al. (2007) Pastorello A., et al., 2007, MNRAS, 377, 1531
- Pereira et al. (2013) Pereira R., et al., 2013, A&A, 554, A27
- Perlmutter et al. (1999) Perlmutter S., et al., 1999, ApJ, 517, 565
- Persson et al. (1998) Persson S. E., Murphy D. C., Krzeminski W., Roth M., Rieke M. J., 1998, AJ, 116, 2475
- Phillips et al. (1999) Phillips M. M., Lira P., Suntzeff N. B., Schommer R. A., Hamuy M., Maza J., 1999, AJ, 118, 1766
- Pignata et al. (2008) Pignata G., et al., 2008, MNRAS, 388, 971
- Pignata et al. (2011) Pignata G., et al., 2011, ApJ, 728, 14
- Piro et al. (2010) Piro A. L., Chang P., Weinberg N. N., 2010, ApJ, 708, 598
- Planck Collaboration et al. (2014) Planck Collaboration et al., 2014, A&A, 571, A16
- Rabinak & Waxman (2011) Rabinak I., Waxman E., 2011, ApJ, 728, 63
- Rau et al. (2009) Rau A., et al., 2009, PASP, 121, 1334
- Riess et al. (1998) Riess A. G., et al., 1998, AJ, 116, 1009
- Riess et al. (1999) Riess A. G., et al., 1999, AJ, 118, 2675
- Riess et al. (2016) Riess A. G., et al., 2016, preprint, (arXiv:1604.01424)
- Schlafly & Finkbeiner (2011) Schlafly E. F., Finkbeiner D. P., 2011, ApJ, 737, 103
- Seitenzahl et al. (2013) Seitenzahl I. R., et al., 2013, MNRAS, 429, 1156
- Shappee et al. (2016) Shappee B. J., et al., 2016, ApJ, 826, 144
- Silverman & Filippenko (2012) Silverman J. M., Filippenko A. V., 2012, MNRAS, 425, 1917
- Silverman et al. (2015) Silverman J. M., Vinkó J., Marion G. H., Wheeler J. C., Barna B., Szalai T., Mulligan B. W., Filippenko A. V., 2015, MNRAS, 451, 1973
- Smartt et al. (2015) Smartt S. J., et al., 2015, A&A, 579, A40
- Smith et al. (2002) Smith J. A., et al., 2002, AJ, 123, 2121
- Stehle et al. (2005) Stehle M., Mazzali P. A., Benetti S., Hillebrandt W., 2005, MNRAS, 360, 1231
- Stetson (1987) Stetson P. B., 1987, PASP, 99, 191
- Tanaka et al. (2006) Tanaka M., Mazzali P. A., Maeda K., Nomoto K., 2006, ApJ, 645, 470
- Tanaka et al. (2011) Tanaka M., Mazzali P. A., Stanishev V., Maurer I., Kerzendorf W. E., Nomoto K., 2011, MNRAS, 410, 1725
- Taubenberger et al. (2008) Taubenberger S., et al., 2008, MNRAS, 385, 75
- Thomas et al. (2007) Thomas R. C., et al., 2007, ApJ, 654, L53
- Thomas et al. (2011a) Thomas R. C., Nugent P. E., Meza J. C., 2011a, PASP, 123, 237
- Thomas et al. (2011b) Thomas R. C., et al., 2011b, ApJ, 743, 27
- Tully (1988) Tully R. B., 1988, Nearby galaxies catalog
- Tully et al. (2009) Tully R. B., Rizzi L., Shaya E. J., Courtois H. M., Makarov D. I., Jacobs B. A., 2009, AJ, 138, 323
- Walker et al. (2012) Walker E. S., Hachinger S., Mazzali P. A., Ellis R. S., Sullivan M., Gal Yam A., Howell D. A., 2012, MNRAS, 427, 103
- Yamanaka et al. (2014) Yamanaka M., et al., 2014, ApJ, 782, L35
- Yaron & Gal-Yam (2012) Yaron O., Gal-Yam A., 2012, PASP, 124, 668
- Zhao et al. (2015) Zhao X., et al., 2015, ApJS, 220, 20
- Zheng et al. (2013) Zheng W., et al., 2013, ApJ, 778, L15
- Zheng et al. (2014) Zheng W., et al., 2014, ApJ, 783, L24
Appendix A Photometric sequence and photometry of SN 2015F
| R.A. | Decl. | ||||||
|---|---|---|---|---|---|---|---|
| 17.348(0.036) | 17.086(0.021) | 16.245(0.015) | 16.624(0.015) | 15.974(0.020) | 15.648(0.016) | ||
| – | 17.431(0.019) | 16.119(0.015) | 16.753(0.015) | 15.627(0.034) | 15.114(0.016) | ||
| 14.986(0.015) | 14.724(0.015) | 13.894(0.015) | 14.267(0.015) | 13.648(0.022) | 13.374(0.015) | ||
| 16.902(0.026) | 16.672(0.019) | 15.851(0.015) | 16.215(0.015) | 15.615(0.028) | 15.303(0.020) | ||
| 17.793(0.051) | 17.455(0.015) | 16.631(0.015) | 17.006(0.015) | 16.366(0.027) | 16.078(0.024) | ||
| – | 17.067(0.015) | 15.755(0.015) | 16.393(0.015) | 15.242(0.024) | 14.747(0.015) | ||
| 16.829(0.021) | 16.515(0.015) | 15.674(0.015) | 16.053(0.015) | 15.454(0.031) | 15.175(0.015) | ||
| 15.082(0.015) | 14.980(0.015) | 14.279(0.015) | 14.597(0.015) | 14.102(0.020) | 13.857(0.015) | ||
| 17.640(0.029) | 16.823(0.015) | 15.639(0.015) | 16.174(0.015) | 15.270(0.023) | 14.850(0.017) | ||
| 16.210(0.015) | 15.976(0.015) | 15.180(0.015) | 15.538(0.015) | 14.970(0.021) | 14.701(0.015) | ||
| 16.575(0.015) | 16.471(0.015) | 15.747(0.015) | 16.077(0.015) | 15.541(0.019) | 15.266(0.015) | ||
| 18.004(0.015) | 17.852(0.029) | 16.881(0.015) | 17.297(0.015) | 16.588(0.034) | 16.255(0.015) | ||
| 16.595(0.015) | 16.279(0.015) | 15.424(0.015) | 15.821(0.015) | 15.172(0.027) | 14.851(0.015) | ||
| 17.238(0.015) | 17.140(0.015) | 16.413(0.015) | 16.745(0.015) | 16.217(0.028) | 15.951(0.025) | ||
| 17.877(0.077) | 17.590(0.035) | 16.762(0.020) | 17.136(0.015) | 16.523(0.015) | 16.239(0.019) | ||
| 17.448(0.052) | 17.146(0.015) | 16.267(0.015) | 16.645(0.015) | 16.016(0.018) | 15.726(0.019) | ||
| 16.011(0.015) | 15.529(0.021) | 14.591(0.015) | 15.008(0.017) | 14.277(0.015) | 13.949(0.015) | ||
| 14.316(0.015) | 14.239(0.028) | 13.585(0.015) | 13.879(0.015) | 13.425(0.016) | 13.206(0.019) | ||
| 17.916(0.015) | 17.695(0.040) | 16.835(0.015) | 17.203(0.015) | 16.628(0.020) | 16.325(0.018) | ||
| 17.660(0.049) | 17.506(0.024) | 16.787(0.015) | 17.099(0.016) | 16.624(0.039) | 16.378(0.033) | ||
| 17.593(0.015) | 17.080(0.020) | 16.144(0.015) | 16.571(0.015) | 15.883(0.017) | 15.584(0.018) | ||
| 16.904(0.019) | 16.735(0.015) | 15.955(0.015) | 16.296(0.015) | 15.743(0.015) | 15.471(0.021) | ||
| 18.312(0.015) | 17.814(0.028) | 16.887(0.015) | 17.300(0.017) | 16.648(0.029) | 16.342(0.022) | ||
| – | 18.400(0.037) | 16.915(0.015) | 17.666(0.015) | 16.306(0.023) | 15.686(0.016) | ||
| 16.278(0.032) | 15.856(0.017) | 14.960(0.015) | 15.363(0.015) | 14.690(0.017) | 14.375(0.015) | ||
| 17.479(0.024) | 16.983(0.021) | 15.925(0.015) | 16.403(0.015) | 15.604(0.019) | 15.193(0.023) | ||
| 15.398(0.015) | 15.385(0.015) | 14.775(0.015) | 15.048(0.015) | 14.633(0.015) | 14.419(0.018) | ||
| 17.419(0.023) | 17.241(0.036) | 16.424(0.015) | 16.785(0.015) | 16.188(0.015) | 15.913(0.017) | ||
| 17.047(0.025) | 16.957(0.036) | 16.264(0.015) | 16.575(0.015) | 16.092(0.019) | 15.852(0.042) | ||
| – | 17.323(0.015) | 16.201(0.016) | 16.724(0.015) | 15.811(0.023) | 15.419(0.018) | ||
| 18.161(0.015) | 16.895(0.033) | 15.618(0.015) | 16.222(0.015) | 15.132(0.015) | 14.713(0.019) | ||
| 15.990(0.015) | 15.914(0.016) | 15.240(0.015) | 15.545(0.015) | 15.071(0.015) | 14.840(0.021) | ||
| 17.652(0.086) | 16.943(0.043) | 15.925(0.026) | 16.445(0.093) | 15.560(0.015) | 15.223(0.049) | ||
| 17.206(0.015) | 16.744(0.015) | 15.845(0.015) | 16.252(0.015) | 15.604(0.019) | 15.338(0.015) | ||
| 18.021(0.015) | 17.383(0.015) | 16.437(0.015) | 16.889(0.050) | 16.198(0.084) | 15.859(0.071) | ||
| 16.793(0.030) | 16.079(0.015) | 15.079(0.015) | 15.535(0.015) | 14.762(0.019) | 14.447(0.015) | ||
| 16.625(0.118) | 16.431(0.015) | 15.630(0.015) | 15.988(0.015) | 15.410(0.021) | 15.151(0.015) | ||
| 15.328(0.015) | 15.283(0.015) | 14.671(0.015) | 14.944(0.015) | 14.527(0.015) | 14.310(0.018) | ||
| 16.037(0.015) | 15.940(0.018) | 15.285(0.015) | 15.582(0.015) | 15.122(0.015) | 14.901(0.022) | ||
| 15.735(0.015) | 15.556(0.015) | 14.822(0.015) | 15.149(0.015) | 14.632(0.015) | 14.390(0.021) | ||
| 15.893(0.015) | 15.755(0.015) | 15.028(0.015) | 15.363(0.015) | 14.838(0.027) | 14.571(0.019) | ||
| 15.614(0.015) | 15.280(0.015) | 14.451(0.015) | 14.820(0.015) | 14.228(0.016) | 13.965(0.021) | ||
| – | 17.418(0.021) | 16.330(0.015) | 16.829(0.018) | 15.947(0.018) | 15.572(0.016) | ||
| 18.177(0.015) | 17.834(0.015) | 16.905(0.015) | 17.318(0.015) | 16.632(0.018) | 16.316(0.017) |
-
•
Numbers in parenthesis correspond to 1 statistical uncertainties.
| Date UT | MJD | Tel. | ||||||
|---|---|---|---|---|---|---|---|---|
| 2015-03-08 | 57089.07 | – | – | >19.017 | – | – | – | 8 |
| 2015-03-08 | 57089.18 | – | – | >18.709 | – | – | – | 8 |
| 2015-03-09 | 57090.12 | – | – | 18.055(0.101) | – | – | – | 8 |
| 2015-03-10 | 57091.80 | – | 17.156(0.027) | 16.520(0.010) | 16.850(0.010) | 16.419(0.010) | 16.593(0.010) | 2 |
| 2015-03-11 | 57092.00 | – | – | 16.456(0.010) | – | – | – | 7 |
| 2015-03-11 | 57092.99 | – | – | 15.857(0.019) | – | – | – | 7 |
| 2015-03-12 | 57093.81 | – | 15.818(0.010) | 15.436(0.010) | 15.646(0.010) | 15.382(0.013) | 15.469(0.021) | 2 |
| 2015-03-12 | 57093.90 | – | 15.757(0.010) | 15.403(0.010) | 15.574(0.010) | 15.330(0.010) | – | 1 |
| 2015-03-13 | 57094.10 | – | 15.682(0.010) | 15.312(0.010) | 15.494(0.010) | 15.250(0.010) | 15.315(0.010) | 6 |
| 2015-03-13 | 57094.18 | – | – | 15.310(0.019) | – | – | – | 7 |
| 2015-03-13 | 57094.91 | 15.056(0.048) | – | – | – | – | – | 1 |
| 2015-03-14 | 57095.18 | – | – | 14.929(0.021) | – | – | – | 7 |
| 2015-03-14 | 57095.18 | 14.971(0.011) | 15.184(0.010) | 14.898(0.019) | 15.048(0.010) | 14.832(0.018) | – | 6 |
| 2015-03-14 | 57095.52 | 14.816(0.019) | 15.049(0.030) | 14.801(0.010) | 14.938(0.010) | 14.713(0.010) | 14.784(0.010) | 4 |
| 2015-03-14 | 57095.78 | 14.708(0.013) | 14.915(0.010) | 14.702(0.010) | 14.805(0.010) | 14.620(0.010) | 14.696(0.024) | 1 |
| 2015-03-14 | 57095.81 | 14.714(0.010) | 14.912(0.010) | 14.687(0.010) | 14.818(0.010) | 14.626(0.010) | 14.682(0.010) | 2 |
| 2015-03-15 | 57096.85 | 14.336(0.010) | 14.562(0.010) | 14.387(0.014) | 14.496(0.011) | 14.315(0.010) | 14.391(0.010) | 2 |
| 2015-03-16 | 57097.95 | 13.968(0.014) | 14.279(0.012) | 14.134(0.023) | 14.206(0.014) | 14.055(0.012) | 14.127(0.025) | 1 |
| 2015-03-17 | 57098.79 | 13.865(0.010) | 14.085(0.014) | – | 14.037(0.010) | 13.881(0.010) | 13.966(0.031) | 1 |
| 2015-03-17 | 57098.82 | 13.876(0.063) | 14.077(0.010) | 13.945(0.010) | 14.040(0.010) | 13.879(0.010) | 13.979(0.010) | 2 |
| 2015-03-18 | 57099.48 | 13.735(0.010) | 14.022(0.011) | 13.858(0.010) | 13.960(0.010) | 13.780(0.010) | 13.865(0.010) | 5 |
| 2015-03-19 | 57100.84 | 13.504(0.010) | 13.749(0.010) | 13.640(0.010) | 13.706(0.010) | 13.584(0.010) | 13.711(0.010) | 1 |
| 2015-03-20 | 57101.52 | 13.470(0.010) | 13.757(0.010) | 13.608(0.020) | 13.702(0.010) | 13.542(0.010) | 13.672(0.019) | 5 |
| 2015-03-21 | 57102.53 | 13.369(0.014) | – | – | – | – | – | 4 |
| 2015-03-21 | 57102.77 | 13.368(0.014) | 13.600(0.010) | 13.461(0.010) | 13.536(0.010) | 13.426(0.010) | 13.628(0.010) | 3 |
| 2015-03-22 | 57103.07 | 13.329(0.010) | 13.581(0.010) | 13.433(0.010) | 13.516(0.010) | 13.407(0.010) | 13.591(0.010) | 6 |
| 2015-03-23 | 57104.85 | 13.275(0.010) | 13.461(0.010) | 13.335(0.010) | 13.401(0.010) | 13.317(0.010) | 13.619(0.027) | 1 |
| 2015-03-23 | 57104.87 | 13.241(0.073) | – | – | – | – | – | 3 |
| 2015-03-24 | 57105.78 | 13.264(0.010) | 13.444(0.010) | 13.288(0.010) | 13.389(0.010) | 13.288(0.010) | 13.638(0.010) | 2 |
| 2015-03-24 | 57105.85 | 13.255(0.026) | 13.457(0.010) | 13.293(0.010) | 13.373(0.010) | 13.283(0.012) | 13.625(0.012) | 1 |
| 2015-03-25 | 57106.87 | 13.260(0.010) | 13.438(0.010) | 13.264(0.010) | 13.347(0.010) | 13.268(0.010) | 13.673(0.023) | 1 |
| 2015-03-25 | 57106.90 | 13.306(0.024) | 13.486(0.033) | – | – | – | – | 3 |
| 2015-03-26 | 57107.46 | 13.259(0.010) | 13.493(0.010) | 13.277(0.010) | 13.381(0.010) | 13.265(0.010) | 13.691(0.010) | 4 |
| 2015-03-27 | 57108.40 | 13.313(0.010) | 13.507(0.011) | 13.281(0.010) | 13.385(0.010) | 13.285(0.010) | 13.737(0.010) | 4 |
| 2015-03-27 | 57108.52 | – | 13.551(0.013) | 13.300(0.010) | 13.438(0.010) | 13.297(0.010) | 13.740(0.010) | 5 |
| 2015-03-28 | 57109.74 | – | 13.533(0.010) | 13.268(0.010) | 13.399(0.010) | 13.263(0.010) | 13.745(0.030) | 1 |
| 2015-03-28 | 57109.77 | – | 13.569(0.010) | 13.295(0.010) | 13.438(0.010) | 13.292(0.010) | 13.776(0.010) | 2 |
| 2015-03-29 | 57110.78 | – | 13.604(0.010) | 13.291(0.010) | 13.457(0.010) | 13.287(0.010) | 13.782(0.010) | 2 |
| 2015-03-30 | 57111.80 | – | 13.710(0.010) | 13.321(0.010) | 13.501(0.010) | 13.325(0.011) | 13.818(0.010) | 3 |
| 2015-03-30 | 57111.81 | 13.588(0.031) | 13.675(0.010) | 13.307(0.033) | 13.499(0.010) | 13.323(0.033) | 13.827(0.022) | 2 |
| 2015-04-03 | 57115.74 | 14.016(0.049) | 14.081(0.010) | 13.502(0.010) | 13.767(0.010) | 13.585(0.021) | 14.070(0.010) | 2 |
| 2015-04-07 | 57119.46 | 14.616(0.010) | – | 13.766(0.012) | 14.092(0.010) | 13.817(0.010) | 14.197(0.015) | 5 |
| 2015-04-08 | 57120.75 | – | 14.712(0.010) | 13.825(0.010) | 14.202(0.010) | 13.843(0.010) | 14.181(0.023) | 1 |
| 2015-04-08 | 57120.80 | – | 14.738(0.016) | 13.884(0.021) | 14.321(0.214) | 13.844(0.010) | 14.159(0.028) | 3 |
| 2015-04-08 | 57120.87 | – | 14.724(0.010) | 13.835(0.010) | 14.219(0.010) | 13.857(0.010) | 14.166(0.026) | 2 |
| 2015-04-08 | 57120.98 | – | 14.778(0.010) | 13.875(0.011) | 14.258(0.014) | 13.876(0.010) | 14.163(0.010) | 6 |
| 2015-04-10 | 57122.37 | – | – | 13.955(0.086) | 14.280(0.082) | – | – | 4 |
| 2015-04-11 | 57123.02 | – | 15.020(0.016) | 13.994(0.010) | 14.461(0.010) | 13.931(0.010) | 14.134(0.010) | 6 |
| 2015-04-11 | 57123.38 | 15.047(0.047) | 15.067(0.010) | 14.010(0.010) | 14.508(0.010) | 13.947(0.010) | 14.107(0.010) | 5 |
| 2015-04-12 | 57124.42 | – | 15.164(0.012) | 14.094(0.010) | 14.611(0.010) | 13.982(0.010) | 14.125(0.018) | 4 |
| 2015-04-13 | 57125.43 | – | 15.301(0.036) | 14.156(0.010) | 14.716(0.014) | 14.023(0.010) | 14.100(0.010) | 5 |
| 2015-04-14 | 57126.74 | – | 15.418(0.010) | 14.209(0.010) | 14.827(0.010) | 14.021(0.010) | 14.118(0.021) | 1 |
| 2015-04-14 | 57126.78 | – | 15.456(0.010) | 14.239(0.010) | 14.855(0.010) | 14.052(0.010) | 14.130(0.010) | 2 |
| 2015-04-16 | 57128.38 | – | 15.594(0.010) | 14.331(0.022) | 14.967(0.027) | 14.101(0.010) | 14.110(0.013) | 5 |
| 2015-04-16 | 57128.77 | 15.881(0.028) | 15.654(0.010) | 14.359(0.015) | 15.026(0.010) | 14.131(0.010) | 14.162(0.010) | 2 |
| 2015-04-17 | 57129.79 | – | 15.723(0.036) | 14.410(0.021) | 15.121(0.020) | 14.163(0.020) | 14.178(0.026) | 2 |
| 2015-04-18 | 57130.80 | – | 15.813(0.032) | 14.488(0.030) | 15.202(0.019) | 14.212(0.023) | 14.183(0.024) | 2 |
| 2015-04-19 | 57131.82 | – | 15.869(0.052) | 14.518(0.038) | – | – | – | 3 |
| 2015-04-19 | 57131.86 | – | 15.859(0.070) | 14.538(0.039) | 15.302(0.023) | 14.265(0.016) | 14.205(0.051) | 2 |
| 2015-04-20 | 57132.01 | – | 15.904(0.027) | 14.547(0.022) | 15.298(0.019) | 14.274(0.031) | 14.175(0.026) | 6 |
| 2015-04-20 | 57132.79 | 16.155(0.024) | 15.997(0.010) | 14.625(0.032) | 15.483(0.161) | 14.313(0.024) | – | 3 |
| 2015-04-20 | 57132.84 | 16.131(0.080) | – | 14.594(0.010) | 15.354(0.010) | 14.299(0.032) | – | 2 |
Optical photometry of SN 2015F Date UT MJD Tel. 2015-04-21 57133.05 16.120(0.045) 15.982(0.025) 14.622(0.010) 15.396(0.010) 14.334(0.010) 14.223(0.010) 6 2015-04-21 57133.76 – 16.000(0.026) 14.650(0.048) 15.444(0.024) 14.380(0.023) – 2 2015-04-21 57133.79 – 16.004(0.010) 14.669(0.010) 15.453(0.010) 14.366(0.010) – 3 2015-04-21 57133.97 – 16.027(0.033) 14.687(0.022) 15.459(0.026) 14.386(0.023) 14.267(0.030) 6 2015-04-22 57134.71 – 16.147(0.032) 14.764(0.024) 15.505(0.023) 14.452(0.027) 14.300(0.021) 3 2015-04-24 57136.11 16.312(0.036) 16.178(0.010) 14.854(0.015) 15.616(0.010) 14.549(0.010) 14.402(0.023) 6 2015-04-27 57139.42 16.398(0.010) 16.354(0.010) 15.057(0.010) 15.800(0.010) 14.824(0.010) 14.694(0.010) 4 2015-05-01 57143.71 – – 15.315(0.055) 16.045(0.055) – – 2 2015-05-02 57144.81 16.668(0.094) 16.625(0.043) 15.319(0.020) 16.025(0.010) 15.111(0.010) 15.011(0.010) 3 2015-05-05 57147.41 – 16.519(0.047) 15.350(0.025) 16.049(0.027) 15.191(0.022) 15.091(0.027) 4 2015-05-08 57150.74 16.773(0.033) 16.644(0.021) 15.456(0.012) 16.130(0.010) 15.285(0.010) 15.229(0.026) 1 2015-05-09 57151.77 – 16.811(0.059) 15.508(0.022) – – – 3 2015-05-09 57151.81 16.686(0.072) 16.695(0.023) 15.504(0.010) 16.164(0.010) 15.342(0.010) 15.281(0.013) 1 2015-05-10 57152.06 16.853(0.055) 16.722(0.017) 15.536(0.013) 16.209(0.010) 15.382(0.010) 15.321(0.020) 6 2015-05-10 57152.73 – 16.722(0.035) 15.530(0.019) 16.187(0.021) 15.399(0.021) 15.319(0.022) 2 2015-05-10 57152.79 – 16.745(0.020) 15.547(0.010) 16.189(0.010) 15.392(0.010) – 3 2015-05-10 57152.96 – 16.765(0.036) 15.563(0.018) 16.211(0.020) 15.399(0.023) 15.337(0.022) 6 2015-05-14 57156.35 – 16.795(0.053) 15.614(0.029) 16.220(0.032) 15.463(0.026) 15.431(0.034) 5 2015-05-16 57158.74 – 16.829(0.010) 15.648(0.010) 16.293(0.010) 15.560(0.030) – 3 2015-05-17 57159.37 16.945(0.019) 16.800(0.010) 15.690(0.010) 16.281(0.010) 15.583(0.011) 15.561(0.023) 5 2015-05-18 57160.34 – 16.823(0.051) 15.717(0.021) 16.276(0.025) 15.601(0.026) 15.579(0.030) 4 2015-05-22 57164.98 – 16.924(0.056) 15.837(0.031) 16.405(0.042) 15.811(0.050) – 6 2015-05-23 57165.40 16.986(0.090) 16.923(0.023) 15.869(0.024) 16.391(0.015) 15.781(0.010) 15.781(0.026) 4 2015-05-27 57169.69 – 17.024(0.068) 15.991(0.028) – – – 3 2015-05-27 57169.73 – 16.966(0.035) 15.962(0.025) 16.478(0.022) 15.943(0.025) 15.972(0.026) 2 2015-05-28 57170.76 – 16.919(0.010) 15.910(0.023) 16.495(0.026) 15.897(0.010) – 1 2015-06-04 57177.34 – 17.072(0.055) 16.126(0.025) 16.596(0.027) 16.169(0.031) 16.209(0.030) 4 2015-06-05 57178.96 – 17.134(0.049) 16.214(0.022) 16.645(0.017) 16.242(0.015) 16.263(0.029) 6 2015-06-07 57180.95 – 17.153(0.049) 16.246(0.030) 16.690(0.025) 16.267(0.029) 16.371(0.041) 6 2015-06-08 57181.72 – 17.166(0.031) 16.276(0.010) 16.664(0.013) 16.311(0.026) – 3 2015-06-09 57182.72 – 17.159(0.031) 16.255(0.026) 16.639(0.017) 16.328(0.014) – 1 2015-06-10 57183.37 – 17.077(0.075) 16.248(0.016) 16.736(0.227) 16.369(0.030) 16.345(0.010) 5 2015-06-11 57184.95 – 17.145(0.054) 16.346(0.029) 16.717(0.024) 16.402(0.027) 16.469(0.040) 6 2015-06-17 57190.70 – – – 16.784(0.010) 16.598(0.058) – 3
-
•
Numbers in parenthesis correspond to 1 statistical uncertainties.
-
•
Telescopes: 1=1m LCOGT–10/SAAO; 2=1m LCOGT–12/SAAO; 3=1m LCOGT–13/SAAO; 4=1m LCOGT–03/SSO; 5=1m LCOGT–11/SSO; 6=1m LCOGT–05/CTIO; 7=EFOSC–NTT/La Silla; 8=PROMPTs/CTIO.
| R.A. | Decl. | |||
|---|---|---|---|---|
| () | () | () | ||
| () | () | () | ||
| () | () | () |
-
•
Numbers in parenthesis correspond to 1 statistical uncertainties.
| Date UT | MJD | |||
|---|---|---|---|---|
| 2015-03-12 | () | () | () | |
| 2015-03-12 | () | () | () | |
| 2015-03-14 | () | () | () | |
| 2015-03-19 | () | () | () | |
| 2015-03-21 | () | () | () | |
| 2015-03-29 | () | () | () | |
| 2015-04-10 | () | () | () | |
| 2015-04-12 | () | () | () | |
| 2015-04-17 | () | () | () | |
| 2015-04-27 | () | () | () |
-
•
Numbers in parenthesis correspond to 1 statistical uncertainties.