Effect of dopant ordering on the stability of ferroelectric hafnia
Abstract
Films of all-important compound hafnia (HfO2) can be prepared in an orthorhombic ferroelectric (FE) state that is ideal for applications, e.g. in memories or negative-capacitance field-effect transistors. The origin of this FE state remains a mystery, though, as none of the proposed mechanisms for its stabilization – from surface and size effects to formation kinetics – is fully convincing. Interestingly, it is known that doping HfO2 with various cations favors the occurrence of the FE polymorph; however, existing first-principles works suggest that doping by itself is not sufficient to stabilize the polar phase over the usual non-polar monoclinic ground state. Here we use first-principles methods to reexamine this question. We consider two representative isovalent substitutional dopants, Si and Zr, and study their preferred arrangement within the HfO2 lattice. Our results reveal that small atoms like Si can adopt very stable configurations (forming layers within specific crystallographic planes) in the FE orthorhombic phase of HfO2, but comparatively less so in the non-polar monoclinic one. Further, we find that, at low concentrations, such a dopant ordering yields a FE ground state, the usual paraelectric phase becoming a higher-energy metastable polymorph. We discuss the implications of our findings, which constitute a definite step forward towards understanding ferroelectricity in HfO2.
Ever since it was shown that HfO2 films can be prepared in a ferroelectric (FE) phase Böscke et al. (2011); Müller et al. (2012), much effort has focused on elucidating the origin of such a surprising state, never observed in bulk form. Ferroelectricity in hafnia generally becomes more robust as the size of the grains or crystallites gets smaller Yurchuk et al. (2013), a feature that is just opposed to what is typical in traditional ferroelectrics (e.g., perovskite oxides) and seems to suggest that surface effects play a role in the stabilization of the polar polymorph Materlik et al. (2015). However, evidence for this explanation is not conclusive and, more recently, other possible factors, ranging from kinetics of formation of the ferroelectric (FE) phase to the role of phase boundaries and local strains, have been discussed Park et al. (2017); Künneth et al. (2017); Shimizu et al. (2018); Grimley et al. (2018); Park et al. (2019); Liu and Hanrahan (2019).
Interestingly, it is experimentally known that substitutional cation dopants (e.g., Si Böscke et al. (2011), Zr Müller et al. (2011a), , Y Müller et al. (2011b), Al Mueller et al. (2012), La Chernikova et al. (2016)) greatly facilitate the formation of FE hafnia Park et al. (2015). This suggests that, for a suitably chosen dopant A, the mixture Hf1-xAxO2 will undergo a paraelectric (PE) to FE transition as increases, thus displaying a morphotropic phase boundary like many perovskite oxides do. (For example, Sr1-xBaxTiO3 undergoes such a transformation for increasing Ba content Lemanov et al. (1996).) First-principles methods based on density functional theory (DFT) are ideally suited to reveal such morphotropic transitions; however, as far as we know, the results for doped hafnia have been negative so far: all DFT studies predict that doping by itself is not sufficient to stabilize the FE polymorph over the PE ground state of the compound Batra et al. (2017); Künneth et al. (2018); Materlik et al. (2017, 2018); Falkowski et al. (2017); Dogan et al. (2019).
The present work originated from our attempts at using doping to improve the electromechanical responses of FE hafnia. In our simulations with representative tetravalent dopants, it quickly became clear that (some) doping atoms have a (very strong) preference to adopt specific spatial arrangements. An important conclusion follows: It is not appropriate to assume – as implicitly done in the all cited DFT works except for Ref. Falkowski et al. (2017) – that the dopants locate randomly in the HfO2 lattice. We thus focus on this issue and address the following questions: What is the preferred spatial configuration of substitutional cation dopants in HfO2? Can dopant ordering result in a stronger stabilization of the FE phase over the PE polymorphs?
For simplicity here we consider doping with two tetravalent cations, Si and Zr, that have been extensively studied experimentally. We assume that the isovalent replacement of Hf by Si or Zr occurs without any accompanying defect or charged state. Also, we focus on the lowest energy and most common FE phase of hafnia, which has orthorhombic symmetry Huan et al. (2014); Reyes-Lillo et al. (2014); Barabash (2017) and we denote “FE-o” in the following; thus, we do not consider here other FE polymorphs recently reported Barabash (2017); Wei et al. (2018). HfO2 has many PE phases, but here we consider only two: the common monoclinic phase, with symmetry and denoted “PE-m” in the following, which is stable at ambient conditions and constitutes the ground state of the pure compound Barabash (2017); the PE tetragonal polymorph with space group and denoted “PE-t” in the following, which has been discussed as a bridge state leading to the stabilization of the FE-o structure Huan et al. (2014); Shimizu et al. (2018) and whose relevance in this work will be made clear below.
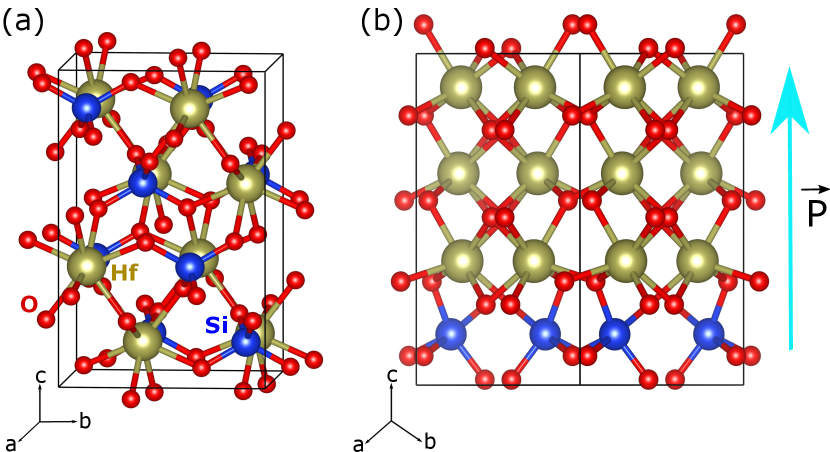
Most of our calculations are done in a 48-atom supercell containing 16 Hf1-xAxO2 formula units (see Fig. 1). This supercell allows us to consider composition steps of 0.0625 (6.25 %), and we study mixings up to (50 %). Whenever we have more than one dopant in the supercell, we study a representative number of spatial arrangements, including distinct limit cases: isolated dopants, clustering forming quasi-spherical aggregates, dopants forming layers in different cyrstallographic planes, dopants intercalated with the Hf atoms, etc. All in all, we study 4 different orders for 12.5 % doping, 12 for 25 %, 17 for 31.25 %, 16 for 37.5 %, 12 for 43.75 %, and 12 for 50 %. For the DFT simulations we use standard methods implemented in the VASP package Kresse and Furthmüller (1996); Kresse and Joubert (1999). See Suppl. Mats. for more details on our simulations.
We focus on the calculation of formation energies of the different polymorphs as a function of composition. For a concentration of dopant A, this quantity is defined as
| (1) |
Here, is the energy of the Hf1-xAxO2 compound as computed for a particular polymorph and arrangement of the A dopants; further, and are the ground-state energies of the pure HfO2 and AO2 materials, respectively. The PE-m phase is taken to be the ground state of HfO2 Barabash (2017) and ZrO2 Reyes-Lillo et al. (2014). For SiO2 we use the structure reported in Ref. Coh and Vanderbilt (2008).
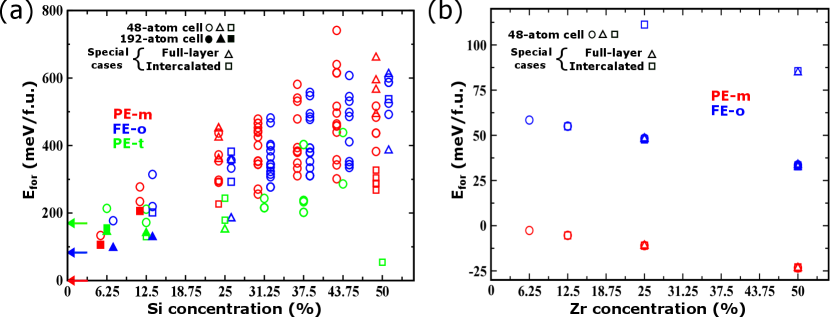
Let us discuss our results following the progress of our simulations and discoveries. Our initial calculations focused on comparing the PE-m and FE-o polymorphs, using the mentioned 48-atom supercell. The corresponding results are shown in Fig. 2 as open red (PE-m) and open blue (FE-o) symbols. We find a marked difference between the behavior of the two dopants. For Si (Fig. 2(a)) the energy differences between different dopant arrangements are massive, with gaps of as much as 400 meV per formula unit (f.u.) separating the most and least stable configurations. In contrast, the Zr dopants (Fig. 2(b)) present a much weaker tendency towards ordering, with many low-laying dopant orderings yielding energies within a window of 1 meV/f.u.
It is also worth noting that, for Si doping, formation energies are always positive, implying that Hf1-xSixO2 mixtures are metastable. In contrast, the PE-m phase of Hf1-xZrxO2 presents negative formation energies, indicating that there is a thermodynamic drive towards forming such solid solutions. More interestingly, for Si doping the PE-m and FE-o structures occupy the same energy range and clearly compete; in contrast, the PE-m state is clearly dominant for all considered Zr compositions. In the following we focus on the Si doping, which is clearly more intriguing.
We find that, in some cases, the relaxation of the Si-doped PE-m and FE-o structures yields a different solution, namely, the PE-t polymorph represented with green open symbols in Fig. 2(a). The PE-t state can be very stable; in particular, the Si-doped structure with the lowest formation energy, which occurs for a Si concentration of 50 % and is shown in Fig. 1(a), has this symmetry. Having found that the PE-t state becomes relevant upon doping, we run for this polymorph all the dopant arrangements previously considered for PE-m and FE-o at 6.25 % and 12.5 % concentrations. The results, represented by open green symbols in Fig. 2(a), show that the PE-t state becomes dominant as the amount of Si grows. (A similar stabilization of the PE-t has already been reported in Ref. Falkowski et al. (2017).) Even more interestingly, our results also show that the FE-o polymorph becomes more stable than the PE-m state for Si concentrations of 12.5 % to 25 %.
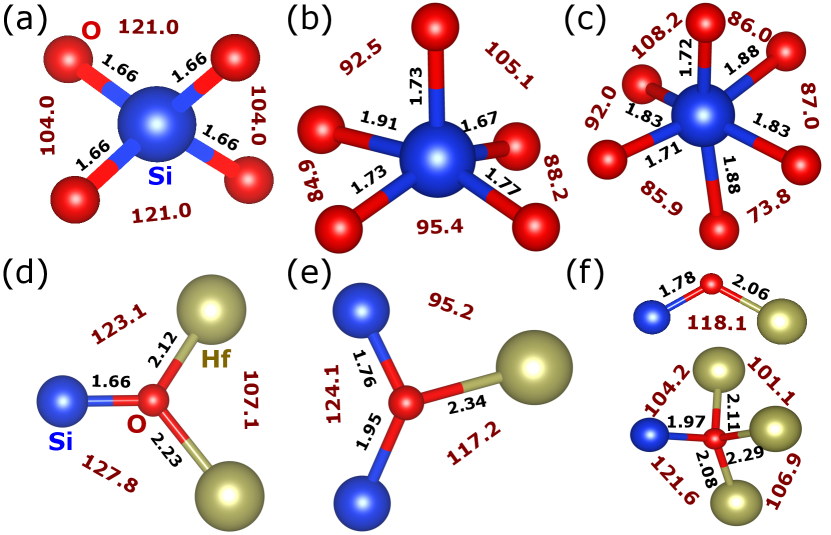
By inspecting the structures of the lowest- and highest-energy dopant arrangements, we can identify the features resulting in more stable configurations. Our findings are summarized in Fig. 3, where Si–O and Hf–O pairs separated by less than 2.4 Å are displayed as forming a chemical bond. Let us start by noting that Si is considerably smaller than Hf. More specifically, the tabulated covalent radii of Hf and Si are 1.87 Å and 1.11 Å, respectively Cordero et al. (2008); as for the ionic radii of Hf4+ and Si4+, we have 0.7 Å and 0.4 Å, respectively Shannon (1976). This size difference suggests that, as compared with Hf, the Si dopants will prefer relatively small oxygen coordination numbers, as we indeed observe in our results. More specifically, we find that some of the most stable structures display SiO4 groups forming nearly regular tetrahedra, as shown in Fig. 3(a). In particular, the SiO4 coordination is typical of the doped tetragonal polymorph, and it characterizes the lowest-energy PE-t solutions, including the structure shown in Fig. 1(a). A second usual coordination involves SiO5 groups forming a (distorted) square-base pyramid, as shown in Fig. 3(b). All Si dopants present this kind of environment in the lowest-lying PE-m and FE-o states, as is the case of the polar structure in Fig. 1(b). Finally, we also find higher Si coordinations, as e.g. the quasi-octahedral SiO6 groups depicted in Fig. 3(c), that are typical of high-lying PE-m and FE-o configurations.
Related trends can be identified by paying attention to the environment of the oxygens: Without exception, in all our lowest-lying structures each oxygen is bound to one Si and two Hf atoms, as depicted in Fig. 3(d); in contrast, structures displaying coordination complexes like that of Fig. 3(e) lie at higher energies, and features as those in Fig. 3(f) are typical of even less stable cases. Hence, our results suggest that the lowest-energy states are those whose chemical-bond topology allows the dopants to form the most stable bonding complexes, namely, the ones in Figs. 3(a), 3(b) and 3(d).
Interestingly, a group of low-energy states present a long-range order whereby the Si dopants are intercalated with the Hf atoms, as in the case of Fig. 1(a); this order, represented by squares in Fig. 2(a), is typical of the lowest-lying PE-m structures and some of the most stable PE-t states. In contrast, the remaining low-energy structures are characterized by a layering of the Si dopants; such layered structures, represented by triangles in Fig. 2(a) and illustrated in Fig. 1(b), are typical among the lowest-lying FE-o solutions and some of the most stable PE-t states. Nevertheless, as the data in Fig. 2(a) show, intercalation or layering alone do not guarantee that the doped structure will have a low formation energy. Indeed, specific details of the ordering are critical for a low-energy state to occur: most importantly, in the most stable Si-doped FE-o solutions, the dopant layers are perpendicular to the polar axis (Fig. 1(b)), while in the most stable layered PE-t structures the dopants occupy planes perpendicular to the crystallographic axis.
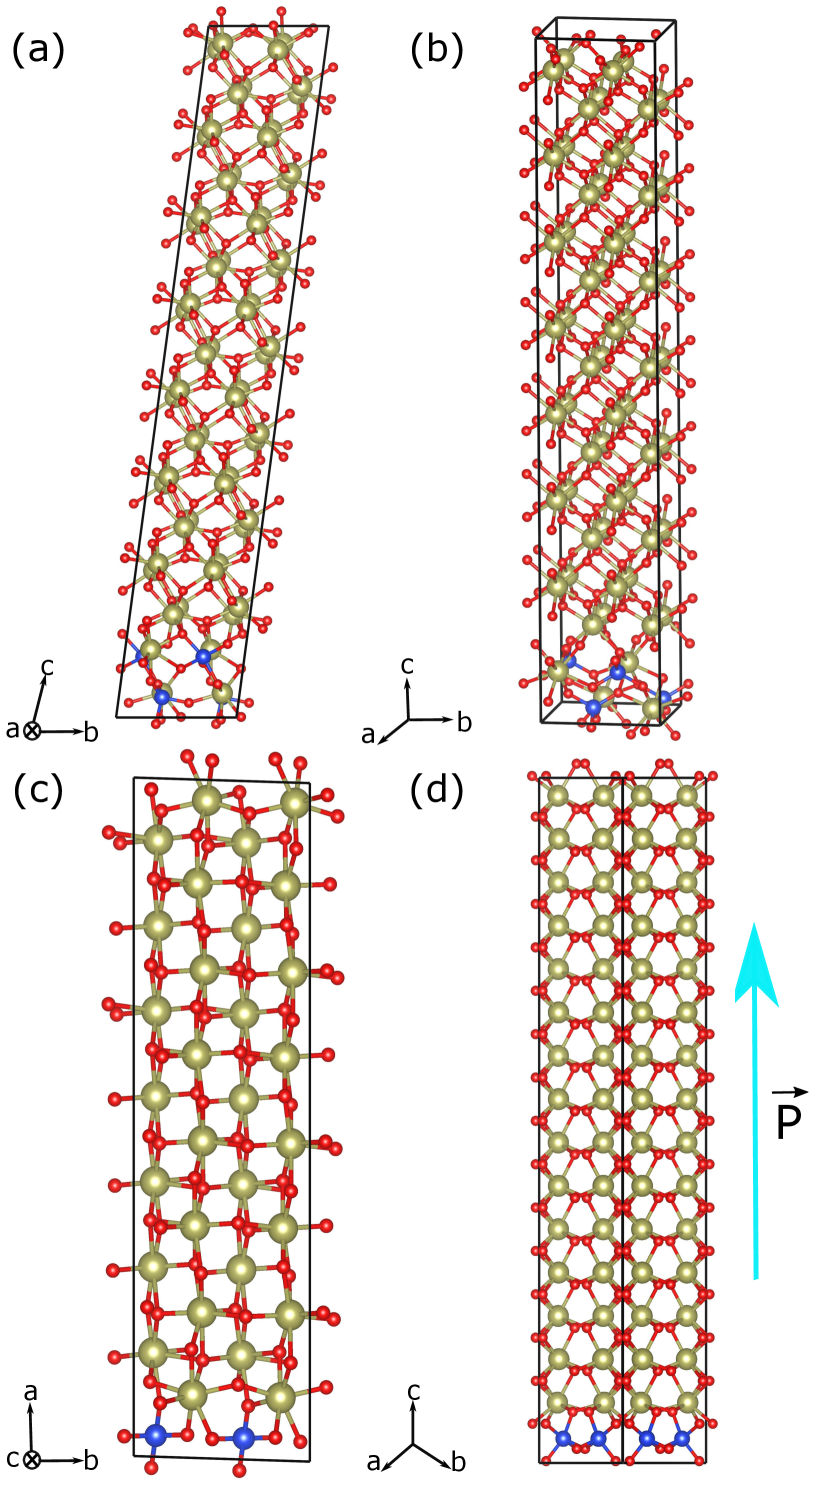
One may wonder whether our 48-atom supercell is realistic to investigate the relative stability of these three structures in the limit of small dopings; for example, for a doping concentration of 6.25 %, the size and shape of this supercell are incompatible with having a complete dopant layer, and only isolated dopants can be studied. Can the peculiar orders observed at higher concentrations, which favor the FE-o and PE-t states, result in the stabilization of such structures for lower doping levels? To test this, we run simulations in elongated 192-atom supercells as those shown in Fig. 4, considering the most energetically favorable dopant arrangements previously identified: a localized region with intercalated Hf/Si atoms for PE-m (Fig. 4(a)) and PE-t (Fig. 4(b)) polymorphs, and suitably-oriented layers of Si dopants for PE-t (Fig. 4(c)) and FE-o (Fig. 4(d)) structures. The corresponding formation energies are shown as filled symbols in Fig. 2(a). These results indicate that the FE-o state with full Si layers constitutes the lowest-energy solution at 6.25 %, thus predicting that the FE-o phase is the thermodynamically stable ground state of HfO2 upon moderate Si doping! Then, as the Si concentration increases to 12.5 %, the FE-o (layered) and PE-t (intercalated) solutions become essentially degenerate, and for higher dopant contents the PE-t state dominates.
Let us emphasize our results for the 6.25 % concentration, as they capture very well the main message of this work. In this case, the open circles in Fig. 2(a) pertain to isolated-impurity calculations as those typically reported in previous DFT studies Batra et al. (2017); Künneth et al. (2018); Materlik et al. (2017, 2018); Dogan et al. (2019). The corresponding formation energies largely reflect the energy differences between the pure HfO2 polymorphs, marked by the colored arrows at in the figure; hence, the PE-m state prevails. However, when the dopants are allowed to adopt their lowest-energy configuration (filled symbols in the figure), strong energy reductions are obtained for the PE-t and FE-o cases, while the energy gain is comparatively small for the PE-m polymorph. This divergent behavior is the key to stabilize the FE-o phase over the PE-m state.
For the FE-o phase of pure HfO2, we calculate a polarization of 55 C/cm2, in agreement with previous literature Huan et al. (2014); Clima et al. (2014); Reyes-Lillo et al. (2014). For the doped structure with a 25 % Si concentration (Fig. 1(b)), we obtain 44 C/cm2. Further, for the 6.25 % structure in Fig. 4(d) we obtain 53 C/cm2. Hence, we predict that the Si dopants stabilize the FE-o phase without harming its ferroelectric polarization.
Our findings seem to be mainly related with the size and preferred oxygen coordination of the relatively-small Si dopants, and the ability of the FE-o and PE-t polymorphs to better accommodate them. If this interpretation is correct, similar behaviors can be expected for other small dopants. Indeed, we have preliminary first-principles evidence that Ge too stabilizes the FE-o polymorph over the PE-m phase when a full -oriented layer is formed (i.e., when we have a situation analogous to that of Fig. 1(b)). Additionally, our results for Zr suggest that ordering is not expected to occur for relatively large dopants. (Our preliminary first-principles results indicate that the behavior of Ti, Sn and Pb dopants is similar.) Further, the observed prevalence of the PE-m state upon doping (Fig. 2(b)) suggests that the connection between big dopants and the stabilization of polar HfO2 is, at best, indirect.
Our theoretical findings have practical implications worth discussing. Most importantly, they suggest that, by depositing thin SiO2 layers during the growth of hafnia films (so that the silica content adds up to about 6–12 % of the material), one should be able to reliably obtain samples in the FE-o phase. The need for a “wake-up” step to observe the FE behavior (as is typical in hafnia thin films Zhou et al. (2013); Schenk et al. (2014)) would be much reduced in such samples, if present at all, as the FE-o phase is their thermodynamic ground state. The predicted most stable geometry, with polarization lying along the growth (out-of-plane) direction, is all but ideal to maximize the remnant polarization of the films.
This proposed preparation strategy could be realized by employing techniques that allow great control of the epitaxial growth, like e.g. pulsed laser deposition. Nevertheless, it is important to note that our ideal scenario is strongly reminiscent of how most FE hafnia films are actually grown, via atomic layer deposition (ALD) where the dopant ratio is achieved by performing a dopant oxide ALD-cycle after a certain number of HfO2 cycles Park et al. (2015). ALD-grown films are then subject to a thermal treatment to induce crystallization; while dopants may diffuse at this step, the resulting samples still present a modulation in dopant concentration along the growth direction, thus displaying diffuse dopant layers Lomenzo et al. (2015); Richter et al. (2017). Hence, when the ALD samples are subject to the wake-up treatment – i.e., application of alternate electric fields, typically along the out-of-plane direction –, they are (according to our results) suitably pre-conditioned to yield the FE-o phase. We thus believe the present findings are consistent with the usual experimental route to obtain FE hafnia, and partly explain why it works. They also indicate that controlling the layering of small dopants may be a key to produce better samples.
Having said this, we should bear in mind that our study is limited to ideal phases of doped HfO2, the connection with experiment being far from perfect. ALD films are randomly oriented Schenk et al. (2019), which implies that, in principle, a good alignment between the dopant layers and specific crystallographic axes (e.g., the polar axis of the FE-o phase) will be possible only in a fraction of the grains. Similarly, the wake-up process is a complex one, known to involve many effects: from transformation of non-polar regions into polar ones Grimley et al. (2016) and re-orientation of ferroelastic domains Shimizu et al. (2018) to movement of defects Zhou et al. (2013) and modification of internal bias fields Schenk et al. (2015). Hence, it would be naive to take our predictions as a fail-safe strategy to obtain perfect samples of FE hafnia. Yet, they do provide us with a definite motivation to explore directions focused on dopant ordering.
We conclude by noting that, HfO2 being such a polymorphic material, the present study could be extended by considering dopant ordering in other low-lying metastable phases. Further, one could also use advanced DFT methods for structure discovery Oganov (2010); Wang et al. (2012) to identify even more stable dopant arrangements. Such investigations might impact the predicted relative stability of doped-HfO2 polymorphs, and are worth tackling in the future. Nevertheless, notwithstanding future extensions and improvements, the basic conclusion of the present work – namely, that the spatial arrangement of small dopants in HfO2 is critically important – is clear and robust. Further, its most obvious consequence – that, when accounting for the possible spatial arrangements of the dopants, the formation energies of the dominant polar and non-polar polymorphs fall within the same range – also seems robust. Hence, the present results should definitely change the way we think of dopants in HfO2 and how they help stabilize its polar phase.
Work funded by the Luxembourg National Research Fund (FNR) through Grants PRIDE/15/10935404 “MASSENA” (S.D. and J.Í.), INTER/ANR/16/11562984 “EXPAND” (H.A. and J.Í.). T.S. acknowledges the finacial support of LIST through project SF_MRT_CSDFO.
References
- Böscke et al. (2011) T. S. Böscke, J. Müller, D. Bräuhaus, U. Schröder, and U. Böttger, Applied Physics Letters 99, 102903 (2011).
- Müller et al. (2012) J. Müller, T. S. Böscke, U. Schröder, S. Mueller, D. Bräuhaus, U. Böttger, L. Frey, and T. Mikolajick, Nano Letters 12, 4318 (2012).
- Yurchuk et al. (2013) E. Yurchuk, J. Müller, S. Knebel, J. Sundqvist, A. P. Graham, T. Melde, U. Schröder, and T. Mikolajick, Thin Solid Films 533, 88 (2013).
- Materlik et al. (2015) R. Materlik, C. Künneth, and A. Kersch, Journal of Applied Physics 117, 134109 (2015).
- Park et al. (2017) M. H. Park, Y. H. Lee, H. J. Kim, T. Schenk, W. Lee, K. D. Kim, F. P. G. Fengler, T. Mikolajick, U. Schroeder, and C. S. Hwang, Nanoscale 9, 9973 (2017).
- Künneth et al. (2017) C. Künneth, R. Materlik, and A. Kersch, Journal of Applied Physics 121, 205304 (2017).
- Shimizu et al. (2018) T. Shimizu, T. Mimura, T. Kiguchi, T. Shiraishi, T. Konno, Y. Katsuya, O. Sakata, and H. Funakubo, Applied Physics Letters 113, 212901 (2018).
- Grimley et al. (2018) E. D. Grimley, T. Schenk, T. Mikolajick, U. Schroeder, and J. M. LeBeau, Advanced Materials Interfaces 5, 1701258 (2018).
- Park et al. (2019) M. H. Park, Y. H. Lee, T. Mikolajick, U. Schroeder, and C. S. Hwang, Advanced Electronic Materials 5, 1800522 (2019).
- Liu and Hanrahan (2019) S. Liu and B. M. Hanrahan, Physical Review Materials 3, 054404 (2019).
- Müller et al. (2011a) J. Müller, T. S. Böscke, D. Bräuhaus, U. Schröder, U. Böttger, J. Sundqvist, P. Kücher, T. Mikolajick, and L. Frey, Applied Physics Letters 99, 112901 (2011a).
- Müller et al. (2011b) J. Müller, U. Schröder, T. S. Böscke, I. Müller, U. Böttger, L. Wilde, J. Sundqvist, M. Lemberger, P. Kücher, T. Mikolajick, and L. Frey, Journal of Applied Physics 110, 114113 (2011b).
- Mueller et al. (2012) S. Mueller, J. Mueller, A. Singh, S. Riedel, J. Sundqvist, U. Schroeder, and T. Mikolajick, Advanced Functional Materials 22, 2412 (2012).
- Chernikova et al. (2016) A. G. Chernikova, D. S. Kuzmichev, D. V. Negrov, M. G. Kozodaev, S. N. Polyakov, and A. M. Markeev, Applied Physics Letters 108, 242905 (2016).
- Park et al. (2015) M. H. Park, Y. H. Lee, H. J. Kim, Y. J. Kim, T. Moon, K. D. Kim, J. Müller, A. Kersch, U. Schroeder, T. Mikolajick, and C. S. Hwang, Advanced Materials 27, 1811 (2015).
- Lemanov et al. (1996) V. V. Lemanov, E. P. Smirnova, P. P. Syrnikov, and E. A. Tarakanov, Physical Review B 54, 3151 (1996).
- Batra et al. (2017) R. Batra, T. D. Huan, G. A. Rossetti, and R. Ramprasad, Chemistry of Materials 29, 9102 (2017).
- Künneth et al. (2018) C. Künneth, R. Materlik, M. Falkowski, and A. Kersch, ACS Applied Nano Materials 1, 254 (2018).
- Materlik et al. (2017) R. Materlik, C. Künneth, T. Mikolajick, and A. Kersch, Applied Physics Letters 111, 082902 (2017).
- Materlik et al. (2018) R. Materlik, C. Künneth, M. Falkowski, T. Mikolajick, and A. Kersch, Journal of Applied Physics 123, 164101 (2018).
- Falkowski et al. (2017) M. Falkowski, C. Künneth, R. Materlik, and A. Kersch, Applied Physics Letters 111, 082902 (2017).
- Dogan et al. (2019) M. Dogan, N. Gong, T.-P. Ma, and S. Ismail-Beigi, Physical Chemistry Chemical Physics 21, 12150 (2019).
- Huan et al. (2014) T. D. Huan, V. Sharma, G. A. Rossetti, and R. Ramprasad, Physical Review B 90, 064111 (2014).
- Reyes-Lillo et al. (2014) S. E. Reyes-Lillo, K. F. Garrity, and K. M. Rabe, Physical Review B 90, 140103 (2014).
- Barabash (2017) S. Barabash, Journal of Computational Electronics 16, 1227 (2017).
- Wei et al. (2018) Y. Wei, P. Nukala, M. Salverda, S. Matzen, H. J. Zhao, J. Momand, A. S. Everhardt, G. Agnus, G. R. Blake, P. Lecoeur, B. J. Kooi, J. Íñiguez, B. Dkhil, and B. Noheda, Nature Materials 17, 1095 (2018).
- Kresse and Furthmüller (1996) G. Kresse and J. Furthmüller, Physical Review B 54, 11169 (1996).
- Kresse and Joubert (1999) G. Kresse and D. Joubert, Physical Review B 59, 1758 (1999).
- Coh and Vanderbilt (2008) S. Coh and D. Vanderbilt, Physical Review B 78, 054117 (2008).
- Cordero et al. (2008) B. Cordero, V. Gómez, A. E. Platero-Prats, M. Reves, J. Echeverría, E. Cremades, F. Barraán, and S. Alvarez, Dalton Transactions 21, 2832– (2008).
- Shannon (1976) R. D. Shannon, Acta Crystallographica Section A 32, 751 (1976).
- Clima et al. (2014) S. Clima, D. J. Wouters, C. Adelmann, T. Schenk, U. Schroeder, M. Jurczak, and G. Pourtois, Applied Physics Letters 104, 092906 (2014).
- Zhou et al. (2013) D. Zhou, J. Xu, Q. Li, Y. Guan, F. Cao, X. Dong, J. Müller, T. Schenk, and U. Schröder, Applied Physics Letters 103, 192904 (2013).
- Schenk et al. (2014) T. Schenk, U. Schroeder, M. Pešić, M. Popovici, Y. V. Pershin, and T. Mikolajick, ACS Applied Materials & Interfaces 6, 19744 (2014).
- Lomenzo et al. (2015) P. D. Lomenzo, Q. Takmeel, C. Zhou, C.-C. Chung, S. Moghaddam, J. L. Jones, and T. Nishida, Applied Physics Letters 107, 242903 (2015).
- Richter et al. (2017) C. Richter, T. Schenk, M. H. Park, F. A. Tscharntke, E. D. Grimley, J. M. LeBeau, C. Zhou, C. M. Fancher, J. L. Jones, T. Mikolajick, and U. Schroeder, Advanced Electronic Materials 3, 1700131 (2017).
- Schenk et al. (2019) T. Schenk, C. M. Fancher, M. H. Park, C. Richter, C. Künneth, A. Kersch, J. L. Jones, T. Mikolajick, and U. Schroeder, Advanced Electronic Materials 5, 1900303 (2019).
- Grimley et al. (2016) E. D. Grimley, T. Schenk, X. Sang, M. Pešić, U. Schroeder, T. Mikolajick, and J. M. LeBeau, Advanced Electronic Materials 2, 1600173 (2016).
- Schenk et al. (2015) T. Schenk, M. Hoffmann, J. Ocker, M. Pešić, T. Mikolajick, and U. Schroeder, ACS Applied Materials & Interfaces 7, 20224 (2015).
- Oganov (2010) A. R. Oganov, ed., Modern methods of crystal structure prediction (Wiley-VCH, Weinheim, Germany, 2010).
- Wang et al. (2012) Y. Wang, J. Lv, L. Zhu, and Y. Ma, Computer Physics Communications 183, 2063 (2012).