Effects of high-energy ionizing particles on the Si:As mid-infrared detector array on board the AKARI satellite
Abstract
We evaluate the effects of high-energy ionizing particles on the Si:As impurity band conduction (IBC) mid-infrared detector on board AKARI, the Japanese infrared astronomical satellite. IBC-type detectors are known to be little influenced by ionizing radiation. However we find that the detector is significantly affected by in-orbit ionizing radiation even after spikes induced by ionizing particles are removed. The effects are described as changes mostly in the offset of detector output, but not in the gain. We conclude that the changes in the offset are caused mainly by increase in dark current. We establish a method to correct these ionizing radiation effects. The method is essential to improve the quality and to increase the sky coverage of the AKARI mid-infrared all-sky-survey map.
1 Introduction
The effects of high-energy ionizing particles (hereafter we simply call them ionizing radiation effects) on infrared detectors of extrinsic semiconductors are serious for infrared astronomical observations in space. The ionizing radiation effects cause changes in detector sensitivity and after-effects which can last for a certain amount of time after the particle hit. For infrared astronomical satellites such as Infrared Space Observatory (ISO; Kessler et al., 1996) and Infrared Astoronomical Satellite (IRAS; Neugebauer et al., 1984), it was difficult to perfectly remove the ionizing radiation effects from their observational data (e.g. Moseley et al., 1989; Nieminen, 2003; Heras et al., 2003). This problem is particularly serious in the south Atlantic anomaly (SAA). The SAA has the local depression in the Earth magnetic field intensity over Brazil, where many high-energy protons and electrons are trapped even at low sky altitudes. When a satellite passes through the SAA, a great amount of ionizing radiation is irradiated onto detectors.
AKARI, the first Japanese infrared astronomical satellite, was launched on February 21, 2006 (UT) into a sun-synchronous polar orbit at an altitude of 700 km with a period of about 100 minutes per revolution (Murakami et al., 2007). AKARI made an all-sky survey in the six photometric bands centered at the wavelengths of 9 and 18 with the Infrared Camera (IRC; Wada et al. 2003; Onaka et al. 2007) and 65, 90, 140, and 160 with the Far-Infrared Surveyor (FIS; Kawada et al. 2007) within a period of almost one and a half years (Kataza et al., 2010; Yamamura et al., 2010; Ishihara et al., 2010). The all-sky survey was performed during the lifetime of liquid helium cryogen between May 8, 2006 and August 28, 2007. As a result, AKARI surveyed more than 96 and 97 % of the whole sky twice or more in the S9W and L18W bands, respectively. During the survey, AKARI passed through the SAA three or four times a day.
For the far-infrared survey, the AKARI/FIS adopted Ge:Ga photoconductive devices, which made the all-sky surveys in the 65, 90, 140, and 160 bands. The Ge:Ga detectors were seriously influenced by the ionizing radiation, which caused undesirable changes in detector responsivity and degradation in noise performance (Kaneda et al., 2006; Suzuki et al., 2008). Thus a curing operation was performed every time the satellite passed through the SAA. The FIS did not carry out pointed observations during the passage of the SAA.
The mid-infrared channels of the AKARI/IRC, which made the all-sky surveys at the 9 and 18 bands, adopted the Si:As/CRC-744 infrared arrays manufactured by Raytheon (Lum et al., 1993; Estrada et al., 1998; Ando et al., 2003). The detector is of an impurity band conduction (IBC) type (Szmulowicz & Madarsz, 1987), which is known to be little influenced by ionizing radiation unlike the above non-IBC-type Ge:Ga detectors (Gordon et al., 2005). However, spikes are inevitably induced by ionizing particle hitting events in the detector output, which resemble the detection of astronomical point sources. Therefore, algorithm was developed to remove the spikes induced by ionizing particles (Ishihara et al., 2006, 2010). So far, it has not been quantitatively investigated whether or not there are any significant changes in detector performance other than the spikes due to in-orbit ionizing radiation.
In this paper, we evaluate ionizing radiation effects on the Si:As IBC mid-infrared detector on board AKARI. We find that the detector is significantly affected by in-orbit ionizing radiation even after spikes induced by ionizing particles are removed. The effects are described as changes mostly in the offset of detector output, but not in the gain, where the offset value increases with the particle hitting rate. We establish a method of correction, by which we can utilize the data affected by the ionizing radiation to make diffuse sky maps.
2 Data reduction
We use the all-sky survey data in the 9 and 18 bands to investigate ionizing radiation effects on the Si:As IBC detectors. The contents of this paper are based on the 18 data; for the 9 data, similar results are obtained and the same technique as described below can be applied.
In the all-sky survey observations, two out of 256 rows in the detector array format are operated in a continuous non-destructive readout mode (Ishihara et al., 2006). The pixel scales are for the 9 band and for the 18 band. The sampling rate is set to be 22.72 Hz (one sampling per s), while the scan speed of the satellite in the survey observation mode is . The effective pixel size for a single scan by a single row is for the 9 band and for the 18 band. The in-scan pixel size is fixed by the sampling rate, while the outputs of four neighboring pixels are coadded to meet the down-link rate requirements and still make effective observations. Finer spatial resolutions comparable to the point spread functions (PSFs) of and in FWHM for the 9 and the 18 band, respectively (Onaka et al., 2007), are obtained in the data processing by combining images produced by the two rows (Ishihara et al., 2010).
All the pixels were reset at a rate of 0.074 Hz (one reset per 306 samplings) to discharge the photo-current integrated in detector capacitance. The region of pixels) (=/0.074 Hz) was surveyed in this reset interval. Here and hereafter we define this region as an image unit. After we process the data with the pipeline used in generating the point source catalog, we calculate averaged pixel intensities per image unit. The spikes induced by ionizing particle hitting are detected by millisecond confirmation by using the redundancy of the 2 rows, and removed from the data (Ishihara et al., 2010). We define the number of the spikes detected per image unit as particle hitting rate per image unit.
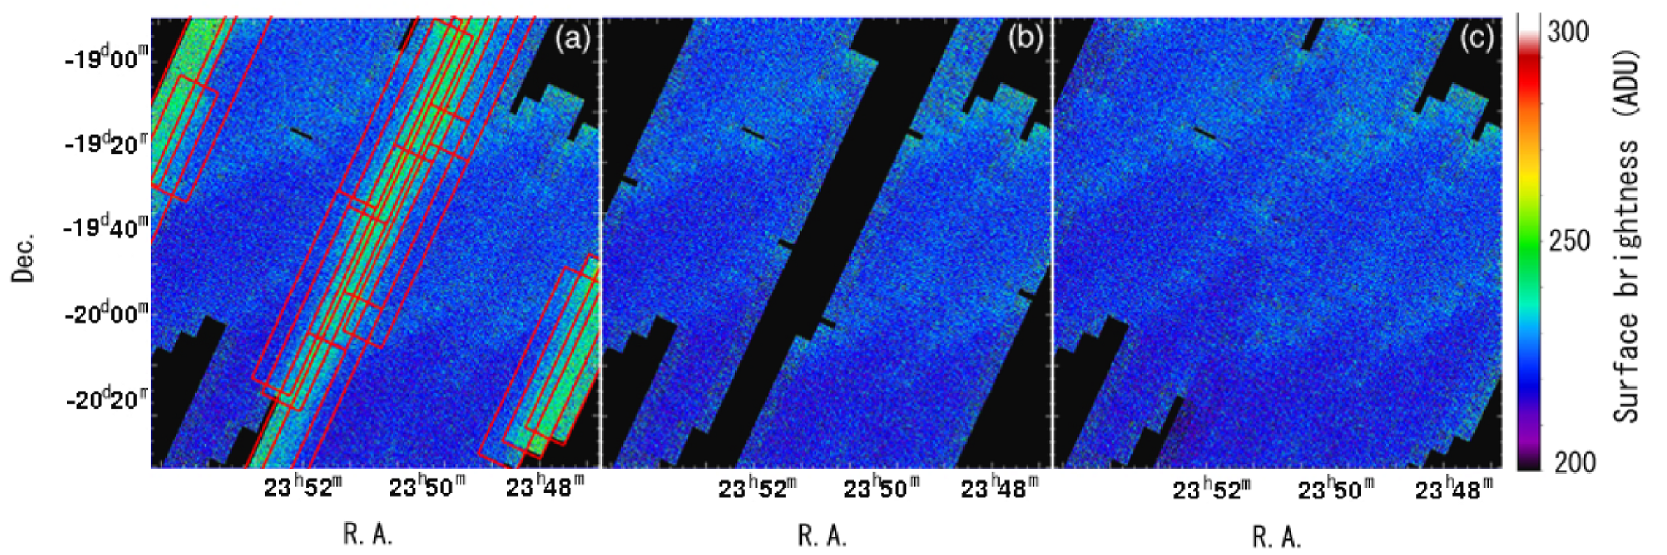
Figure 1 presents an example of AKARI 18 maps of the area centered at (R.A., Dec.)=(357∘.7, 19∘.7), where we have already removed the spikes induced by ionizing particles from the data. The size of the image bin is set to be . Figure 1a is the image created by using the data including those taken during the passage of the SAA, while Fig. 1b is the image created by not using such data. The bright stripes are seen in the original image (Fig. 1a). However, after the data taken during the passage of the SAA are excluded, the stripes disappear from the image (Fig. 1b). We thus find that the ionizing radiation has significant effects on the IBC detector output even after the spikes are removed. Here and hereafter, the SAA-affected data are defined as those included in image units with particle hitting rates higher than 5 events unit-1.
As shown in Fig. 1a, the ionizing radiation apparently increases the output level of the detector, which can be explained by change in either offset or gain of the output. Because AKARI observed the same region twice or more and the IRC was continuously operated around the SAA, we can compare SAA-affected and non-affected intensities to quantitatively evaluate the change by the ionizing radiation by using two datasets taken at the same sky position in different seasons.
However, we cannot simply compare the data in different seasons because the Zodiacal light emission, a dominant foreground emission component in the mid-IR wavelength region, is known to show seasonal variations due to asymmetry in distribution of Zodiacal dust with respect to the ecliptic plane and the circum-solar dust ring (Kelsall et al., 1998). Thus, we first develop a method to evaluate the seasonal variation of the foreground emission.
The difference of the foreground emission () between two seasons due to the variation of the Zodiacal light is represented as,
| (1) |
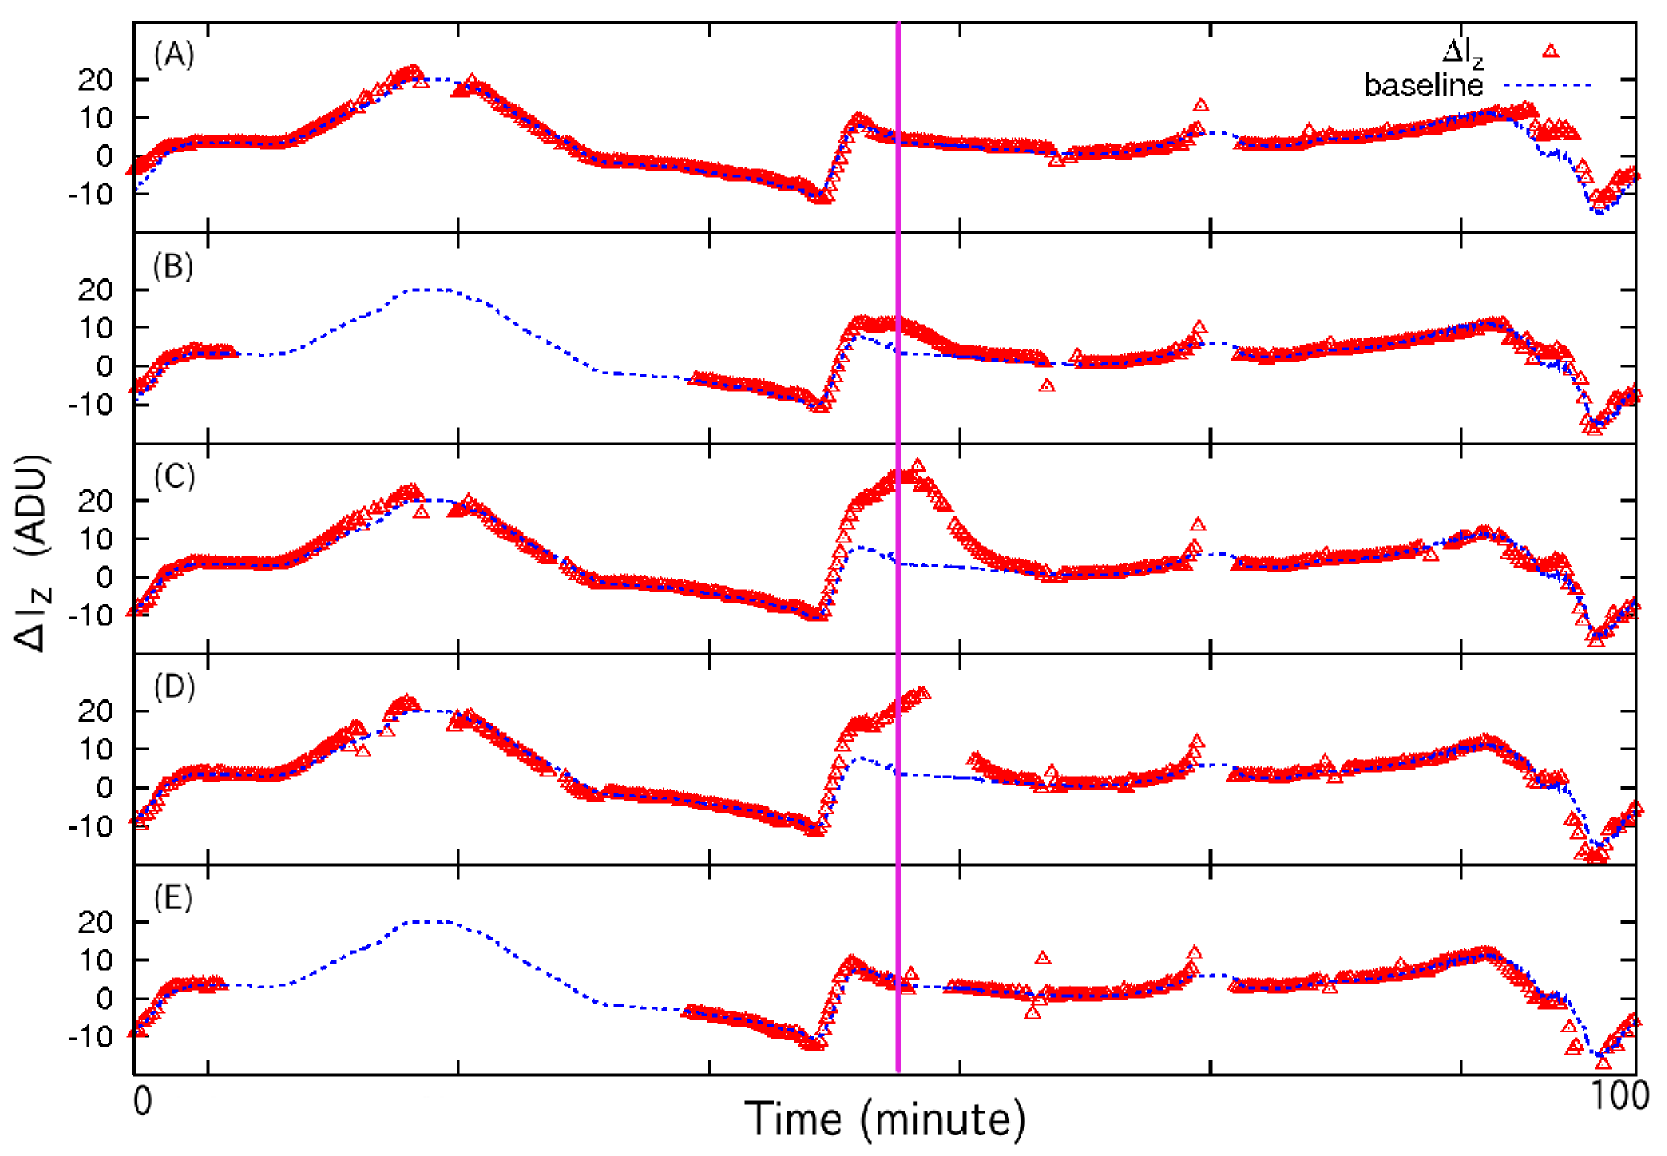
where and are the averaged pixel intensities of image units at the same sky position observed in the seasons 1 and 2, respectively. Both and are not affected by the SAA. Figure 2 shows an example of as a function of the orbital phase of AKARI (the orbital period of AKARI is approximately 100 minutes). The time corresponds to the orbital phase, with which the terrestrial latitude of the satellite position and the ecliptic latitude of the observed sky change. The values are taken from data obtained on June 10, 2006, while the values are taken from data obtained half a year later, on December 10, 2006. Because the orbit of AKARI is sun-synchronous, almost the same sky positions are covered in these two observations. The plots A-E in Fig. 2 correspond to data in 5 sequential orbits. The maximum distance of sky positions at the same orbital phase between two adjacent orbits is 4 arcmin, and that between orbits within 24 hours is one degree. The plots B, C, and D correspond to data in the orbits passing the SAA. Large discrepancies between the estimated and the observed are seen during the passage of the SAA, where the data cannot be used in estimating . They are due to the ionizing radiation effects. By assuming that has a smooth spatial distribution within one degree and a small time variation within 24 hours, non-SAA-affected levels of are estimated by interpolating from the neighboring orbit data along the cross-scan direction. We do not use data when the resulting shows a time variation faster than 0.44 ADU per minute. By using these plots, we can distinguish the effects of ionizing radiation from the seasonal variation of the foreground emission.
3 Results
3.1 Behavior of ionizing radiation effects
As shown in the previous section, the output levels of the detector increase systematically in the SAA even after the spikes are removed. Therefore we examine how they increase, i.e. by change in offset or gain of the output.
The fractional increase of the output level due to the SAA, , is derived from the equation,
| (2) |
where is the averaged pixel intensity of an image unit observed in the season 1 during the passage of the SAA. If the ionizing radiation effect is described by the change in the gain (1+), is reduced to,
| (3) |
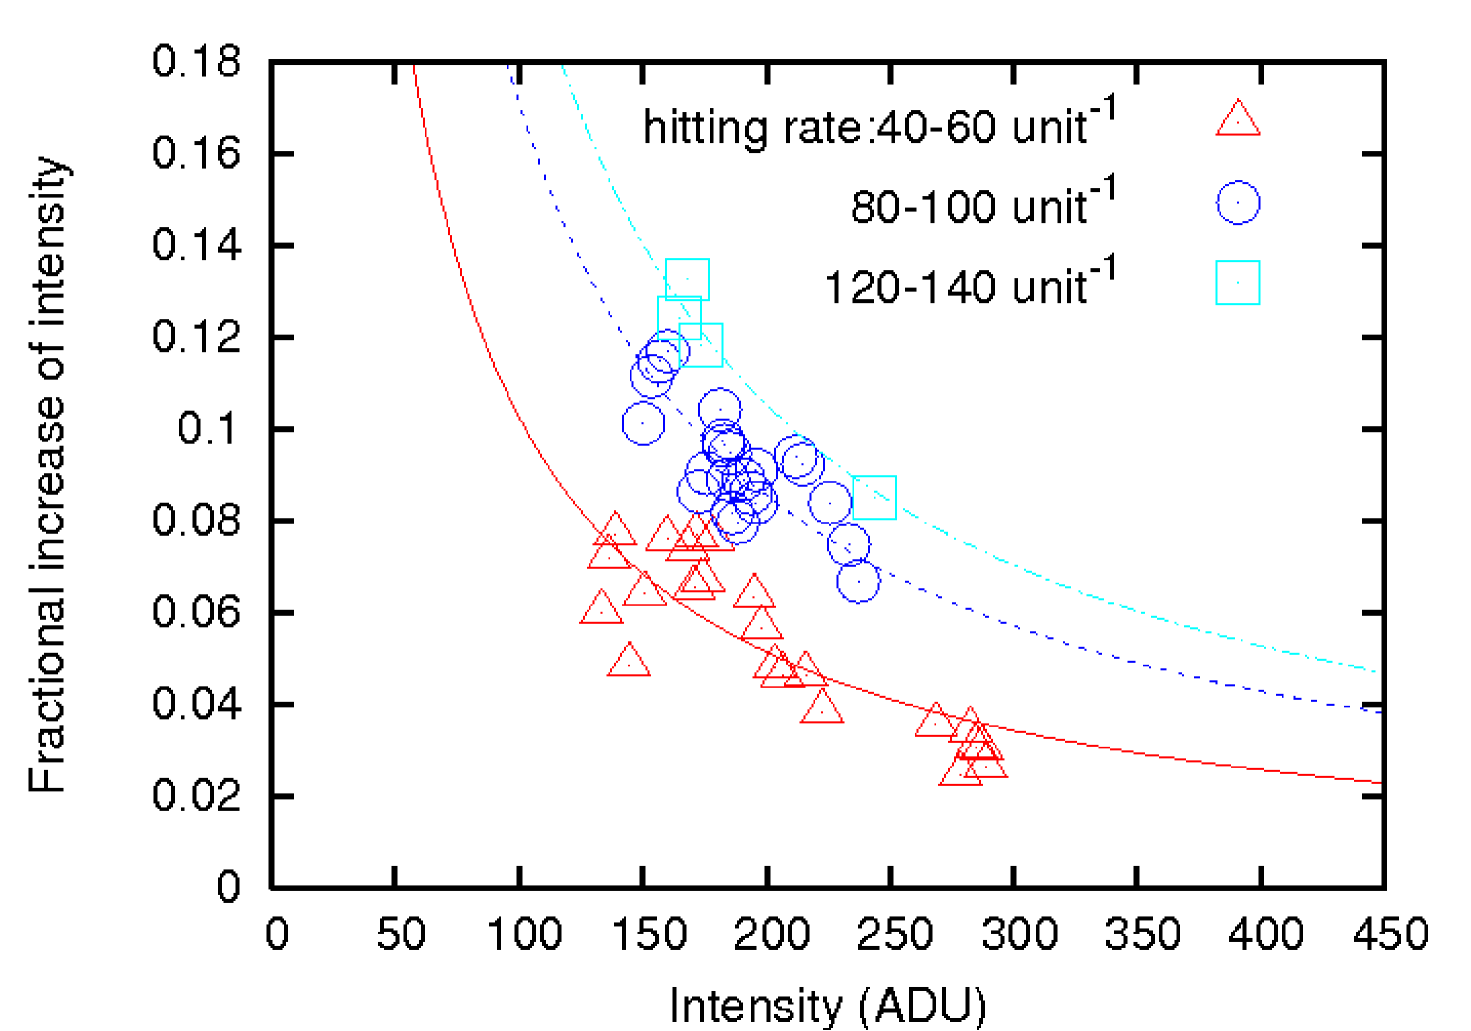
The scatter plot of versus should follow the line parallel to a horizontal axis, if is constant. On the other hand, if the ionizing radiation effect is described by the offset (), the scatter plot follows a hyperbolic function as,
| (4) |
Therefore, we can judge whether the ionizing radiation effect is the gain or the offset from the behavior of with respect to .
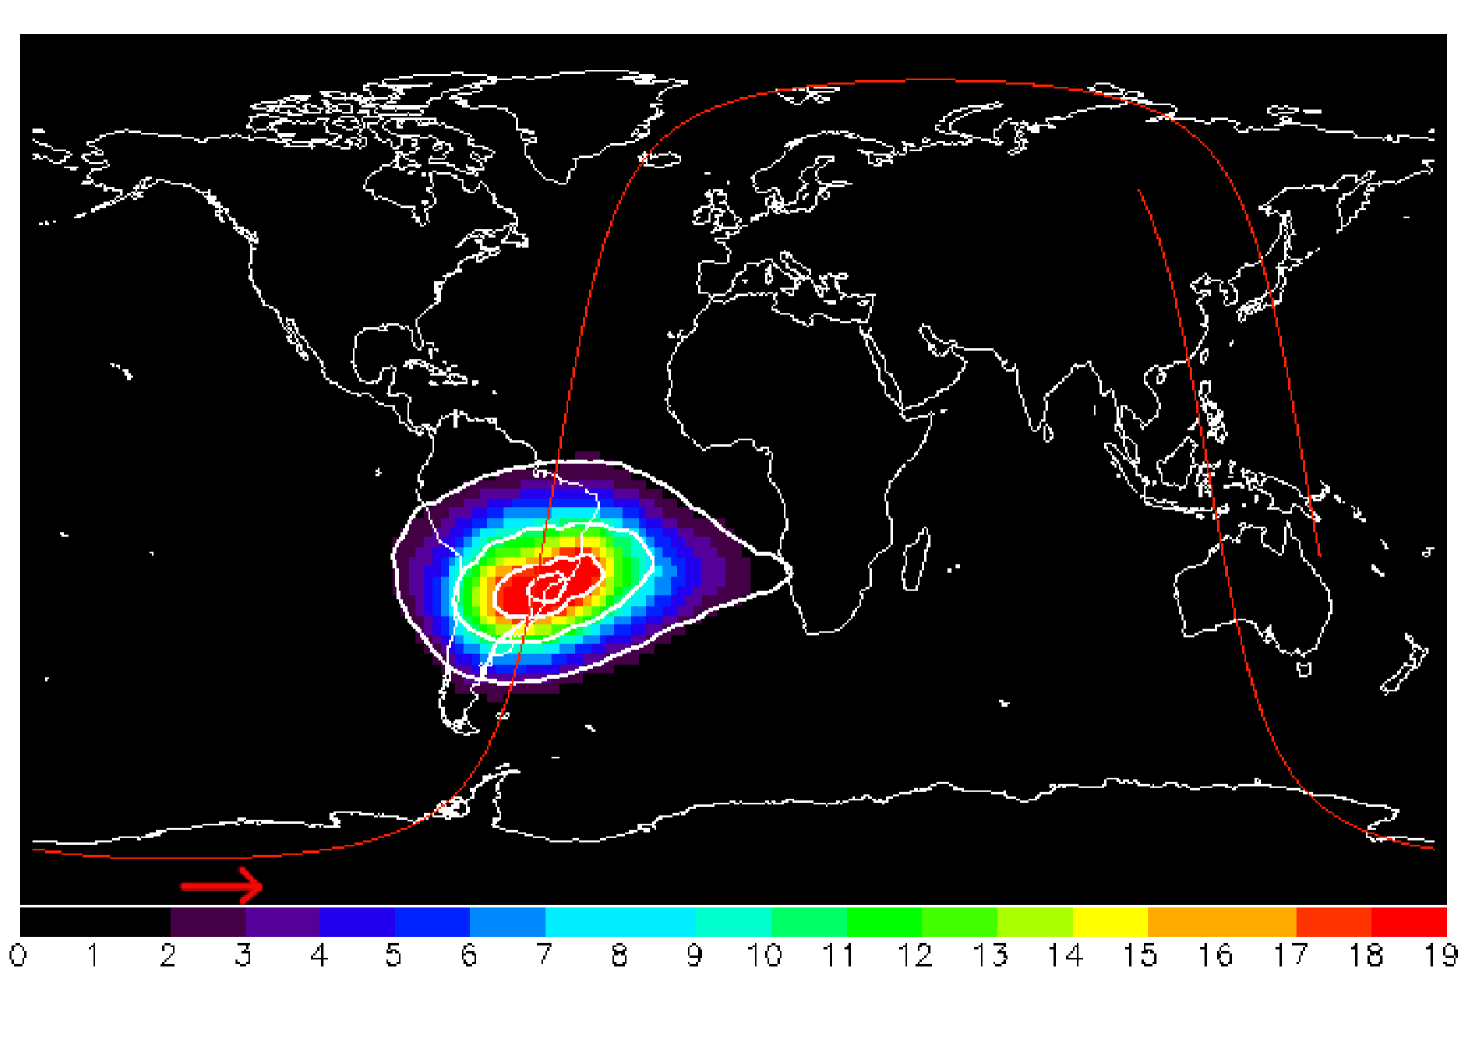
Figure 3 shows the plot of versus for the three different ranges of particle hitting rates. Because these plots are better fitted by hyperbolic curves than by lines parallel to the horizontal axis, we conclude that the ionizing radiation effect is explained mostly by the change in the offset of detector output, but not in the gain.
Figure 4 compares the distribution map of the offset value of the detector output (=) with the contours of the particle hitting rate in the terrestrial coordinates. The distribution map of the offset is spatially correlated well with the contour map of the particle hitting rate, and does not elongate along the satellite scan direction, indicating that after-effects due to the ionizing radiation are negligible, at least, on time scales longer than a few minutes.
3.2 Correction of ionizing radiation effects
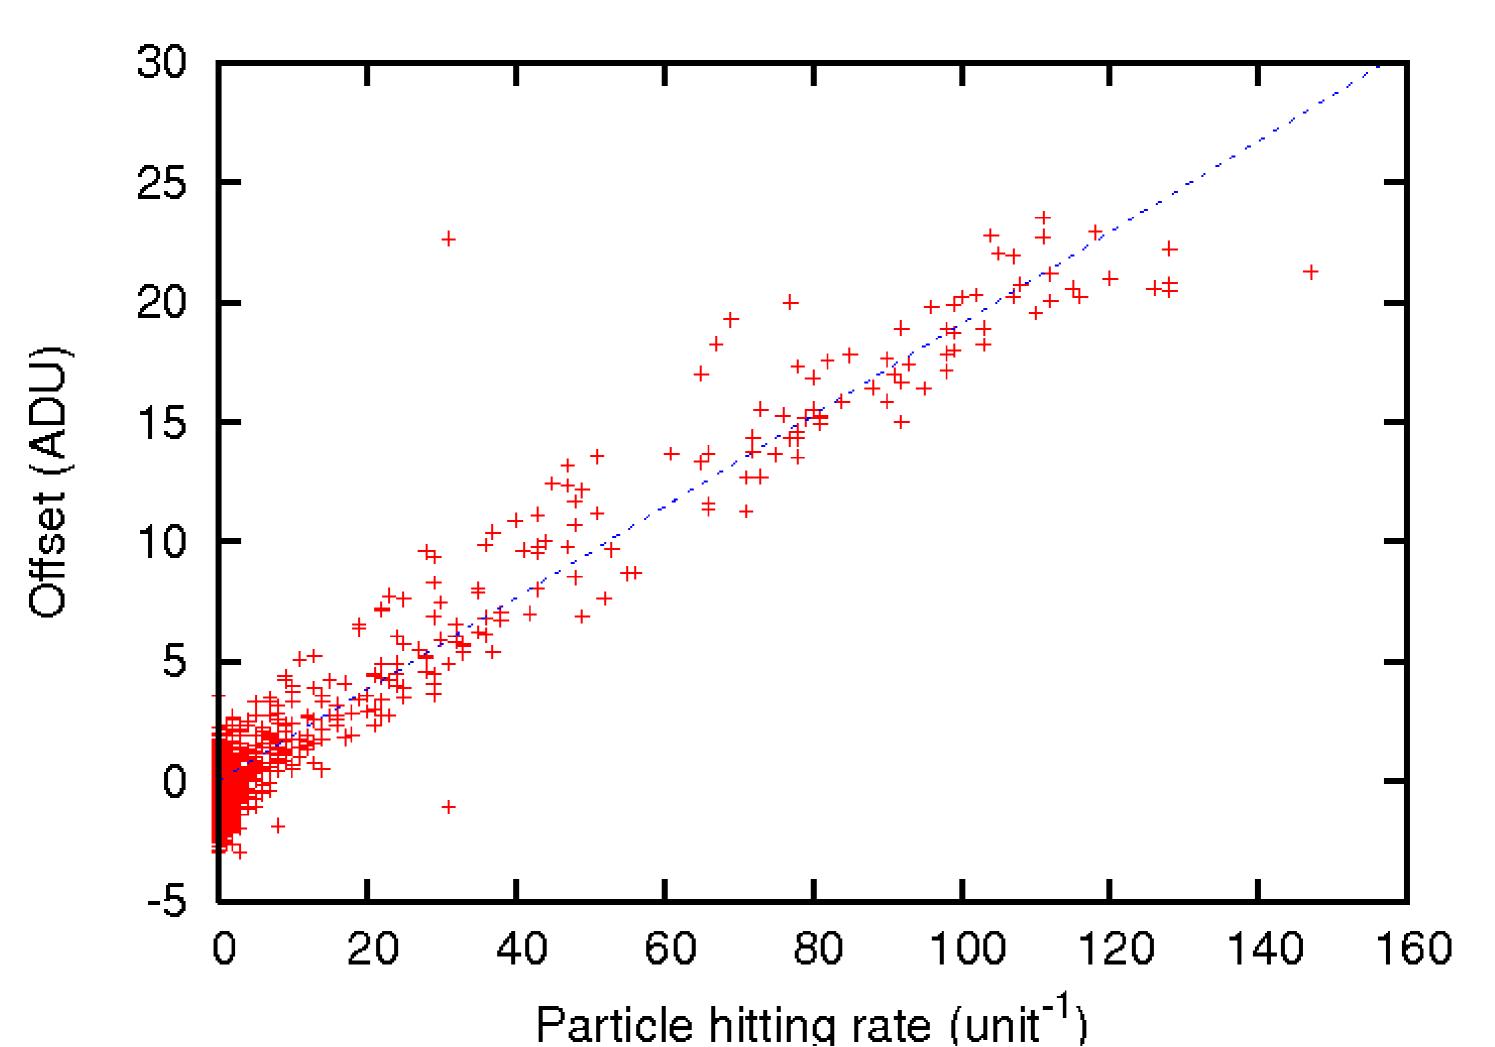
We evaluate the ionizing radiation effects quantitatively to formulate a correction method. Figure 5 plots offset values (=) as a function of the particle hitting rate. The plot shows a linear relation between the offset values and particle hitting rates. We obtain the linear coefficient of by a line fitting.
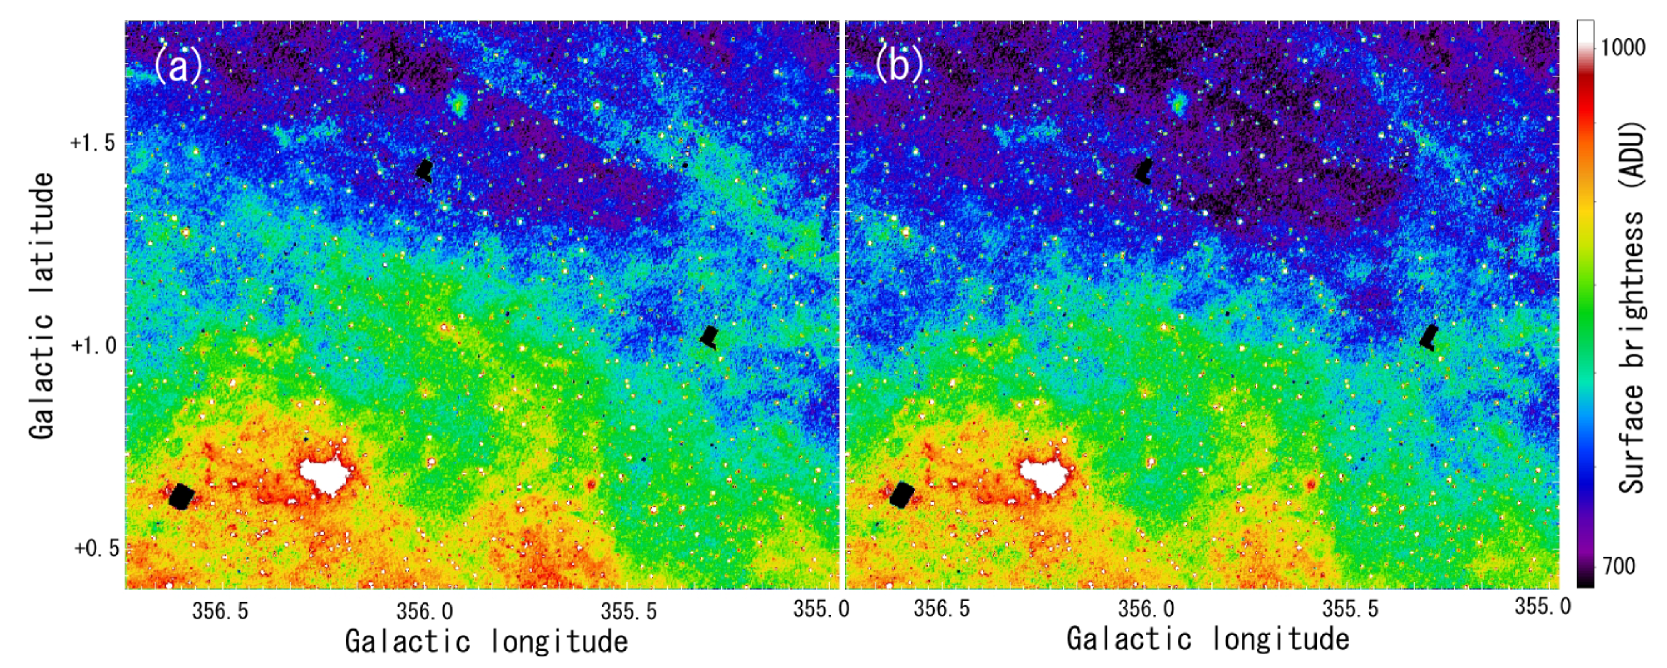
Thus in order to make diffuse maps, we first obtain a particle hitting rate every image unit to be used. Then as a function of the particle hitting rate, we derive the corresponding offset values from the line in Fig. 5, and subtracted them from the image units affected by the SAA. As a result, we derive such a clean image as shown in Fig. 1c, which demonstrates the effectiveness of this correction method. We also apply this method to another region near the Galactic center (Fig. 6). As can be confirmed from the figure, this method works out well in making diffuse maps with brighter intensities and larger dynamic ranges of brightness. Thus by making the most use of the data affected by the ionizing radiation with this method, we can increase the sky coverage and the quality of the AKARI mid-IR all-sky-survey map, especially the Galactic plane map.
4 Discussion
| Center (ADU) | Width (ADU) | |
|---|---|---|
| Outside SAA | 151.700.04 | 13.260.04 |
| Inside SAA | 175.900.05 | 13.820.05 |
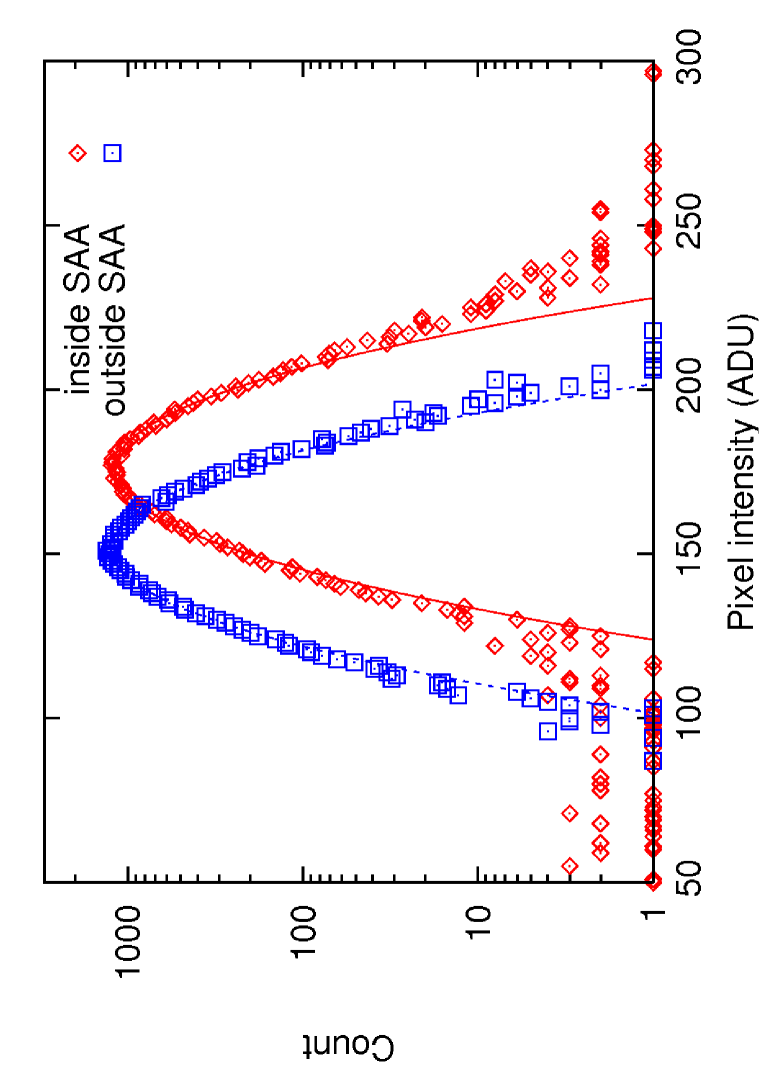
What causes the offset of the output level during the passage of the SAA? Possible scenarios are: (1) an increase in the number of very small spikes below the detection level, (2) an increase in dark current, or (3) a drift of the offset level of readout electronics. The last one is due to the change of the gate-source voltage of a source-follower in the readout integrated circuit (ROIC) hybridized to the detector (Wu et al., 1997), which is easily caused by the drift of an array temperature (Ishihara et al., 2003). To distinguish them, we compare the distribution of the pixel intensities of the image unit taken inside the SAA with that outside the SAA, as shown in Fig. 7.
Each distribution is well explained by a Gaussian distribution. The fitting parameters of the Gaussian center and width are summarized in Table 1, together with their errors. The ionizing radiation effects make the distribution shift toward higher intensities and increase its width (i.e. noise) significantly. But it keeps the symmetric shape with respect to the peak, which indicates that the rise of the averaged intensities inside the SAA is caused by a slight increase in intensities of all the pixels, but not an increase in the number of positive spiky pixels. We have confirmed the presence of residual small positive and negative spikes below the detection limit of the de-spiking algorithm (Ishihara et al., 2006, 2010), producing the low-level broad wings in Fig.7. However such spikes are only a few percent in number, which cannot make a significant contribution to the observed peak shift of the distribution.
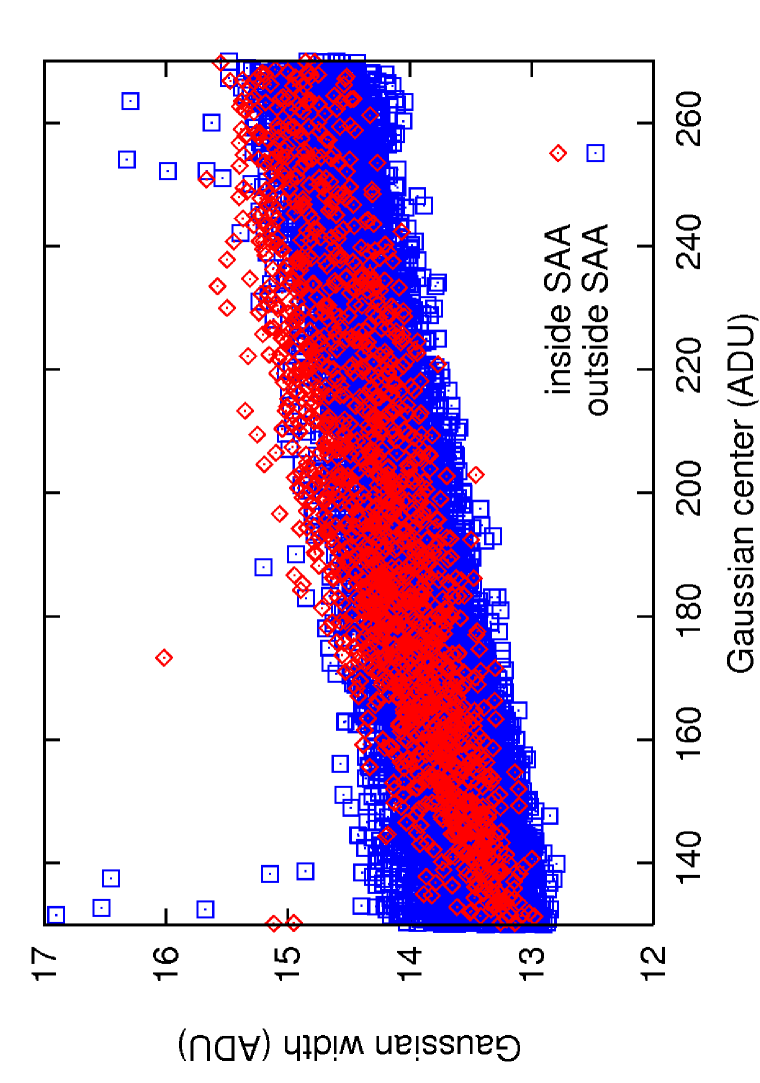
In Fig. 8, we plot the Gaussian widths against the central intensities, which are obtained by fitting a Gaussian profile to each histogram; by using the data taken between June 08 and June 14 2006 (UT), we obtain many histgrams such as shown in Fig. 7. If the offset of the output level is caused by a simple drift of the ROIC, the data taken inside the SAA should shift towards higher intensities along the horizontal axis while the Gaussian width does not change. However, the data taken inside the SAA show increases in the Gaussian widths as well as the intensities. Thus the noise does change due to the ionizing radiation effect in the SAA. Moreover the overall distributions of the data taken inside the SAA and outside the SAA show almost no systematic difference. Since dark current and photo-current are expected to have similar dependence of noise on intensities, Fig. 8 indicates that the offset of an averaged pixel intensity inside the SAA is caused mainly by the actual increase in dark current, but not by a simple drift of the offset of the ROIC.
Therefore, we conclude that the offset of the output level during the passage of the SAA is caused mainly by increases in dark current of the detector.
5 Summary
We have investigated ionizing radiation effects on the Si:As IBC mid-infrared detector on board the AKARI satellite. By using the AKARI all-sky-survey data, we have found that the detector is significantly affected by in-orbit ionizing radiation during the passage of the SAA. The effects are described as changes mostly in the offset of detector output, but not in the gain. We have confirmed that the distribution of the offset value shows an excellent spatial correlation with the distribution of the particle hitting rate in the terrestrial coordinate map, exhibiting no significant after-effects due to the passage of the SAA. The offset values show a linear correlation with the particle hitting rates. By utilizing the linear correlation, we have established a method to correct the ionizing radiation effects and successfully applied it to the all-sky-survey data, resulting in producing better diffuse emission maps. By investigating the histograms of pixel intensities in image units taken inside and outside the SAA, we conclude that the main physical cause of the offset variation is the increase of dark current.
References
- Ando et al. (2003) Ando, K. J., et al. 2003, Proc. SPIE, 5074, 648
- Estrada et al. (1998) Estrada, A. D., et al. 1998, Proc. SPIE, 3354, 99
- Gordon et al. (2005) Gordon, K. D., et al. 2005, PASP, 117, 503
- Heras et al. (2003) Heras, A. M., et al. 2003, The Calibration Legacy of the ISO Mission, ed. L. Metcalfe, A. Salama, S. B. Peschke and M.F. Kessler (ESA SP-481; Netherlands: ESA), 203
- Ishihara et al. (2003) Ishihara, D., et al. 2003, Proc. SPIE, 4850, 1008
- Ishihara et al. (2006) Ishihara, D., et al. 2006, PASP, 118, 324
- Ishihara et al. (2010) Ishihara, D., et al. 2010, A&A, 514A, 1I
- Kaneda et al. (2006) Kaneda, H., Akazaki, M., & Nakagawa, T. 2006, Infrared Physics & Technology, 48, 22
- Kataza et al. (2010) Kataza, H., et al. 2010, AKARI-IRC Point Source Catalogue Release note Version 1.0, (http://www.ir.isas.jaxa.jp/ASTRO-F/Observation/)
- Kawada et al. (2007) Kawada, M., et al. 2007, PASJ, 59, 389
- Kelsall et al. (1998) Kelsall, T., et al. 1998, ApJ, 508, 44
- Kessler et al. (1996) Kessler, M. F., et al. 1996, A&A, 315, L27
- Lum et al. (1993) Lum, N. A., et al. 1993, Proc. SPIE, 1946, 100
- Moseley et al. (1989) Moseley, S. H., Silverberg, R. F., & Lakew, B. 1989, Proc. SPIE, 973, 299
- Murakami et al. (2007) Murakami, H., et al. 2007, PASJ, 59, S369
- Neugebauer et al. (1984) Neugebauer, G., et al. 1984, ApJ, 278, L1
- Nieminen (2003) Nieminen, P. 2003, The Calibration Legacy of the ISO Mission, ed. L. Metcalfe, A. Salama, S. B. Peschke and M.F. Kessler (ESA SP-481; Netherlands: ESA), 197
- Onaka et al. (2007) Onaka, T., et al. 2007, PASJ, 59, S401
- Suzuki et al. (2008) Suzuki, T., et al. 2008, PASP, 120, 895S
- Szmulowicz & Madarsz (1987) Szmulowicz, F. & Madarsz, F. L. 1987, Journal of Applied Physics, 62, 2533
- Wada et al. (2003) Wada, T., et al. 2003, Proc. SPIE, 4850, 179
- Wu et al. (1997) Wu, J., Forrest, W. J., Pipher, J. L., Lum, N., & Hoffman, A. 1997, Review of Scientific Instruments, 68, 3566
- Yamamura et al. (2010) Yamamura, I., Makiuti, S., Ikeda, N., Fukuda, Y., Oyabu, S., Koga, T., & White, G. J. 2010, AKARI-FIS Bright Source Catalogue Release note Version 1.0, (http://www.ir.isas.jaxa.jp/ASTRO-F/Observation/)