Environmental cluster effects and galaxy evolution: The Hi properties of the Abell clusters A85/A496/A2670
Abstract
We study the impact of local environment on the transformation of spiral galaxies in three nearby () Abell clusters: A85/A496/A2670. These systems were observed in Hi with the Very Large Array, covering a volume extending beyond the virial radius and detecting 10, 58, 38 galaxies, respectively. High fractions (0.40–0.86) of bright spirals [log] are not detected in Hi. We provide further evidence of environmental effects consisting in significant fractions (0.10–0.33) of abnormal objects and a number of red (passive) spirals, suggesting an ongoing process of quenching. Ram-pressure profiles, and the sample of the brightest spirals used as test particles for environmental effects, indicate that ram-pressure plays an important role in stripping and transforming late-types. Phase-space diagrams and our search for substructures helped to trace the dynamical stage of the three systems. This was used to compare the global cluster effects vs. pre-processing, finding that the former is the dominating mechanism in the studied clusters. By contrasting the global distribution of Hi normal vs. Hi disturbed spirals in the combined three clusters, we confirm the expected correlation of disturbed objects located, on average, at shorter projected radii. However, individual clusters do not necessarily follow this trend and we show that A496 and A2670 present an atypical behavior. In general we provide conclusive evidence about the dependence of the transformation of infalling spirals on the ensemble of cluster properties like mass, ICM density, dynamical stage and surrounding large-scale structure.
keywords:
galaxies: evolution — galaxies: neutral hydrogen — galaxies: clusters: individual: (Abell 85/496/2670)1 Introduction
For decades, observations have shown that regions of high galaxy-density, such as cluster cores, are dominated by red E/S0 galaxies while blue spirals are more abundant in lower density regions. Large amounts of observational evidence have confirmed the morphology-density relation which constitutes one of the clearest evidences of environment playing an important role in galaxy evolution (Oemler, 1974; Dressler, 1980; Postman & Geller, 1984; Dressler et al., 1997; Goto et al., 2003; Poggianti et al., 2009b). This () scenario is in full agreement with the CDM model of hierarchical formation of structures, where individual galaxies are predicted, and observed to follow the stream from low to high-density environments during their life time. This galaxy migration seems to be tightly correlated with a systematic change of their physical properties such as morphology, gas content, and SF/AGN activity. On the theoretical side many works (De Lucia, Hirschmann, & Fontanot, 2019, and references therein) conclude that secular mechanisms and/or conditions at the time of galaxy formation () might be more important than environment in driving galaxy evolution. Theoretical models are still trying to reproduce all the observational trends linked with environment. Nowadays it is generally accepted that galaxies at low redshifts have been shaped by both, nature and nurture. However the full understanding of the physics behind the galaxy evolution over cosmological timescales remains a very active research field (e.g. Peng et al., 2010; Boselli & Gavazzi, 2014; Cortese, Catinella, & Smith, 2021).
Solving the question of morphology transformation of spirals into lenticulars, through an evolutionary sequence involving starburst/post-starburst phases (e.g. Boselli & Gavazzi, 2006; Barway et al., 2007; Poggianti et al., 2009a; Paccagnella et al., 2017; Boselli et al., 2022), requires the study along two main axes, the environment being one of them. Studying galaxies within the same cosmic epoch but living in different environments helps to find correlations between galaxy properties and the physical conditions of their local environment (Bahé et al., 2013; Spérone-Longin et al., 2021). The second axis corresponds to the cosmic evolution: the study of galaxy properties as a function of redshift has shown that a short ( yrs) starburst phase occurs, followed by a long term and complex quenching process (Rhee et al., 2020; Cortese, Catinella, & Smith, 2021). As a consequence, the fraction of galaxies in the red sequence almost doubled between 1 and 0, implying a decrease of blue galaxies accompanied by strong morphology evolution (Butcher & Oemler, 1978; Fasano et al., 2000; Arnouts et al., 2007).
Several consortia have been actively approaching the question based on large photometric and spectroscopic surveys such as 2dF and SDSS, covering large sky areas and redshift ranges (Lewis et al., 2002; Balogh et al., 2004; Kauffmann et al., 2004; Poggianti et al., 2017). All these efforts have found indisputable evidence for the impact of environment in galaxy evolution (Boselli & Gavazzi, 2006, 2014; Cortese, Catinella, & Smith, 2021, and references therein). However, understanding the role played by different physical mechanisms exerted under diverse environment conditions constitutes the matter of a very active debate. The involved physical mechanisms are classified in two types, hydrodynamic and gravitational. Hydrodynamic effects concern the stripping of cold/warm interstellar gas (Hi and H2) by the hot intracluster medium (ICM). The ram-pressure stripping (RPS, Gunn & Gott, 1972) and the viscous stripping (Nulsen, 1982) are the most studied cases. On the other side we have the tidal (gravitational) mechanisms occurring between a galaxy and the cluster potential (Byrd & Valtonen, 1990) or among neighbor galaxies (Merritt, 1983; Barnes & Hernquist, 1996; Walker, Mihos, & Hernquist, 1996). These include major mergers, accretion of low-mass satellites, and the accumulation of fast speed encounters between galaxies (the galaxy harassment, Moore, Katz, & Lake, 1996). The removal of the galaxy halo gas, known as galaxy starvation (e.g. Larson, Tinsley, & Caldwell, 1980), is predicted to occur either by hydrodynamic or gravitational interactions. Most of these mechanisms are predicted to transform a spiral galaxy into an S0, and it is known that more than one process might act simultaneously on a single galaxy. The pre-processing of galaxies occuring within groups infalling towards clusters, seems to be particularly important (Donnari et al., 2021). Groups of galaxies are known to have lower velocity dispersions than clusters, allowing slower and deeper tidal interactions among their members. Several authors (Fadda et al., 2008; Poggianti et al., 2009b) provided substantial evidence that strong galaxy evolution is occurring in low mass systems at large distance from the cluster core. However, the debate pre-processing vs. cluster effects remains open because many variables are involved, such as the infalling orbits, initial gas/stellar masses, the group/cluster properties and even the surrounding large scale structure (Salerno et al., 2020; Rhee et al., 2020).
In this context, studying the atomic hydrogen (Hi) of spiral galaxies, in combination with observations at other frequencies and with numerical simulations, has proven to be a powerful tool to study galaxy evolution as a function of environment. Hi is probably the best tracer of galaxy interactions as it extends well beyond the stellar disk. Several studies have been devoted to the nearest clusters such as Virgo, Hydra, A 1367 and Coma (e.g. Giovanelli & Haynes, 1985; Cayatte et al., 1990; Bravo-Alfaro et al., 2000; Solanes et al., 2001; Chung et al., 2009; Scott et al., 2010, 2018; Boselli et al., 2021; Wang et al., 2021; Molnár et al., 2022). The large coverage and high sensitive Hi-surveys carried out with single dish telescopes, such as HIPASS and ALFALFA (Giovanelli et al., 2005; Haynes et al., 2018), provided statistical information on the Hi content of large samples of spirals in different environments. All these surveys have shown that spirals in clusters have systematically less gas than their counterparts in the field. This loss of cold gas is known to be the first step to the eventual quenching of star formation observed in cluster galaxies.
In parallel to single-dish surveys, Hi synthesis imaging provides critical information mainly at low redshifts. This technique unveils different types of disruptions like gas shrunk discs, asymmetries, and offsets between the gas and the stellar disks (Bravo-Alfaro et al., 2001; Chung et al., 2009; Scott et al., 2018; Luber et al., 2022, and references therein). Hi-maps and kinematical velocity-fields are essential to constrain hydrodynamical simulations of galaxies under different environment processesing (e.g. Vollmer et al., 2012; Tonnesen, 2019, and references therein). With a few remarkable exceptions, Hi-synthesis imaging surveys are restricted to the nearby universe () due to instrumental limitations and to the very long observing times required. As a consequence, only a few clusters have been fully covered by using this technique. The new generation of radio telescopes such as ASKAP and MeerKAT (Koribalski et al., 2020; Jonas & MeerKAT Team, 2016), as well as upgraded instruments like the Westerbork Synthesis Radio Telescope (WSRT) and the Karl G. Jansky Very Large Array (VLA), are nowadays pushing farther the redshifts of Hi-imaged galaxies. The BUDHIES project (Jaffé et al., 2013, 2016; Gogate et al., 2020) use the WSRT to characterize the HI properties in and around two clusters at , A963 and A2192. The CHILES project (Fernández et al., 2013; Hess et al., 2019) uses the VLA to image the Hi in a 40 arcmin field out to and has made a direct detection at the largest distance so far, at (Fernández et al., 2016). In parallel to pushing the study of Hi to higher redshifts (the time axis) it is equally important to enlarge the sample of studied clusters lying at the same epoch (the environment axis). Large-volume, Hi blind imaging surveys like the one presented in this work are intended to explore different clusters from their core to the outskirts. The Hi maps and kinematics of resolved objects are studied as a function of the very diverse environments where galaxies are located.
In this paper we enlarge the sample of nearby systems ( 0.08) imaged in Hi. Large volumes of the Abell clusters A85, A496, A2670, were homogeneously observed with the VLA. We discuss their global Hi properties paying special attention to a complete sample of bright spirals, used as test particles for environment effects. We obtain Hi physical parameters of individual galaxies and deliver an atlas of Hi maps and velocity fields. Bright spirals not detected in Hi are of particular interest. We seek for correlations between gas properties of individual galaxies within the substructures reported in this work as a test quantifying the pre-processing. We present profiles of the ram pressure and projected phase space diagrams (PPS) for each cluster. Finally, we use the gas content and color index as a first approach quantifying the quenching fraction in the studied clusters. In forthcoming papers we will use optical spectra and multi-band observations to complement the study of individual galaxies in particular those showing strong distortions in Hi and in optical.
This paper is organized as follows: Section 2 describes the clusters under study, the observations and the data reduction for the Hi and the optical imaging. In the same section we describe the catalogues of member objects used in this work, as well as the sample of the brightest spirals and the color-magnitude diagrams of the studied clusters. In Section 3 we give the main observational results: we provide the Hi parameters of all detected galaxies and their global distribution across the observed clusters. Tables containing these data and the corresponding Hi maps are given in the Appendix. In Sect. 4 we study the dynamical state of the three clusters by applying two independent methods tracing substructures. In Sect. 5 we calculate RPS profiles and we obtain radial velocity vs. cluster-centric distance plots in order to study the assembly history of the clusters. In Sect. 6 we compare the clusters with each other and we discuss the role played by the cluster environment in the evolution of infalling galaxies. We summarize our results and give our conclusions in Sec. 7. Throughout this paper we assume = 0.3, = 0.7, and km s-1Mpc-1.
| A85 | A496 | A2670 | |
| RA (2000) | 00 41 50 | 04 33 38 | 23 54 14 |
| Dec (2000) | -09 18 07 | -13 15 33 | -10 25 08 |
| / (Mpc) | 0.055/233 | 0.033/140 | 0.076/320 |
| (Mpc) | 245.4 | 144.9 | 344.1 |
| scale 10′(Mpc) | 0.69 | 0.41 | 0.95 |
| (km s-1) | 16,607 | 9,884 | 22,823 |
| (km s-1) | 1054 | 685 | 781 |
| R200 (Mpc) | 2.54 | 1.68 | 1.86 |
| M200 ( M⊙) | 12.6 | 3.49 | 5.07 |
| Morph (B-M) | I | I | I-II |
| Richness | 130 | 134 | 224 |
| () | 9.4 | 3.8 | 2.3 |
| LSS | SC (11) | isolated(*) | isolated |
| Notes: | |||
| - (comoving distance), (luminosity distance) and linear | |||
| scale for 10′ are estimated with km s-1Mpc-1. | |||
| -The central velocity (), the velocity dispersion () and were | |||
| taken from NED, HyperLeda and BAX, respectively. | |||
| -R200: computed following Finn et al. (2005). | |||
| -M200 was estimated following Barsanti et al. (2018). | |||
| -LSS (large scale structure): indicates that A85 is part of the | |||
| supercluster MSCC 039, consisting of 11 cluster members | |||
| (Chow-Martínez et al., 2014). | |||
| (*) We revisit the LSS of A496 in this work. | |||
2 The observations
2.1 The cluster sample
In this work we study the Abell clusters A85 ( 0.055), A496 ( 0.033), A2670 ( 0.076), which harbor different physical properties (see Table 1) and dispose of ancillary multifrequency data.
A85 is more massive and more luminous in X-rays than the other two systems. Despite its relaxed morphology it is known to be undergoing minor merging processes with a subcluster and groups seen in X-rays and in the optical (Durret et al., 1998; Durret, Lima Neto, & Forman, 2005; Bravo-Alfaro et al., 2009). More recently, this system has been confirmed to possess a centrally peaked profile in X-rays with a sloshing pattern (Ichinohe et al., 2015) and with some additional disturbed features (Laganá, Durret, & Lopes, 2019). The presence of jellyfish galaxies like JO201 has been associated with strong RPS in this cluster (Ramatsoku et al., 2020; Luber et al., 2022, and references therein).
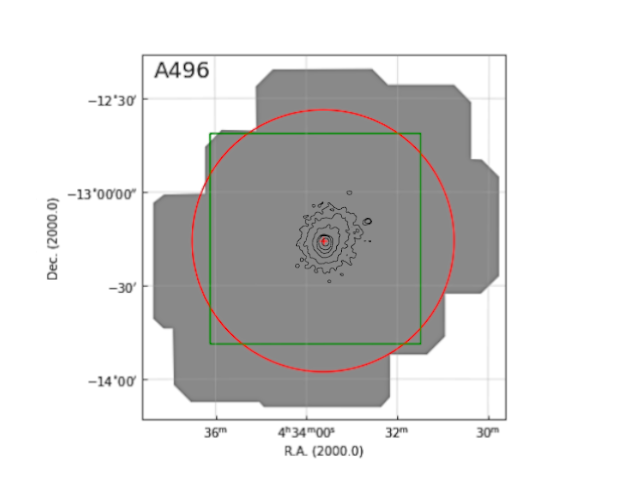
A496 is known to have a very relaxed morphology (Durret et al., 2000; Boué et al., 2008a; Ulmer et al., 2011) consistent with a significant coincidence between the BCG and the cluster centroid (position and velocity) (Lopes et al., 2018). Nevertheless, Laganá, Durret, & Lopes (2019) reported disturbed features superposed onto a centrally peaked X-ray distribution. Concerning the LSS, A496 was reported as an isolated system by Chow-Martínez et al. (2014). We revisit this result in Sect. 6.
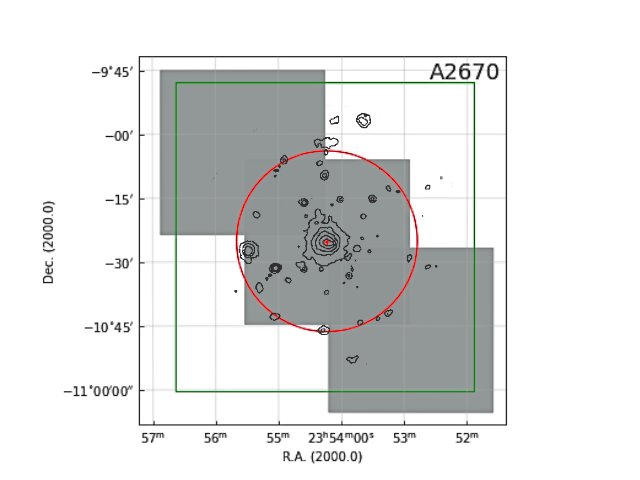
A2670 is the faintest of the three systems in X-rays, however its ICM is not negligible: RPS is blamed for strong sweep of material observed in a post-merger galaxy (Sheen et al., 2017). A2670 is the most irregular of the three systems and displays a very elongated morphology distributed along a NE-SW axis. This cluster is dynamically young, as suggested by the diffuse X-ray emission and the large offset in velocity of 333 km s-1 (C. Caretta, priv. comm.) between the cluster and the BCG; this clearly indicates that the massive galaxy has not yet settled at the bottom of the cluster potential well.
2.2 The Hi data
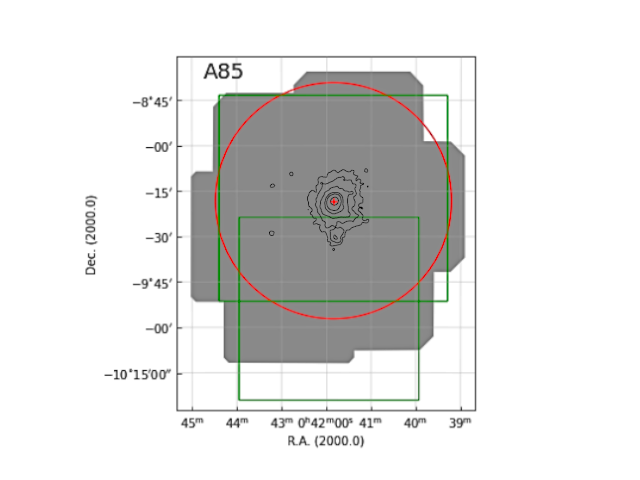
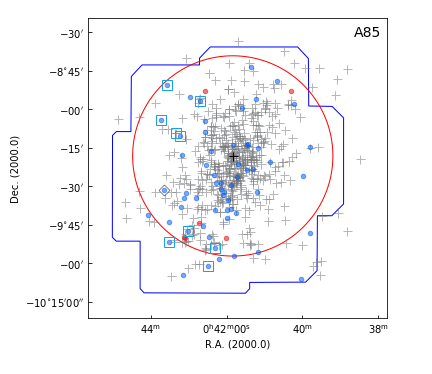
We take advantage of Hi-data obtained with the VLA111The National Radio Astronomy Observatory is a facility of the National Science Foundation operated under cooperative agreement by Associated Universities, Inc. between 1994 and 1996 for A2670, and from 2001 to 2003 for A85 and A496. All observations were taken in C configuration, producing beam sizes of 24′′ 17′′. Table 2 gives the main observing parameters: the total integration time, the VLA configuration, the beam size, the bandwidth and the correlator mode applied. The correlator mode defines the number of polarizations applied. The correlator mode 1 uses one polarization and allows a larger number of velocity channels; mode 2 applies two polarizations and is able to produce an improvement in sensitivity by a factor of . Hanning smoothing was used on the data of A85 and A496, obtaining a set of 31 independent channels. For A2670 no Hanning smoothing was applied, obtaining a set of 63 channels (cubes NE and SW). The general observing strategy is based on a combination of several observing pointings at different positions and central velocities. This allowed to cover the full cluster volume beyond one virial radius and more than three times the velocity dispersion. Fig. 1 shows the total observed fields for each cluster and Table 3 gives the parameters of the final Hi data cubes. Throughout this paper we list the Hi heliocentric velocities using the optical definition.
| ID | Tint | VLA | beam | Bandw | Correl. |
|---|---|---|---|---|---|
| (h) | config. | (′′) | MHz | mode | |
| (1) | (2) | (3) | (4) | (5) | (6) |
| A85 | 80 | C | 24 17 | 6.3 | 2AC |
| A496 | 12 | C | 25 17 | 6.3 | 2AC |
| A2670 | 90 | C | 23 16 | 12.5 | 1A, 1D |
| Column (2): The time on source, in hours. | |||||
| Column (3): The VLA configuration used. | |||||
| Column (4): The beam size in arcsec. | |||||
| Column (5): The applied bandwidth in MHz. | |||||
| Column (6): The correlator mode. | |||||
| Data | RA | Dec | FoV | Vel. range | rms | MHI limit | ||
| cube | (2000) | (2000) | (′) | km s-1 | km s-1 | km s-1 | mJy beam-1 | M⊙ |
| (1) | (2) | (3) | (4) | (5) | (6) | (7) | (8) | (9) |
| A85–LV | 00 41 51.9 | -09 18 17 | 90 | 1,366 | 15,266 | 45.5 | 0.25 | 9.0 |
| A85–MV | 00 41 51.9 | -09 18 17 | 90 | 1,330 | 16,500 | 46.9 | 0.25 | 9.2 |
| A85–HV | 00 41 51.9 | -09 18 17 | 90 | 1,387 | 17,744 | 46.2 | 0.25 | 9.1 |
| A496–LV | 04 33 04.1 | -13 06 19 | 100 | 1,314 | 9,285 | 43.8 | 0.24 | 3.0 |
| A496–HV | 04 33 04.1 | -13 06 19 | 100 | 1,324 | 10,429 | 44.2 | 0.24 | 3.0 |
| A2670–C | 23 54 13.8 | -10 25 09 | 40 | 4,120 | 23,037 | 47.9 | 0.11 | 7.9 |
| A2670–NE | 23 55 34.1 | -10 04 18 | 40 | 2,957 | 22,690 | 47.7 | 0.12 | 8.6 |
| A2670–SW | 23 52 53.4 | -10 46 00 | 40 | 2,957 | 22,690 | 47.7 | 0.12 | 8.6 |
| Column (1): Field ID, where LV, MV, HV indicates low, medium and high velocity ranges, respectively. | ||||||||
| Columns (2) and (3): Central coordinates for the data cube, after mosaicing for A85 and A496. | ||||||||
| Column (4): Approximate diameter of the FoV, in arcmin. | ||||||||
| Column (5): Total velocity coverage, in km s-1. | ||||||||
| Column (6); The heliocentric velocity of the central channel, using the optical definition. | ||||||||
| Column (7): Velocity resolution given by the channel width, in km s-1. | ||||||||
| Column (8): The rms per channel in mJy beam-1. | ||||||||
| Column (9): The Hi-mass detection limit, in units of M⊙. | ||||||||
We applied different observing strategies to each cluster depending on their redshifts and velocity dispersions. Six VLA fields were pointed side by side across A85. The individual fields have slight overlap in RA, Dec in order to avoid any gap in between. These fields have the same central velocity giving a homogeneous coverage across an area of 100′ side after a mosaicing procedure (Taylor, Carilli, & Perley, 1999). The same six fields were observed three times, each one centered at a different velocity: 15,266 km s-1, 16,500 km s-1, 17,744 km s-1 (see Table 3). The central velocities were chosen to slightly overlap producing a homogeneous coverage of some 3800 km s-1, i.e. more than 3.5 times the velocity dispersion of A85.
A similar procedure was applied to A496. Since it is located at two thirds the distance of A85 the total integration time for A496 was significantly reduced. On the other hand this cluster is spread across a larger region of the sky and we had to apply ten VLA pointings with different RA, Dec positions in order to reach the one virial radius coverage. These fields went through a mosaicing procedure delivering a field of view of some 100′. Having a low velocity dispersion (737 km s-1), the ten fields were observed two times, each one centered at a different velocity: 9,285 km s-1 and 10,429 km s-1. This delivered a coverage of 2400 km s-1, equivalent to more than 3.5 times the cluster velocity dispersion (Table 3).
A different observing strategy was applied to A2670. Located at a larger distance than the previous clusters, A2670 needed fewer VLA pointing fields to cover the virial radius. However, due to its distance, longer observing time was needed in order to reach a similar detection limit than the other clusters. The one virial radius coverage was ensured by pointing three VLA fields spread along a NE-SW axis and having some overlap in order to avoid any gaps. Due to observing time limitations, the covered area is elongated, giving priority to the NE-SW axis. Mosaicing was not applied in this cluster and the three data cubes were analyzed separately. The velocity coverage was ensured by applying a bandwidth of 12.5 MHz and correlator modes 1A for the central cube, and 1D for the NE and SW cubes. This strategy delivered a central data cube with a coverage of 4,000 km s-1 and nearly 3,000 km s-1 for the NE and SW cubes (Table 3).
Standard VLA calibration and imaging were carried out by using the NRAO Astronomical Image Processing System (AIPS). All final data cubes for A85 and A496 have 31 channels with velocity widths between 43.8 km s-1 and 46.9 km s-1. The central field A2670-C has 88 channels while 2670-NE and 2670-SW have 63 channels. All data cubes for this cluster have a channel width close to 48 km s-1. The imaging was made by applying ROBUST 1.0 (Briggs, 1995), which is the best compromise between uniform and natural weighting. This maximizes the sensitivity while keeping high spatial resolution, delivering a final beam size of about 24′′ 17′′ for the three clusters. The typical rms is 0.24 mJy beam-1 for A85 and A496, while 0.12 mJy beam-1 was reached for A2670 (see Table 3). This allowed to obtain Hi-mass detection limits of the same order of magnitude for the three systems.
The search for detections and the Hi analysis were carried out using AIPS. The moment maps were produced with the AIPS task MOMNT, applied with Gaussian (space coordinates) and Hanning smoothing (velocity) to maximize the signal-to-noise ratio. We produced Hi-maps and velocity fields using a cutoff level between 1.5 and 2.0 times the rms measured in the corresponding data cube. As expected, variations of noise were found at the edge of the data cubes, in RA, Dec and velocity. We normally discarded detections found within those zones.
2.3 CFHT MegaCam optical images
We obtained optical images with the 3.6m Canada France Hawaii Telescope and the MegaCam instrument, each field having a size of around deg2. The south tip and the infalling filament of A85 were observed in October 2004 (program 04BF02); we exploit here the band images, with surface magnitude limits of 26.7, 27.3, 26.4, 25.7 mag arcsec-2, respectively. Details can be found in Boué et al. (2008b). We later retrieved archive images, this time centered on A85 in the and bands. The corresponding depths are 26.3 and 26.1 mag arcsec-2. We assembled the individual images (five in each band) to obtain frames with total exposure times of 3960 s and 8380 s.
A496 was observed with the same telescope and instrument (November 2003, program 03BF12) obtaining band images. The total exposure time is 7853 s for each image and the depths are 27.4, 27.2, 26.2, 25.6 mag arcsec-2, respectively. Details on these data can be found in Boué et al. (2008a).
The data for A2670 were taken from the CFHT archive, with a total exposure time of 6160 s in the bands. The depths are 25.7, 26.8, 26.3, 24.2 mag arcsec-2, respectively.
2.4 The membership catalogues
We use the spectroscopic redshift compilation by H. Andernach (priv. comm.) to define the member sample of the three clusters. This compilation considers as potential members all galaxies with published radial velocities inside a projected Abell radius ( Mpc), and within a range of 2500 km s-1 from a preliminary estimation of the cluster velocity. Several observational limitations could prevent the redshift catalogues to be fully complete within the studied regions; nevertheless it remains the most reliable option with the data currently available in the literature. Taking this redshift sample, the membership catalogues are constructed by tracing caustic curves representing the escape velocity of the system in a projected phase-space diagram (see, Serra et al., 2011, and references therein for more details). The curves are constructed following Chow-Martínez (2019). All galaxies within the defined limits are taken as cluster members. The caustics applied here are intentionally relaxed (an enclosing fit) as the catalogues are intended to retain as many potential member galaxies as possible. The membership catalogues contain 616, 368, 308 objects in A85, A496, A2670, respectively. Due to its larger redshift A2670 is sampled through a larger linear radius. This bias will be taken into account when we compare the observed clusters with each other in Sect. 6.
2.5 Catalog of the brightest spiral galaxies
Hi blind surveys covering large cluster volumes allow to study the gas component of all the member galaxies contained within the observed data cubes. Even those spirals not detected in Hi are very important as they trace the distribution of Hi swept spirals throughout the studied cluster. With this in mind we built catalogues (RA, Dec, ) of the brightest spirals contained within the VLA data cubes. As a first step, magnitudes were obtained for all the member galaxies by applying SExtractor222https://www.astromatic.net/software/sextractor/ to the CFHT images referred above. A few zones observed by the VLA but not covered by the CFHT (Fig. 1) were similarly analyzed by using Pan-STARRS333https://panstarrs.stsci.edu/ frames (Flewelling et al., 2020).
The strategy to define the bright spiral catalog is as follows. We applied a limit in apparent magnitude of 19.0, 18.0, 19.5, for A85, A496, A2670, respectively. Considering the distance to each cluster, these values roughly correspond to the same absolute magnitude, Mg -18.0. In r-band this limit is close to M18.2. We convert these magnitudes to stellar mass following Mahajan et al. (2018), showing that our catalogues of bright spirals are complete in mass above a value of log. We did not apply a color-index threshold in order to include any possible red spiral. This method delivered bright objects whose morphology can be defined through visual inspection; this was done by using combined (RGB) optical images from CFHT and Pan-STARRS. All objects in the blue cloud (see next subsection) and having stellar mass above log were considered as candidates to be spiral. Our visual inspection confirmed spiral features for most of those objects. The remaining ones, before being included in the sample of bright spirals, should present a combination of features based on a disky shape, blue () color, stellar mass, Hi content, and the presence of dust lanes (for the near edge-on ones). As shown below, a few red spirals are reported in the three clusters. Their belonging to the bright spiral sample was conditioned by the following criteria: having a mass above log, being detected in Hi or, alternatively, showing spiral features through our visual inspection. This output was cross-matched with the list of member objects (Sect. 2.4) in order to ensure that these spirals are cluster members. The final catalogues of bright spirals consist of 65, 46, 61 member objects in A85, A496, A2670, respectively. Hereafter we denote these objects as B-Sp.
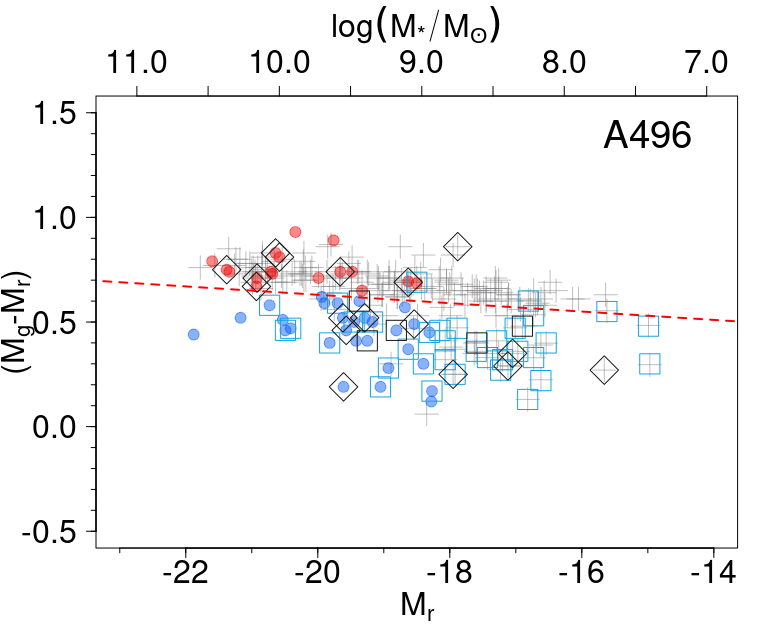
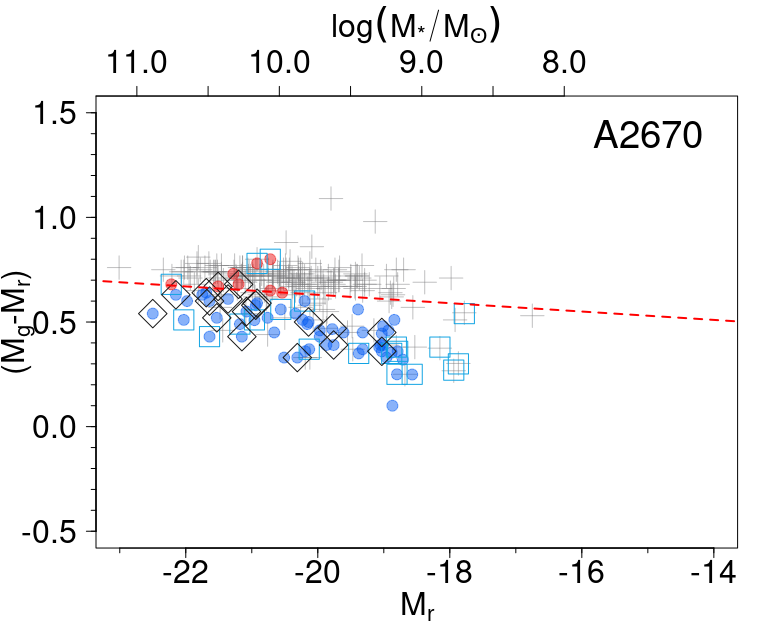
2.6 Color-magnitude diagrams: the galaxy populations
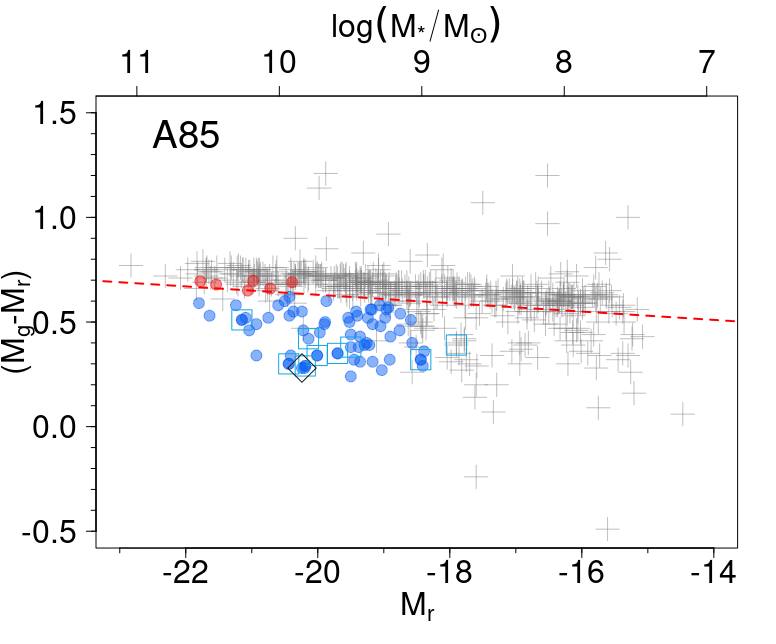
Tracing color-magnitude diagrams (CMD) in a cluster helps to visualize the distribution of different types of galaxies populating the system. Fig. 2 shows the CMD of the three clusters, giving the color index as a function of the absolute magnitude Mr (bottom axis) and stellar mass (upper axis). The red dotted line draws the border between the red sequence and the green valley; it is defined as: () = 0.63 0.02 (Mr + 20) (Masters et al., 2010).
Member galaxies in Fig. 2 are shown with grey crosses. The bright spirals defined in the previous section
are cluster members too; they are indicated with solid circles, either red or blue, indicating their position in the red sequence or in the blue cloud. Cluster members in the red sequence being brighter than M18.2 ( mass above log), and having no solid circle, correspond to early types.
Galaxies above the same mass limit and lying in the blue cloud are confirmed to be part of the B-Sp sample (see previous subsection). The Hi detections are shown with blue open squares (normal objects) or with black diamonds (Hi-abnormal objects, defined in the next section). A few Hi detections are not part of the compilation of member galaxies; either no redshift was available or they are outside the velocity window defined by the membership catalog of Sect. 2.4. We added these objects as new cluster members.
Galaxies located in the blue cloud of these clusters are good candidates to be in a pre-quenching stage. Optical colors are not the best indicators for current star-forming activity due to possible differences between the time scales for quenching and for the change in color due to the stop of star formation. Nevertheless, not having optical spectra for all the objects under study, we consider that a blue color combined with a normal gas content, constitute a reasonable indicator for galaxies in a pre-quenching phase. On the other side, objects above the red line of Fig. 2 are not expected to have any intense star formation activity, therefore red circles in this figure constitute very likely passive spirals. A K-correction was applied to the three clusters. The largest K-correction values in color-index are slightly above 0.1 mag. As expected, these values correspond to red objects in A2670 (we used the K-correction calculator from GAISh444http://kcor.sai.msu.ru). As this correction is associated with the galaxy distance, the y-axis of Fig. 2 shows the difference in absolute magnitudes after the K-correction was applied. Galactic extinction is negligible for these clusters and no correction was applied.
3 Results
3.1 The Hi detected galaxies
The catalogues of bright spirals (B-Sp) described above provide positions and velocities that were used to seek for their Hi-emission in the corresponding data cubes. Most of these B-Sp were effectively detected in Hi but, in all three clusters, significant fractions of these spirals were not detected. These objects constitute our sample of Hi non detected spirals. This sample is complete in mass above the limit log. The search for 21 cm emission was completed by a thorough visual inspection of the Hi data cubes. This was done blindly, disregarding all information on optical positions and redshifts of the spiral galaxies. Our search produced a list of emissions, most of them matching in position and velocity with a B-Sp. However, several candidate detections had no counterpart in the B-Sp catalog. A subsequent search upon the optical-RGB frames and redshift catalogues allowed the finding of the optical counterparts. As expected, these are blue, irregular galaxies, fainter than the limit defining the B-Sp sample.
Our strategy to search for Hi emitting galaxies includes a conservative detection threshold above 6 times the rms, delivering 10, 58, 38 Hi-detections in A85, A496, A2670, respectively. A few Hi objects are just marginally resolved by the VLA primary beam: two in A85, six in A496, eleven in A2670. All maps and velocity fields are available as online material. We used the Hi mass detection limits given in Table 3 to ensure that the sample of bright spirals (Sect. 2.5) is potentially detected with this survey. Obviously, more massive spirals have higher chances to be detected than less massive ones. Therefore, we inspect the performance of our survey detecting galaxies with different stellar masses. We displayed our Hi mass detection threshold onto a MHI vs M∗ plot (not shown in this work). We added the scaling relation obtained by Dénes et al. (2014) and we found that normal galaxies can be effectively detected down to log. The deeper data cubes in A496 pushed this limit down to log. This confirms that our full sample of B-Sp can be detected with the present survey under unperturbed conditions.
Tables 7, 8 and 9 give the main optical and Hi-parameters of the detected galaxies in A85, A496, A2670 respectively. The lists of non detected spirals are given in Tables 10, 11, 12 for the same clusters. Five Hi detections in A496 could not be properly measured as we did not recover their full emission; this is due to limited velocity coverage of the corresponding data cube. We consider these galaxies as Hi detections because the recovered emission has large S/N; they are indicated with black squares in Figs. 2 and 3.
In Tables 7, 8, 9, the first five columns give names, coordinates and morphological type; these data are taken from the literature (NED555https://ned.ipac.caltech.edu/ and HyperLEDA666http://leda.univ-lyon1.fr/). Column 6 and 7 give optical magnitudes and () colors obtained from CFHT and from Pan-STARRS images. In Column (8) we provide the stellar masses obtained from our Mr magnitudes. Columns (9) and (10) give the optical and Hi velocities, the latter in heliocentric frame. We consider the value of the central channel displaying emission as the Hi velocity. We give the Hi velocity width in Column (11) defined by the full range of channels containing emission; this constitutes a proxy for . The Hi mass (Column 12) in solar masses is calculated by using the equation:
| (1) |
where we use the corresponding comoving distance () for all the members of the same system. The uncertainty for MHI is systematically 10%, derived from the computed error on the total flux . The Hi-deficiency is estimated with the equation (Haynes & Giovanelli, 1984):
| (2) |
Given that only a reduced number of our galaxies
has reliable morphological types in the
literature, we computed the
parameter for the two cases proposed by
Haynes & Giovanelli (1984),
for early-spirals and for late-spirals.
These values can be taken as lower and upper limits
(Columns 13 and 14) of the deficiency parameter.
Column (15) gives the projected distance to the
cluster center, using the BCG position. In Column
(16) we provide a code indicating four different
kinds of disruptions observed in Hi; this helps
to define the sub-sample of Hi abnormal galaxies.
The codes given in this column are the following:
– N : galaxies with normal
Hi content and distribution.
– Def : indicates galaxies having lost more than
50% of their gas ( 0.25).
– Asy : denotes a resolved Hi asymmetry,
or a tail, unveiled by the Hi maps.
– Pos : indicates an offset 20 kpc
in position, between the Hi and optical centroids;
this limit roughly corresponds to the diameter of
a typical spiral and is equivalent to 19′′, 30′′,
14′′, for A85, A496, A2670 respectively.
– Vel : denotes a velocity offset between
the optical and Hi velocities; we use three times
the Hi channel width to define this offset
(135 km s-1).
Galaxies having at least one of the four criteria mentioned above are defined as Hi abnormal. We used this sub-sample of perturbed objects to carry out a search for a correlation between Hi-deficiency and Hi-asymmetry, finding no obvious trend. However this result based on gas deficient, yet Hi detected galaxies, must be taken with caution as these objects are caught at an early stripping phase. We have no information on the 2-D gas distribution of the even more stripped spirals, those not detected in Hi. Therefore a deficiency–asymmetry correlation, developing during later gas stripping stages, should not be discarded a priori.
| Sample | A85 | A496 | A2670 | |
|---|---|---|---|---|
| (1) | Members | 616 | 383 | 318 |
| (2) | Memb. VLA-FoV | 603 | 336 | 254 |
| (3) | Hi-det | 10 | 58 | 38 |
| (4) | B-Sp | 65 | 46 | 61 |
| (5) | B-Sp Hi-det | 9 | 29 | 33 |
| (6) | B-Sp Hi non-det | 56 | 17 | 28 |
| (7) | B-Sp in red seq | 6 | 17 | 8 |
| (8) | Hi-det in red seq | 0 | 11 | 5 |
| (9) | Hi-det abnormal | 1 | 17 | 18 |
| (10) | Hi-det low mass | 1 | 28 | 4 |
| (11) | Memb. virial-region | 140 | 203 | 108 |
| (12) | B-Sp virial-region | 23 | 20 | 17 |
| (13) | Hi-det virial-region | 1 | 24 | 12 |
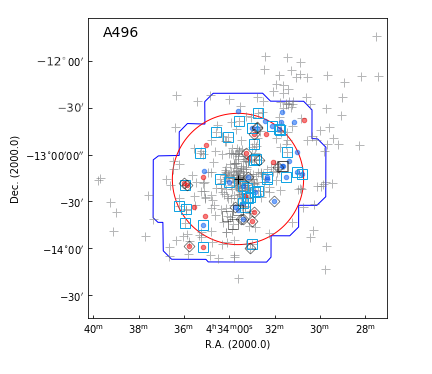
3.2 Global distribution of Hi across the studied clusters
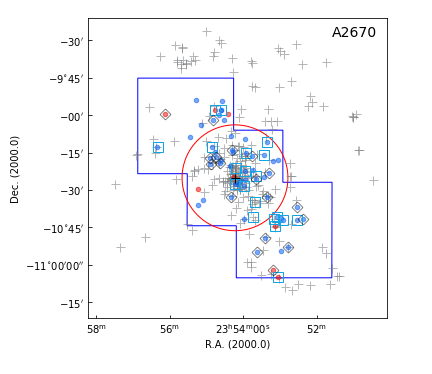
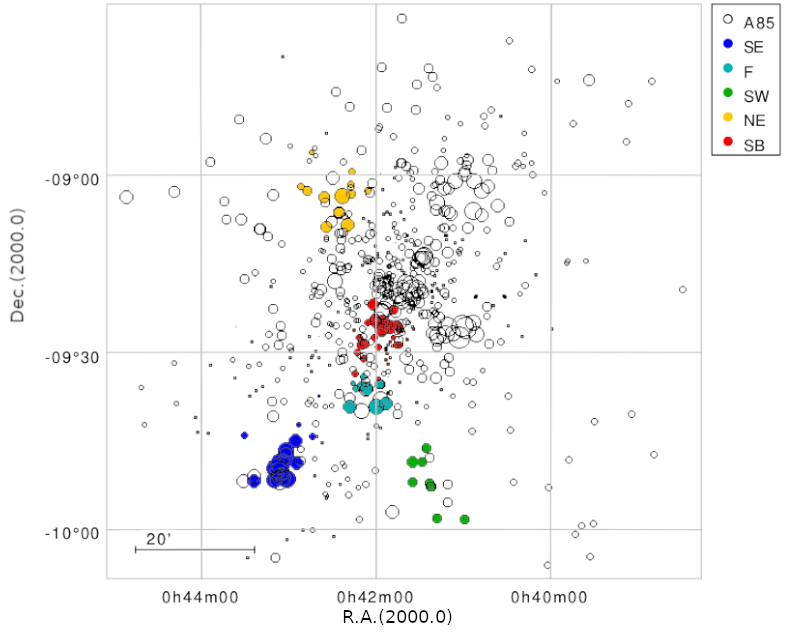
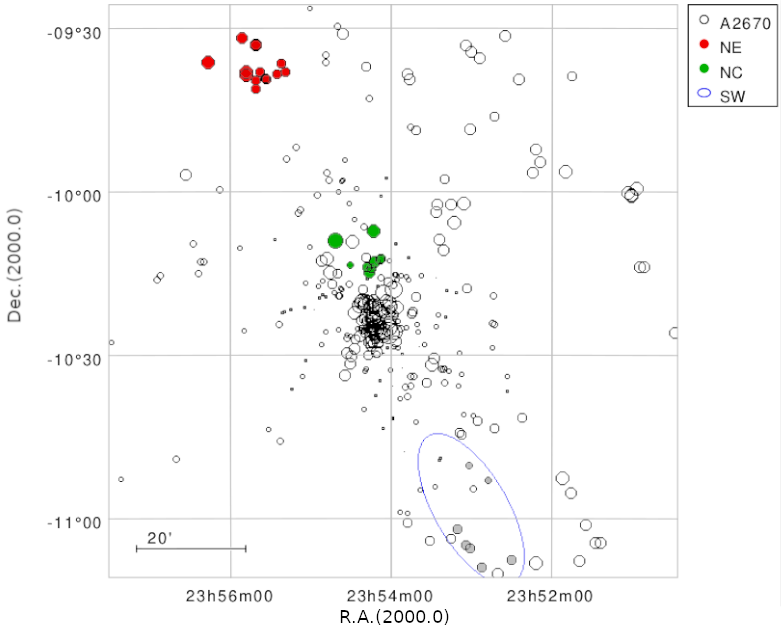
Some of our main results are displayed in Fig. 3, Fig. 4 and in Table 4. The (RA, Dec) distribution of member galaxies in the three studied clusters is shown in Fig. 3. We use the same symbols as in Fig. 2 in order to emphasize the position of the bright spirals (blue/red circles) and the Hi-detected galaxies (open blue squares/black diamonds). The total fields covered with the VLA are drawn with blue polygons and the corresponding R200 are indicated with red circles.
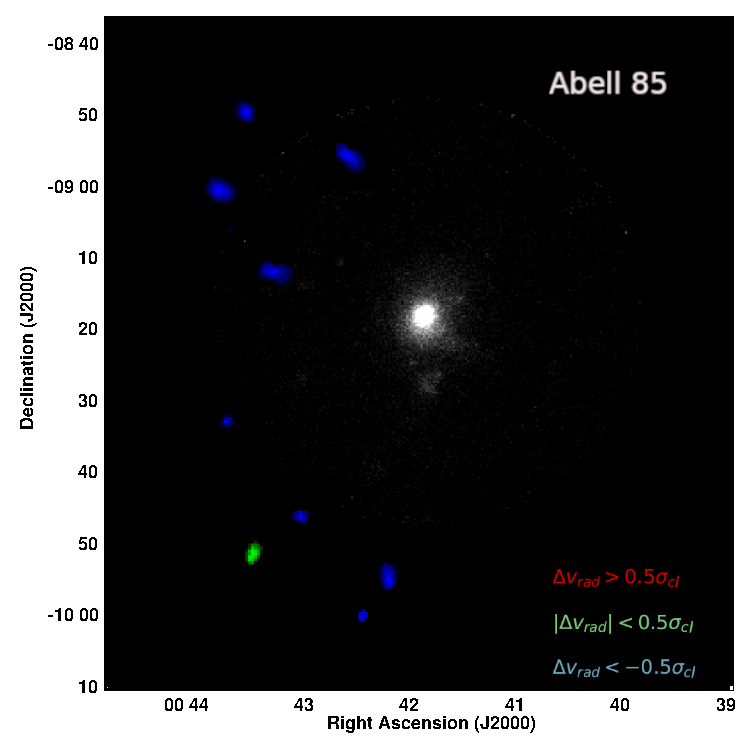
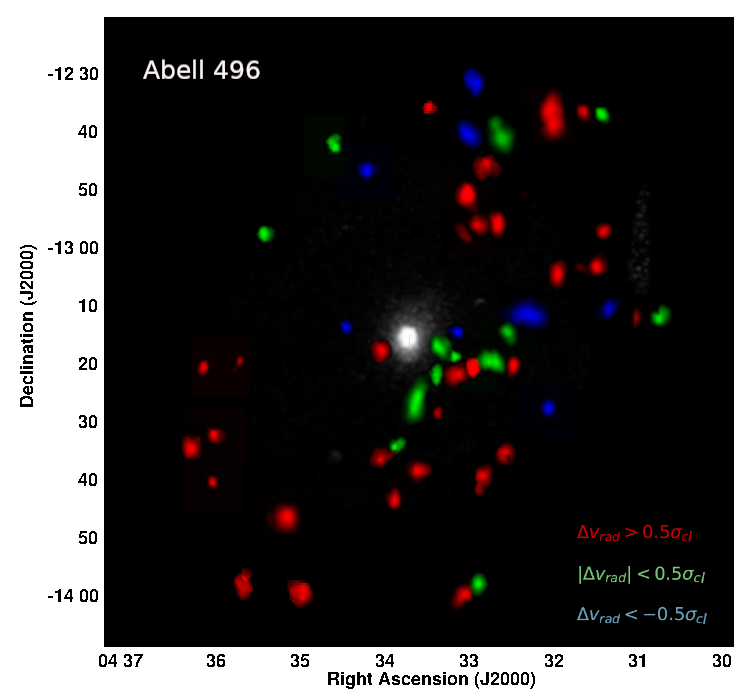
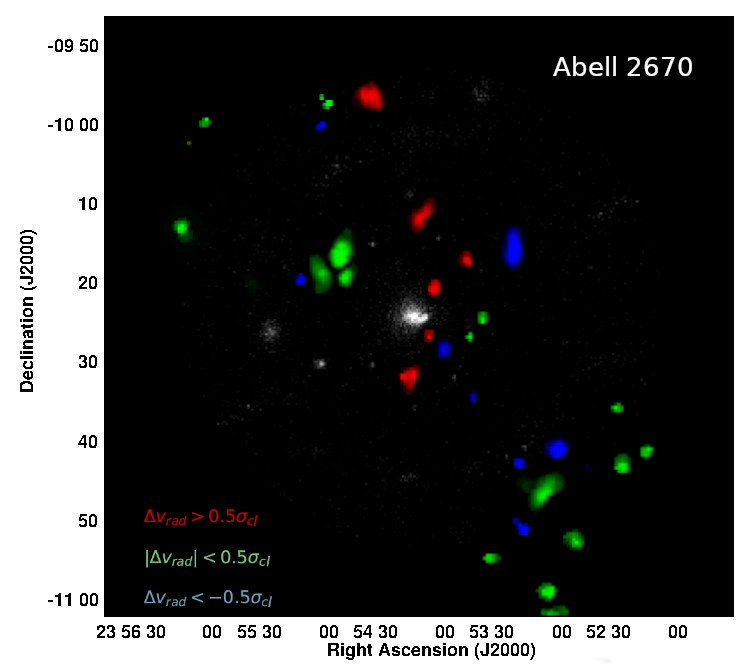
Fig. 4 shows the moment-zero Hi-maps of the detected galaxies in each cluster. Galaxies are set at their proper location and are magnified by a factor of five for clarity. We use a color code in order to separate these galaxies in three radial velocity regimes: lower, similar and larger than the cluster velocity. We give statistical significance to the velocity slots by applying the same criteria as Wang et al. (2021), given as a function of the velocity dispersion of the cluster () given in Table 1: blue color for , green for , and red for . The X-ray emission is shown in grey scale taking advantage of the homogeneous and large field map given by ROSAT.
Table 4 reports the total number of
objects having different observational properties
and lying in specific cluster regions.
Data are displayed as follows:
Row (1) gives the full number of cluster members,
including the new members derived from the Hi velocities. Row (2) provides the number of galaxies
within the VLA FoV.
Rows (3) and (4)
give the total number of Hi detections and bright
spirals. Rows (5), (6), (7), give the number of B-Sp
being Hi detected, the B-Sp non-detected and the
B-Sp lying in the red sequence, respectively. Rows (8),
(9), (10), give the number of galaxies detected in
Hi lying in the red sequence, the Hi abnormal, and
those below the limit log,
respectively. The last three rows, (11), (12), (13),
provide the number of galaxies projected within the
virial region (Sect. 5.2) being: cluster
members, bright spirals and Hi detections,
respectively. The data given in
Table 4 are not well suited for a
direct comparison of the clusters with each other
because of their different redshifts and VLA coverage.
We carry out a comparison under homogeneous conditions
in Sect. 6.
The Hi in Abell 85
Fig. 3 (upper panel) shows the distribution of 616 member galaxies in A85 where the solid circles indicate the 65 B-Sp. The blue open squares and one black diamond indicate the ten Hi detected objects. The cluster members (grey crosses) are rather homogeneously distributed across A85, while the B-Sp and the Hi-detected galaxies show a very asymmetric distributions across the cluster. The SE zone has more bright spirals than all the other quadrants taken together; all the Hi-detections are projected as well onto the SE-NE regions (Fig. 3 and Fig. 4). The gas rich galaxies are projected 1.53.0 Mpc away from the cluster center, while a remarkable absence of Hi detections at lower radius suggests the presence of a harsh environment. This fact is independently supported by the presence of strongly perturbed galaxies (Venkatapathy et al., 2017; Ramatsoku et al., 2020; Luber et al., 2022).
The sample of 65 B-Sp in A85 is unexpectedly high. A significant fraction of these objects are projected around the cluster core and in the transition zone between the center and the SE (Fig. 3). Six B-Sp are reaching the red sequence (red solid circles in Fig. 2) and none of them is detected in Hi, indicating that they have gone through an advanced stripping process. On the contrary, all the galaxies detected in Hi show very blue colors indicating that they have not gone through any stripping phase.
The asymmetry
in the distribution of Hi-detections is even more
striking in Fig. 4,
showing that all –but one– detections are in the
low velocity domain, with a narrow of
15,00015,200 km s-1 (see
Table 7). Their low velocity
dispersion and the large difference compared with
the systemic velocity of A85 ( 1,500 km s-1)
suggest that they could share a common origin.
The Hi in Abell 496
The middle panel of Fig. 3 shows the distribution of 383 member galaxies in A496, with 46 B-Sp and 58 galaxies detected in Hi (symbols are the same as in Fig. 2). A first remarkable difference of A496 when compared with A85 is given by the lower number of bright spirals (46 in A496, and 65 in A85) but a much larger number of Hi-detections (58 in A496 for only 10 in A85; see Table 4). Interestingly, 50% of the Hi detected galaxies in A496 correspond to gas-rich, low mass objects which are not part of the B-Sp sample, their stellar mass is below log. This fraction is partly explained by A496 being closer than the other studied clusters. However, we will show that some peculiarities remain after considering the observational bias due to the difference in redshift.
The distribution of Hi-detected objects in A496 (Fig. 3) is striking, with many Hi normal galaxies projected onto the central regions. The middle panel of Fig. 4 helps to solve the paradox: the objects with low velocity relative to the cluster (maps in green, in the velocity range ) could be dominated by a movement on the plane of the sky, with circular orbits still far from the densest ICM regions (Dressler, 1986). The sample of red maps projected close to the cluster core in Fig. 4 have large components of velocity along the line of sight. They must be at an early stage of infalling, accounting for their normal gas content.
Seventeen B-Sp in A496 are found in the red
sequence; eleven of them still retain enough gas
to be detected, some are classified as
Hi abnormal and are indicated with black
diamonds in Fig. 2 and
Fig. 3. This strongly
suggests that they are under an advanced process
of stripping. Most of the red spirals in A496 are
projected in the NW and SE quadrants; in
Sect. 6 we discuss a possible
relation between their gas properties and their
location within the cluster.
The Hi in Abell 2670
The bottom panel of Fig. 3 shows the distribution of 315 member galaxies in A2670, emphasising the position of 61 bright spirals and 38 Hi-detections (same symbols as previous figures). From the 61 B-Sp reported in this cluster, 28 are not detected in Hi, suggesting an active sweeping process. Fig. 2 shows 8 B-Sp in the red sequence, some of them retaining enough gas to be detected in Hi.
Fig. 3 unveils a complex distribution of the Hi detections in A2670 which are mostly projected onto the cluster core and to the SW. Most of the Hi non-detected bright spirals in A2670 (solid blue/red circles without square or diamond in Fig. 3), are located near the core and to the NE. Fig. 4 shows a trend of abundant Hi rich galaxies in the SW while the NE beyond 1 R200 is very poor in Hi. The center shows a balance between shrunk and extended Hi maps but we remind that strong projection effects might be present in this zone.
4 Cluster substructure analysis
In order to get a better understanding of the assembly history of the studied clusters we carried out a search for substructures based on two independent methods: the tests proposed by Dressler & Shectman (1988) and by Serna & Gerbal (1996). For the two tests we applied the compilation of member galaxies described in Sect. 2. In general we have found large coincidences with the two methods. The detected substructures are shown in Fig. 5 and they will be used, in combination with the positions of Hi abnormal galaxies, as a test for pre-processing (Sect. 6).
4.1 Substructures: the -test
We applied an improved version of the well known -test (Dressler & Shectman, 1988), which is based on the parameter-, defined by:
| (3) |
where and are the cluster global parameters, and and are the local parameters calculated for every galaxy relative to its nearest neighbours. In this work we assume = 10; modifying this parameter does not change significantly our results (Bravo-Alfaro et al., 2009).
The -test detects a substructure as a
concentration of galaxies showing high values of
the parameter-; this has proven to be a
reliable tracer of substructures. However, this
method loses some
accuracy in certain cases, for instance, when two
groups at different distances from the observer
are projected along the same LOS. In this case
the -test will produce one single
overestimation of the parameter-, detecting
only one structure. This is critical in the absence
of a dominating large structure, like in
bimodal/multimodal systems. In order to improve
this method we introduce
dividing surfaces on a 3D distribution of RA,
Dec and . This separates the sub-groups
of galaxies that share the same kinematic
properties within their particular caustics,
but somehow detached from the kinematics of the
whole cluster. That is, we do not take into
account only the parameter-, but also
the and the phase-space distribution
of galaxies that are candidates to be members
of the substructures (more details in Caretta
et al., 2022, in prep.). Values of the
parameter- are illustrated in
Fig. 5 by black circles;
these circles grow with
the probability of a galaxy to belong to a group.
Individual values of the parameter- will
be available upon request.
-test results in A85
We revisit the analysis of substructures of
A85 (Bravo-Alfaro et al., 2009) by
taking advantage that the number of redshifts
for member galaxies has grown significantly in
the last years (e.g., Boué et al., 2008b).
For the full sample of cluster members we
report a velocity dispersion of
km s-1.
We report the following
substructures.
- The main cluster body, with 532 galaxies, has a central
velocity = 16,650 km s-1, and km s-1.
- The South-East (SE) substructure, with 15 members, has
= 15,157 km s-1, and km s-1.
- The Filament group F, with 10 objects,
= 15,840 km s-1, and km s-1; this
and the SE substructures did not change significantly,
compared with previous works, as only few new
redshifts are provided for these regions.
- The Southern Blob (SB) is better defined than in
previous articles; it has 38 members,
= 16,947 km s-1, and km s-1.
- An interesting difference compared with previous
works is the C2 substructure
(see Fig. 4 of Bravo-Alfaro et al., 2009) which
has lost its signal because the dominant object,
the jellyfish galaxy KAZ-364 (also known as JO201),
lies slightly outside of the caustic contours. This
galaxy is outside the velocity range of our Hi cubes,
so it is not included in the present analysis. Despite
a velocity of 3,000 km s-1, relative to the cluster,
Bellhouse et al. (2017) reported this object as a fast,
infalling cluster member being part of a small group.
- We unveiled two new low-mass substructures
( 2% of the total number of member galaxies);
the first is at the South-West with 9 galaxies,
= 16,236 km s-1, and km s-1.
- Another new substructure lies
to the NE with 12 galaxies, having = 16,345 km s-1,
and km s-1.
-test results in A496
We detected a main cluster body with 330 galaxies and a
km s-1. We clearly unveiled one single
substructure located 1∘ (2.5 Mpc) NW
from the cluster center, with 38 members (above 10% of
the total mass), = 9,338 km s-1, and km s-1 (see Fig. 5). Our Hi survey
covers only a small portion of that group, delivering
only limited information on the cold gas associated
with this structure.
-test results in A2670
We obtained the following results for A2670:
- The main cluster body emerges with 287 members,
= 22,806 km s-1, and km s-1.
- We unveiled two low-mass structures, the first one
projected close to the center (NC, 10′ to
the north) with 7 members, = 22,883 km s-1,
and km s-1. This velocity suggests
a merger with the main cluster body.
- The NE group lies 50′ (4.5 Mpc), NE from the cluster center,
with 14 members, = 23,115 km s-1, and
km s-1 (Fig. 5).
This structure is just north from the VLA FoV
(Fig. 3) and we do not
dispose of Hi information for these galaxies.
4.2 Substructures: the Serna-Gerbal test
In parallel to the -test described above, we
applied the Serna-Gerbal (S-G) method
(Serna & Gerbal, 1996) to the three clusters.
This test introduces a fundamental,
independent element to detect substructures: the
relative potential energies of each pair of galaxies
by using individual galaxy brightness as a proxy
for the stellar mass. We use the -band magnitude for
this goal. In practice the S–G test requires
an input catalogue of positions, velocities, magnitudes
(converted to masses assuming a value of M/L), and a
defined number of galaxies needed to build a
group. We used as a representative value.
The S–G test works hierarchically,
seeking for lower level substructures within a
primary (more massive) detected group. This
delivers an output list of galaxies belonging to
each substructure and provides the mass of the
corresponding group. Absolute masses of individual
structures are not highly accurate, but the relative
masses of the groups, normalized to the total member
sample, are very reliable.
S-G results in A85
The S–G program computed for A85 a mass of M M⊙ for the entire cluster, and a velocity dispersion of km s-1. The S–G test detected the main cluster body (identified as #1) with 587 galaxies, a relative mass MMtot, and km s-1. A secondary group (#2) is detached from the main cluster body, lying south from the center and having 21 galaxies, MMtot, and km s-1. This structure is coincident with the SB group detected by the -test.
In the next step we took Structure #1 as the
starting point, and we unveiled two further
substructures; the first one (identified as
#1.1) has 144 galaxies with
MMtot, and
km s-1. Some galaxies from this
group account for the SE subcluster, detected
as well with the -test. The second
substructure (#1.2) has 14 galaxies, a relative
mass MMtot,
and km s-1. Finally, the group
#1.1 harbors two additional
substructures: the first (#1.1.1) has 74 galaxies
with MMtot,
and km s-1. This group coincides
in position with the minor SW structure obtained
with the -test. Another dozen galaxies from
the structure #1.1.1 emerges as a group lying between
the SB and the Filament, unveiling a more complex
region, south of the core, than what is shown by
the -test. A final subgroup (#1.1.2)
appears with 10 galaxies, a relative mass of
MMtot and
km s-1. This substructure matches
with the Filament group detected with the
-test. With the exception of the NE
group, the S–G test successfully confirmed
the substructures found with the -test
in A85.
S-G results in A496
We analyzed the full sample of member galaxies
but we found no major substructures in A496. Even
modifying the parameter n (for instance with
n=5) we did not find significantly
different results. The S–G method finds that A496 is a
relaxed cluster with negligible substructuring,
in agreement with previous studies
(e.g. Boué et al., 2008a).
S-G results in A2670
In the first step, the S–G test detected two groups in A2670. The largest structure (#1) has 123 galaxies with a comparable to that of the entire cluster, having MMtot. The second group (#2) has 10 galaxies, a mass MMtot, and km s-1. Group (#2) is placed 40′ SW from the cluster center and was not detected by the -test (see Fig. 5). Very interestingly, this substructure embraces the zone where several Hi rich galaxies are reported (see bottom panel of Fig. 4). These objects have similar physical properties (position, velocity, gas richness), giving further support for this group to be real.
In a second run, the large structure (#1) is
decomposed into two substructures
(#1.1 and #1.2) having 83 and 11
galaxies respectively. The former contains
MMtot,
and a velocity dispersion comparable to that of
the cluster. The group #1.2 contains
MMtot, and
km s-1.
The fact that the substructures #1 and #1.1
present high , comparable to that
of the whole cluster, reduces the statistical
significance for these groups, as shown by
Serna & Gerbal (1996).
However, part of substructure #1.1 extends
from the centre to the north, coinciding with
the NC group found with the -test.
The same occurs with substructure #1.2,
coinciding with the NE group, reinforcing
the existence of these two groups
(Fig. 5).
The two methods, the -test and the Serna-Gerbal, confirm the very complex substructure system of A85, contrasting with the very low level shown by A496. The two tests show A2670 as an intermediate case with a few, not very massive substructures.
5 Ram pressure and Phase-space diagrams
With the aim of studying the effects exerted by the ICM on the cold gas content of individual galaxies, we compute the ram-pressure stripping (RPS) profiles for the three studied clusters and compare with different values of the anchoring force (see the review by Boselli et al. (2022) for further details.) Next, we build and analyze the PPS diagrams for each cluster displaying the position of all member galaxies.
5.1 Ram pressure stripping in A85, A496, A2670
| A85 | A496 | A2670 | |
| (kpc) | 82 | 30 | 174 |
| (cm-3) | 0.0257 | 0.0407 | 0.00383 |
| 0.532 | 0.484 | 0.700 | |
| Notes: Parameters for A85 and A496 are | |||
| taken from Chen et al. (2007). We followed | |||
| Cirimele, Nesci, & Trèvese (1997) for A2670. | |||
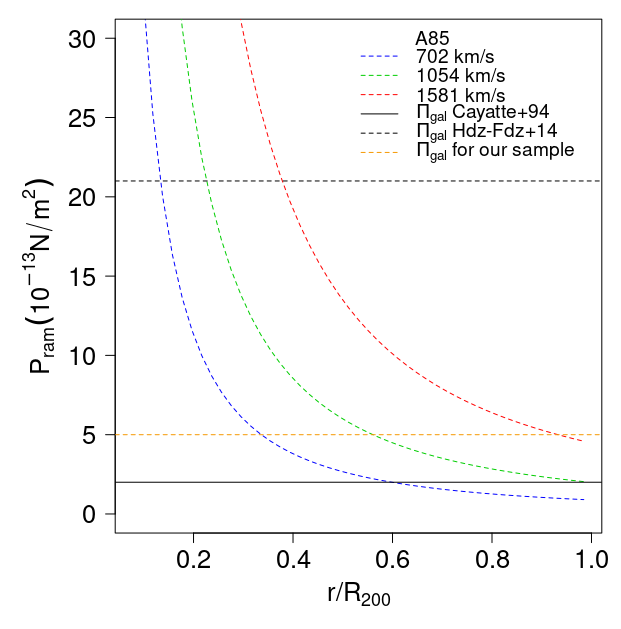
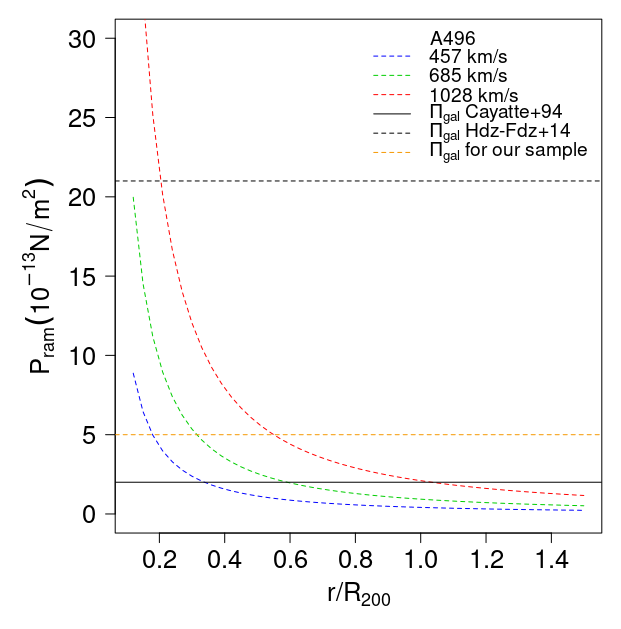
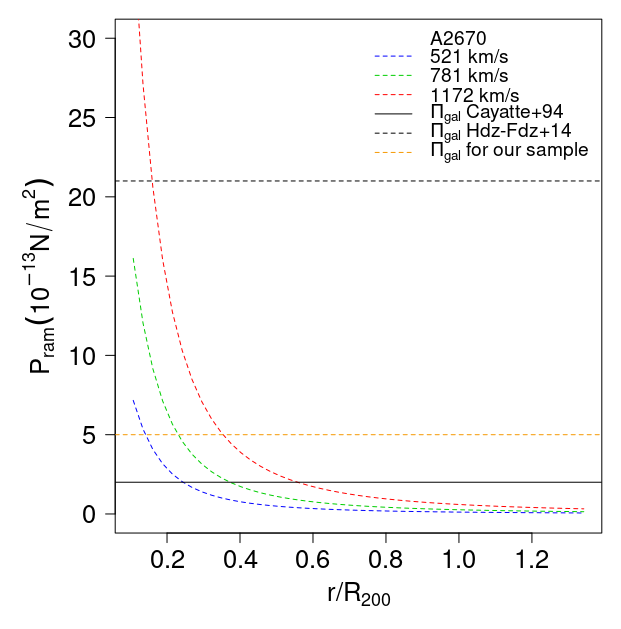
In order to estimate the RPS radial profiles we follow the theoretical definition proposed by Gunn & Gott (1972), . Here is the local density of the intracluster medium, and is the galaxy velocity relative to the ICM. We estimate the ICM density () as a function of the cluster radius by applying the hydrostatic-isothermal model of Cavaliere & Fusco-Femiano (1976), Table 5 gives the parameters of the -model for the studied clusters: the core radius , the central density and the value used to calculate the density as a function of the cluster radius. The corresponding RPS profiles are shown in Figure 6 where we display three representative velocities which are multiple values of the velocity dispersion of each cluster: 0.66 in blue, 1.0 in green, and 1.5 in red. This adds physical meaning to the comparison of the RPS intensity among different clusters.
In order to quantify the effects produced by the RPS on individual objects it must be compared with the anchoring force per unit surface produced by the galaxy gravitational potential, given by . Here, and are the surface densities of the stellar and gaseous discs, respectively. RPS must overcome the anchoring force in order to succeed the gas stripping. Several values of have been proposed, going from 2.010-13 N m-2 for spirals in Virgo (Cayatte et al., 1994), to 2.110-12 N m-2 for a Milky Way-like galaxy (Hernández-Fernández et al., 2014). One step further was made by Jaffé et al. (2018) who modelled the anchoring force as a function of the galaxy radius, the stellar mass and the gas fraction of a sample of spirals. We follow these authors in order to seek for values of being representative for our sample of B-Sp.
From Fig. 2 we see that most of the B-Sp are in the range of mass between log and log. No significant difference in mass is expected between our sample and that studied by Jaffé et al. (2018), so we use their Figure 5 (and Fig. 4 in Jaffé et al., 2019), which provide the anchoring force at a radius of twice the disc scale length. As we are interested in the RPS effects exerted at the external edge of spirals, we take this value as a proxy for the anchoring force acting at the outskirts of the galaxy. This strategy delivers in the range from 10-12 to 10-13 N m-2. We take the middle value 5.010-13 N m-2 as a reference for our sample of B-Sp. As a comparison, the value reported by Cayatte et al. (1994) predicts very strong RPS effects, even in the low velocity and at large cluster-centric domains (see Fig. 6). The opposite is given by the value of proposed by Hernández-Fernández et al. (2014). We indicate the three values of in Figure 6. It is clear that the reference value 5.010-13 N m-2 is more realistic for the bright spirals under study so we use it along the forthcoming analysis.
Some uncertainties are introduced though. Particularly important is the dispersion in the relation between the anchoring force and the stellar mass, with a strong dependence on the galaxy radius. In this respect Jaffé et al. (2018) have shown that the anchoring force is strongly dependent on the degree of mass concentration; this implies that low mass objects with a high central density could have a similar at their center than a more massive/extended galaxy at its edge. Despite these uncertainties we will show (Sect. 6) that our reference value of match reasonably well with our observations on a statistical basis.
We repeat this analysis for the low-mass galaxies, those in the range of stellar mass log between 8.0–9.0, obtaining an upper limit for the anchoring force of 10-13 N m-2. Galaxies in this low regime of are predicted to be easily stripped of their cold gas when they approach the virial radius. We further discuss about these objects in Sect. 6.
5.2 Phase-space diagrams and cluster accretion history
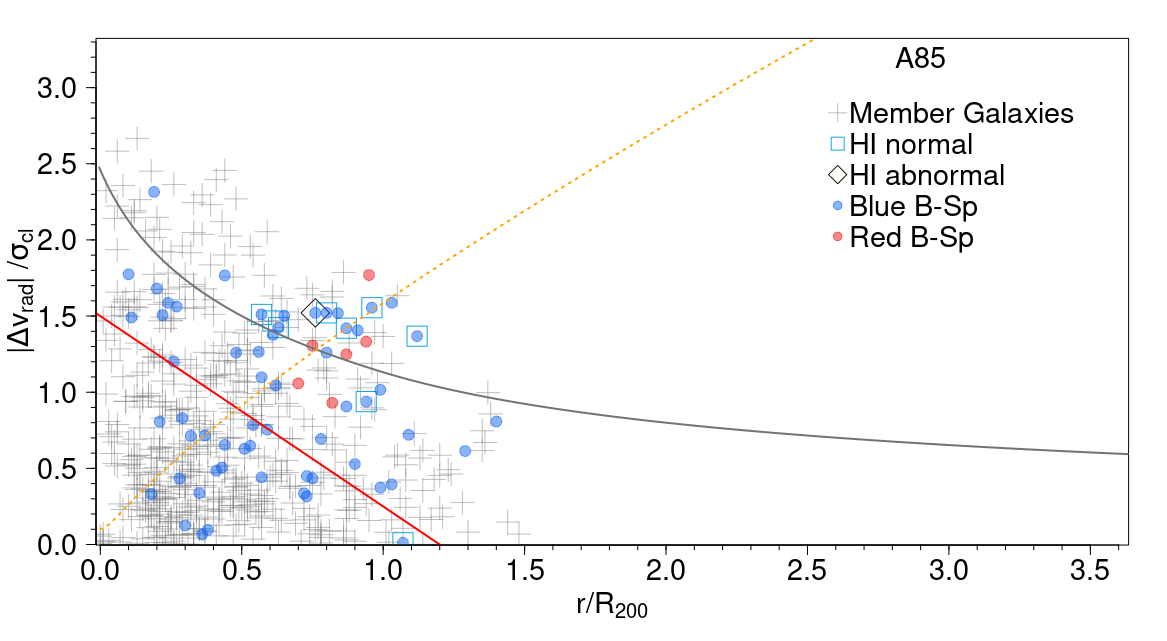
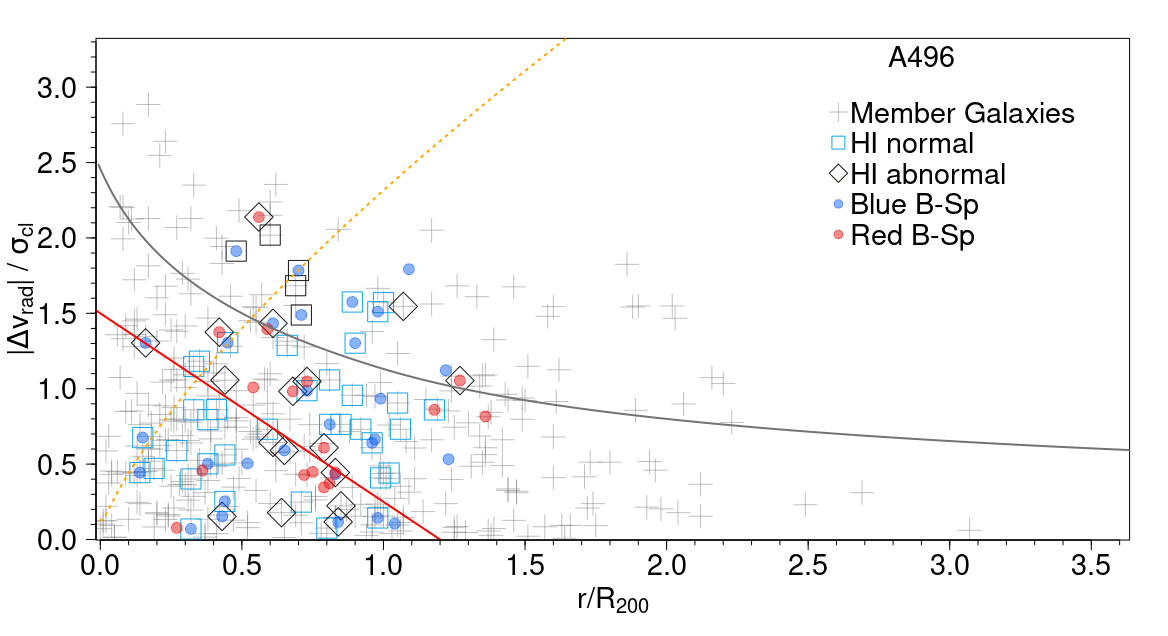
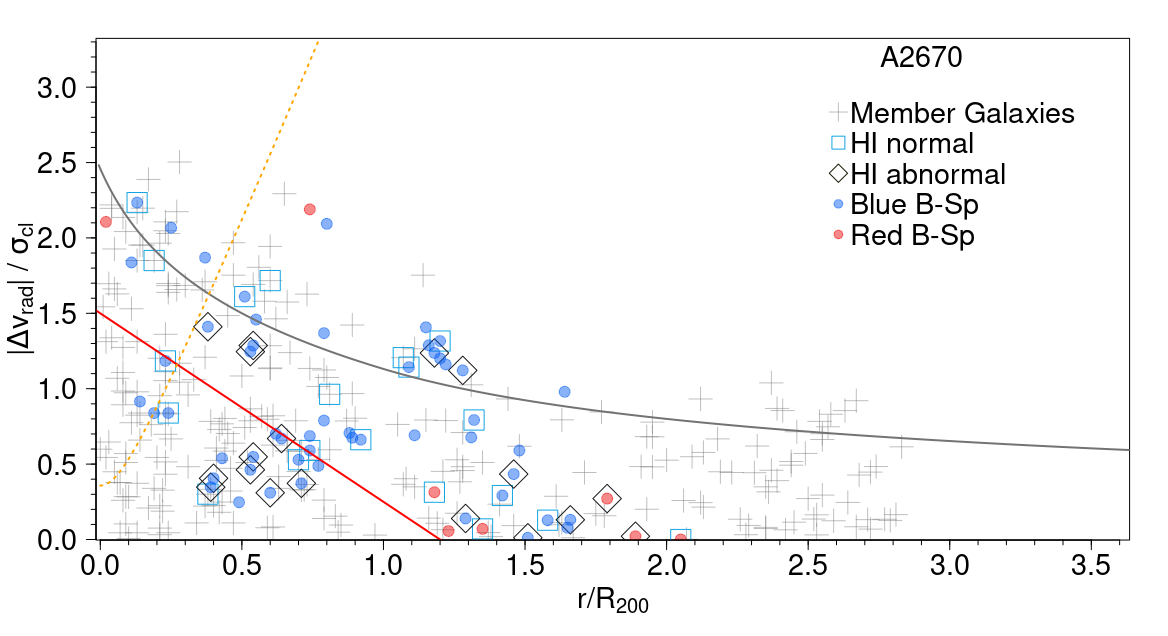
The projected phase-space (PPS) diagram of a cluster helps to distinguish virialized from infalling galaxies (e.g. Kent & Gunn, 1982; Geller et al., 2013; Oman, Hudson, & Behroozi, 2013; Jaffé et al., 2015; Rhee et al., 2017; Cortese, Catinella, & Smith, 2021). We present a version of PPS where the parameters v and the radius are normalized by the velocity dispersion , and by R200, respectively. On the y-axis we display the absolute value of the peculiar velocity (). On the x-axis the projected position relative to the cluster center is normalized by R200.
Fig. 7 shows the PPS diagrams for A85, A496 and A2670 with the same symbols as in previous figures. The escape velocity of each cluster is shown with a solid grey line; these are more conservative than the caustics used to define the member sample and helps to obtain a better contrast between virialized and infalling galaxies (e.g. Jaffé et al., 2015; Wang et al., 2021). This escape velocity was estimated on the basis of a NFW halo with a concentration of ; other values of this parameter do not change the escape velocity significantly. The orange dotted line draws the boundary where RPS equals the anchoring force, 5.010-13 N m-2.
At the lower left corner of the PPS diagram we find the galaxies projected at short cluster-centric distances and having low (radial) velocities relative to the cluster. These objects are likely settled onto the cluster potential after completing –at least– one pericentric passage. This part of the diagram is identified as the virialized zone and we define its boundaries as follows. On the x-axis, we followed authors (e.g. Jaffé et al., 2015; Kopylova & Kopylov, 2018) who propose that the virial radius lies in the range 1.2–1.4 R200. On the y-axis the criteria to define the virial zone is based on statistics, by considering a Gaussian distribution of velocities. We use the value of 1.5 as a more restrictive limit (compared with 3 ) in order to avoid contamination by foreground/background galaxies. Considering these boundaries we define the virialized zone as the triangle limited by the solid red line in Fig. 7. This triangle zone is more conservative than the corresponding squared region and has been applied by authors like Jaffé et al. (2015) and Wang et al. (2021). On the opposite corner of the PPS diagrams, galaxies infalling for the first time lie in the large radii/velocity domain. After a few yrs, equivalent to the crossing time for a typical cluster, infalling galaxies will lose kinetic energy due to dynamical friction and violent relaxation, and they will settle deep into the cluster gravitational potential.
The distribution of different types of galaxies in the PPS diagrams offer important hints on the dynamical stage of the three clusters. The top panel of Fig. 7 shows A85 behaving as a typical evolved system with a high concentration of member galaxies within the virialized zone. The escape velocity curve in this plot is lower than the one reported by Bellhouse et al. (2017); this is due to the higher mass used for A85 by these authors We see a clear trend where, with one single exception, all B-Sp lying below the escape velocity curve are not detected in Hi, suggesting that these galaxies had gone through an advanced process of gas stripping. The gas rich objects in A85 lie in the high radius, high velocity domain, indicating that they approach the cluster for the first time. Despite some similarities between A85 and other systems like A693 ( mass, morphology and dynamical stage), their distribution of galaxies across their PPS differs significantly (Jaffé et al., 2015).
Similar to A85, A496 harbors a crowded virialized zone (medium panel of Fig. 7). This is in agreement with the advanced level of relaxation reported by different authors and with the low degree of substructuring in A496 reported in this work (Sect. 4). The striking number of Hi rich galaxies lying within the virialized zone can be explained by projection effects as described in Sect. 3.2. The PPS diagram of A496 shows a slight trend of Hi abnormal galaxies (black diamonds) and red spirals (red solid circles) being more abundant towards the virialized zone.
A2670 is dynamically young accounting for
the complex distribution of galaxies in the
PPS diagram and a virialized zone significantly
less concentrated than in the other two systems.
In this respect A2670 looks like other young
clusters like Hydra (Wang et al., 2021).
A number of Hi detections is projected onto
the virialized zone, certainly explained by
projection effects.
Other Hi galaxies are located in
the high radius (/R200) domain,
matching with the substructure reported onto
the SW in Sect. 4.
Several of these detections correspond to
abnormal Hi galaxies (black diamonds) and
to red spirals which are good candidates to
be under pre-processing.
6 Discussion
6.1 The Hi and the effects of environment
The results described so far provide undeniable evidence on the important role played by environment in the transformation of spirals in the three studied clusters. The global cluster Hi deficiency is an important parameter that correlates with the properties of galaxies in most of the nearby clusters. In this work we approach the cluster deficiency as the ratio of high Hi deficient B-Sp (i.e. those not detected in Hi) normalized by the total number of B-Sp found within each system. Cluster deficiencies calculated in this way are: 0.86, 0.37, 0.46, for A85, A496, A2670, respectively. A85 appears as an extreme case of Hi deficiency and, since it is the most massive of the three studied systems, this result matches the model prediction of more massive halos producing larger gas loss (e.g. Donnari et al., 2021).
Next we discuss our results in the frame of four milestone results and predictions on galaxy evolution in clusters which are based on observations and on theoretical models: (1) The dependency of individual galaxy properties (like gas content and SF quenching) on the cluster-centric distance. (2) The commonly accepted role played by RPS in galaxy transformation, at least in the inner cluster regions. (3) The pre-processing of galaxies at large cluster-centric radii is thought to be responsible for the transformation of large fractions of galaxies. (4) Models of galaxy evolution predict the transformation (quenching and gas sweeping) of large fractions of satellite galaxies previous to their infalling (we refer to the following works and references therein, Peng et al., 2010; Rhee et al., 2017; Jung et al., 2018; Roberts et al., 2019; Cortese, Catinella, & Smith, 2021; Donnari et al., 2021; Healy et al., 2021; Boselli et al., 2022).
We explore how the three studied clusters fit within these predictions taking into account the results described in the previous sections. With this aim we use our sample of B-Sp as test particles for environment effects. As a first approach we consider that a normal Hi content plus a blue color constitute an indicator of a non-quenched galaxy. As mentioned previously, optical colours are not the most accurate tracers for quenching but they are often used as an alternative, distinguishing active from non-active galaxies, for instance in statistical studies as the present one. In the following discussion we take our sample of B-Sp as analogues of the satellite galaxies defined in cosmological simulations. We observe that none of the B-Sp dominates any of the groups reported in Sect. 4, giving support to this approach. Current models (e.g. Xie et al., 2020) predict that evolution of low mass galaxies, those having log 10.3 (matching the range of our B-Sp) is dominated by environmental effects. Above this threshold AGN feedback is expected to drive the galaxy quenching.
6.2 Global properties of the studied clusters
Here we compare some physical properties of
the studied clusters with each other. In order
to avoid part of the observational bias we focus
on the inner regions, more specifically on
the largest physical radius being observed
with the VLA in the three systems.
Based on this criteria we take the conservative
value of 1 R200 as comparison radius.
Obviously, some bias remain due to different
cluster distances which has an effect on the
population of Hi detected galaxies. For
instance, typical Hi masses reported in
A85 and A2670 approach 8 109
M⊙, while in A496 this value is
2 109 M⊙. As a
consequence, in this last cluster we report
more Hi galaxies in the low mass regime
(Sect. 3). Nonetheless, some
peculiarities described below remain even
after considering this observational bias.
Table 6 resumes the data
corresponding to 1 R200 for the three
clusters.
A85: This stands out as a very Hi deficient system. The Hi detections represent a fraction of 0.016 of the member galaxies within 1 R200 (Table 6). The majority of the B-Sp not detected in Hi (Fig. 7) gather towards the virial zone of the PPS diagram. This cluster shows the expected cluster-centric distribution of gas-rich/gas-poor spirals. The strongest ICM effects in A85, compared with A496 and A2670, are supported by two results given in Table 6 within 1 R200: (a) the low fraction of Hi detected galaxies relative to the member objects (0.01, 0.19, 0.11, in A85, A496, A2670 respectively); and (b) the fraction of B-Sp not detected in Hi, relative to the B-Sp reported within the same region (0.88, 0.31, 0.51, in A85, A496, A2670 respectively). These numbers do not correlate with redshift so we discard any observational bias as responsible for this result.
These effects are well explained by RPS. We showed (Sect. 5.1) that this mechanism might exceed the anchoring force up to a radius close to 0.6 /R200 for typical () velocities, and up to 0.9 /R200 for faster infallers (; see Fig. 6). As a matter of fact, the central regions of A85 could be an extreme case even compared with Coma, where a number of gas deficient spirals are still detected within 1 Mpc, with similar Hi mass limit detection than the present work (Bravo-Alfaro et al., 2000; Healy et al., 2021; Molnár et al., 2022). In A85 the only Hi projected close to the center is the high-speed infalling jellyfish JO201, which shows signs of strong ram pressure stripping (Ramatsoku et al., 2020; Luber et al., 2022).
In parallel to RPS, we inspect the role played by pre-processing and by the shocked interface between A85 and the SE-group, in the transformation of infalling spirals. A large majority of the B-Sp which are not detected in Hi are located in the SE quadrant, where the shocked interface is found. The complexity of this region is consistent with the presence of two groups (the South Blob and the Filament groups) in addition to the SE subcluster itself (Fig. 5). Another jellyfish galaxy (JO200) is located in this zone being so deeply stripped that it was not detected in Hi down to a mass limit of 9 M⊙ (A85[DFL98]286 in Table 10). Venkatapathy et al. (2017) already proposed this galaxy to be in a more advanced stage of transformation than JO201.
A remaining number of Hi non-detected B-Sp galaxies lies in the NW quadrant of A85 (Fig. 3). These objects are seen slightly beyond the escape velocity curve of the PPS of Fig. 7. No substructures are reported in that zone; therefore we favor the backsplash hypothesis (Gill, Knebe, & Gibson, 2005; Hirschmann et al., 2014). This suggests that these galaxies had entered A85 from the SE and now we see them projected to the NW. Timescales for RPS quenching (1 Gyr) and for cluster crossing (3 Gyr) are in good agreement. Considering that morphology transformation, disregarding the responsible mechanism, takes longer timescales (10 Gyr), backsplash is a plausible explanation for the spiral morphology and their location within the cluster (Boselli & Gavazzi, 2006, 2014; Cortese, Catinella, & Smith, 2021).
As a first approach to quantify pre-processing in A85 we obtained the number of Hi perturbed galaxies, and those non-detected, within each of the groups reported in Sect. 4. We obtained the following numbers: SB:3, Filament: 4, SE: 4, SW: 0, NE: 1. This suggests that pre-processing could be at work within the groups located SE of A85. However it is difficult to separate pre-processing from the effects of the interface shocking region. The later covers very well the zone where the B-Sp not detected in Hi are found.
The sample of blue, Hi normal galaxies in A85 projected between 1.5 Mpc and 3.0 Mpc east of the cluster center raises some unanswered questions. They are confirmed as cluster members and, being in the stellar mass range log between 9.0 and 10.0, these objects are predicted to have high probability to be quenched before their complete infall onto a massive cluster like A85 (e.g. Bahé et al., 2019). For instance, Xie et al. (2020) estimates that 60% of galaxies would be quenched in the mass range given above and halos (clusters) with masses above log 14.0, which is the case for this cluster.
In any case the gas rich galaxies in A85 seem
to be part of a continuous flow of newcomers
occurring during several Gyr. This scenario
is supported by the fact that A85 is part of
the supercluster MSCC-039 which includes eleven
systems (Chow-Martínez et al., 2014). The large scale
structure joining A85 with its neighbors, in
particular A117A, projected at 12 Mpc
SE of A85 (C. Caretta 2021, priv. comm.), could
be responsible for the feeding of fresh
Hi galaxies and with the presence
of the SE subcluster.
A496: This cluster constitutes a puzzle not only compared with the two other systems under study but also relative to the low-z clusters previously imaged in Hi. On one hand A496 is confirmed as a relaxed system and, in agreement with this, it is very concentrated. The PPS of Fig. 7 shows that more than 50% of member galaxies lie within the virialized zone. However, A496 presents some features in apparent contradiction with an evolved system. First, the high number of Hi detections (58) constitutes 17% of the member galaxies within the VLA FoV (this is below 2% in A85; see Table 4). Even if we compensate for A496 being closer than the other two systems the trend clearly persists. Another paradox is the absence of the expected cluster-centric distribution of Hi galaxies. This is observed in clusters like Coma and A85, comparable to A496 in dynamical stage. Figs. 3 and 4 clearly show the lack of correlation. As mentioned before, particularly strong projection effects should explain the Hi-rich galaxies projected onto the cluster core. This scenario fits with active ram-pressure stripping in this cluster. Our estimations predict that RPS surpass the anchoring force at 0.4 /R200 for typical velocities, and up to 0.6 /R200 for velocities of (Fig. 6). This implies that Hi normal spirals are hardly expected near the cluster core.
Taking the full sample of B-Sp as test particles for environment effects we find that 37% of them have lost a large fraction of gas and were not detected in Hi (Table 4). Furthermore, among the Hi detected B-Sp a number of them are reported as abnormal (Table 8). If we consider the color index, one third of the B-Sp in A496 are located in the red sequence. All these results clearly indicate an important degree of spiral transformation in this cluster.
Another intriguing result in A496 is the large number of Hi detected galaxies with masses below log=9.0, some of them having Hi mass 3109 M⊙ (see Table 8). In similar clusters, like Hydra, the average Hi mass for the same range of stellar mass is significantly lower, below 109 M⊙ (Wang et al., 2021). Even considering the closer distance of A496 (the nearer the cluster, larger the fraction of low-mass Hi detected objects) we expected similar galaxies to be found in A85 and A2670. Taking into account our Hi detection limits and by scaling the corresponding Hi flux to the distance of A85 and A2670, our survey would be capable to detect such gas-rich galaxies with stellar masses around log=8.5. However these objects are absent, more conspicuously in A85.
The low-mass, gas-rich and very blue galaxies in A496, are very likely in a pre-quenching phase. These objects deserve a more detailed study; current models predict strong pre-processing and a significant quenching fraction, going up to 80% for log 9.0, at (Donnari et al., 2021). In a forthcoming paper we will try to determine, statistically, how close to a massive halo these low-mass galaxies last before extinguishing. This could help to restrict theoretical models.
Beside the projection effects, the full distribution of Hi galaxies in A496 (Fig. 3) deserves a closer look. The NE quadrant is almost empty of Hi objects. In the south and south-east regions, all the Hi detections belong to the high velocity domain (red maps in Fig. 4), suggesting a common origin. Finally the north-west is the richest zone of both, Hi detections and member galaxies. This could be associated with the only substructure found in this cluster (Sect. 4). Concerning pre-processing, the very low degree of substructures suggest that this mechanism is not playing a major role transforming infalling galaxies in A496. Instead, the cluster environment seems to dominate the processing of spirals.
| A85 | A496 | A2670 | |||||
| Galaxies | Normalized by: | # | (fract.) | # | (fract.) | # | (fract.) |
| (1) | (2) | (3) | (4) | (5) | (6) | (7) | (8) |
| Members | 574 | 271 | 195 | ||||
| Hi-det | Members | 8 | 0.01 | 52 | 0.19 | 21 | 0.11 |
| B-Sp | Members | 58 | 0.10 | 39 | 0.14 | 35 | 0.18 |
| B-Sp Hi-det | B-Sp | 7 | 0.12 | 27 | 0.69 | 17 | 0.49 |
| B-Sp Hi non-det | B-Sp | 51 | 0.88 | 12 | 0.31 | 18 | 0.51 |
| B-Sp in red seq | B-Sp | 6 | 0.10 | 14 | 0.36 | 2 | 0.06 |
| Hi-det in red seq | Hi-det | 0 | 0.00 | 7 | 0.13 | 0 | 0.00 |
| Hi-det abnormal | Hi-det | 1 | 0.13 | 15 | 0.29 | 10 | 0.48 |
| Low mass Hi-det | Hi-det | 1 | 0.13 | 21 | 0.40 | 3 | 0.14 |
| Notes: | |||||||
| – All objects mentioned in Columns 1 and 2 are restricted to 1 R200. | |||||||
| – The numbers of galaxies mentioned in Column 1 are given in columns 3 (A85), 5 (A496), 7 (A2670). | |||||||
| – Column 2 indicates the sample used to normalize the number of galaxies referred in Column 1. | |||||||
| – The fractions "Column (1) / Column (2)" are given in Columns 4 (A85), 6 (A496), 8 (A2670). | |||||||
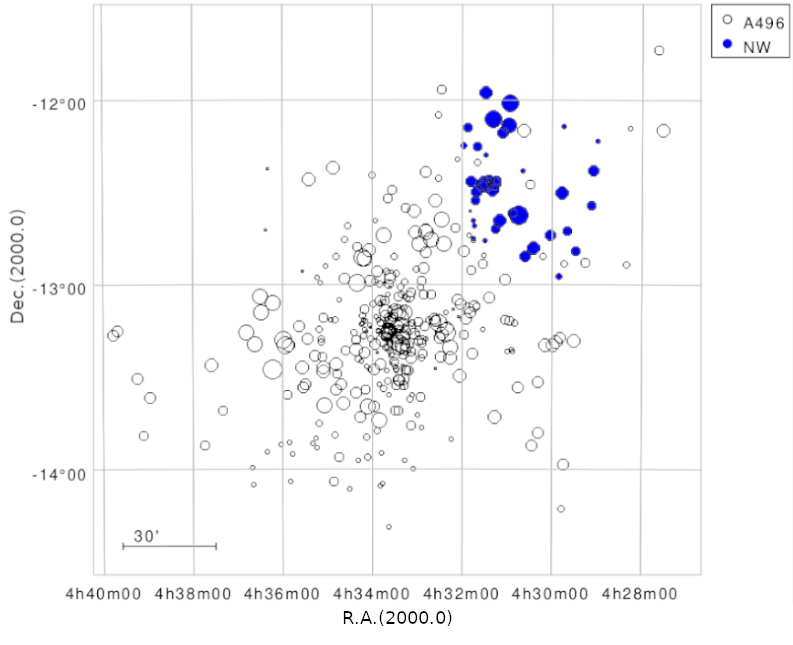
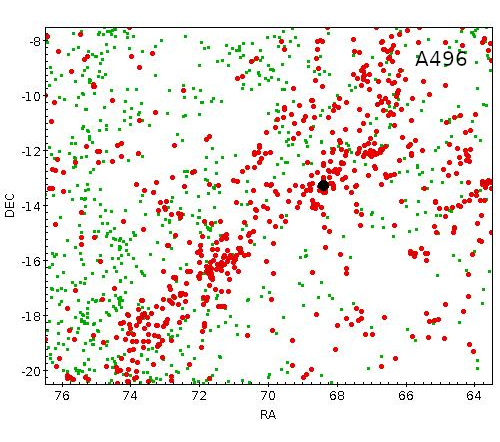
We explored the surrounding large scale structure
of A496 in order to better understand the
replenishment of gas-rich galaxies. We analyzed
6dF Survey data within an area of 12 degrees
around A496; the center of this cluster is
indicated with a black solid circle
in Fig. 8. We applied a galaxy
request restricted to the redshift range of
0.0255 – 0.0407 (7552 – 11962 km s-1),
corresponding to the 3 interval of
A496. The output of 498 galaxies is displayed
in the same figure. This plot shows in
green the positions of all the galaxies found in
6dF while the objects in red correspond to the
selected redshift interval. Important galaxy
concentrations are clearly seen, drawing a
filament in the NW-SE direction, having
redshifts of 0.037 and 0.038 (the redshift
of A496 is 0.033). The nearest structure to
A496 lies to the NW and could be at the origin
of the large number of gas-rich objects in the
NW zone of A496 and the substructure reported
in the same region (Fig. 5).
Other observational evidences support this
filament of large scale structure, like the
X-ray cluster MCXC J0445.1-1551, SE from A496.
This system was not identified originally by
Abell and is found at RA=71.5, Dec=-16,
centered on the cD galaxy NGC 1650. These
filaments account for the observed replenishment
of gas rich galaxies, in particular from the NW.
A2670: This system is dynamically younger than the other studied clusters so the high fraction of B-Sp within the VLA FoV (24%, see Table 4) is not unexpected. The fraction of B-Sp within 1 R200 is larger than in the other two systems (Table 6). However, opposite to other young clusters like Virgo (Chung et al., 2009), Hydra (Wang et al., 2021) and Abell 963 (Jaffé et al., 2015), the correlation between Hi deficiency and cluster-centric radius is not seen in A2670. This is due to the large number of Hi rich galaxies projected onto the cluster core (Figs. 3 and 4) which are located into the virialized zone of the cluster (Fig. 7). Our estimations of RPS in A2670 predict significant environment effects, even if less intense than in A496 and A85. In A2670, RPS is expected to dominate within /R 0.3, for relative velocities of , and within a radius of /R 0.4, for higher velocities (Fig. 6). Therefore most of the Hi detections projected in the very central region of A2670 are explained by projection effects, either being fast infallers along the line of sight or objects with non-radial orbits.
We use the B-Sp properties to investigate the strength of the environment effects in A2670. Fig. 2 shows that a number of B-Sp have reached the red sequence; five of them retain enough gas to be detected in Hi. Interestingly, almost half of the Hi detected galaxies are classified as abnormal (Table 4) confirming a rather harsh cluster environment. The fraction of Hi abnormal objects within 1 R200 is much larger in A2670 (0.48) than the other two clusters. We quantify the importance of pre-processing in A2670 by contrasting the positions of the Hi perturbed B-Sp with the substructures reported in Sect. 4. We found only two of such galaxies in the north-center (NC) group and four in the SW, including 3 Hi abnormal and one non-detected object. The SW region seems to be the only zone of this cluster where pre-processing is at work.
The elongated morphology of A2670, following a NE-SW axis, is confirmed by the distribution of member galaxies in Fig. 3. The global positions of Hi detections help to trace the accretion history of A2670. When we focus beyond 1.0 R200, a strong asymmetry is seen between the very Hi rich south-west and the Hi poor north-east region (Fig. 4). This strongly suggest the former as the preferred direction of infalling spiral galaxies.
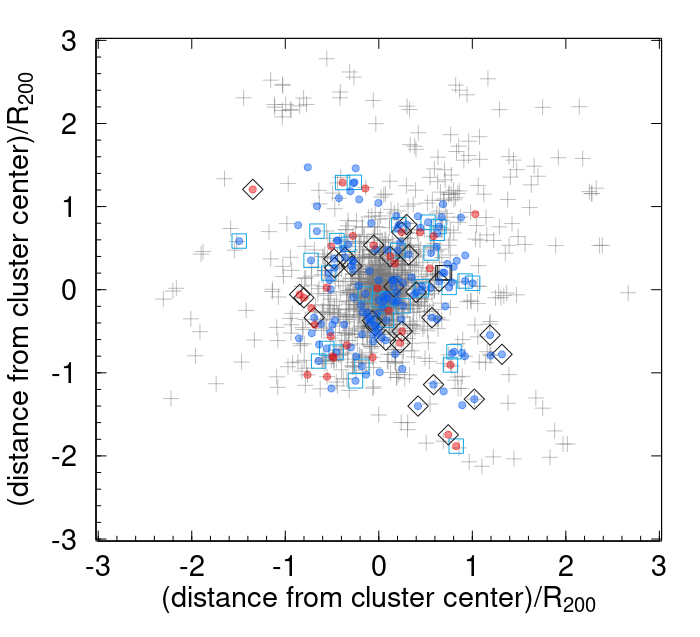
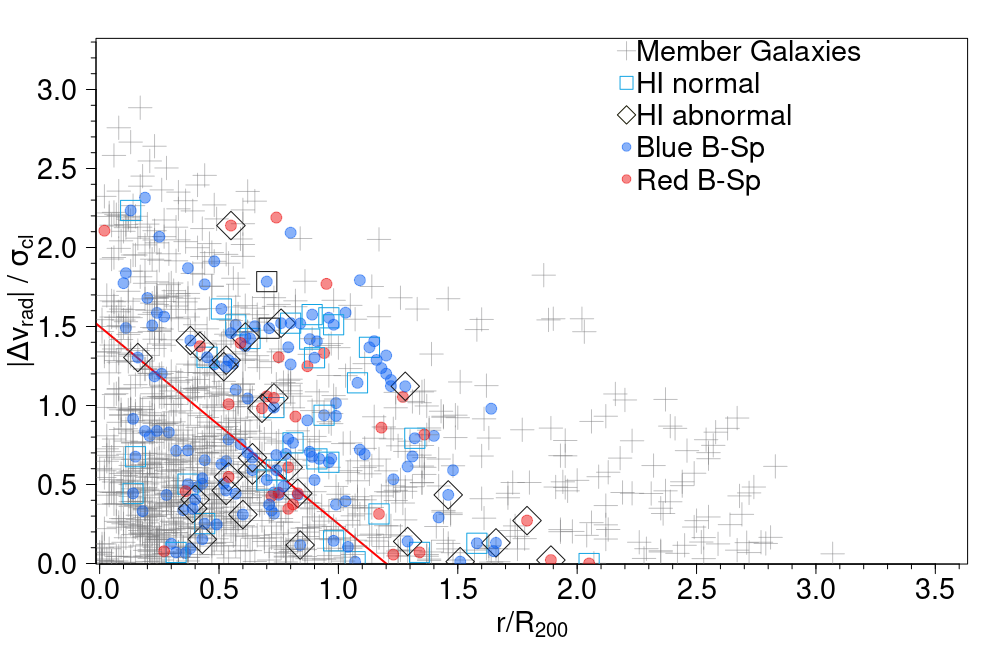
6.3 The evolutionary stage of the bright spirals: a three-cluster composite view
In order to explore the global behavior of the large sample of bright spirals (B-Sp) collected in this work we create a composite cluster constituted by the three studied systems. The left panel of Fig. 9 shows the distribution, on the plane of the sky, of all member objects and all the bright spirals (we use the same symbols than in previous plots). The right panel of Fig. 9 shows the PPS diagram of the composite cluster. In order to properly display the three systems in a single plot we normalize the galaxy cluster-centric distance by the corresponding R200. The relative velocities are normalized by the corresponding cluster velocity dispersion (see Luber et al., 2022).
We study the behaviour of the B-Sp across the composite cluster by looking for trends between their distribution and their Hi properties. We split the full catalog of B-Sp in two sub-samples named: normal B-Sp and disturbed B-Sp. The former is constituted by those Hi detected B-Sp, displaying normal distribution and gas content. The sub-sample of disturbed B-Sp includes those being Hi abnormal plus those Hi non-detected. Defined in this way, the disturbed sub-sample includes galaxies undergoing strong degrees of transformation. Next we estimate the mean projected distances for each sub-sample and we compare them. We use units of /R200, obtaining the following results:
normal B-Sp: =0.63;
disturbed B-Sp: =0.56.
This confirms the expected scenario where Hi disturbed spirals are located, on average, closer
to the cluster center than Hi normal ones. The
difference between means is, however, not found
to be significant enough ()
by the Welch’s t-test. As we next show, this is
most likely due to the heterogeneous trends seen
in the individual clusters.
In order to quantify such
trends we contrasted the average distances of
the same sub-samples within each system:
A85: normal B-Sp: =0.86 vs. disturbed B-Sp:
=0.59.
A496: normal B-Sp: =0.66 vs. disturbed B-Sp:
=0.75.
A2670: normal B-Sp: =0.96 vs. disturbed B-Sp:
=0.85
This confirms, in A85, the very strong trend where disturbed B-Sp lay at lower cluster-centric radius (confidence value 99%). Oppositely, A496 has a very atypical behaviour with an inverse trend of normal B-Sp located, in average, at lower radius than their disturbed counterparts. Despite the projection effects cited above, such a trend has never been observed in other clusters. A2670 is an intermediate case where the difference between and has low statistical significance. Other statistical methods produce similar results, for instance the Two-sample test for the mean, considering the one-tail case of the z-Test.
7 Summary and Conclusions
This paper is devoted to study galaxy
evolution and environment effects occurring
at the core and outskirts of three nearby
Abell clusters: A85/A496/A2670. We analyzed
the transformation of spirals as a function
of their local environment by studying
different clusters lying at roughly the same
cosmological epoch. This work is
based on a blind, VLA Hi-imaging survey, with
data cubes covering a volume that extends beyond
one virial radius and more than three times the
velocity dispersion of each cluster.
Our main results and conclusions can be
summarized as follows.
We report Hi parameters
for 10, 58, and 38 galaxies in A85, A496, and A2670,
respectively, as well as an atlas of the
corresponding Hi maps and velocity fields.
We defined a complete sample of bright spirals
with masses above log
and we used them
as test particles for environment effects.
This sample helped as well to obtain a catalog of
the spirals not detected in Hi and to trace
the accretion history of the parent clusters.
We report further evidence for cluster
environment playing an active role in transforming
spirals, both in their Hi content and in their
color. We measured the global Hi deficiency
of the three clusters, finding a very high value
(85%) for A85, and less conspicuous deficiencies
for A496 and A2670. The expected cluster-centric
distribution of Hi rich/poor galaxies is only
observed in A85. The other two systems show a
very complex distribution of their Hi,
with a high fraction of gas-rich objects lying
within the virialized zone. Strong projection
effects must be responsible.
We report a number of bright spirals that
have moved into the red sequence in the three clusters.
The majority of these objects are Hi disturbed.
This sample of red spirals
constitutes additional evidence for systematic
transformation from normal, blue spirals, into
gas poor, passive objects.
We traced ram-pressure stripping
profiles in order to measure the strength
of environment effects due to the intracluster
medium.
We find that RPS accounts for the
disrupted/stripped galaxies in the central
regions of the three studied clusters. The
inner 1.5 Mpc (roughly one virial radius)
of A85 appears to be particularly harsh,
only compared with clusters like Coma.
Our substructure analysis confirms
A85 as a complex system with several minor
groups and a major SE subcluster merging
with the main cluster body. We report two
new groups in A85, one to the SW and a second
to the NE. In A496 we unveiled a large group
NW of the cluster center. We revisited the
surrounding large scale structure of A496
and we detected a filament running NW-SE.
A2670 is an intermediate case between the
two other studied clusters, having three
minor groups running along the NE-SW axis.
The distributions of Hi rich/poor
galaxies in the three clusters reveal the
following (preferred) directions of galaxy
infalling: the SE for A85, NW for A496,
and SW for A2670.
We explored the relevance of
pre-processing by
measuring the number of Hi disturbed
galaxies within each of the reported
substructures. In A85 we found an important
number of such disturbed objects, SE from the
cluster center. They could be produced by a
shocked interface due to a cluster-subcluster
merger process and/or by pre-processing. The
other two clusters show no evidence for strong
pre-processing with the exception of the SW
group of A2670. Our results suggest that the
effects of the global cluster environment are
equally (or even more) important than pre-processing
in the transformation of spiral galaxies.
The systematic transformation of spirals in the studied clusters cannot be associated to one single parameter of the parent system. Therefore, in addition to the cluster mass and , the dynamical stage and the feeding of new spirals from the large scale structure help to explain the observed properties of the spiral population and their degree of transformation.
Acknowledgements
The authors thank the anonymous referee for her/his
helpful comments which helped to improve this paper.
M.M.L.G., H.B.A. and C.A.C acknowledge funding from
CONACyT and DAIP. H.B.A. also thanks Institut
d’Astrophysique de Paris for its support during his
working visits. We acknowledge Y. Venkatapathy for
his help enlarging the redshift catalogues used in
this work. F.D. acknowledges continuous support from
CNES since 2002. Y.J. acknowledges financial support
from FONDECYT Iniciación 2018 No. 11180558 and ANID
BASAL Project FB210003.
Data availability.
Data available on request.
References
- Arnouts et al. (2007) Arnouts S., Walcher C. J., Le Fèvre O., Zamorani G., Ilbert O., Le Brun V., Pozzetti L., et al., 2007, A&A, 476, 137
- Bahé et al. (2013) Bahé Y. M., McCarthy I. G., Balogh M. L., Font A. S., 2013, MNRAS, 430, 3017
- Bahé et al. (2019) Bahé Y. M., Schaye J., Barnes D. J., Dalla Vecchia C., Kay S. T., Bower R. G., Hoekstra H., et al., 2019, MNRAS, 485, 2287
- Balogh et al. (2004) Balogh M., Eke V., Miller C., Lewis I., Bower R., Couch W., Nichol R., et al., 2004, MNRAS, 348, 1355
- Barsanti et al. (2018) Barsanti S., Owers M. S., Brough S., Davies L. J. M., Driver S. P., Gunawardhana M. L. P., Holwerda B. W., et al., 2018, ApJ, 857, 71
- Barnes & Hernquist (1996) Barnes J. E., Hernquist L., 1996, ApJ, 471, 115
- Barway et al. (2007) Barway S., Kembhavi A., Wadadekar Y., Ravikumar C. D., Mayya Y. D., 2007, ApJ, 661, L37
- Bellhouse et al. (2017) Bellhouse C., Jaffé Y. L., Hau G. K. T., McGee S. L., Poggianti B. M., Moretti A., Gullieuszik M., et al., 2017, ApJ, 844, 49
- Boselli & Gavazzi (2006) Boselli A., Gavazzi G., 2006, PASP, 118, 517
- Boselli & Gavazzi (2014) Boselli A., Gavazzi G., 2014, A&ARv, 22, 74
- Boselli et al. (2021) Boselli A., Lupi, A., Epinat, B., et al. 2021, A&A, 646, 139
- Boselli et al. (2022) Boselli A., Fossati, M., Sun, M. 2022, A&ARv, 30, 3
- Boué et al. (2008a) Boué G., Adami C., Durret F., Mamon G. A., Cayatte V., 2008, A&A, 479, 335
- Boué et al. (2008b) Boué G., Durret F., Adami C., Mamon G. A., Ilbert O., Cayatte V., 2008, A&A, 489, 11
- Bravo-Alfaro et al. (2000) Bravo-Alfaro H., Cayatte V., van Gorkom J. H., Balkowski C., 2000, AJ, 119, 580
- Bravo-Alfaro et al. (2001) Bravo-Alfaro H., Cayatte V., van Gorkom J. H., Balkowski C., 2001, A&A, 379, 347
- Bravo-Alfaro et al. (2009) Bravo-Alfaro H., Caretta C. A., Lobo C., Durret F., Scott T., 2009, A&A, 495, 379
- Briggs (1995) Briggs D. S., 1995, AAS
- Butcher & Oemler (1978) Butcher H., Oemler A., 1978, ApJ, 219, 18
- Byrd & Valtonen (1990) Byrd G., Valtonen M., 1990, ApJ, 350, 89
- Bryan & Norman (1998) Bryan G. L., Norman M. L., 1998, ApJ, 495, 80
- Cavaliere & Fusco-Femiano (1976) Cavaliere A., & Fusco-Femiano R., 1976, A&A, 49, 137
- Cayatte et al. (1990) Cayatte V., van Gorkom J. H., Balkowski C., Kotanyi C., 1990, AJ, 100, 604
- Cayatte et al. (1994) Cayatte V., Kotanyi C., Balkowski C., van Gorkom J. H., 1994, AJ, 107, 1003
- Chen et al. (2007) Chen Y., Reiprich T. H., Böhringer H., Ikebe Y., Zhang Y.-Y., et al., 2007, A&A, 466, 805
- Chow-Martínez et al. (2014) Chow-Martínez M., Andernach H., Caretta C. A., Trejo-Alonso J. J., 2014, MNRAS, 445, 4073
- Chow-Martínez (2019) Chow-Martínez M. 2019. PhD Thesis, University of Guanajuato, Mexico.
- Chung et al. (2009) Chung A., van Gorkom J. H., Kenney J. D. P., Crowl H., Vollmer B., 2009, AJ, 138, 1741
- Cirimele, Nesci, & Trèvese (1997) Cirimele G., Nesci R., & Trèvese D., 1997, ApJ, 475, 11
- Cortese, Catinella, & Smith (2021) Cortese L., Catinella B., Smith R., 2021, PASA, 38, 35
- De Lucia, Hirschmann, & Fontanot (2019) De Lucia G., Hirschmann M., Fontanot F., 2019, MNRAS, 482, 5041
- Deb et al. (2020) Deb T., Verheijen M. A. W., Gullieuszik M., Poggianti B. M., van Gorkom J. H., Ramatsoku M., Serra P., et al., 2020, MNRAS, 494, 5029
- Dénes et al. (2014) Dénes H., Kilborn V. A. & Koribalski B. S. 2014, MNRAS, 444, 667
- Dénes et al. (2016) Dénes H., Kilborn V. A., Koribalski B. S., Wong O. I., 2016, MNRAS, 455, 1294
- Donnari et al. (2021) Donnari M., Pillepich A., Joshi G., D., Nelson D., Genel S., Marinacci F., Rodriguez-Gomez V., et al., 2021 MNRAS, 500, 4004
- Dressler (1980) Dressler A., 1980, ApJ, 236, 351
- Dressler (1986) Dressler A., 1980, ApJ, 301, 35
- Dressler & Shectman (1988) Dressler A., Shectman S. A., 1988, AJ, 95, 985
- Dressler et al. (1997) Dressler A., Oemler A., Couch W. J., Smail I., Ellis R. S., Barger A., Butcher H., et al., 1997, ApJ, 490, 577
- Durret et al. (1998) Durret F., Forman W., Gerbal D., Jones C., Vikhlinin A., 1998, A&A, 335, 41
- Durret et al. (1999) Durret F., Felenbok P., Lobo C., Slezak E., 1999, A&AS, 139, 525
- Durret et al. (2000) Durret F., Adami C., Gerbal D., Pislar V., 2000, A&A, 356, 815
- Durret, Lima Neto, & Forman (2005) Durret F., Lima Neto G. B., Forman W., 2005, A&A, 432, 809
- Fadda et al. (2008) Fadda D., Biviano A., Marleau F. R., Storrie-Lombardi L. J., Durret F., 2008, ApJ, 672, L9
- Fasano et al. (2000) Fasano G., Poggianti B. M., Couch W. J., Bettoni D., Kjærgaard P., Moles M., 2000, ApJ, 542, 673
- Fernández et al. (2013) Fernández X., van Gorkom J. H., Hess K. M., Pisano D. J., Kreckel K., Momjian E., Popping A., et al., 2013, ApJL, 770, L29
- Fernández et al. (2016) Fernández X., Gim H. B., van Gorkom J. H., Yun M. S., Momjian E., Popping A., Chomiuk L., et al., 2016, ApJ, 824, L1
- Finn et al. (2005) Finn R. A., Zaritsky D., McCarthy D. W., Poggianti B., Rudnick G., Halliday C., Milvang-Jensen B., et al., 2005, ApJ, 630, 206
- Flewelling et al. (2020) Flewelling, H. A., Magnier, E. A., Chambers, K. C. et al. 2020, ApJS, 251, 7
- Geller et al. (2013) Geller M. J., Diaferio A., Rines K. J., Serra A. L., 2013, ApJ, 764, 58
- Gill, Knebe, & Gibson (2005) Gill S. P. D., Knebe A., Gibson B. K., 2005, MNRAS, 356, 1327
- Giovanelli & Haynes (1985) Giovanelli R., Haynes M. P., 1985, ApJ, 292, 404
- Giovanelli et al. (2005) Giovanelli R., Haynes M. P., Kent B. R., Perillat P., Saintonge A., Brosch N., Catinella B., et al., 2005, AJ, 130, 2598
- Gogate et al. (2020) Gogate A. R., Verheijen M. A. W., Deshev B. Z., van Gorkom J. H., Montero-Castaño M., van der Hulst J. M., Jaffé Y. L., et al., 2020, MNRAS, 496, 3531
- Goto et al. (2003) Goto T., Yamauchi C., Fujita Y., Okamura S., Sekiguchi M., Smail I., Bernardi M., et al., 2003, MNRAS, 346, 601
- Gunn & Gott (1972) Gunn J. E., Gott J. R., 1972, ApJ, 176, 1
- Haynes & Giovanelli (1984) Haynes M. P., Giovanelli R., 1984, AJ, 89, 758
- Haynes et al. (2018) Haynes M. P., Giovanelli R., Kent B. R., Adams E. A. K., Balonek T. J., Craig D. W., Fertig D., et al., 2018, ApJ, 861, 49
- Healy et al. (2021) Healy J., Blyth S.-L., Verheijen M. A. W., Hess K. M., Serra P., van der Hulst J. M., Jarrett T. H., et al., 2021, A&A, 650, A76
- Hernández-Fernández et al. (2014) Hernández-Fernández J. D., Haines C. P., Diaferio A., Iglesias-Páramo J., Mendes de Oliveira C., Vilchez J. M., 2014, MNRAS, 438, 2186
- Hess et al. (2019) Hess K. M., Luber N. M., Fernández X., Gim H. B., van Gorkom J. H., Momjian E., Gross J., et al., 2019, MNRAS, 484, 2234
- Hirschmann et al. (2014) Hirschmann, M., De Lucia, G., Wilman, D., et al. 2014, MNRAS, 444, 2938
- Hubble & Humason (1931) Hubble E., Humason M. L., 1931, ApJ, 74, 43
- Ichinohe et al. (2015) Ichinohe, Y., Werner, N., Simionescu, A., et al. 2015, MNRAS, 448, 2971
- Jaffé et al. (2013) Jaffé Y. L., Poggianti B. M., Verheijen M. A. W., Deshev B. Z., van Gorkom J. H., 2013, MNRAS, 431, 2111
- Jaffé et al. (2015) Jaffé Y. L., Smith R., Candlish G. N., Poggianti B. M., Sheen Y.-K., Verheijen M. A. W., 2015, MNRAS, 448, 1715
- Jaffé et al. (2016) Jaffé Y. L., Verheijen M. A. W., Haines C. P., Yoon H., Cybulski R., Montero-Castaño M., Smith R., et al., 2016, MNRAS, 461, 1202
- Jaffé et al. (2018) Jaffé Y. L., Poggianti B. M., Moretti A., Gullieuszik M., Smith R., Vulcani B., Fasano G., et al., 2018, MNRAS, 476, 4753
- Jaffé et al. (2019) Jaffé Y. L., Poggianti B. M., Moretti A., Gullieuszik M., Smith R., Vulcani B., Fasano G., et al., 2019, MNRAS, 482, 3454
- Jonas & MeerKAT Team (2016) Jonas J., MeerKAT Team, 2016, mks..conf, 1
- Jung et al. (2018) Jung S. L., Choi H., Wong O. I., Kimm T., Chung A., Yi S. K., 2018, ApJ, 865, 156
- Kauffmann et al. (2004) Kauffmann G., White S. D. M., Heckman T. M., Ménard B., Brinchmann J., Charlot S., Tremonti C., et al., 2004, MNRAS, 353, 713
- Kent & Gunn (1982) Kent S. M., Gunn J. E., 1982, AJ, 87, 945
- Kopylova & Kopylov (2018) Kopylova F. G., Kopylov A. I., 2018, AstBu, 73, 267
- Koribalski et al. (2020) Koribalski B. S., Staveley-Smith L., Westmeier T., Serra P., Spekkens K., Wong O. I., Lee-Waddell K., et al., 2020, Ap&SS, 365, 118
- Laganá, Durret, & Lopes (2019) Laganá T. F., Durret F., Lopes P. A. A., 2019, MNRAS, 484, 2807
- Larson, Tinsley, & Caldwell (1980) Larson R. B., Tinsley B. M., Caldwell C. N., 1980, ApJ, 237, 692
- Lewis et al. (2002) Lewis I., Balogh M., De Propris R., Couch W., Bower R., Offer A., Bland-Hawthorn J., et al., 2002, MNRAS, 334, 673
- Lopes et al. (2018) Lopes P. A. A., Trevisan M., Laganá T. F., Durret F., Ribeiro A. L. B., Rembold S. B., 2018, MNRAS, 478, 5473
- Luber et al. (2022) Luber, N., Mller, A., van Gorkom, J. H. et al., 2022, ApJ, 927, 39
- Mahajan et al. (2018) Mahajan S., Drinkwater M. J., Driver S., Hopkins A. M., Graham A. W., Brough S., Brown M. J. I., et al., 2018, MNRAS, 475, 788
- Masters et al. (2010) Masters K. L., Mosleh M., Romer A. K., Nichol R. C., Bamford S. P., Schawinski K., Lintott C. J., et al., 2010, MNRAS, 405, 783
- Merritt (1983) Merritt D., 1983, ApJ, 264, 24
- Molnár et al. (2022) Molnár, D. Cs., Serra, P., van der Hulst, T., et al. 2022, A&A, 659, A94
- Moore, Katz, & Lake (1996) Moore B., Katz N., Lake G., 1996, ApJ, 457, 455
- Nulsen (1982) Nulsen P. E. J., 1982, MNRAS, 198, 1007
- Oemler (1974) Oemler A., 1974, ApJ, 194, 1
- Oman, Hudson, & Behroozi (2013) Oman K. A., Hudson M. J., Behroozi P. S., 2013, MNRAS, 431, 2307
- Owers et al. (2017) Owers M.S., Allen J.T., Baldry I. et al., 2017, MNRAS, 468, 1824
- Paccagnella et al. (2017) Paccagnella, A., Vulcani, B. Poggianti, B. M., et al. 2017, ApJ, 838, 148
- Paturel et al. (1989) Paturel G., Fouque P., Bottinelli L., Gouguenheim L., 1989, A&AS, 80, 299
- Peng et al. (2010) Peng Y.-. jie ., Lilly S. J., Kovač K., Bolzonella M., Pozzetti L., Renzini A., Zamorani G., et al., 2010, ApJ, 721, 193
- Poggianti et al. (2009a) Poggianti B. M., Aragón-Salamanca A., Zaritsky D., De Lucia G., Milvang-Jensen B., Desai V., Jablonka P., et al., 2009a, ApJ, 693, 112
- Poggianti et al. (2009b) Poggianti B. M., Fasano G., Bettoni D., Cava A., Dressler A., Vanzella E., Varela J., et al., 2009b, ApJ, 697, L137
- Poggianti et al. (2017) Poggianti B. M., Moretti A., Gullieuszik M., Fritz J., Jaffé Y., Bettoni D., Fasano G., et al., 2017, ApJ, 844, 48
- Postman & Geller (1984) Postman M., Geller M. J., 1984, ApJ, 281, 95
- Ramatsoku et al. (2020) Ramatsoku M., Serra P., Poggianti B. M., Moretti A., Gullieuszik M., Bettoni D., Deb T., et al., 2020, A&A, 640, A22
- Rhee et al. (2017) Rhee J., Smith R., Choi H., Yi S. K., Jaffé Y., Candlish G., Sánchez-Jánssen R., 2017, ApJ, 843, 128
- Rhee et al. (2020) Rhee J., Smith R., Choi H., Contini E., Jung S. L., Han S., Yin S. K., 2020, ApJS, 247, 45
- Roberts et al. (2019) Roberts I. D., Parker L. C., Brown T., Joshi G. D., Hlavacek-Larrondo J., Wadsley J., 2019, ApJ, 873, 42
- Roediger & Brüggen (2006) Roediger E., Brüggen M., 2006, MNRAS, 369, 567
- Salerno et al. (2020) Salerno J. M., Martínez H. J., Muriel H., Coenda V., Vulcani B., Poggianti B., Moretti A., et al., 2020, MNRAS, 493, 4950
- Serna & Gerbal (1996) Serna A., Gerbal D., 1996, A&A, 309, 65
- Scott et al. (2010) Scott T. C., Bravo-Alfaro H., Brinks E., Caretta C. A., Cortese L., Boselli A., Hardcastle M. J., et al., 2010, MNRAS, 403, 1175
- Scott et al. (2018) Scott T. C., Brinks E., Cortese L., Boselli A., Bravo-Alfaro H., 2018, MNRAS, 475, 4648
- Serra et al. (2011) Serra A. L., Diaferio A., Murante G., Borgani, S. 2011, MNRAS, 412, 800
- Sheen et al. (2017) Sheen Y.-K., Smith R., Jaffé Y., Kim M., Yi S. K., Duc P.-A., Nantais J., et al., 2017, ApJL, 840, L7
- Slezak et al. (1998) Slezak E., Durret F., Guibert J., Lobo C., 1998, A&AS, 128, 67
- Slezak et al. (1999) Slezak E., Durret F., Guibert J., Lobo C., 1999, A&AS, 139, 559
- Solanes et al. (2001) Solanes, J. M., Manrique, A., García-Gómez, C. et al. 2001, ApJ, 548, 97
- Spérone-Longin et al. (2021) Spérone-Longin D., Jablonka P., Combes F., Castignani G., Rudnick G., Zaritsky D., et al., 2021, A&A, 647, A156
- Tacchella et al. (2019) Tacchella, S., Diemer, B., Hernquist, L., et al. 2019, MNRAS, 487, 5416
- Taylor, Carilli, & Perley (1999) Taylor G. B., Carilli C. L., Perley R. A., eds, 1999, ASP Conf. Ser. Vol. 180, Synthesis Imaging in Radio Astronomy II, Socorro NM
- Tonnesen (2019) Tonnesen S., 2019, ApJ, 874, 161
- Ulmer et al. (2011) Ulmer M. P., Adami C., Durret F., Ilbert O., Guennou L., 2011, A&A, 528, A36
- Venkatapathy et al. (2017) Venkatapathy Y., Bravo-Alfaro H., Mayya Y. D., Lobo C., Durret F., Gamez V., Valerdi M., et al., 2017, AJ, 154, 227
- Vollmer et al. (2012) Vollmer B., Soida M., Braine J., Abramson A., Beck R., Chung A., Crowl H. H., et al., 2012, A&A, 537, A143
- Walker, Mihos, & Hernquist (1996) Walker I. R., Mihos J. C., Hernquist L., 1996, ApJ, 460, 121
- Wang et al. (2021) Wang J., Staveley-Smith L., Westmeier T., Cantinella B., Shao L., Reynolds T. N., For B. Q., et al., 2021, ApJ, 915, 70
- Xie et al. (2020) Xie L., De Lucia G., Hirschmann M., Fontanot F., 2020, MNRAS, 498, 4327
Appendix A Hi-detected galaxies in A85, A496, A2670.
| ID | Name | RA | Dec | Morph. | color | M∗ | Opt-vel | Hi-vel | MHI | DefHI | Dist. | Hi | |||
| (2000) | (2000) | type | mag | () | km s-1 | km s-1 | km s-1 | M⊙ | Sa-Sb | Sc-Irr | Mpc | pert. | |||
| (1) | (2) | (3) | (4) | (5) | (6) | (7) | (8) | (9) | (10) | (11) | (12) | (13) | (14) | (15) | (16) |
| 1 | 323 | 00 42 18.7 | -09 54 14 | S?∗ | 17.86 | 0.376 | 9.50 | 15618 | 15608 | 137 | 8.2 | -0.27 | -0.13 | 2.39 | N |
| 2 | 347 | 00 42 29.5 | -10 01 07 | S?∗ | 17.62 | 0.352 | 9.59 | 15165 | 15175 | 91 | 2.5 | -0.03 | 0.08 | 2.86 | N |
| 3 | 374 | 00 42 41.5 | -08 56 49 | S?∗ | 16.39 | 0.512 | 10.26 | 15106 | 15107 | 318 | 13.8 | -0.29 | -0.14 | 1.60 | N |
| 4 | 986362b | 00 43 01.7 | -09 47 34 | - | 17.27 | 0.418 | 9.79 | 15110 | 15107 | 227 | 6.5 | -0.39 | -0.27 | 2.23 | N |
| 5 | 461 | 00 43 14.3 | -09 10 21 | - | 18.84 | 0.318 | 9.01 | 15015 | 15016 | 227 | 10.2 | -0.85 | -0.76 | 1.44 | N |
| 6 | 3114a | 00 43 19.5 | -09 09 13 | - | 19.47 | 0.390 | 8.76 | 15060 | 15061 | 136 | 3.7 | -0.46 | -0.37 | 1.54 | N |
| 7 | 486 | 00 43 31.2 | -09 51 48 | S | 16.81 | 0.288 | 9.82 | 16619 | 16615 | 230 | 7.2 | -0.09 | 0.05 | 2.72 | N |
| 8 | 491 | 00 43 34.0 | -08 50 37 | S?∗ | 17.05 | 0.297 | 9.94 | 14968 | 14993 | 182 | 11.6 | -0.56 | -0.44 | 2.43 | N |
| 9 | 496 | 00 43 38.7 | -09 31 21 | S?∗ | 16.99 | 0.281 | 9.84 | 15004 | 14993 | 182 | 4.3 | 0.04 | 0.17 | 1.94 | Pos |
| 10 | 502 | 00 43 43.9 | -09 04 23 | - | 17.30 | 0.340 | 9.73 | 15004 | 15038 | 182 | 11.8 | -0.33 | -0.19 | 2.03 | N |
| Column (1): Sequence ID number. | |||||||||||||||
| Column (2): [DFL98] galaxy name (Durret et al., 1998); (a) [SDG98] galaxy name (Slezak et al., 1998); (b) PGC names (Paturel et al., 1989). | |||||||||||||||
| Columns (3) and (4): RA, Dec coordinates from NED. | |||||||||||||||
| Column (5): The morphological type from NED, except (∗) taken from HyperLEDA. | |||||||||||||||
| Columns (6) and (7): The magnitude and () color index estimated in this work from CFHT/PanSTARRS images. | |||||||||||||||
| Column (8): Stellar mass given by log(M∗/M⊙). | |||||||||||||||
| Column (9): Optical velocity from our redshift membership catalog (see Sect. 2). | |||||||||||||||
| Column (10): Heliocentric Hi velocity. The uncertainty is taken as one-half the velocity resolution, 23 km s-1 (see Table 3). | |||||||||||||||
| Column (11): The galaxy velocity width, the uncertainty is 46 km s-1 (see Table 3). | |||||||||||||||
| Column (12): The Hi-Mass following Haynes & Giovanelli (1984); uncertainties are lower than 10%; see the text for more details. | |||||||||||||||
| Columns (13) and (14): The upper and lower limits for HI deficiency, following Haynes & Giovanelli (1984). | |||||||||||||||
| Column (15): The projected cluster-centric distance considering the position of the corresponding BCG. | |||||||||||||||
| Column (16): Qualitative code indicating if the galaxy is normal in Hi (N), otherwise it is perturbed. See the text for more details. | |||||||||||||||
| ID | Name | RA | Dec | Morph. | color | M∗ | Opt-vel | Hi-vel | MHI | DefHI | Dist. | Hi | |||
| (2000) | (2000) | type | mag | () | km s-1 | km s-1 | km s-1 | M⊙ | Sa-Sb | Sc-Irr | Mpc | pert. | |||
| (1) | (2) | (3) | (4) | (5) | (6) | (7) | (8) | (9) | (10) | (11) | (12) | (13) | (14) | (15) | (16) |
| 1 | 603 | 04 30 49.8 | -13 12 28 | - | 16.92 | 0.193 | 9.29 | 9786 | 9724 | 88 | 1.7 | -0.19 | -0.11 | 1.63 | N |
| 2 | 672 | 04 31 03.4 | -13 11 21 | Sc | 17.69 | 0.302 | 8.99 | 10776 | 10783 | 177 | 2.3 | -0.14 | -0.04 | 1.51 | N |
| 3 | B042910.53-130437.3 | 04 31 30.0 | -12 58 15 | - | 18.83 | 0.272 | 8.44 | - | 10407 | 44 | 1.9 | -1.00 | -0.97 | 1.42 | N |
| 4 | 853 | 04 31 32.0 | -13 14 34 | - | 17.14 | 0.278 | 9.23 | 9208 | 9264 | 219 | 2.6 | -0.22 | -0.12 | 1.22 | N |
| 5 | 903∗∗∗ | 04 31 40.3 | -13 07 11 | - | 17.48 | 0.455 | 9.18 | 10904 | - | - | 2.3 | - | - | 1.19 | |
| 6 | 926∗∗∗ | 04 31 43.1 | -13 07 10 | - | 17.08 | 0.596 | 9.44 | 11106 | - | - | 1.0 | - | - | 1.16 | |
| 7 | 958 | 04 31 47.7 | -12 44 23 | - | 19.38 | 0.224 | 8.16 | - | 10186 | 132 | 0.8 | -0.16 | -0.10 | 1.64 | N |
| 8 | 982 | 04 31 50.3 | -12 43 54 | - | 17.68 | 0.174 | 8.93 | 10919 | 10871 | 89 | 1.0 | -0.14 | -0.06 | 1.64 | N |
| 9 | 989 | 04 31 51.8 | -13 07 43 | - | 18.96 | 0.288 | 8.39 | 10006 | 10275 | 221 | 3.3 | -0.38 | -0.28 | 1.08 | Vel |
| 10 | 1054 | 04 32 02.8 | -13 29 48 | I | 16.73 | 0.464 | 9.53 | 10289 | 9329 | 175 | 1.5 | -0.03 | 0.07 | 1.08 | Vel, Pos |
| 11 | 1099 | 04 32 09.6 | -12 41 42 | Sc | 15.70 | 0.584 | 10.07 | 10323 | 10319 | 309 | 7.3 | -0.07 | 0.08 | 1.60 | N |
| 12 | 1169 | 04 32 20.4 | -13 14 11 | Sb | 16.39 | 0.401 | 9.65 | 8990 | 8979 | 262 | 8.9 | -0.52 | -0.41 | 0.76 | N |
| 13 | 1179 | 04 32 21.8 | -13 15 48 | - | 17.55 | 0.371 | 9.10 | 10057 | 10076 | 176 | 1.4 | -0.15 | -0.06 | 0.74 | N |
| 14 | 1275 | 04 32 41.8 | -13 03 21 | - | 19.10 | 0.349 | 8.36 | 10608 | 10473 | 88 | 1.0 | -0.17 | -0.10 | 0.73 | Vel |
| 15 | 04.56-13.38∗∗ | 04 32 45.3 | -13 23 08 | - | 21.12 | 0.296 | 7.39 | - | 10694 | 88 | 0.6 | -0.11 | -0.05 | 0.59 | N |
| 16 | 1303 | 04 32 45.5 | -12 33 39 | - | 19.68 | 0.399 | 8.12 | - | 9264 | 44 | 3.5 | -1.20 | -1.16 | 1.75 | N |
| 17 | 1315 | 04 32 48.1 | -12 42 52 | - | 16.36 | 0.191 | 9.55 | 9954 | 9615 | 132 | 3.6 | -0.17 | -0.06 | 1.39 | Vel, Asy |
| 18 | 1324 | 04 32 49.0 | -12 42 19 | - | 18.09 | 0.254 | 8.78 | 10037 | 9615 | 132 | 1.1 | -0.16 | -0.09 | 1.41 | Vel, Asy |
| 19 | 1338 | 04 32 51.1 | -13 03 07 | - | 18.92 | 0.320 | 8.43 | 10474 | 10473 | 88 | 1.1 | -0.33 | -0.27 | 0.68 | N |
| 20 | 1354 | 04 32 54.2 | -13 23 50 | - | 17.16 | 0.498 | 9.35 | 9932 | 9922 | 220 | 3.6 | -0.62 | -0.54 | 0.53 | N |
| 21 | 1363 | 04 32 54.7 | -12 53 25 | - | 18.11 | 0.250 | 8.77 | - | 10385 | 88 | 2.5 | -0.49 | -0.41 | 0.98 | N |
| 22 | 04.55-13.06∗∗ | 04 32 55.4 | -13 03 33 | - | 21.33 | 0.484 | 7.40 | - | 10429 | 88 | 1.0 | -0.78 | -0.75 | 0.64 | N |
| 23 | 198c | 04 32 56.1 | -13 36 38 | Sc | 15.65 | 0.709 | 10.16 | 11349 | 10561 | 177 | 2.5 | -0.16 | -0.06 | 0.92 | Vel |
| 24 | 3760 | 04 32 56.8 | -12 46 41 | SBbc | 15.23 | 0.745 | 10.37 | 10602 | 10606 | 354 | 5.3 | 0.14 | 0.29 | 1.22 | Asy |
| 25 | 1386 | 04 32 59.8 | -13 42 33 | - | 16.95 | 0.739 | 9.57 | 10557 | 10473 | 265 | 3.1 | -0.10 | 0.01 | 1.13 | Asy |
| 26 | 1389 | 04 33 00.1 | -13 57 28 | - | 19.65 | 0.535 | 8.21 | - | 10186 | 44 | 1.4 | -0.71 | -0.66 | 1.70 | N |
| 27 | 1399 | 04 33 02.0 | -12 43 00 | - | 15.79 | 0.457 | 9.96 | 9361 | 9373 | 263 | 5.4 | -0.59 | -0.49 | 1.35 | N |
| 28 | 1418 | 04 33 05.3 | -13 26 55 | - | 18.42 | 0.472 | 8.75 | - | 10473 | 89 | 1.2 | -0.12 | -0.03 | 0.55 | N |
| 29 | 1419 | 04 33 05.9 | -13 59 54 | - | 18.84 | 0.860 | 8.75 | 10943 | 10971 | 266 | 1.6 | 0.36 | 0.47 | 1.79 | Def |
| 30 | 1457 | 04 33 10.9 | -13 14 10 | - | 17.79 | 0.495 | 9.05 | 8991 | 8914 | 131 | 1.8 | -0.32 | -0.24 | 0.27 | Pos |
| 31 | 1461 | 04 33 11.4 | -13 28 02 | - | 18.14 | 0.461 | 8.87 | 10670 | 10650 | 177 | 2.8 | -0.54 | -0.46 | 0.55 | N |
| 32 | 1474 | 04 33 13.7 | -13 27 56 | - | 18.94 | 0.415 | 8.47 | 10159 | 10120 | 88 | 1.1 | -0.31 | -0.25 | 0.54 | N |
| 33 | 1482 | 04 33 15.1 | -13 21 19 | - | 18.04 | 0.317 | 8.83 | 10207 | 10186 | 132 | 0.8 | 0.03 | 0.11 | 0.31 | N |
| 34 | 225c | 04 33 17.4 | -12 59 01 | Sb | 15.61 | 0.674 | 10.16 | 10826 | 10915 | 266 | 0.6 | 0.35 | 0.44 | 0.70 | Def |
| 35 | 1512 | 04 33 19.6 | -13 33 39 | - | 19.20 | 0.358 | 8.32 | 10268 | 10253 | 88 | 0.7 | -0.17 | -0.10 | 0.74 | N |
| 36 | 1547 | 04 33 23.3 | -13 20 21 | Sc | 16.89 | 0.504 | 9.48 | 10188 | 10208 | 265 | 3.8 | -0.27 | -0.17 | 0.23 | N |
| 37 | 1549 | 04 33 23.9 | -13 31 03 | S | 16.74 | 0.590 | 9.59 | 10228 | 10231 | 397 | 10.4 | -0.75 | -0.64 | 0.63 | N |
| 38 | 1565 | 04 33 25.4 | -13 41 09 | Sc | 16.75 | 0.524 | 9.55 | 10866 | 10827 | 354 | 3.1 | -0.12 | 0.00 | 1.02 | Pos |
| 39 | 1584 | 04 33 29.0 | -13 41 15 | - | 20.40 | 0.273 | 7.72 | 9443 | 9527 | 44 | 0.4 | 0.31 | 0.39 | 1.02 | Def |
| 40 | 1624 | 04 33 34.6 | -12 38 34 | - | 19.40 | 0.329 | 8.21 | - | 10539 | 133 | 1.4 | -0.22 | -0.14 | 1.48 | N |
| 41 | 1656∗∗∗ | 04 33 38.5 | -13 35 46 | I | 16.98 | 0.411 | 9.38 | 11194 | - | - | 0.9 | - | - | 0.80 | |
| 42 | 1709 | 04 33 44.7 | -13 33 50 | I | 17.07 | 0.523 | 9.40 | 9779 | 9724 | 176 | 1.2 | 0.23 | 0.33 | 0.72 | Def, Pos |
| 43 | 1747∗∗∗ | 04 33 50.9 | -13 44 18 | - | 18.62 | 0.400 | 8.61 | 11037 | - | - | 0.8 | - | - | 1.15 | |
| 44 | 1834 | 04 34 02.0 | -13 17 49 | Sbc | 15.89 | 0.470 | 9.92 | 10347 | 10319 | 132 | 2.3 | -0.01 | 0.10 | 0.25 | N |
| 45 | 1849 | 04 34 04.1 | -12 48 52 | - | 18.56 | 0.356 | 8.62 | 9002 | 9023 | 88 | 1.1 | -0.02 | 0.07 | 1.10 | N |
| 46 | 1860∗∗∗ | 04 34 06.3 | -13 39 44 | - | 19.40 | 0.476 | 8.29 | 11267 | - | - | 1.8 | - | - | 1.00 | |
| 47 | 1967 | 04 34 23.9 | -13 15 32 | - | 18.16 | 0.405 | 8.83 | 9480 | 9483 | 132 | 0.7 | 0.08 | 0.15 | 0.45 | N |
| 48 | 2036 | 04 34 36.8 | -12 45 30 | - | 19.08 | 0.128 | 8.25 | 9936 | 9944 | 88 | 1.5 | -0.49 | -0.43 | 1.33 | N |
| 49 | 2246 | 04 35 10.5 | -13 59 34 | - | 18.01 | 0.685 | 9.03 | - | 10451 | 132 | 3.0 | -0.56 | -0.48 | 1.96 | N |
| 50 | 2252 | 04 35 11.0 | -13 45 18 | - | 17.97 | 0.446 | 8.94 | 10963 | 11004 | 87 | 2.9 | -0.32 | -0.23 | 1.49 | N |
| 51 | B043258.99-130504.4 | 04 35 18.3 | -12 58 58 | - | 20.78 | 0.554 | 7.70 | - | 10054 | 44 | 1.3 | -0.47 | -0.41 | 1.18 | N |
| 52 | 2447 | 04 35 45.5 | -13 58 37 | - | 17.86 | 0.694 | 9.09 | - | 10606 | 265 | 4.3 | -0.34 | -0.24 | 2.11 | Asy |
| 53 | 2485 | 04 35 52.0 | -13 19 47 | Sab | 16.10 | 0.810 | 10.00 | 10301 | 10363 | 309 | 1.4 | 0.43 | 0.55 | 1.31 | Def, Pos |
| 54 | 2503 | 04 35 54.5 | -13 34 49 | S0-a | 19.29 | 0.472 | 8.34 | - | 10385 | 88 | 0.8 | -0.53 | -0.49 | 1.53 | N |
| 55 | 2516 | 04 35 56.7 | -13 19 49 | - | 18.70 | 0.331 | 8.54 | 10609 | 10584 | 133 | 1.0 | -0.11 | -0.03 | 1.36 | N |
| 56 | 2525 | 04 35 57.8 | -13 43 56 | - | 19.65 | 0.604 | 8.25 | - | 10385 | 177 | 1.3 | -0.15 | -0.07 | 1.76 | N |
| 57 | 2534 | 04 35 59.5 | -13 18 07 | Sab | 16.06 | 0.830 | 10.03 | 10188 | 10098 | 220 | 0.9 | 0.55 | 0.67 | 1.38 | Def |
| 58 | 04.60-13.55∗∗ | 04 36 14.2 | -13 33 20 | - | - | - | - | - | 10960 | 44 | 0.8 | -0.76 | -0.73 | 1.66 | N |
| Column (1): Sequence ID number. | |||||||||||||||
| Column (2): [SDG99]-SRC galaxy name (Slezak et al., 1999); (c) [DFL99] galaxy name (Durret et al., 1999); (∗∗) The names were constructed using RA, Dec in hours and decimal degrees, | |||||||||||||||
| they are objects not cataloged in NED, and the coordinates shown for these objects are those of the HI emission. (∗∗∗) The emission extends beyond the observed range. | |||||||||||||||
| Columns (3) and (4): RA, Dec coordinates from NED. | |||||||||||||||
| Column (5): The morphological type from NED. | |||||||||||||||
| Columns (6) and (7): The magnitude and () color index estimated in this work from CFHT/PanSTARRS images. | |||||||||||||||
| Column (8): Stellar mass given by log(M∗/M⊙) | |||||||||||||||
| Column (9): Optical velocity from our redshift membership catalog (see Sect. 2). | |||||||||||||||
| Column (10): Heliocentric Hi velocity. The uncertainty in taken as one-half the velocity resolution, 22 km s-1 (see Table 3). | |||||||||||||||
| Column (11): The galaxy velocity width, the uncertainty is 44 km s-1(see Table 3). | |||||||||||||||
| Column (12): The Hi-Mass following Haynes & Giovanelli (1984); uncertainties are lower than 10%; see the text for more details. | |||||||||||||||
| Columns (13) and (14): The upper and lower limits for HI deficiency, following Haynes & Giovanelli (1984). | |||||||||||||||
| Column (15): The projected cluster-centric distance considering the position of the corresponding BCG. | |||||||||||||||
| Column (16): Qualitative code indicating the Hi appearance, either normal or perturbed. See the text for more details. | |||||||||||||||
| ID | Name | RA | Dec | Morph. | color | M∗ | Opt-vel | Hi-vel | MHI | DefHI | Dist. | Hi | |||
| (2000) | (2000) | type | mag | () | km s-1 | km s-1 | km s-1 | M⊙ | Sa-Sb | Sc-Irr | Mpc | pert. | |||
| (1) | (2) | (3) | (4) | (5) | (6) | (7) | (8) | (9) | (10) | (11) | (12) | (13) | (14) | (15) | (16) |
| 1 | J235222.31-104134.7 | 23 52 22.3 | -10 41 35 | - | 19.03 | 0.364 | 9.28 | 22814 | 22666 | 238 | 5.4 | -0.47 | -0.36 | 2.81 | Vel, Pos |
| 2 | J235232.39-104154.1 | 23 52 32.4 | -10 41 54 | - | 19.35 | 0.249 | 9.07 | - | 22595 | 95 | 4.4 | -0.57 | -0.48 | 2.65 | N |
| 3 | J235233.13-103640.8 | 23 52 33.1 | -10 36 41 | - | 18.34 | 0.388 | 9.62 | 22724 | 22690 | 191 | 4.8 | -0.35 | -0.24 | 2.40 | Pos |
| 4 | J235247.36-105259.1 | 23 52 47.3 | -10 52 59 | E?∗ | 16.78 | 0.640 | 10.51 | 22721 | 22714 | 143 | 6.6 | 0.19 | 0.35 | 3.08 | Def, Pos |
| 5 | 3325027b | 23 52 55.8 | -10 42 04 | - | 19.16 | 0.354 | 9.21 | 21795 | 21929 | 95 | 2.6 | -0.20 | -0.10 | 2.24 | N |
| 6 | J235303.74-110454.9 | 23 53 03.7 | -11 04 55 | S?∗ | 16.30 | 0.679 | 10.76 | 22823 | 22738 | 191 | 7.0 | -0.01 | 0.14 | 3.82 | N |
| 7 | J235305.67-104055.6 | 23 53 05.7 | -10 40 56 | Sbc | 16.51 | 0.434 | 10.49 | 21930 | 21953 | 427 | 14.4 | -0.31 | -0.17 | 2.02 | N |
| 8 | J235308.87-104417.3 | 23 53 08.9 | -10 44 17 | E? | 17.96 | 0.802 | 10.06 | 22578 | 22547 | 667 | 25.6 | -0.60 | -0.46 | 2.19 | N |
| 9 | J235310.49-104142.3 | 23 53 10.5 | -10 41 42 | - | 20.00 | 0.267 | 8.78 | - | 21858 | 142 | 3.6 | -0.79 | -0.72 | 2.00 | N |
| 10 | J235310.87-110203.0 | 23 53 10.9 | -11 02 03 | S?∗ | 17.33 | 0.684 | 10.29 | 22806 | 22785 | 96 | 3.4 | 0.12 | 0.25 | 3.52 | Def |
| 11 | J235319.07-102303.2 | 23 53 19.1 | -10 23 03 | Sc | 17.07 | 0.614 | 10.36 | 22300 | 22305 | 236 | 4.2 | 0.13 | 0.27 | 1.19 | Def |
| 12 | J235320.90-101047.7 | 23 53 20.9 | -10 10 48 | - | 18.67 | 0.352 | 9.44 | 22306 | 22423 | 283 | 2.7 | -0.06 | 0.05 | 1.70 | N |
| 13 | 2dFGRS S888Z177 | 23 53 20.9 | -10 32 39 | - | 19.14 | 0.445 | 9.28 | 23114 | 23298 | 142 | 3.0 | -0.29 | -0.20 | 1.31 | Vel |
| 14 | J235324.23-104916.6 | 23 53 24.2 | -10 49 17 | - | 17.70 | 0.330 | 9.88 | 21947 | 21976 | 190 | 7.1 | -0.67 | -0.58 | 2.38 | Pos, Asy |
| 15 | J235326.38-101549.0 | 23 53 26.4 | -10 15 49 | E?∗ | 18.22 | 0.603 | 9.82 | 22410 | 22399 | 425 | 12.6 | -0.11 | 0.04 | 1.31 | N |
| 16 | J235338.22-105443.9 | 23 53 38.2 | -10 54 44 | S?∗ | 17.47 | 0.589 | 10.16 | 22484 | 22476 | 143 | 6.7 | -0.22 | -0.09 | 2.71 | Pos |
| 17 | J235339.45-102430.1 | 23 53 39.4 | -10 24 30 | - | 20.11 | 0.302 | 8.74 | - | 22588 | 142 | 2.6 | -0.44 | -0.35 | 0.72 | N |
| 18 | J235339.87-102547.6 | 23 53 39.9 | -10 25 48 | Sa | 17.26 | 0.552 | 10.23 | 22552 | 22612 | 189 | 2.6 | 0.16 | 0.28 | 0.73 | Def, Pos |
| 19 | J235341.02-103453.9 | 23 53 41.0 | -10 34 54 | - | 19.93 | 0.375 | 8.87 | - | 21482 | 188 | 3.2 | -0.57 | -0.49 | 1.11 | N |
| 20 | J235344.08-104041.2 | 23 53 44.1 | -10 40 41 | - | 20.54 | 0.544 | 8.70 | - | 23575 | 48 | 2.1 | -0.51 | -0.45 | 1.51 | N |
| 21 | J235346.66-101614.8 | 23 53 46.7 | -10 16 15 | Sab | 16.31 | 0.629 | 10.73 | 23796 | 23964 | 143 | 3.7 | 0.36 | 0.52 | 0.97 | Def, Vel, Pos |
| 22 | J235356.57-101510.4 | 23 53 56.6 | -10 15 10 | Sd | 17.07 | 0.495 | 10.28 | 21565 | 21529 | 94 | 2.2 | -0.51 | -0.44 | 0.94 | N |
| 23 | 141225b | 23 53 57.1 | -10 22 29 | Sa | 17.31 | 0.509 | 10.17 | 21898 | 21834 | 423 | 10.6 | -0.46 | -0.33 | 0.43 | N |
| 24 | 141233b | 23 53 58.5 | -10 28 27 | - | 19.26 | 0.360 | 9.17 | 22168 | 22140 | 283 | 5.0 | -0.56 | -0.47 | 0.44 | N |
| 25 | J235411.73-102115.1 | 23 54 11.7 | -10 21 15 | - | 19.26 | 0.375 | 9.18 | 24268 | 24321 | 95 | 2.3 | -0.30 | -0.21 | 0.35 | N |
| 26 | J235413.59-102748.2 | 23 54 13.6 | -10 27 48 | E? | 17.79 | 0.563 | 9.99 | 24568 | 24536 | 143 | 1.7 | 0.03 | 0.14 | 0.24 | N |
| 27 | J235418.24-101349.5 | 23 54 18.2 | -10 13 50 | Sc | 17.43 | 0.580 | 10.17 | 23251 | 23227 | 474 | 11.0 | 0.08 | 0.25 | 1.00 | Def |
| 28 | J235419.51-103300.3 | 23 54 19.5 | -10 33 00 | Sa | 16.77 | 0.601 | 10.49 | 23925 | 23964 | 429 | 11.5 | -0.25 | -0.11 | 0.71 | Asy, Pos |
| 29 | J235435.77-095748.6 | 23 54 35.8 | -09 57 49 | S?∗ | 17.94 | 0.370 | 9.79 | 23442 | 23407 | 144 | 9.2 | -0.30 | -0.17 | 2.46 | N |
| 30 | J235438.15-101907.6 | 23 54 38.1 | -10 19 08 | Sab | 16.76 | 0.523 | 10.44 | 22506 | 22517 | 378 | 10.0 | -0.19 | -0.05 | 0.75 | Asy |
| 31 | J235444.17-101655.9 | 23 54 44.2 | -10 16 56 | Scd | 17.00 | 0.426 | 10.26 | 23184 | 23120 | 383 | 7.3 | -0.01 | 0.14 | 0.98 | Pos |
| 32 | J235446.43-095752.9 | 23 54 46.4 | -09 57 53 | - | 17.73 | 0.780 | 10.16 | 22768 | 22666 | 334 | 4.6 | -0.05 | 0.07 | 2.50 | N |
| 33 | J235449.71-100151.0 | 23 54 49.7 | -10 01 51 | - | 18.43 | 0.466 | 9.63 | - | 21857 | 237 | 2.7 | 0.36 | 0.50 | 2.20 | Def, Pos |
| 34 | J235451.55-101238.9 | 23 54 51.5 | -10 12 39 | - | 19.13 | 0.253 | 9.17 | 23284 | 23216 | 191 | 3.2 | -0.27 | -0.17 | 1.37 | N |
| 35 | J235453.62-101931.6 | 23 54 53.6 | -10 19 32 | Im | 18.13 | 0.505 | 9.79 | 21818 | 21787 | 235 | 4.5 | -0.24 | -0.12 | 0.99 | Pos |
| 36 | J235454.17-101717.0 | 23 54 54.2 | -10 17 17 | Sc | 15.83 | 0.544 | 10.89 | 23065 | 23168 | 478 | 10.9 | -0.01 | 0.15 | 1.12 | Asy |
| 37 | J235607.62-095938.1 | 23 56 07.6 | -09 59 38 | E∗ | 17.00 | 0.670 | 10.43 | 23035 | 23168 | 96 | 2.8 | 0.31 | 0.44 | 3.34 | Def, Pos |
| 38 | J235619.93-101246.2 | 23 56 19.9 | -10 12 46 | S?∗ | 16.23 | 0.507 | 10.67 | 22923 | 22953 | 430 | 10.2 | -0.20 | -0.06 | 2.95 | N |
| Column (1): Sequence ID number. | |||||||||||||||
| Columns (2): SDSS names; (b) PGC names (Paturel et al., 1989). | |||||||||||||||
| Columns (3) and (4): RA, Dec coordinates from NED. | |||||||||||||||
| Column (5): The morphological type from NED, except (∗) taken from HyperLEDA. | |||||||||||||||
| Columns (6) and (7): The magnitude and () color index estimated in this work from CFHT/PanSTARRS images. | |||||||||||||||
| Column (8): Stellar mass given by log(M∗/M⊙). | |||||||||||||||
| Column (9): Optical velocity from our redshift membership catalog (see Sect. 2). | |||||||||||||||
| Column (10): Heliocentric Hi velocity. The uncertainty in taken as one-half the velocity resolution, 24 km s-1 (see Table 3). | |||||||||||||||
| Column (11): The galaxy velocity, the uncertainty is 48 km s-1(see Table 3). | |||||||||||||||
| Column (12): The Hi-Mass following Haynes & Giovanelli (1984); uncertainties are lower than 10%; see the text for more details. | |||||||||||||||
| Columns (13) and (14): The upper and lower limits for HI deficiency, following Haynes & Giovanelli (1984). | |||||||||||||||
| Column (15): The projected cluster-centric distance considering the position of the corresponding BCG. | |||||||||||||||
| Column (16): Qualitative code indicating the Hi appearance, either normal or perturbed. See the text for more details. | |||||||||||||||
Appendix B Spirals not detected in HI, A85, A496, A2670
| ID | Name | RA | Dec | Morph. | Opt-vel | color | M∗ | Dist. | |
| (2000) | (2000) | type | km s-1 | mag | () | Mpc | |||
| (1) | (2) | (3) | (4) | (5) | (6) | (7) | (8) | (9) | (10) |
| 1 | 044 | 00 39 47.6 | -09 48 11 | - | 15848 | 18.34 | 0.493 | 9.34 | 2.77 |
| 2 | 046 | 00 39 48.4 | -09 14 37 | S?∗ | 17338 | 17.78 | 0.596 | 9.67 | 1.97 |
| 3 | 052 | 00 39 59.1 | -09 26 04 | S?∗ | 16939 | 18.07 | 0.434 | 9.44 | 1.85 |
| 4 | 920a | 00 40 01.9 | -10 06 05 | - | 17458 | 18.53 | 0.433 | 9.22 | 3.56 |
| 5 | 93148b | 00 40 13.6 | -08 58 01 | - | 17935 | 18.10 | 0.311 | 9.34 | 2.03 |
| 6 | 070 | 00 40 18.7 | -08 52 57 | S0/a | 17923 | 15.99 | 0.695 | 10.56 | 2.20 |
| 7 | 087 | 00 40 40.9 | -08 48 59 | - | 15652 | 18.15 | 0.393 | 9.37 | 2.20 |
| 8 | 099 | 00 40 51.6 | -09 20 28 | - | 16506 | 18.82 | 0.536 | 9.15 | 0.95 |
| 9 | 127 | 00 41 10.4 | -09 15 01 | - | 18254 | 18.45 | 0.480 | 9.29 | 0.67 |
| 10 | 128 | 00 41 11.1 | -09 55 30 | S?∗ | 17000 | 18.40 | 0.556 | 9.36 | 2.50 |
| 11 | 133 | 00 41 12.8 | -09 32 04 | S?∗ | 17139 | 16.40 | 0.584 | 10.30 | 1.08 |
| 12 | 139 | 00 41 14.2 | -08 55 54 | S?∗ | 15157 | 17.83 | 0.324 | 9.48 | 1.56 |
| 13 | 145 | 00 41 19.0 | -09 23 24 | S?∗ | 14935 | 17.94 | 0.442 | 9.50 | 0.61 |
| 14 | 151 | 00 41 21.3 | -08 43 30 | S?∗ | 16050 | 18.02 | 0.524 | 9.51 | 2.30 |
| 15 | 167 | 00 41 27.1 | -09 13 43 | S?∗ | 14167 | 16.46 | 0.517 | 10.23 | 0.47 |
| 16 | 170 | 00 41 27.9 | -09 23 30 | S?∗ | 14836 | 18.18 | 0.555 | 9.46 | 0.50 |
| 17 | 1645a | 00 41 27.9 | -09 13 47 | - | 16258 | 17.36 | 0.555 | 9.84 | 0.46 |
| 18 | 201 | 00 41 36.2 | -08 59 35 | E?∗ | 17935 | 16.89 | 0.338 | 9.92 | 1.23 |
| 19 | 218 | 00 41 42.5 | -09 21 26 | - | 14737 | 18.56 | 0.576 | 9.29 | 0.25 |
| 20 | 1875a | 00 41 44.4 | -09 26 25 | - | 17457 | 18.16 | 0.527 | 9.45 | 0.54 |
| 21 | 226 | 00 41 45.5 | -09 40 33 | S?∗ | 17072 | 17.61 | 0.487 | 9.68 | 1.45 |
| 22 | 1940a | 00 41 49.0 | -09 57 05 | S?∗ | 15537 | 16.58 | 0.486 | 10.16 | 2.52 |
| 23 | 246 | 00 41 50.8 | -09 13 46 | - | 18178 | 18.37 | 0.321 | 9.23 | 0.29 |
| 24 | 255 | 00 41 53.3 | -09 29 31 | E?∗ | 15732 | 16.38 | 0.342 | 10.16 | 0.74 |
| 25 | 256 | 00 41 53.4 | -09 38 46 | - | 15924 | 18.81 | 0.397 | 9.07 | 1.34 |
| 26 | 267 | 00 41 57.4 | -09 35 24 | S?∗ | 15918 | 17.22 | 0.551 | 9.90 | 1.12 |
| 27 | 273 | 00 41 59.8 | -09 42 32 | - | 15506 | 17.98 | 0.375 | 9.44 | 1.59 |
| 28 | 2146a | 00 41 59.9 | -09 39 10 | S0 | 15780 | 16.42 | 0.455 | 10.21 | 1.37 |
| 29 | 276 | 00 42 00.7 | -09 50 04 | S | 15627 | 16.21 | 0.679 | 10.45 | 2.07 |
| 30 | 286 | 00 42 05.0 | -09 32 04 | Sc | 15852 | 15.93 | 0.532 | 10.49 | 0.93 |
| 31 | 292 | 00 42 06.4 | -09 33 35 | - | 16097 | 18.71 | 0.460 | 9.15 | 1.03 |
| 32 | 2260a | 00 42 08.4 | -09 31 05 | - | 16963 | 18.69 | 0.570 | 9.23 | 0.88 |
| 33 | 2276a | 00 42 09.8 | -09 28 52 | - | 16739 | 18.19 | 0.273 | 9.28 | 0.76 |
| 34 | 304 | 00 42 11.7 | -09 58 14 | S?∗ | 16191 | 18.30 | 0.515 | 9.38 | 2.62 |
| 35 | 316 | 00 42 17.3 | -09 28 48 | S?∗ | 15855 | 17.14 | 0.535 | 9.93 | 0.81 |
| 36 | 321 | 00 42 18.5 | -09 39 12 | - | 15449 | 17.91 | 0.311 | 9.43 | 1.43 |
| 37 | 325 | 00 42 19.9 | -09 25 28 | S?∗ | 15341 | 18.01 | 0.501 | 9.51 | 0.67 |
| 38 | 338 | 00 42 24.2 | -09 16 17 | S?∗ | 18195 | 17.02 | 0.576 | 10.01 | 0.55 |
| 39 | 345 | 00 42 28.4 | -09 49 38 | S?∗ | 15006 | 18.42 | 0.557 | 9.35 | 2.13 |
| 40 | 355 | 00 42 32.9 | -09 21 44 | - | 17064 | 18.94 | 0.356 | 8.98 | 0.72 |
| 41 | 356 | 00 42 33.8 | -08 52 53 | Sc | 17722 | 16.79 | 0.697 | 10.19 | 1.78 |
| 42 | 358 | 00 42 33.9 | -09 08 46 | S?∗ | 16677 | 17.16 | 0.600 | 9.96 | 0.92 |
| 43 | 362 | 00 42 34.7 | -09 04 36 | S?∗ | 14745 | 17.48 | 0.451 | 9.72 | 1.13 |
| 44 | 366 | 00 42 37.0 | -09 45 20 | - | 17065 | 18,64 | 0.559 | 9.25 | 1.91 |
| 45 | 382 | 00 42 43.9 | -09 44 21 | Sb | 15231 | 17.02 | 0.660 | 10.06 | 1.90 |
| 46 | 391 | 00 42 48.4 | -09 34 41 | S?∗ | 17940 | 17.63 | 0.500 | 9.68 | 1.41 |
| 47 | 413 | 00 42 58.7 | -08 55 06 | - | 17081 | 18.57 | 0.520 | 9.26 | 1.85 |
| 48 | 429 | 00 43 04.2 | -09 32 43 | Sc | 15812 | 17.25 | 0.618 | 9.93 | 1.51 |
| 49 | 435 | 00 43 06.0 | -09 50 15 | Sb | 14742 | 16.66 | 0.650 | 10.22 | 2.40 |
| 50 | 439 | 00 43 08.2 | -09 49 37 | - | 15203 | 17.39 | 0.690 | 9.91 | 2.39 |
| 51 | 2972a | 00 43 08.1 | -09 34 44 | - | 15024 | 18.13 | 0.403 | 9.39 | 1.64 |
| 52 | 2997a | 00 43 09.8 | -10 04 43 | - | 15960 | 18.09 | 0.395 | 9.40 | 3.27 |
| 53 | 449 | 00 43 11.0 | -09 18 00 | - | 15945 | 18.94 | 0.511 | 9.08 | 1.29 |
| 54 | 451 | 00 43 11.6 | -09 38 16 | Se | 16253 | 15.84 | 0.586 | 10.57 | 1.84 |
| 55 | 483 | 00 43 30.5 | -09 43 59 | S?∗ | 15125 | 16.80 | 0.516 | 10.08 | 2.31 |
| 56 | 514 | 00 44 04.1 | -09 41 06 | - | 14934 | 18.83 | 0.290 | 8.99 | 2.60 |
| Column (1): Sequence ID number. | |||||||||
| Column (2): [DFL98] galaxy name (Durret et al., 1998); (a) [SDG98] galaxy name (Slezak et al., 1998); | |||||||||
| (b) PGC names (Paturel et al., 1989). | |||||||||
| Columns (3) and (4): RA, Dec coordinates from NED. | |||||||||
| Column (5): The morphological type from NED, except (∗) taken from HyperLEDA. | |||||||||
| Column (6): Optical velocity from our redshift membership catalog (see Sect. 2). | |||||||||
| Columns (7) and (8): The magnitude and () color index estimated in this work from | |||||||||
| CFHT/PanSTARRS images. | |||||||||
| Column (9): Stellar mass given by log(M∗/M⊙). | |||||||||
| Column (10): The cluster-centric distance from the BCG position. | |||||||||
| ID | Name | RA | Dec | Morph. | Opt-vel | color | M∗ | Dist. | |
| (2000) | (2000) | type | km s-1 | mag | () | Mpc | |||
| (1) | (2) | (3) | (4) | (5) | (6) | (7) | (8) | (9) | (10) |
| 1 | 576 | 04 30 45.1 | -12 37 39 | S0-a∗ | 9325 | 15.04 | 0.793 | 10.47 | 2.26 |
| 2 | 671 | 04 31 03.1 | -12 58 26 | SBb∗ | 10524 | 14.40 | 0.438 | 10.60 | 1.65 |
| 3 | 718 | 04 31 10.7 | -12 39 20 | - | 9115 | 16.51 | 0.588 | 9.69 | 2.04 |
| 4 | 799 | 04 31 23.7 | -13 04 13 | E?∗ | 9587 | 15.80 | 0.508 | 9.98 | 1.38 |
| 5 | 924 | 04 31 42.9 | -12 32 38 | - | 9519 | 17.75 | 0.568 | 9.12 | 2.05 |
| 6 | B042925.77-124531.4 | 04 31 45.6 | -12 39 10 | - | 8656 | 17.70 | 0.119 | 8.93 | 1.82 |
| 7 | 1080 | 04 32 06.6 | -13 04 59 | Sc | 10840 | 17.12 | 0.737 | 9.49 | 0.98 |
| 8 | 1193 | 04 32 24.0 | -12 46 48 | SBa | 10140 | 15.89 | 0.735 | 10.06 | 1.36 |
| 9 | 1216 | 04 32 27.7 | -12 38 43 | - | 10339 | 16.46 | 0.620 | 9.70 | 1.62 |
| 10 | 1443 | 04 33 08.9 | -13 02 36 | Sbc | 10197 | 17.18 | 0.651 | 9.42 | 0.59 |
| 11 | 1520 | 04 33 20.2 | -13 26 22 | SBb | 9937 | 16.59 | 0.707 | 9.72 | 0.46 |
| 12 | 1660 | 04 33 38.7 | -12 32 04 | E?∗ | 9812 | 15.20 | 0.519 | 10.27 | 1.74 |
| 13 | 2193 | 04 35 03.0 | -12 53 51 | SBab | 9591 | 15.90 | 0.734 | 10.05 | 1.20 |
| 14 | 2195 | 04 35 03.7 | -13 39 20 | Sa | 9577 | 16.97 | 0.893 | 9.62 | 1.26 |
| 15 | 2210 | 04 35 05.9 | -13 10 54 | - | 10230 | 16.86 | 0.409 | 9.46 | 0.88 |
| 16 | 2253 | 04 35 11.1 | -13 14 40 | SBab | 10575 | 15.27 | 0.744 | 10.35 | 0.91 |
| 17 | 2374 | 04 35 32.4 | -13 33 23 | SBaa | 10121 | 16.46 | 0.928 | 9.89 | 1.31 |
| Column (1): Sequence ID number. | |||||||||
| Column (2): [SDG99]-SRC galaxy name (Slezak et al., 1999). | |||||||||
| Columns (3) and (4): RA, Dec coordinates from NED. | |||||||||
| Column (5): The morphological type from NED, except (∗) taken from HyperLEDA. | |||||||||
| Column (6): Optical velocity from our redshift membership catalog (see Sect. 2). | |||||||||
| Columns (7) and (8): The magnitude and () color index estimated in this work from CFHT/PanSTARRS images. | |||||||||
| Column (9): Stellar mass given by log(M∗/M⊙). | |||||||||
| Column (10): The cluster-centric distance from the BCG position. | |||||||||
| ID | Name | RA | Dec | Morph. | Opt-vel | color | M∗ | Dist. | |
| (2000) | (2000) | type | km s-1 | mag | () | Mpc | |||
| (1) | (2) | (3) | (4) | (5) | (6) | (7) | (8) | (9) | (10) |
| 1 | J235258.26-105430.3 | 23 52 58.3 | -10 54 30 | S?∗ | 23588 | 18.08 | 0.493 | 9.81 | 3.06 |
| 2 | J235258.58-104111.7 | 23 52 58.6 | -10 41 12 | S?∗ | 21817 | 16.70 | 0.627 | 10.54 | 2.16 |
| 3 | J235303.21-101748.0 | 23 53 03.2 | -10 17 48 | Sbc | 22296 | 17.53 | 0.522 | 10.08 | 1.66 |
| 4 | J235311.63-101835.4 | 23 53 11.6 | -10 18 35 | S?∗ | 21754 | 17.98 | 0.539 | 9.89 | 1.46 |
| 5 | J235326.80-102442.1 | 23 53 26.8 | -10 24 42 | S?∗ | 21684 | 17.86 | 0.360 | 9.82 | 1.02 |
| 6 | J235344.11-102200.7 | 23 53 44.1 | -10 22 01 | - | 24283 | 18.92 | 0.101 | 9.20 | 0.70 |
| 7 | J235356.81-100930.2 | 23 53 56.8 | -10 09 30 | - | 23204 | 19.05 | 0.387 | 9.29 | 1.43 |
| 8 | J235357.29-102550.0 | 23 53 57.3 | -10 25 50 | - | 22168 | 19.29 | 0.319 | 9.13 | 0.36 |
| 9 | J235358.85-104130.7 | 23 53 58.9 | -10 41 31 | S?∗ | 22207 | 17.51 | 0.334 | 9.97 | 1.48 |
| 10 | J235405.85-102624.5 | 23 54 05.9 | -10 26 25 | - | 21388 | 19.44 | 0.513 | 9.19 | 0.20 |
| 11 | 141266b | 23 54 08.9 | -10 27 49 | - | 22108 | 18.97 | 0.564 | 9.45 | 0.26 |
| 12 | J235414.84-102448.8 | 23 54 14.8 | -10 24 49 | - | 21178 | 17.31 | 0.728 | 10.32 | 0.04 |
| 13 | J235416.65-101454.6 | 23 54 16.7 | -10 14 55 | Sd | 22630 | 16.42 | 0.598 | 10.65 | 0.90 |
| 14 | J235420.58-100813.5 | 23 54 20.6 | -10 08 14 | - | 24458 | 19.06 | 0.332 | 9.25 | 1.50 |
| 15 | J235422.17-102022.4 | 23 54 22.2 | -10 20 22 | - | 21208 | 19.26 | 0.458 | 9.23 | 0.46 |
| 16 | J235425.88-095923.7 | 23 54 25.9 | -09 59 24 | E?∗ | 22779 | 17.93 | 0.639 | 9.98 | 2.29 |
| 17 | J235431.44-100210.2 | 23 54 31.5 | -10 02 10 | - | 22283 | 19.01 | 0.379 | 9.30 | 2.06 |
| 18 | J235434.57-095415.5 | 23 54 34.6 | -09 54 16 | - | 23284 | 19.22 | 0.484 | 9.27 | 2.76 |
| 19 | J235436.64-095802.9 | 23 54 36.7 | -09 58 03 | - | 22294 | 18.87 | 0.455 | 9.42 | 2.44 |
| 20 | J235436.83-101758.1 | 23 54 36.8 | -10 17 58 | S0/a | 23244 | 18.04 | 0.508 | 9.84 | 0.81 |
| 21 | J235439.40-100006.0 | 23 54 39.4 | -10 00 06 | - | 21916 | 18.22 | 0.457 | 9.72 | 2.28 |
| 22 | J235445.81-101445.5 | 23 54 45.8 | -10 14 46 | Sd | 23371 | 17.52 | 0.449 | 10.04 | 1.15 |
| 23 | J235506.02-103351.3 | 23 55 06.0 | -10 33 51 | - | 23359 | 18.23 | 0.391 | 9.67 | 1.37 |
| 24 | J235509.50-100353.1 | 23 55 09.5 | -10 03 53 | - | 21885 | 18.19 | 0.434 | 9.72 | 2.23 |
| 25 | J235514.23-103611.3 | 23 55 14.2 | -10 36 11 | - | 23375 | 19.09 | 0.393 | 9.27 | 1.63 |
| 26 | J235514.70-102947.5 | 23 55 14.7 | -10 29 48 | S0/a | 24533 | 17.76 | 0.645 | 10.06 | 1.39 |
| 27 | J235517.83-095359.8 | 23 55 17.8 | -09 53 60 | - | 22762 | 18.57 | 0.453 | 9.55 | 3.08 |
| 28 | J235526.62-100843.4 | 23 55 26.6 | -10 08 43 | - | 21724 | 18.75 | 0.371 | 9.41 | 2.14 |
| Column (1): Sequence ID number. | |||||||||
| Column (2): SDSS names; (b) PGC names (Paturel et al., 1989). | |||||||||
| Columns (3) and (4): RA, Dec coordinates from NED. | |||||||||
| Column (5): The morphological type from NED, except (∗) taken from HyperLEDA. | |||||||||
| Column (6): Optical velocity from our redshift membership catalog (see Sect. 2). | |||||||||
| Columns (7) and (8): The magnitude and () color index estimated in this work from CFHT/PanSTARRS images. | |||||||||
| Column (9): Stellar mass given by log(M∗/M⊙). | |||||||||
| Column (10): The cluster-centric distance from the BCG position. | |||||||||