Ergodicity of the Martyna-Klein-Tuckerman Thermostat
and the 2014 Snook Prize
Abstract
Nosé and Hoover’s 1984 work showed that although Nosé and Nosé-Hoover dynamics were both consistent with Gibbs’ canonical distribution neither dynamics, when applied to the harmonic oscillator, provided Gibbs’ Gaussian distribution. Further investigations indicated that two independent thermostat variables are necessary, and often sufficient, to generate Gibbs’ canonical distribution for an oscillator. Three successful time-reversible and deterministic sets of two-thermostat motion equations were developed in the 1990s. We analyze one of them here. It was developed by Martyna, Klein, and Tuckerman in 1992. Its ergodicity was called into question by Patra and Bhattacharya in 2014. This question became the subject of the 2014 Snook Prize. Here we summarize the previous work on this problem and elucidate new details of the chaotic dynamics in the neighborhood of the two fixed points. We apply six separate tests for ergodicity and conclude that the MKT equations are fully compatible with all of them, in consonance with our recent work with Clint Sprott and Puneet Patra.
pacs:
05.20.Jj, 47.11.Mn, 83.50.AxI Deterministic Time-Reversible Thermostats and Ergodicity
In 1984 Shuichi Nosé discovered a canonical dynamicsb1 ; b2 consistent with Willard Gibbs’ canonical phase-space distribution. Hooverb3 used a generalization of Liouville’s flow equation to develop a “Nosé-Hoover dynamics”, a simpler variation on Nosé’s work. He pointed out that neither approach gave Gibbs’ complete canonical distribution for the simple harmonic oscillator problem :
In the 1990s three generalizations of this work were developedb4 ; b5 ; b6 to remedy the stiffness and the lack of ergodicity that resulted when Nosé’s ideas were applied to the harmonic oscillator. All three of them include two “thermostat” variables, , which control the motion of the oscillator coordinate and momentum , steering it toward the canonical distribution. The generalized motion equations all satisfy an analog of the hydrodynamic continuity equation, . The stationary ( steady-state ) version of this phase-space flow equation is :
For all three flow models the probability density is stationary when it includes Gaussian distributions for the two new thermostat variables, and .
As a result there are at present three sets of four ordinary differential motion equations all of which provide the full canonical distribution for an oscillator along with Gaussian distributions for the additional thermostat variables :
Each of them displays a “mirror” or “inversion” or “rotational” symmetry in the plane: any solution has a mirror image when the oscillator is viewed in a mirror perpendicular to the axis. The solution viewed in the mirror replaces both and by their mirror images, and . In the mirror solution, , the time-dependent thermostat variables and are unchanged.
There are also generalizations of each of these ideas based on controlling more, or different, moments of the canonical distribution function.b7 ; b8 In addition, a variety of different solutions result for thermostat relaxation times other than unity, for coordinate-dependent temperature profiles, and for more complicated potentials.
In addition to the canonical oscillator probability the thermostat variables also have Gaussian distributions :
Patra and Bhattacharyab9 investigated the phase-space density in the vicinity of an unstable fixed point of the MKT equations. They displayed an apparent low-probability region there and suggested that the MKT equations were not ergodic. Because any lack of ergodicity would contradict Martyna, Klein, and Tuckerman’s belief in the ergodicity of their own model, we established the 2014 Snook Prizeb10 as a reward for the most convincing work demonstrating either ergodicity or its lack. In January 2015 we awarded the prize to the authors of Reference 11.
Here we clarify the differing conclusions of References 9 and 11 by exploring six aspects of the chaotic dynamics and stationary measure of the MKT equations. These include [A] the moments of the measure, [B] the largest Lyapunov exponent, [C] the two fixed points of the flow, [D] the attractor/repellor dynamics near the two fixed points, [E] the measure in the neighborhood of these fixed points, and [F] the symmetry of the measure in the neighborhoods of 81 lattice points arranged in a four-dimensional phase-space lattice. Our description of the underlying analysis and numerical work makes up the following Section II. Our Conclusions follow in the Summary Section III.
II Investigating Ergodicity: the MKT Harmonic Oscillator
Ergodicity, with any dynamical trajectory coming close to all phase-space states, became an issue with the study of the one-thermostat Nosé-Hoover oscillatorb3 ; b12 :
This model exhibits a variety of regular solutions. Most trajectories correspond to two-dimensional tori in the three-dimensional phase-space. About five percent of the Gaussian phase-space measure ,
makes up a chaotic sea perforated by the torib11 .
Surprisingly, adding a fourth variable to the phase space has a tendency to simplify the flow, with the chaotic region expanding to fill the entire phase space. In what follows we consider the details of the Martyna-Klein-Tuckerman oscillator :
All of the numerical work described here was carried out with the classic fourth-order Runge-Kutta integrator, mostly with a timestep of 0.001 . We consider six different aspects of the MKT oscillator’s phase-space flow, and show that all of them are fully consistent with the ergodicity of that model.
II.1 Moments of the Distribution Function

If MKT dynamics is ergodic then its long-time-averaged distribution is Gaussian :
The independence of the four variables implies that the second, fourth, and sixth moments are equal to 1, 3, and 15 for each of them. Figure 1 compares the evolution of all 12 of these moments for the Martyna-Klein-Tuckerman model. The moments are fully consistent with the ergodic distribution. The moments are reproduced to an accuracy of about four significant figures during a simulation of timesteps. It should be noted that because the last of the MKT equations, , forces the longtime value of to be unity, the ( numerical ) error of that moment, of order , is smaller than that for all the rest . For all the other data, using a timestep of the single-step integration error is of order , about the same as double-precision roundoff error. The number of oscillations represented is about , quite consistent with a random error on the order of the inverse square root of the number of independent sample oscillations.
II.2 Chaoticity and the Largest Lyapunov Exponent
Chaos is an essential ingredient of ergodicity. Chaos can be quantified by measuring the evolution of Lyapunov instability, the ongoing tendency toward the exponentially-fast separation of neighboring phase-space trajectories. A steady-state measurement of Lyapunov instability can be implemented by forcing a tethered “satellite” trajectory to follow the lead of a “reference” trajectory. Both reference and satellite follow exactly the same motion equations but with the reference-to-satellite separation continually constrained by rescaling its phase-space separation at the end of every timestep :
The rescaling of the separation, per unit time, defines the local Lyapunov exponent :
The long-time-averaged value of this “local” time-dependent Lyapunov exponent is the exponent :
The continuous limit can be imposed by using an appropriate Lagrange multiplierb13 .
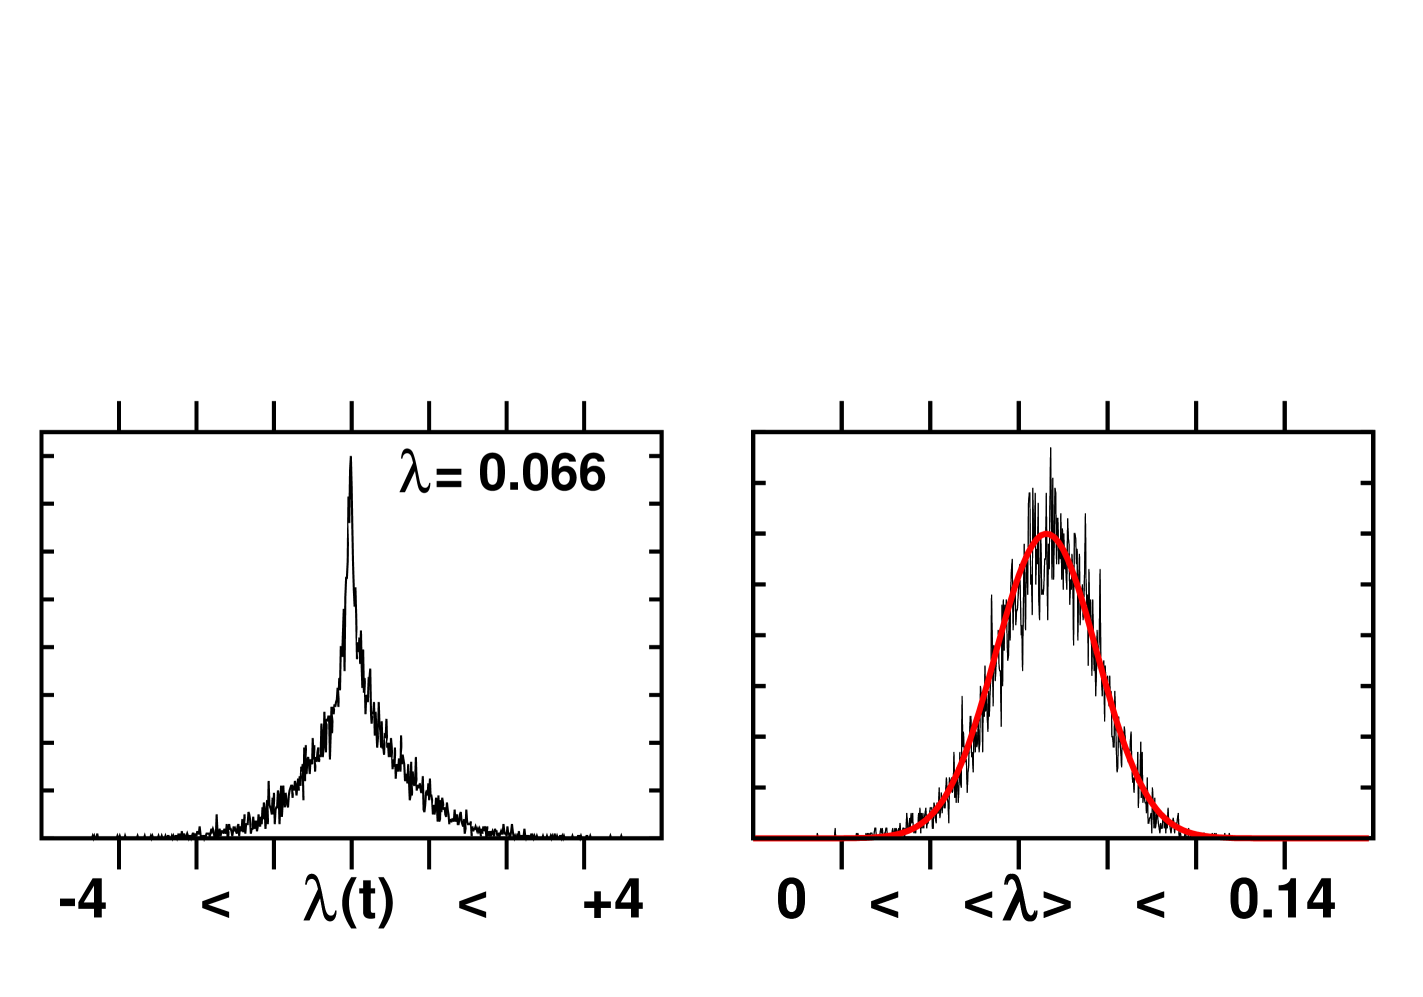
Figure 2 compares a histogram of 10,000 values of the instantaneous “local” exponent , separated by 1000 timesteps with , to a histogram of integrated averages. Each averaged exponent represents one million timesteps, . The reference-to-satellite offset vector has a length 0.000001 . The time averages have a mean and standard deviation :
If the distribution were Gaussian the probability of finding a vanishing integrated exponent in a million trials would be about . The Gaussian shown in the Figure leads to two conclusions: [ 1 ] one million timesteps are clearly sufficient for the Central Limit Theorem to apply, so that [ 2 ] the likelihood of finding a false-negative time average is indeed about one in 100 000 000. For all three of the time-reversible harmonic oscillator thermostat models, HH, JB, and MKT, samples of one million time-averaged Lyapunov exponents were examinedb11 . The initial conditions were chosen randomly from the four-dimensional stationary distributions. The data were consistent with chaos and with the absence of regular toroidal trajectories ( which would correspond to vanishing Lyapunov exponents ). These Lyapunov exponent investigations establish that the measure of any nonergodic component is less than 0.000001 .
II.3 Analysis Near the Two MKT Fixed Points: (0,0,-1,+1) and (0,0,+1,-1)
The MKT oscillator has two separated fixed points where the coordinate and momentum vanish, . The thermostat variables are . The apparent ergodicity of the oscillator implied by the Gaussian moments and the positive Lyapunov exponent suggests that neither fixed point is stable. To show that both are actually exponentially unstable we linearize the equations of motion about the fixed points by considering a perturbation vector .
We begin with the fixed point singled out for analysis by Patra and Bhattacharyab9 :
Another time differentiation provides the separated equations of motion for the perturbations in the and planes. The perturbations are linearly unstable, both in the same manner :
The perturbations in the plane are stable, again in the same manner :
Evidently the flow toward this fixed point complements the corresponding Lyapunov-unstable exit flow in the plane.
Exactly similar analysis can be carried out at the other fixed point :
This time perturbations in the plane are linearly stable rather than unstable, and both in the same manner :
In parallel, the perturbations in the plane are unstable :
In summary, both the fixed points are exponentially unstable, with stable entrance and unstable exit flows balancing in the steady state.
In addition to the mirror symmetry mentioned in the first Section all three sets of thermostated oscillator equations exhibit a time-reversal symmetry in which the signs of and the time all change while that of the coordinate does not. This symmetry implies that the attractors and repellors change roles in the time-reversed dynamics, with damped stable oscillation reversed to give unstable divergent oscillation and vice versa. In either case the oscillator equation corresponds to successive amplitude changes larger or smaller by a factor 6.1 . The parallel thermostat equation near the fixed points, corresponds to successive amplitude changes of a factor of 3.3 at the control variable’s turning points, smaller because the characteristic frequency of these thermostat variables is greater.
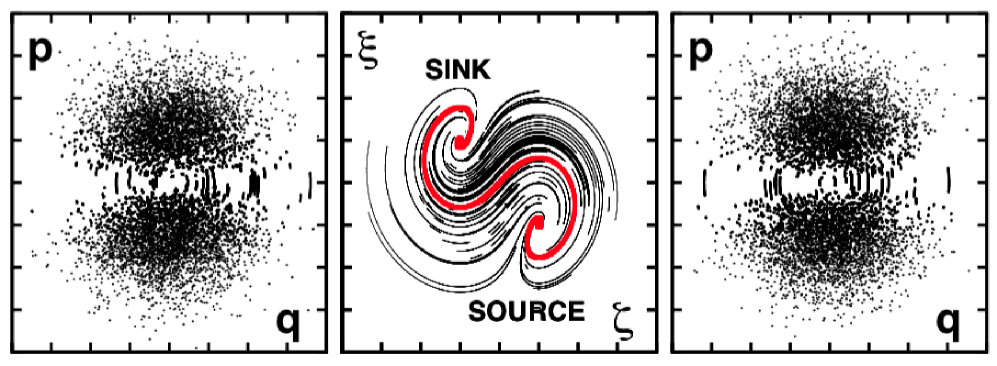
Evidently the flow toward the fixed point competes with the exit unstable flow in the plane. One might expect that exponential divergence would overwhelm the exponential slowing. In order better to understand the fixed point flows we collect trajectory points in three thin four-dimensional slabs centered on and on and . The thickness of the three slabs are all . See Figure 3 . The two cross-sectional views of look precisely similar at the two “fixed points”. While and are both small ( corresponding to a measure of 0.00001 ) the flow parallels the curve joining the two fixed points and emphasized in the center of the Figure. The relatively lengthy excursions correspond to much smaller tracks. In the thin slabs with , the coordinate changes by more than a factor of six between crossings, and the amplitude of the motion is much less. These two effects are responsible for the misleading appearance of “holes” in the projections. We will soon show that the density in the full four-dimensional space is actually completely uniform near both of the fixed points. It is simply the jumps in coupled with the slow flow in that accounts for the low-density appearance emphasized by Patra and Bhattacharyab9 .
II.4 Exponential Motion Near the Fixed Points
Near the two fixed points the flow is dominated by the source-to-sink S-curve shown in the central panel of Figure 3 and well approximated by the projection in the right panel of Figure 4. It is educational to confirm the linear stability analysis by considering the flow shown in Figure 4, starting very near the “source” and “sink” :
At the right in Figure 4 we plot the and trajectories. From a visual standpoint the trajectory leaves the repellor at a time just past 40 and quickly moves to the attactor, settling there near a time 60, and remaining there until just past 140. During all that time the coordinates appear motionless. Their distance from the origin corresponds to the heavy line in the left panel. The distance to the repellor is the light line there. The medium left-panel line is the distance to the attractor reached near time 60.
After a time of 148 chaos ensues and the linear stability analysis visible in the left panel no longer applies. The oscillator and thermostat plane trajectories in the right panel are typical and show that the motion is slower and less vigorous than the motion.

II.5 Probability Density Near the Two Fixed Points
In Figure 5 we plot ( on logarithmic scales ) the number of points out of ( lower curve ), , and ( upper curve ) lying within a distance of the two fixed points, with ranging from -5 to + 2. Because the density in four-dimensional space should vary as rather than , which it does, very accurately. The measure at the fixed points is equal to . Because the volume of a four-dimensional sphere of radius is the probability of finding a trajectory point near one of the two fixed points within the smallest radius is , explaining why such points occur rarely even on a -point trajectory, as is shown in the Figure.
II.6 Grid-Based Measures

We can also confirm the Gaussian solution of the MKT equations by computing the measures of 81 four-dimensional nonoverlapping balls of radius 0.50 arranged on a hypercubic grid centered on the origin. The measures of the balls are inversely proportional to the number of nonzero exponents. The ball at the origin has none. There are respectively 8, 24, 32, and 16 balls with their centers having 1, 2, 3, and 4 nonvanishing exponents. A simulation with timesteps gave measures of 0.00719, 0.00445, 0.00276, , for the five ball types. Each of these measures is close to 0.620 times that of its predecessor, as expected for product measures of four independent Gaussians. The two of the 81 balls centered on the dynamics’ unstable fixed points show nothing out of the ordinary in their measures relative to the other 22 two-exponent balls. This statistical test, which could be refined indefinitely in complexity, is, like all the rest, consistent with ergodicity of the MKT oscillator equations.
III Summary
The thermostated oscillator model introduced by Martyna, Klein, and Tuckerman, and explored here in more detail, is one of three simple systems exhibiting a smooth Gaussian distribution accompanied by a complex chaotic dynamics. All three are important from the pedagogical standpoint, and are also useful as thermostats generating all of Gibbs’ canonical distribution.
Here we have summarized the ( compelling ) evidence for the ergodicity of the MKT oscillator in order to close out the competition for the 2014 Snook Prize. We have used six different and independent methods to assess the ergodicity of the MKT oscillator: [1] the moments of the Gaussian distribution; [2] the chaos, as opposed to regularity, of billions of independent trajectories; [3] the instability of the flows near both fixed points; [4] the exponentially growing separation from both fixed points; [5] the uniform probability density in the vicinity of these unstable fixed points and [6] the expected relative measures within a set of 81 hyperspheres centered on the lattice nodes of a four-dimensional hypercubic lattice.
All of these methods reach the same conclusion, that solutions of the coupled equations are ergodic. We hope that this summary article will prove useful to investigators of ergodicity in other simple dynamical systems.
In view of the very intricate Lyapunov instability of the Martyna-Klein-Tuckerman system this ergodic Gaussian distribution is outstanding in its simplicity. In view of the contributions of Puneet Patra and Clint Sprott to the understanding of this problem we have divided the 2014 Snook Prize equally among ourselves and themselves. We intend to formulate another Snook Prize problem in the summer of 2015 and would be very grateful for suggestions from the readers. We thank Puneet Kumar Patra and Julien Clinton Sprott for helpful support and Ben Leimkuhler and Mark Tuckerman for stimulating comments.
References
- (1) S. Nosé, “A Unified Formulation of the Constant Temperature Molecular Dynamics Methods”, The Journal of Chemical Physics 81, 511-519 (1984).
- (2) S. Nosé, “A Molecular Dynamics Method for Simulations in the Canonical Ensemble”, Molecular Physics 52, 191-198 (1984).
- (3) W. G. Hoover, “Canonical Dynamics: Equilibrium Phase-Space Distributions”, Physical Review A 31, 1695-1697 (1985).
- (4) W. G. Hoover and B. L. Holian, “Kinetic Moments Method for the Canonical Ensemble Distribution”, Physics Letters A 211, 253-257 (1996).
- (5) N. Ju and A. Bulgac, “Finite-Temperature Properties of Sodium Clusters”, Physical Review B 48, 2721-2732 (1993).
- (6) G. J. Martyna, M. L. Klein, and M. Tuckerman, “Nosé-Hoover Chains: the Canonical Ensemble via Continuous Dynamics”, The Journal of Chemical Physics 97, 2635-2643 (1992).
- (7) D. Kusnezov, A. Bulgac and W. Bauer, “Canonical Ensembles from Chaos”, Annals of Physics (NY) 204, 155-185 (1990).
- (8) A. Bulgac and D. Kusnezov, “Canonical Ensemble Averages from Pseudomicrocanonical Dynamics”, Physical Review A 42, 5045-5048 (1990).
- (9) P. K. Patra and B. Bhattacharya, “Non-Ergodicity of Nosé-Hoover Chain Thermostat in Computationally Achievable Time”, Physical Review E 90, 043304 (2014) = ariv : 1407.2353 (2014).
- (10) Wm. G. Hoover and C. G. Hoover, “Ergodicity of a Time-Reversibly Thermostated Harmonic Oscillator and the 2014 Ian Snook Prize”, Computational Methods in Science and Technology 20, 87-92 (2014).
- (11) W. G. Hoover, J. C. Sprott, P. K. Patra, and C. G. Hoover, “Deterministic Time-Reversible Thermostats : Chaos, Ergodicity, and the Zeroth Law of Thermodynamics”, ariv 1501.03875 ( 2015 ), submitted to Molecular Physics.
- (12) H. A. Posch, W. G. Hoover, and F. J. Vesely, “Canonical Dynamics of the Nosé Oscillator: Stability, Order, and Chaos”, Physical Review A 33, 4253-4265 (1986).
- (13) W. G. Hoover and H. A. Posch, “Direct Measurement of Equilibrium and Nonequilibrium Lyapunov Spectra”, Physics Letters A 123, 227-230 (1987).