Estimating Heterogeneous Treatment Effects for General Responses
Abstract
Heterogeneous treatment effect models allow us to compare treatments at subgroup and individual levels, and are of increasing popularity in applications like personalized medicine, advertising, and education. In this talk, we first survey different causal estimands used in practice, which focus on estimating the difference in conditional means. We then propose DINA — the difference in natural parameters — to quantify heterogeneous treatment effect in exponential families and the Cox model. For binary outcomes and survival times, DINA is both convenient and more practical for modeling the influence of covariates on the treatment effect. Second, we introduce a meta-algorithm for DINA, which allows practitioners to use powerful off-the-shelf machine learning tools for the estimation of nuisance functions, and which is also statistically robust to errors in inaccurate nuisance function estimation. We demonstrate the efficacy of our method combined with various machine learning base-learners on simulated and real datasets.
keywords:
Heterogeneous treatment effect; Exponential family; Cox model1 Introduction
The potential outcome model (Rubin, 1974) has received wide attention (Rosenbaum et al., 2010; Imbens and Rubin, 2015) in the field of causal inference. Recent attention has focused on the estimation of heterogeneous treatment effects (HTE), which allows the treatment effect to depend on subject-specific features. In this paper, we investigate heterogeneous treatment effects instead of average treatment effects due to the following reasons.
-
1.
In applications like personalized medicine (Splawa-Neyman et al., 1990; Low et al., 2016; Lesko, 2007), personalized education (Murphy et al., 2016), and personalized advertisements (Bennett and Lanning, 2007), the target population is not the entire study population but the subset some patient belongs to, and thus the heterogeneous treatment effect is of more interest (Hernán and Robins, 2010).
- 2.
For continuous responses, the difference in conditional means is commonly used as an estimator of HTE (Powers et al., 2018; Wendling et al., 2018). However, for binary responses or count data, no consensus of the estimand has been reached, and a variety of objectives have been considered. For instance, for dichotomous responses, conditional success probability differences, conditional success probability ratios, and conditional odds ratios all have been studied (Imbens and Rubin, 2015; Tian et al., 2012). In this paper, we propose to estimate a unified quantity — the difference in natural parameters (DINA) — applicable for all types of responses from the exponential family. The DINA estimand is appealing from several points of view compared to the difference in conditional means.
-
1.
Comparisons on the natural parameter scale are commonly adopted in practice. DINA coincides with the conditional mean difference for continuous responses, the log of conditional odds ratio for binary responses, and the log of conditional mean ratio for count data. In the Cox model (Cox, 1972), DINA corresponds to the log hazard ratio. In clinical trials with binary outcomes, the odds ratio is a popular indicator of diagnostic performance (Rothman, 2012; Glas et al., 2003). For rare diseases, the odds ratio is approximately equivalent to the relative risk, another commonly-used metric in epidemiology. In addition, for survival outcomes, the hazard ratio is frequently reported which measures the chance of an event occurring in the treatment arm divided by that in the control arm.
-
2.
It is convenient to model the influence of covariates on the natural parameter scale. For binary responses or count data, the types of outcomes impose implicit constraints, such as zero-one or non-negative values, making the modeling on the original scale difficult. In contrast, the natural parameters are numbers on the real line, and easily accommodate various types of covariate dependence.
-
3.
The difference in conditional means may exhibit uninteresting heterogeneity. Consider a vaccine example where before injections, the disease risk is among older people and among young people. It is not likely the absolute risk differences caused by some vaccine will be the same across age groups since the room for improvement is significantly different ( versus ). Still, the relative risk may be constant, for example, both young and old are less likely to get infected.
There are two critical challenges in the estimation of DINAs. Like the difference in conditional means, the estimation of DINA could be biased due to confounders — covariates that influence both the potential outcomes and the treatment assignment. Unlike the difference in conditional means, DINA estimators could potentially suffer from the “non-collapsibility” issue (Gail et al., 1984; Greenland et al., 1999; Hernán and Robins, 2010) on the natural parameter scale. As a result, even when there is no confounding, including a non-predictive covariate in the model will lead to a different estimator. The distinction between confounding and non-collapsibility is discussed in detail by Samuels (1981); Miettinen and Cook (1981); Greenland and Robins (1986).
In this paper, we propose a DINA estimator that is robust to the aforementioned confounding and non-collapsibility issues. The method is motivated by Robinson’s method (Robinson, 1988) and R-learner (Nie and Wager, 2017) proposed to deal with the conditional mean difference. Like R-learner, our method consists of two steps:
-
1.
Estimation of nuisance functions using any flexible algorithm;
-
2.
Estimation of the treatment effect with nuisance function estimators plugged in.
The method is locally insensitive to the misspecification of nuisance functions, and despite this inaccuracy is still able to produce accurate DINA estimators. By separating the estimation of nuisance functions from that of DINA, we can use powerful machine-learning tools, such as random forests and neural networks, for the former task.
The organization of the paper is as follows. In Section 2, we formulate the problem, discuss the difficulties, and summarize related work. In Section 3, we illustrate Robinson’s method and R-learner that our proposal is built on. In Section 4, we construct the DINA estimator for the exponential family and discuss its theoretical properties. In Section 5, we extend the DINA estimator to the Cox model based on full likelihoods and partial likelihoods, respectively. In Section 6, we assess the performance of our proposed DINA estimator on simulated datasets. In Section 7, we apply the DINA estimator to the SPRINT dataset, evaluating its robustness to designs of experiments. In Section 8, we briefly discuss the extension of our DINA estimator from single-level treatments to multi-level treatments. We conclude the paper with discussions in Section 9. All proofs are deferred to the appendix.
2 Background
2.1 Problem formulation
We adopt the Neyman-Rubin potential outcome model. Each unit is associated with a covariate vector , a treatment assignment indicator , and two potential outcomes , . We observe the response if the unit is under treatment, i.e., , and if the unit is under control, i.e., . We make the standard assumptions in causal inference (Imbens and Rubin, 2015).
Assumption 1 (Stable unit treatment value assumption).
The potential outcomes for any unit do not depend on the treatments assigned to other units.
Assumption 2 (Unconfoundedness).
The assignment mechanism does not depend on potential outcomes,
Assumption 3 (Overlap).
The probability of being treated, i.e., the propensity score , takes value in for some .
To facilitate asymptotic analyses, we introduce the super-population model
| (1) | ||||
| (2) | ||||
| (3) | ||||
where denotes the distribution of covariate, denotes the propensity score, and and denote the distributions of potential outcomes.
For survival analysis, we let , be the counterfactual censoring times and be the observed censoring time. Then if and if . Let be the observed censoring indicator. The observed responses are pairs . We make the following assumption on the counterfactual censoring times.
Assumption 4 (Censoring mechanism).
The counterfactual censoring times are independent of the survival times given the covariates and the treatment assignment,
and the counterfactual censoring times are unconfounded,
Assumption 4 implies that the counterfactual censoring times do not directly depend on the treatment assignment or survival times.
Let be the conditional control hazard rate at time , and similarly we define the conditional treatment hazard rate . We follow the Cox model (Cox, 1972) and make the proportional hazards assumption.
Assumption 5 (Proportional hazards).
The hazard rate functions follow
where denotes the baseline hazard function and , denote the exponential tilting functions.
In this paper, we aim to estimate the heterogeneous (conditional) treatment effects, denoted by . The exact form of depends on the type of the response.
-
1.
For continuous data, we use the difference of the conditional means
(4) -
2.
For binary responses, we use the difference of log conditional odds, i.e., the log of conditional odds ratio,
(5) -
3.
For count data, we use the difference of the log of conditional means, i.e., the log of conditional mean ratio,
(6) -
4.
For survival data, we use the difference of the log of conditional hazards, i.e., the log of hazards ratio,
(7) Under Assumption 5, does not depend on . Without further specification, we will omit and use .
If the responses indeed follow Gaussian, Bernoulli, Poisson distributions, or Cox model, then the above estimands are the differences in the treatment and control group natural parameter functions (DINA). While the conditional means are usually supported on intervals for non-continuous responses, natural parameter functions often take values over the entire real axis and are more appropriate for modeling the dependence on covariates.
Under Assumptions 1, 2, 3, the above causal estimands are identifiable. In fact, for non-survival responses,
where is the conditional mean in the treatment group. Estimands (4), (5), and (6) are functions of and , and thus estimable. For survival responses, since
the causal estimand (7) can be simplified so as not to depend on the counterfactuals and is identifiable.
In this paper, we work under the partially linear assumption (Robinson, 1988; Chernozhukov et al., 2018).
Assumption 6 (Semi-parametric model).
Assume the heterogeneous treatment effect follows the linear model
| (8) |
The partially linear assumption allows non-parametric nuisance functions (the natural parameter functions and the propensity score) and assumes that the heterogeneous treatment effect follows the linear model. Predictors in model (8) can be replaced by any known functions of the covariates. For instance, if the treatment effect is believed to be homogeneous, we will use ; if we are interested in the treatment effect in some sub-populations, we will design categorical predictors to specify the desired subgroups. Our method with non-parametric is discussed in Section 9.
The semi-parametric model encodes the common belief that the natural parameter functions are more complicated than the treatment effect (Hansen, 2008; Künzel et al., 2019; Gao and Han, 2020). Consider a motivating example of hypertension: the blood pressure of a patient could be determined by multiple factors over a long period, such as the income level and living habits, while the effect of an anti-hypertensive drug is likely to interact with only a few covariates, such as age and gender, over a short period.
2.2 Literature
There is a rich literature on using flexible modeling techniques to estimate heterogeneous treatment effects. Tian et al. (2012); Imai et al. (2013) formulate the estimation of heterogeneous treatment effects as a variable selection problem and consider a LASSO-type approach. Athey and Imbens (2015); Su et al. (2009); Foster et al. (2011) design recursive partitioning methods for causal inference and (Hill, 2011) adapts the Bayesian Additive Regression Trees (BART). Ensemble learners, such as random forests (Wager and Athey, 2018) and boosting (Powers et al., 2018), have been investigated under the counterfactual framework. In addition, neural network-based causal estimators have also been proposed (Künzel et al., 2018; Shalit et al., 2017).
More recently, meta-learners for heterogeneous treatment effect estimation are of increasing popularity. Meta-learners decompose the estimation task into sub-problems that can be solved by off-the-shelf machine learning tools (base learners) (Künzel et al., 2019). One common meta-algorithm, which we call separate estimation (SE) later, applies base learners to the treatment and control groups separately and then takes the difference (Foster et al., 2011; Lu et al., 2018; Hu et al., 2021; Foster et al., 2011). Another approach regards the treatment assignment as a covariate and uses base learners to learn the dependence on the enriched set of covariates. Künzel et al. (2019) propose X-learner that first estimates the control group mean function, subtracts the predicted control counterfactuals from the observed treated responses, and finally estimates treatment effects from the differences. X-learner is effective if the control group and the treatment group are unbalanced in sample size. A different approach R-learner (Nie and Wager, 2017), motivated by Robinson’s method (Robinson, 1988), estimates the propensity score and the marginal mean function (nuisance functions) using arbitrary machine learning algorithms and then minimizes a designed loss with the estimators of nuisance function plugged in to learn treatment effects. R-learner is able to produce accurate estimators of treatment effects from less accurate estimators of nuisance functions (more details are discussed in Section 3).
In this paper, we aim to employ available predictive machine learning algorithms to quantify causal effects on the natural parameter scale. In particular, we extend the framework of R-learner which focuses on the conditional mean difference to estimate differences in natural parameters and hazard ratios. Inherited from R-learner, our proposed method uses black-box predictors and is robust to observed confounders. Beyond R-learner, our proposed method provides quantifications of causal effects that may be of more practical use and protects against non-collapsibility under non-linear link functions.
3 Robinson’s method and R-learner
In this section, we briefly summarize Robinson’s method and R-learner. We highlight how Robinson’s method and R-learner provide protection against confounding. We also discuss the difficulty, non-collapsibility in the natural parameter scale, in extending Robinson’s method and R-learner.
We consider the additive error model. Let , be the conditional control and treatment group mean functions, and assume the error term satisfies . The additive error model takes the form
| (9) | ||||
Robinson’s method (Robinson, 1988) and R-learner (Nie and Wager, 2017) aim to estimate the difference of the conditional means .
Let be the marginal mean function. Model (9) can be reparametrized as
| (10) |
Robinson works under the semi-parametric assumption and proposes to estimate , , and in two steps:
-
1.
Estimation of nuisance functions. Estimate the propensity score and the marginal mean function .
-
2.
Least squares. Fit a linear regression model to response with offset and predictors .
R-learner adopts the same reparametrization (10) and the two-step procedure, but estimates non-parametrically. In the following, we will use Robinson’s method and R-learner interchangeably.
3.1 Confounding
Confounders are covariates that affect both the treatment assignment and potential outcomes. Confounders are common in observational studies. We show that R-learner is insensitive to confounding while separate estimation will produce biased estimators.
We consider an example of the additive error model (9) with
and . We adopt the propensity score and assume it is known. In the example, influences both the treatment assignment and potential outcomes, and is thus a confounder.
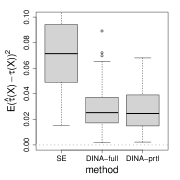
Separate estimation fits separate models in the control and treatment groups to get and , and then estimates the HTE by . For illustration, we estimate nuisance functions , by linear regression. By the design of propensity score, the distributions of are different in the control and treatment groups, and the best linear approximations , to are also different. Therefore, the estimator is far from zero and inconsistent (Figure 1 panel (a)).
In contrast, R-learner produces consistent estimators even if the estimator of the nuisance function is incorrect. Continuing from the example above, the true marginal mean function is . In the first step of R-learner, we also estimate the nuisance function by linear regression to make the comparison fair. In the second step, we regress the residuals on with the true propensity score provided. The residuals consist of three parts: the component of treatment effect , the bias of the nuisance-function estimator , and an uncorrelated noise . Since there is no treatment effect in the example, the residuals are essentially realizations of a function of covariates plus a zero-mean noise,
Notice that for any function of covariates ,
Therefore, the residuals are uncorrelated with the regressors (Figure 1 panel (b)), and the regression coefficients of R-learner are asymptotically zero and consistent.

(a)
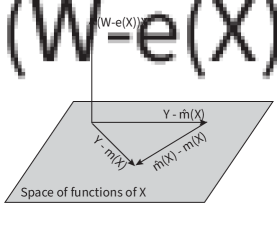
(b)
3.2 Non-collapsibility
Non-collapsibility refers to the phenomenon that the mean of conditional measures does not equal the marginal counterpart. Non-collapsibility (Fienberg, 2007; Greenland et al., 1999) and confounding are two distinct issues. In other words, even if there is no confounder, the non-collapsibility issue may arise when we use non-collapsible association measures. For example, we consider randomized experiments () and the exponential family model (12) with the logistic link. We assume the true natural parameter functions are
| (11) |
where is an unobserved binary random variable. For constant , the true treatment effect is the log odds ratio conditional on or , but may not equal the log of the marginal odds ratio. More generally, for natural parameter functions (11) and constant , the separate estimation method that estimates , by generalized linear regression is only consistent for Gaussian and Poisson responses (Gail et al., 1984). For non-constant , the separate estimation method is only consistent for Gaussian (Claim 1 in the appendix). Figure 2 verifies the non-collapsibility issue numerically.
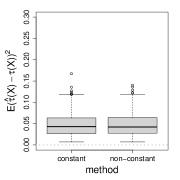
(a) linear link
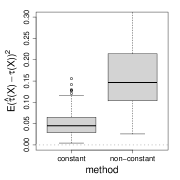
(b) log-link
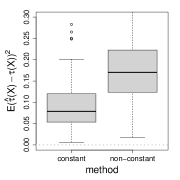
(c) logit-link
R-learner is designed to estimate the difference in conditional means but not natural parameter functions. Direct extension of R-learner to the natural parameter scale is infeasible: the response distribution conditional on the covariates is often not a member of the exponential family, and thus the marginal natural parameter function analogous to the marginal mean function is not well-defined. In Section 4 and 5, we introduce our extension that inherits the robustness to confounders from R-learner and provides protection against non-collapsibility on the natural parameter scale.
4 DINA for exponential family
In this section, we introduce our DINA estimator in the exponential family inspired by R-learner. We consider the following working model of the potential outcomes,
| (12) | ||||
Here , denote the natural parameters of the control group and the treatment group respectively, is the cumulant generating function, and is the carrier density. The distribution family (12) includes the commonly used Bernoulli and Poisson distributions, among others.
We start by rewriting the natural parameters in model (12) with Assumption 6 as
| (13) |
We then construct a baseline that is particular mixture of the natural parameters
| (14) | |||||
Here is a type of modified propensity score, with and the variance functions for the exponential family, where denotes the mean function (inverse of the canonical link function). This allows us to reparametrize (13)
| (15) |
R-learner for the Gaussian distribution uses , (since in this case), and is able to produce unbiased even if is misspecified. Similarly, as shown in Proposition 4 in the appendix, we designed and so that even if we start with an inaccurate baseline , we can still arrive at the true DINA parameter .
For linear canonical link function (R-learner), the equation in Claim 1 is exact with no remainder term. For arbitrary canonical link functions, the marginal conditional mean approximately equals if the treatment effect is relatively small in scale compared to the marginal mean function .
Based on (14), we propose the following two-step estimator (details in Algorithm 1):
-
1.
Estimation of nuisance functions. We estimate the functions and in (14), using estimators of the propensity score and the natural parameter functions and .
-
2.
Maximum likelihood estimator (MLE). Fit a generalized linear regression model to response with offset and predictors .
We remark that the construction (14) can also be regarded as designing Neyman’s orthogonal scores (Neyman, 1959; Newey, 1994; Van der Vaart, 1998) specialized to the potential outcome model with the exponential family (Claim 4 in Appendix A.1).
We explain why the robustness to the nuisance-function estimators protects the proposed method from confounding and non-collapsibility. In fact, provided with the true nuisance functions, the MLE of is well-behaved despite confounding and non-collapsibility. Since the proposed method is insensitive to the misspecification of nuisance functions, the DINA estimator will remain close to that using the accurate nuisance functions. In contrast, the separate estimation method relies more heavily on precise nuisance-function estimation, and is prone to confounding and non-collapsibility.
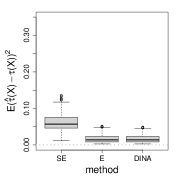
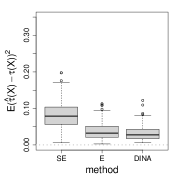
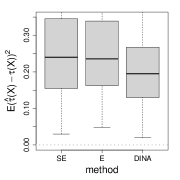
We demonstrate the improvement of our proposed method over separate estimation and the direct extension of R-learner with Poisson responses. Here the direct extension of R-learner refers to the configuration , in (15). We focus on the confounding and non-collapsibility issues, and design three scenarios: (a) confounding only; (b) non-collapsibility only; (c) confounding and non-collapsibility. In Figure 3, the proposed method is insensitive to both the confounding and the non-collapsibility issues.
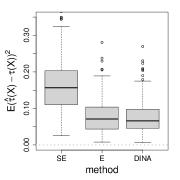
(a) confounding only
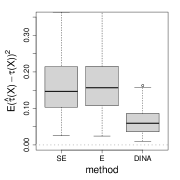
(b) non-collapsibility only
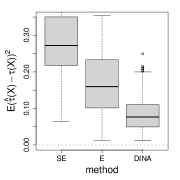
(c) confound.&non-collaps.
Next we provide some intuition for the proposed method, details of the implementation, and some theoretical properties.
4.1 Interpretation
We provide insights into Algorithm 1 by comparing it to R-learner. As discussed above, Algorithm 1 is an extension of R-learner, and shares its motivation as well as the method skeleton. The major difference lies in the nuisance functions (14). In R-learner, equals the propensity function ; in the proposed DINA estimator, not only depends on but also the variance functions and for the particular exponential family. Since lies between 0 and 1, it can be decomposed as
| (16) |
is large if a unit is likely to be treated or their response under treatment has higher variance than under no treatment. As a result, the not only balances the treatment group and the control group, but also reduces the impact of differential variance between the two groups. For more comments on the adjustment based on , see the multi-valued treatment setting in Section 8.
4.2 Algorithm
Similar to R-learner, we estimate the DINA in (15) in two steps. We estimate nuisance functions (14) and the DINA using independent subsamples so that the estimation of the nuisance functions does not interfere with that of DINA. We employ cross-fitting (Chernozhukov et al., 2018) to boost data efficiency. We now give details.
In the first step, we estimate the nuisance functions and in (14). These in turn depend on the propensity score , and separate estimators of and . Given these latter two, the variance functions and are immediately available from the corresponding exponential family. For example for the binomial family, we have that , where . The propensity scores can be estimated by any classification methods that provide probability estimates. Likewise the functions and can be separately estimated by any suitable method that operates within the particular exponential family.
Upon obtaining , , and , we plug them into (14) to get and . We remark that though we can directly use the difference of the two estimators , as a valid DINA estimator — separate estimation — we show in Proposition 1 that our method yields more accurate DINA estimators. Note that in the case of the Gaussian distribution, , , and we can directly estimate by any conditional mean estimator of given and avoid having to separately estimate and .
In the second step, we maximize the log-likelihood corresponding to (15) with the functions and fixed from the first step111If there are collinearity or sparsity patterns, penalties such as ridge and LASSO can be directly added to the loss function.. The function is regarded as an offset, and the function is used to construct the predictors . The second step can be implemented, for example, using the glm function in R.
-
1.
Estimation of . Estimate the propensity scores by any classification method that provides probability estimates, such as logistic regression, random forests, or boosting.
-
2.
Estimation of , . Estimate the natural parameter functions and based on the control group and the treatment group respectively, such as through fitting generalized linear models, random forests, or boosting.
-
3.
Substitution. Plug the estimators , , into (14) and get . Further let .
| (17) | ||||
From the practical perspective, Algorithm 1 decouples the estimation of DINA from that of the nuisance functions and allows for flexible estimation of nuisance functions. Though the nuisance functions and are complicated, various methods are applicable since there are no missing data in the nuisance-function estimation. By modularization, in step one, we are free to use any off-the-shelf methods, and in step two, we solve the specially designed MLE problem with the robustness protection.
4.3 Theoretical properties
The motivation behind the method is to gain robustness to nuisance functions, and we make our idea rigorous in the following proposition.
Proposition 1.
Under the regularity conditions:
-
1.
Covariates are bounded, the true parameter is in a bounded region , nuisance functions , and nuisance-function estimators , are uniformly bounded;
-
2.
The minimal eigenvalues of the score derivative in are lower bounded by , .
Assume that222The norm is defined as . , , , then
Proposition 1 states that for to achieve a certain accuracy, the conditions on and are relatively weak. This implies the method is locally insensitive to the nuisance functions, and thus is robust to noisy plugged-in nuisance-function estimators. In other words, we can view Algorithm 1 as an accelerator: we input crude estimators , , and , and Algorithm 1 outputs twice accurate DINA estimators compared to the simple difference . As a corollary of Proposition 1, if both and can be estimated at the rate , then the DINA can be estimated at the parametric rate .
5 DINA for Cox model
In this section, we first draw a connection between the Cox model and the exponential family using the full likelihood, and further generalize Algorithm 1 to the Cox model. We then discuss how the generalized method fits in the partial-likelihood framework.
Let be the baseline cumulative hazard function, i.e., . We assume the potential outcomes follow
| (18) | ||||
In the Cox model, the baseline hazard function is shared among all subjects, and the hazard of a subject is the baseline multiplied by a unique tilting function independent of the survival time (the proportional hazards assumption).
5.1 Full likelihood
The following proposition illustrates a connection between the Cox model and the exponential distribution.
Claim 2.
Assume the Cox model (18) and for . Then and follow the exponential distribution with rate and , respectively.
If there is no censoring and the hazard function is known, Claim 2 implies the Cox model estimation can be simplified to the case based on exponential distribution with responses and the log-link.
Now we discuss the Cox model with censoring under Assumption 4. Similar to Section 4, in Proposition 5 in the appendix, we derived a result analogous to (14),
| (19) | ||||
under the reparametrization (15) to provide protection to misspecified nuisance functions. The depends on the propensity score as well as the probability of being censored. Plugging the , in (19) into Algorithm 1 leads to the hazard ratio estimator of the Cox model (Algorithm 2).
-
1.
Estimation of . The same as Algorithm 1.
-
2.
Estimation of , . We maximize the full likelihood on the control and treatment group respectively provided with the hazard function , and obtain estimators , .
-
3.
Estimation of the probability of not being censored. We estimate the not-censored probabilities by closed form solution, numerical integral, or classifiers with response and predictors .
-
4.
Substitution. We construct and according to (19) based on , , , and .
| (20) | ||||
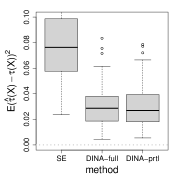
In Figure 4, we illustrate the efficacy of the proposed method applied to the Cox model with known baseline hazard. We consider the baseline hazard function , and uniform censoring with , , censored units. The tilting functions , are non-linear, and we approximate them by linear functions. We observe that regardless of the magnitude of censoring, the proposed method makes significant improvements over the separate estimation method. As the censoring gets heavier, in (19) differs more from , and thus the proposed method outperforms the direct extension of R-learner by larger margins.
(a) censored
(b) censored
(c) censored
We discuss several special instances of (19). In particular, we consider the subcases that the censoring times satisfy , i.e., the conditional distributions of the censoring times are the same across the treatment and control arms.
-
1.
No treatment effect. If there is no treatment effect, then the distributions of and are conditionally independent of the treatment assignment indicator . As a result, the probability ratio of not being censored is one and — R-learner.
-
2.
Light censoring. If the proportion of censored units is small, the censoring time will be longer than the survival time despite the treatment effect, suggesting the ratio of not being censored to be close to one. Consequently, the case approximately reduces to R-learner.
-
3.
Heavy censoring. If the proportion of censored units is high, then as argued by Lin et al. (2013), almost all the information is contained in the indicator , and we can directly model the rare event — “not censored” by Poisson distribution. In this case,
(21) and plug (21) in (19) gives the and corresponding to a Poisson distribution.
To provide intuition for Algorithm 2, we compare the nuisance-function construction (19) with that of the direct extension of R-learner and the DINA estimator for the exponential family (Algorithm 1). Different from R-learner, the in (19) also relies on the censoring probabilities under treatment and control. For a unit with covariate value , the multiplier associated with the HTE in (15) is smaller for compared to if the unit tends to be censored under treatment. Consequently, the weight emphasizes more the units not censored, which agrees with the common sense that censored units contain less information. Compared with (14), (19) does not include the derivatives due to different parameter scales (variances): in the Cox model, we focus on the tilting functions instead of the natural parameters in the exponential family.
We now probe into the implementation details in Algorithm 2. Algorithm 2 is reminiscent of Algorithm 1 except in the estimation of , and in particular, the estimation of the censoring probabilities. We list several common random censoring mechanisms and the associated probabilities of “not censored” in Table 1. If the censoring mechanism is known, for example, all the units are enrolled simultaneously and operate for the same amount of time (singly-censored), then we can compute the censoring probabilities in closed form or via numerical integration given rough nuisance-function estimators , . If the censoring mechanism is unknown, we can directly estimate the censoring probabilities from the data: solving the classification problem with the response , predictors by any classifier that comes with predicted class probabilities. If the censoring is extremely low or high, we can turn to the aforementioned special instances.
Censoring Parameters Density of censoring Probability of “not censored” mechanism times No censoring - Singly-censored Multiply- censored Uniform Weibull ,
In the following proposition, we extend the robustness property of Algorithm 1 in Proposition 1 to Algorithm 2.
Proposition 2.
To end the section, we discuss how to carry out the estimation when the baseline hazard is inaccessible. One option is to start with estimating the baseline hazard, and plug it in for subsequent procedures. Another option is using the partial likelihood that cleverly avoids the baseline hazard (see Section 5.2 for more details). We remark that the proposed method is not provably robust to the baseline hazard misspecification.
5.2 Partial likelihood
Instead of focusing on the full likelihood, Cox (1972) proposes to maximize the partial likelihood. The partial likelihood is prevalent in practice because it does not require the baseline hazard function and preserves promising statistical properties (Tsiatis, 1981; Andersen and Gill, 1982).
Van der Vaart (1998) shows that the partial likelihood can be obtained from the full likelihood (58) by profiling out the baseline hazard
where denotes the cumulating hazard at if the subject is not censored. Let be the baseline hazard estimators associated with the partial likelihood maximization. As a corollary, the partial likelihood maximizer is equivalent to that of the full likelihood with . The connection motivates Algorithm 3 — an application of Algorithm 2 with the true hazard baseline function replaced by from the partial likelihood maximization.
-
1.
Estimation of . The same as Algorithm 1.
-
2.
Estimation of , . We maximize the partial likelihoods on the control and treatment group respectively, and obtain estimators , .
-
3.
Estimation of the probability of not censored. We estimate the not censored probabilities by closed form solution, numerical integral, or classifiers with response and predictors ;
-
4.
Substitution. We construct and according to (19) based on , , , and .
| (22) | ||||
We first numerically compare the estimators based on the full likelihood (given the true baseline hazard function) and the partial likelihood. We consider three cumulative baseline hazard functions , , and , corresponding to Weibull distributions with shape parameters , , and . We adopt the uniform censoring and fix the proportion of censored units at . The baseline parameters, the separate estimation method, and the proposed method based on the full likelihood are the same as Figure 4. In Figure 5, the partial likelihood based estimator performs comparatively to that based on the full likelihood despite the form of the baseline hazard function, and significantly improves the separate estimation method.
(a) Weibull shape
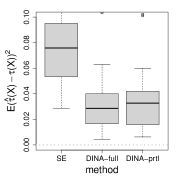
(b) Weibull shape
(c) Weibull shape
We investigate the theoretical properties of Algorithm 3. Under the null hypothesis, i.e., no treatment effect, the robustness in Proposition 1 is valid.
Proposition 3.
For non-zero treatment effects, Proposition 3 is in general not true. Despite the lack of theoretical guarantee, Algorithm 3 produces promising results over simulated datasets. In Figure 5, the partial-likelihood loss in performance is slight or even negligible compared to Algorithm 2, and it requires no baseline hazards knowledge — one of the fundamental merits of Cox model. Section 6 contains more empirical examples of Algorithm 3. Therefore, in many applications where baseline hazards are unavailable, we recommend Algorithm 3.
6 Simulation
In this section, we demonstrate the efficacy of the proposed method using simulated datasets.
6.1 Exponential family
We compare the following five meta-algorithms.
-
1.
Separate estimation (SE-learner). The separate estimation method estimates the control and treatment group mean functions , , takes the difference , and further regresses the difference on the covariates to obtain . The nuisance functions are the control and treatment group mean functions , and the method does not require the propensity score.
-
2.
X-learner (X-learner). X-learner first estimates the control group mean function , and then estimates by solving a generalized linear model with as the offset. The nuisance functions is the control group mean function and the method does not require the propensity score.
-
3.
Propensity score adjusted X-learner (PA-X-learner). Motivated by a thread of works (Vansteelandt and Daniel, 2014; Dorie et al., 2019; Hahn et al., 2020) including estimated propensity scores as a covariate, we consider an augmented X-learner where the control group mean function is learnt as a function of raw covariates, an estimated propensity score, and the interaction between. The rest of the approach is the same as X-learner above. The nuisance functions is the control group mean function and the propensity score .
-
4.
Direct extension of R-learner (E-learner). The direct extension of R-learner considers and the associated baseline for arbitrary response types. The rest is the same as Algorithm 1. The nuisance parameters are and .
We remark that the above extension to the natural parameter scale is different from the original R-learner which focuses on the difference in conditional means despite the type of responses.
- 5.
In the simulations below, we obtain by logistic regression and , by fitting generalized linear models. Results of estimating , by tree boosting are available in Figure 7 in the appendix.
As for data generating mechanism, we consider covariates independently generated from uniform . The treatment assignment follows a logistic regression model. The responses are sampled from the exponential family with natural parameter functions
| (23) | ||||
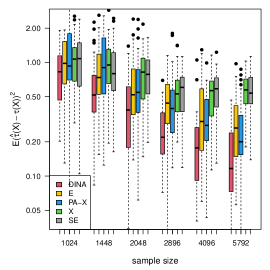
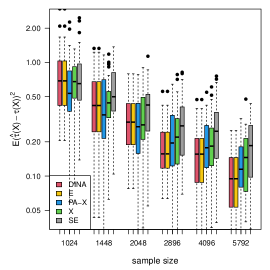
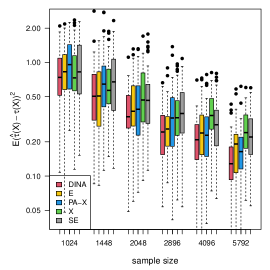
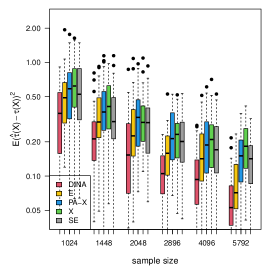
for some . In both treatment and control groups, the response models are misspecified generalized linear models, while the difference of the natural parameters is always linear. We consider continuous, binary, and discrete responses generated from Gaussian, Bernoulli, and Poisson distributions, respectively. We quantify the signal magnitude by the following signal-to-noise ratio (SNR)
SNRs of all simulation settings are approximately .
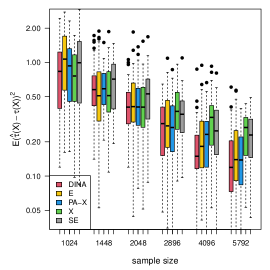
We measure the estimation performance by the mean squared error , where the expectation is taken over the covariate population distribution. Results are summarized in Figure 6. Across three types of responses, our proposed method (DINA), direct extension of R-learner (E), and propensity score adjusted X-learner (PA-X) performs relatively better than X-learner (X) and separate estimation (SE). Among the three well-performed methods, our proposed method approximately achieves the parametric convergence rate and is more favorable for count data. As for X-learner and separate estimation, the errors stop decreasing as the sample size increases due to the non-vanishing bias.
(a) continuous
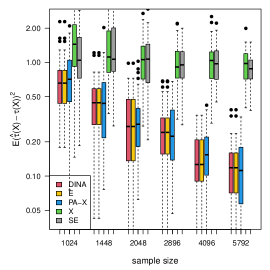
(b) binary
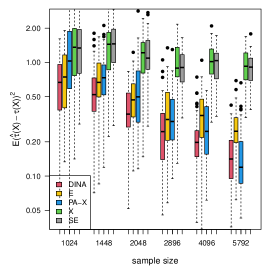
(c) count data
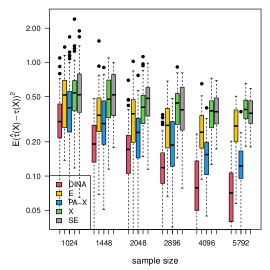
(d) survival data
We use bootstrap ( bootstrap samples) to construct confidence intervals for . We remark that because of sampling with replacement, different folds of data from a bootstrap sample may overlap and the associated may be seriously biased. However, from bootstrap samples can still be used to estimate the standard deviation of . Table 2 demonstrates the coverage and width of the confidence intervals with Poisson responses. We estimate the propensity score by logistic regression and baseline natural parameter functions by Poisson regression. The proposed method (DINA) produces the best coverages for all and sample sizes. The propensity score adjusted X-learner (PA-X) produces the second-best coverages but requires wider confidence intervals. For the direct extension of R-learner (E), X-learner (X), and separate estimation (SE), the coverages of confidence intervals ( in particular) decrease as the sample size grows. The phenomenon is due to the non-vanishing bias in those estimators. Results of confidence intervals for other types of data and nuisance-function learners are similar and can be found in the appendix.
Sample Meth- size od cvrg width cvrg width cvrg width cvrg width cvrg width cvrg width 1024 DINA 0.92 0.679 0.92 0.716 0.93 0.646 0.93 0.631 0.96 0.642 0.94 0.379 E 0.57 0.706 0.48 0.732 0.97 0.661 0.93 0.639 0.94 0.640 0.93 0.452 PA-X 0.94 0.880 0.89 0.91 0.97 0.669 0.95 0.666 0.94 0.666 0.93 0.419 X 0.08 0.636 0.94 0.691 0.95 0.597 0.92 0.603 0.91 0.584 0.91 0.417 SE 0.03 0.628 0.94 0.698 0.99 0.599 0.93 0.591 0.93 0.591 0.94 0.421 1448 DINA 0.96 0.553 0.92 0.580 0.91 0.546 0.95 0.534 0.91 0.526 0.94 0.314 E 0.44 0.569 0.45 0.605 0.91 0.540 0.98 0.536 0.94 0.524 0.96 0.372 PA-X 0.87 0.734 0.86 0.746 0.95 0.554 0.93 0.552 0.93 0.544 0.95 0.339 X 0.00 0.536 0.93 0.573 0.93 0.495 0.93 0.500 0.96 0.496 0.87 0.349 SE 0.04 0.532 0.95 0.587 0.97 0.500 0.94 0.492 0.94 0.499 0.93 0.349 2048 DINA 0.97 0.478 0.91 0.491 0.91 0.450 0.90 0.450 0.96 0.449 0.95 0.271 E 0.37 0.485 0.30 0.519 0.91 0.462 0.93 0.445 0.96 0.446 0.96 0.314 PA-X 0.87 0.589 0.73 0.636 0.96 0.466 0.95 0.458 0.91 0.449 0.93 0.282 X 0.00 0.447 0.93 0.486 0.95 0.422 0.95 0.424 0.93 0.422 0.91 0.297 SE 0.01 0.435 0.92 0.483 0.98 0.425 0.99 0.418 0.95 0.413 0.96 0.292 2896 DINA 0.89 0.393 0.91 0.413 0.98 0.378 0.92 0.370 0.93 0.370 0.97 0.225 E 0.14 0.402 0.09 0.429 0.93 0.382 0.95 0.374 0.98 0.380 0.92 0.263 PA-X 0.72 0.493 0.73 0.513 0.95 0.386 0.97 0.379 0.96 0.378 0.95 0.237 X 0.00 0.378 0.97 0.410 0.93 0.347 0.95 0.348 0.96 0.349 0.91 0.245 SE 0.00 0.383 0.95 0.404 0.94 0.358 0.93 0.349 0.93 0.347 0.97 0.243 4096 DINA 0.97 0.339 0.86 0.343 0.88 0.317 0.96 0.314 0.95 0.315 0.96 0.186 E 0.02 0.332 0.06 0.364 0.91 0.317 0.97 0.318 0.94 0.311 0.90 0.213 PA-X 0.65 0.411 0.64 0.430 0.98 0.323 0.93 0.312 0.96 0.315 0.91 0.200 X 0.00 0.312 0.91 0.339 0.99 0.292 0.95 0.293 0.97 0.290 0.86 0.205 SE 0.00 0.315 0.90 0.344 0.98 0.293 0.96 0.292 0.96 0.296 0.86 0.206 5792 DINA 0.95 0.276 0.94 0.291 0.92 0.269 0.94 0.260 0.95 0.261 0.93 0.158 E 0.00 0.283 0.01 0.306 0.88 0.266 0.94 0.267 0.94 0.262 0.86 0.182 PA-X 0.52 0.348 0.51 0.367 0.93 0.267 0.93 0.264 0.95 0.260 0.87 0.166 X 0.00 0.266 0.91 0.287 0.91 0.245 0.94 0.247 0.95 0.247 0.84 0.172 SE 0.00 0.263 0.86 0.288 0.97 0.254 0.96 0.245 0.92 0.246 0.84 0.173
6.2 Cox model
We consider the five methods in Section 6.1 under the framework of Algorithm 3 (partial-likelihood). We follow model (23) and use the baseline hazard function , uniform censoring ( units censored). In step one, we obtain by logistic regression and , by fitting Cox proportional hazards regression models. In step two, all methods estimate by maximizing the partial likelihoods. From the panel (d) of Figure 6, we observe that the proposed method with partial-likelihood behaves the most favorably. Results of confidence intervals can be found in the appendix.
7 Real data analysis
In this section, we apply the estimators to the SPRINT dataset analyzed by Powers et al. (2018). The data is collected from a randomized trial aiming to study whether a new treatment program targeting reducing systolic blood pressure (SBP) will reduce cardiovascular disease (CVD) risk. The response is whether any of the major CVD events444Major CVD events: myocardial infarction (MI), non-MI acute coronary syndrome (non-MI ACS), stroke, heart failure (HF), or death attributable to cardiovascular disease. occur to a participant. We start with continuous lab measurements, follow the data preprocessing procedures of Powers et al. (2018), and end up with samples. The descriptive statistics of the data after preprocessing are given in Table 3. Since SBP and DBP, EGFR and SCREAT are seriously correlated, respectively, we further remove DBP and SCREAT and are left with covariates. We scale the covariates to have zero mean and unit variance. Our goal is to estimate the heterogeneous treatment effect in the scale of odds ratio.
We consider the five methods in Section 6. Since the data is collected from a randomized trial, the propensity score is . We estimate two natural parameter functions using random forests. We obtain confidence intervals by bootstrap ( bootstrap samples).
Type Abbrevation Feature Treatment Group Control Group Group size — — SBP Seated systolic blood pressure (mm Hg) DMP Seated diastolic blood pressure (mm Hg) EGFR eGFR MDRD (mL/min/1.73m2) SCREAT Serum creatinine Lab meas- (mg/dL) urements CHR Cholesterol (mg/dL) GLUR Glucose (mg/dL) HDL HDL-cholesterol direct (mg/dL) TRR Triglycerides (mg/dL) UMALCR Urine Albumin/Creatinine ratio (mg/g)
7.1 Results from randomized experiment
Table 4 displays the estimated coefficients of DINA using random forests as the nuisance-function learner. The proposed method, propensity score adjusted X-learner, and X-learner produce negative intercepts significant at the level. The estimated intercept of DINA is negatively significant, which implies that for a patient with average covariate values, the treatment decreases the odds of experiencing any CVD events. The result largely agrees with the original clinical results where researchers observed the treatment group were performing better555The original study focuses on average treatment effects on the scale of probability per year. The treatment group sees incidence per year and the control group sees incidence per year.. As for heterogeneity in the treatment effect, our proposal finds EGFR as a significant effect modifier. In particular, the estimated coefficient of EGFR is negative, indicating that the treatment is more beneficial to patients with high EGFR.
Abbreviation DINA E PA-X X SE SBP 0.109 0.101 0.313 0.255 0.135 95% CI [-0.169, 0.387] [-0.166, 0.368] [-0.030, 0.656] [-0.072, 0.582] [-0.128, 0.398] EGFR -0.331 -0.353 -0.107 -0.086 -0.087 95% CI [-0.662, 0.000] [-0.725, 0.019] [-0.548, 0.334] [-0.412, 0.239] [-0.432, 0.258] CHR 0.111 0.129 -0.176 -0.141 -0.121 95% CI [-0.273, 0.495] [-0.238, 0.496] [-0.552, 0.200] [-0.480, 0.198] [-0.491, 0.249] GLUR -0.211 -0.205 -0.116 -0.0535 -0.156 95% CI [-0.501, 0.079] [-0.468, 0.058] [-0.455, 0.223] [-0.306, 0.199] [-0.454, 0.142] HDL -0.000 0.038 0.011 -0.030 -0.136 95% CI [-0.402, 0.401] [-0.366, 0.442] [-0.448, 0.470] [-0.426, 0.366] [-0.565, 0.293] TRR 0.103 0.098 0.218 0.082 0.026 95% CI [-0.267, 0.473] [-0.262, 0.459] [-0.219, 0.655] [-0.230, 0.393] [-0.305, 0.357] UMALCR 0.001 -0.045 -0.039 0.094 -0.057 95% CI [-0.228, 0.230] [-0.284, 0.194] [-0.257, 0.178] [-0.124, 0.311] [-0.253, 0.139] Intercept -0.433 -0.412 -0.350 -0.336 -0.246 95% CI [-0.735, -0.131] [-0.739, -0.085] [-0.730, 0.030] [-0.669, -0.003] [-0.583, 0.091]
7.2 Results from artificial observational studies
We compare the sensitivity to treatment assignment mechanisms. We generate subsamples from the original dataset with non-constant propensity score and compare the estimated treatment effects from the original randomized trial and those from the artificial observational data.
Let be an artificial propensity score following a logistic regression model. We subsample from the original SPRINT dataset with probabilities
In the artificial subsamples, the probability of a unit being treated is . We run five estimation methods on the artificial subsamples, obtain estimated treatment effects, and repeat from subsampling times. For nuisance-function estimation, we use logistic regression to learn the propensity score, and random forests or logistic regression to learn the treatment/control natural parameter functions.
For any method, we regard the estimates obtained from the original dataset as the oracle, denoted by , and compare with the estimates obtained from artificial subsamples, denoted by . We quantify the similarity by one minus the normalized mean squared difference,
| (24) |
The larger is, the closer is to its oracle . In other words, a method with a larger is more robust to the experimental design.
From Table 5 we observe the proposed method (DINA) produces the largest or the second-largest . The advantage is more evident when we use generalized linear regression as the nuisance-function learner.
Nuisance-function learner DINA E PA-X X SE Logistic regression 0.501 0.387 0.107 0.0982 -0.468 (0.186) (0.252) (0.522) (0.404) (0.772) Random forests 0.436 0.242 0.549 0.426 -1.44 (0.400) (0.458) (0.305) (0.328) (2.48)
8 Multi-valued treatment
In this section, we extend our method to address multi-valued treatments, a.k.a. treatments with multiple levels. Let be the treatment variable of levels, and let level denote the control group. Let be the indicator of receiving treatment , i.e., . We adopt the generalized propensity score of Imbens (2000)
| (25) | ||||
We denote the natural parameter under treatment by , and we aim to estimate the DINAs
| (26) |
We consider flexible control baseline and assume parametric forms of DINA as in (8),
| (27) |
The analysis with multi-valued treatments is reminiscent of that with single treatments in Section 4 and 5. We rewrite the natural parameters as
| (28) |
or more compactly
where , , , and . We look for and such that the DINA estimator is not heavily disturbed by inaccurate nuisance functions. Analogous to (14), we arrive at
| (29) | ||||
The interpretation of single-valued treatment in Subsection 4.1 holds. In (29), the weight is proportional to the treatment probability multiplied by the response conditional variance. The multiplier associated with the HTE in (15) is small under treatment if the unit is inclined to receive such treatment or its treated response has high conditional variance at . Consequently, the proposed method equalizes the influences of treatments from all levels and attenuates the effects of excessively influential samples.
The algorithms in Section 4 and 5 can be directly generalized to handle multi-valued treatments. As for nuisance functions, we estimate the generalized propensity score by any multi-class classifier that provides probability estimates. We estimate by obtaining first and plugging in to the appropriate exponential family formula for the variance.
Theoretically, Proposition 1, 2, 3 still hold, meaning that the proposed estimator will improve over separate estimation based on the nuisance-function estimators . Compared to single-level treatments, generalized propensity scores of multi-valued treatments may take more extreme values, especially values close to zero. Extreme propensities will cause IPW-type methods (Dudík et al., 2011; Weisberg and Pontes, 2015) to be highly variant, while the variances of R-learner as well as our extension will not explode. We remark that when is estimated with a large number of parameters, problematic extrapolations may happen in the regions absent from certain treatment groups.
9 Discussion
In this paper, we propose to quantify the treatment effect by DINA for responses from the exponential family and Cox model, in contrast to the conditional mean difference. For non-continuous responses, e.g., binary and survival data, DINA is of more practical interest, e.g., relative risk and hazard ratio, and is convenient for modeling the influence of covariates to the treatment effects. Similar to R-learner, we introduce a DINA estimator that is insensitive to confounding and non-collapsibility issues. The method is flexible in the sense that it allows practitioners to use powerful off-the-shelf machine learning tools for nuisance-function estimation.
There are several potential extensions of the proposed method.
-
1.
Non-parametric DINA estimation. The current method relies on the semi-parametric assumption (8). According to Nie and Wager (2017), the non-parametric extension of R-learner on estimating the difference in means is discussed. We can similarly extend the proposed method to allow non-parametric modeling. The only difference is that we maximize the log-likelihood over non-parametric learners instead of parametric families in the second step. For example, in Algorithm 1, we can instead solve the optimization problem
(30) where denotes some non-parametric function class.
-
2.
Cox model baseline hazard robustness. As mentioned in Section 5.1, the current method with full likelihood maximization is sensitive to a misspecified baseline hazard function. We argue in Section 5 that the misspecification of baseline hazard and that of natural parameters , are different in nature. We believe developing approaches targeting baseline-hazard robustness is an exciting direction.
10 Acknowledgement
This research was partially supported by grants DMS 2013736 and IIS 1837931 from the National Science Foundation, and grant 5R01 EB 001988-21 from the National Institutes of Health.
Appendix A Proofs
A.1 Exponential family
Claim 3.
Suppose the potential outcomes follow the exponential family model (12) with natural parameter functions (11). Assume the treatment assignment is randomized. Consider the separate estimation method that estimates the nuisance functions , by fitting generalized linear regressions to observed covariates . Then is consistent if and only if the canonical link function is linear.
Proof of Claim 3.
Under randomized experiment, the separate estimation method obeys the population moment equations
| (31) | ||||
On one hand, by Taylor’s expansion of (31),
| (32) | ||||
where the remainder term . Notice that by (31), does not depend on . Since (32) is true for arbitrary and , then is constant. Therefore, the link function is linear.
On the other hand, if the canonical link is linear, then we take the difference of the moment equations (31) in the control group and the treatment group and arrive at
| (33) | ||||
as long as is non-degenerate. ∎
Proposition 4.
Proof of Proposition 4.
By Lemma 1, for arbitrary , the log-likelihood of satisfies
| (34) | ||||
where and the residual . Maximizing the expectation of the quadratic approximation gives us
| (35) |
Thus, our target is equivalent to . By the definition of , the condition simplifies to
| (36) |
Note that in the exponential family, at true natural parameter functions , then by Taylor’s expansion of , (36) becomes
| (37) | ||||
Since the difference between the true parameters and : , is independent of the treatment assignment , the two terms on the right hand side of (37) can be merged together,
| (38) | ||||
We require condition (38) to be true for arbitrary approximation error direction , then
and subsequently ,
Plug , in and we have derived (14) from the robustness requirement of .
In fact, we can show (14) also protects the estimator from misspecified . Consider as an approximation of , and let . Then by Lemma 1,
where the residual term is defined as . The condition (36) becomes
Part (I) is similar to (37) and is approximately zero under (14). For part (II),
| (39) | ||||
by Taylor’s expansion. Therefore, the error in is at most the quadratic of that in , and the method is insensitive to the errors in . ∎
Lemma 1.
Let be generated from the model (12) with the natural parameter , then for arbitrary , the likelihood of satisfies
where .
Proof of Lemma 1.
Proof of Claim 1.
Under the model (12),
Therefore,
| (43) | ||||
where we use Taylor’s expansion in the last equality, is between , , and is between , . Recall that in (14), then
| (44) |
| (45) | ||||
where the residual is defined as
| (46) | ||||
Next, by (14),
| (47) |
Therefore, plug (47) into (45) and we have . Finally, by (44), (46), we have . ∎
Claim 4.
The score derived from (17) satisfies the Neyman’s orthogonality.
Proof of Claim 4.
Let , with , then the score function implied by (17) with nuisance parameters , is
| (48) | ||||
We take derivative of (48) with regard to and evaluate at ,
| (49) | ||||
Part (I) is zero by (14), and part (II) is zero because . Therefore, (49) is zero. Next, we take derivative of (48) with regard to and evaluate at ,
| (50) | ||||
By (14), (50) is zero. Therefore, the score derived from (17) satisfies the Neyman’s orthogonality. ∎
Proof of Proposition 1.
Rewrite , , where and are one. By the assumption that , converge at rate , we have , . Let denote the score function of the -th sample, and define the empirical score . For simplicity, we write as , then the derivatives of the score take the form
Similarly we have the second order derivatives.
We first show is consistent. Taylor’s expansion of at is
| (51) | ||||
where , . Furthermore, Taylor’s expansion of at the true is
| (52) | ||||
where . By central limit theorem (CLT),
| (53) |
Under the regularity condition, is Lipschitz in and is bounded, then by the uniform law of large numbers (ULLN),
| (54) |
Thus for large enough, the minimal eigenvalue of is at least half of the minimal eigenvalue of and is lower bounded by . Notice that , are bounded, we plug Eq. (52), (53), (54) in Eq. (51),
Therefore, is consistent.
We next prove the convergence rate of . The second order Taylor’s expansion of at and is
| (55) | ||||
where , , . The first order Taylor’s expansion of at is
| (56) | ||||
where we apply CLT again in the second last equation, and use in the last equation. Similar analysis can be done for . Plug Eq. (53), (56) into Eq. (55),
| (57) | ||||
where we use the condition that the second derivatives are bounded. As shown above, the minimal eigenvalue of is uniformly lower bounded by . Thus Eq. (57) implies
and we finish the proof. ∎
A.2 Cox model
Proof of Claim 2.
Since , then is strictly increasing and there exists an inverse function . We compute the cumulative distribution function of ,
Therefore follows the exponential distribution with rate . ∎
Proposition 5.
Proof of Proposition (5).
We write down the full log-likelihood
| (58) |
We stick to the reparametrization (15) and derive the robust to baseline model misspecifications. Let be an approximation of the baseline function, and . A similar quadratic approximation as Lemma 1 gives us666We omit the part independent of in the right hand side of (59).
| (59) | ||||
Maximizing the expectation of the quadratic term yields
| (60) |
Our target is equivalent to
| (61) |
| (62) |
where denotes the conditional density of the censoring time. Notice that is independent of the treatment assignment and can be in arbitrary direction, then the condition (62) entails
∎
Lemma 2.
Let be generated from the Cox model (18) with the natural parameter function . Consider random censorship and let be the conditional density of the censoring time. Then
Proof of Lemma 2.
By definition, the first equality in Lemma 2 is true. For the second equality, by definition and random censorship,
where we use . ∎
Proof of Proposition 2.
To show Proposition 2 is true, we only need to verify the score function is Neyman’s orthogonal, and the rest of the proof is the same as that of Proposition 1.
The score equation of the full likelihood function at , is
| (63) | ||||
The derivative of (63) with regard to evaluated at and is
| (64) | ||||
By Lemma 2 and (19), (64) becomes
Next, the derivative of (63) with regard to evaluated at and is
| (65) | ||||
The third term in (65) is zero by the same argument of (64). For the second term, by Lemma 2,
Therefore, combine the three terms and we prove (65) is zero. In this way, we have verified the Neyman’s orthogonality of the full likelihood score. ∎
Analysis of Algorithm 3.
The partial likelihood proposed by (Cox, 1972) is
| (66) |
where the risk set of subject is defined as . We follow the notations in (Tsiatis, 1981) and analyse the asymptotic value of the partial likelihood (66)
| (67) |
where is the expected probability that the censored survival time of a randomly selected unit is no longer than . We continue to use the notations in the full likelihood analysis and obtain by Lemma 3
| (68) | ||||
where is a positively definite weight matrix. To guarantee the robustness to baseline parameters, we look for such that in (68) is zero. Nevertheless, the in (19) ensures part to be zero, but not part , and thus Proposition 1 is not valid. We comment that part is difficult to handle due to the three expectations and the integration, which inhibits the construction of the desired . ∎
Lemma 3.
Let be generated from the Cox model (18) with the natural parameter function . Then for and , the asymptotic partial likelihood satisfies
where is a positively definite weight matrix.
Proof of Lemma 3.
By (67), the asymptotic partial likelihood obeys
For part (I), by the random censoring mechanism,
| (69) |
For part (II), we apply the approximation and get
where the residual , and thus is . Notice that
thus (II.b) is approximately a quadratic term of .
For part (II.a), notice that ,
We first compute the first term (II.a.1). By Assumption (4) and , we exchange the order of expectation and integral,
| (70) | ||||
where we use Lemma 2 in the last equality. Since ,
| (71) | ||||
Combine (II.a.1) in (71) and (I) in (69),
| (72) | ||||
In this way, gives part (a) in Lemma 3. Furthermore, (II.a.2) gives part (b) in Lemma 3. Combine all parts and we finish the proof. ∎
Proof of Proposition 3.
To show Proposition 3 is true, we only need to verify the asymptotic score is Neyman’s orthogonal if , and the rest of the proof is the same as Proposition 1.
According to (Tsiatis, 1981), the score equation of the partial likelihood function at , , and is asymptotically
| (73) | ||||
where with the true parameter . The derivative of the score (73) with regard to evaluated at and is
| (74) | ||||
Part (I) is zero for arbitrary by the analysis of (II.a) in (70) and (19). As for part (II), recall the definition of and that ,
Next, the derivative of the score (73) with regard to evaluated at , is
| (75) | ||||
The analysis of part (I’a) and (II’) are the same as that of part (I) and (II) in (74). For part (I’b), for arbitrary , the analysis of (70) shows
which cancels the term in (75). Then combine all parts together and we have shown (75) is zero. ∎
Appendix B Additional figures
We display the simulation results with gradient boosting as the nuisance-function learners in Figure 7. In order to demonstrate the robustness of the proposed method to inaccurate nuisance-function estimators, in gradient boosting, we consider a small number () of trees, learning rate , and tree-depth . We limit the number of trees and the nuisance-function estimators will underfit the data. The results show that the proposed estimator is the most robust to inaccurate nuisance-function estimators.
(a) continuous
(b) binary
(c) count data
(d) survival data
Appendix C Additional tables
In this section, we first display the coverage and width of the confidence intervals for various types of responses and nuisance-function estimators. We use bootstrap ( bootstrap samples) to construct confidence intervals for . Table 6 considers Gaussian responses and uses linear regression as the nuisance-function estimator; Table 7 considers binary responses and uses logistic regression as the nuisance-function estimator; Table 8 considers survival responses and uses Cox regression as the nuisance-function estimator; Table 9, 10, 11, and 12 use gradient boosting as the nuisance-function estimator and deal with Gaussian, binary, count, and survival responses, respectively.
We observe the proposed method (DINA) produces the best coverages for all and sample sizes. The propensity score adjusted X-learner (PA-X) produces the second-best coverages but requires wider confidence intervals. For the direct extension of R-learner (E) (except for Gaussian responses), X-learner (X), and separate estimation (SE), the coverages of confidence intervals (for in particular) decrease as the sample size grows. The phenomenon is due to the non-vanishing bias in those estimators.
Sample Meth- size od cvrg width cvrg width cvrg width cvrg width cvrg width cvrg width 1024 DINA 0.97 1.48 0.96 1.49 0.93 1.38 0.95 1.35 0.93 1.34 0.98 0.789 E 0.97 1.48 0.96 1.49 0.93 1.38 0.95 1.35 0.93 1.34 0.98 0.789 PA-X 0.97 1.56 0.93 1.56 0.91 1.46 0.94 1.44 0.96 1.47 0.97 0.787 X 0.50 1.35 0.48 1.36 0.91 1.29 0.96 1.27 0.95 1.25 0.99 0.811 SE 0.46 1.36 0.53 1.34 0.87 1.26 0.91 1.27 0.91 1.28 0.92 0.795 1448 DINA 0.96 1.26 0.96 1.26 0.96 1.10 0.95 1.13 0.92 1.13 0.91 0.660 E 0.96 1.26 0.96 1.26 0.96 1.10 0.95 1.13 0.92 1.13 0.91 0.660 PA-X 0.97 1.30 0.97 1.29 0.93 1.22 0.97 1.20 0.98 1.22 0.95 0.653 X 0.31 1.14 0.37 1.15 0.96 1.08 0.95 1.06 0.94 1.08 0.94 0.667 SE 0.35 1.14 0.40 1.17 0.97 1.08 0.92 1.05 0.94 1.08 0.97 0.669 2048 DINA 0.93 1.04 0.94 1.04 0.94 0.957 0.95 0.955 0.94 0.947 0.93 0.549 E 0.93 1.04 0.94 1.04 0.94 0.957 0.95 0.955 0.94 0.947 0.93 0.549 PA-X 0.93 1.07 0.95 1.05 0.95 1.00 0.96 1.01 0.99 0.991 0.95 0.544 X 0.25 0.975 0.24 0.946 0.95 0.891 0.97 0.886 0.95 0.898 0.94 0.576 SE 0.24 0.950 0.32 0.949 0.97 0.883 0.94 0.897 0.94 0.871 0.94 0.562 2896 DINA 0.93 0.869 0.94 0.884 0.94 0.796 0.96 0.794 0.98 0.789 0.93 0.454 E 0.93 0.869 0.94 0.884 0.94 0.796 0.96 0.794 0.98 0.789 0.93 0.454 PA-X 0.96 0.906 0.98 0.901 0.93 0.847 0.94 0.840 0.95 0.846 0.97 0.462 X 0.10 0.810 0.09 0.803 0.96 0.750 0.93 0.743 0.95 0.729 0.96 0.472 SE 0.13 0.833 0.12 0.822 0.95 0.748 0.95 0.751 0.94 0.761 0.93 0.466 4096 DINA 0.99 0.733 0.94 0.754 0.91 0.669 0.96 0.659 0.92 0.662 0.93 0.389 E 0.99 0.733 0.94 0.754 0.91 0.669 0.96 0.659 0.92 0.662 0.93 0.389 PA-X 0.96 0.749 0.96 0.739 0.94 0.705 0.99 0.685 0.95 0.707 0.98 0.380 X 0.01 0.685 0.04 0.682 0.92 0.629 0.97 0.642 0.97 0.627 0.97 0.397 SE 0.05 0.675 0.06 0.669 0.96 0.630 0.96 0.625 0.93 0.632 0.90 0.395 5792 DINA 0.95 0.618 0.95 0.621 0.93 0.559 0.96 0.556 0.96 0.561 0.97 0.325 E 0.95 0.618 0.95 0.621 0.93 0.559 0.96 0.556 0.96 0.561 0.97 0.325 PA-X 0.97 0.627 0.98 0.627 0.97 0.595 0.90 0.575 0.96 0.597 0.94 0.321 X 0.01 0.563 0.00 0.566 0.91 0.524 0.93 0.524 0.98 0.535 0.93 0.334 SE 0.01 0.573 0.00 0.557 0.88 0.519 0.93 0.528 0.95 0.521 0.95 0.332
Sample Meth- size od cvrg width cvrg width cvrg width cvrg width cvrg width cvrg width 1024 DINA 0.93 1.67 0.94 1.65 0.93 1.59 0.97 1.52 0.98 1.51 0.97 0.875 E 0.91 1.62 0.95 1.65 0.92 1.55 0.97 1.48 0.96 1.48 0.94 0.891 PA-X 0.93 2.24 0.97 2.07 0.97 1.90 0.93 1.86 0.96 1.82 0.99 1.08 X 0.45 1.49 0.85 1.57 0.96 1.46 0.93 1.42 0.99 1.41 0.95 0.930 SE 0.47 1.47 0.76 1.53 0.97 1.42 0.96 1.40 0.97 1.39 0.96 0.931 1448 DINA 0.95 1.37 0.96 1.38 0.97 1.30 0.96 1.25 0.96 1.26 0.89 0.727 E 0.88 1.31 0.92 1.36 0.98 1.25 0.97 1.23 0.97 1.24 0.89 0.715 PA-X 1.00 1.75 0.96 1.59 0.96 1.54 0.96 1.46 0.98 1.49 0.98 0.887 X 0.26 1.23 0.80 1.27 0.92 1.19 0.96 1.15 0.97 1.16 0.93 0.767 SE 0.30 1.22 0.79 1.30 0.92 1.20 0.96 1.16 0.92 1.16 0.90 0.760 2048 DINA 0.95 1.14 0.95 1.14 0.95 1.11 0.95 1.04 0.95 1.04 0.86 0.619 E 0.86 1.08 0.85 1.12 0.98 1.05 0.95 1.03 0.94 1.03 0.82 0.599 PA-X 0.95 1.41 0.92 1.27 0.96 1.21 0.93 1.21 0.97 1.20 0.95 0.693 X 0.14 1.02 0.78 1.06 0.95 1.00 0.96 0.950 0.97 0.943 0.80 0.616 SE 0.18 1.03 0.71 1.06 0.95 0.993 0.97 0.953 0.98 0.961 0.85 0.621 2896 DINA 0.95 0.941 0.87 0.921 0.93 0.902 0.97 0.872 0.95 0.867 0.95 0.503 E 0.82 0.896 0.79 0.931 0.90 0.866 0.96 0.832 0.95 0.857 0.84 0.494 PA-X 0.92 1.10 0.93 1.03 0.93 0.990 0.94 0.973 0.94 0.980 0.94 0.565 X 0.06 0.845 0.54 0.881 0.92 0.814 0.94 0.795 0.95 0.797 0.84 0.524 SE 0.05 0.847 0.62 0.901 0.92 0.836 0.95 0.801 0.97 0.803 0.89 0.523 4096 DINA 0.92 0.77 0.93 0.777 0.96 0.728 0.95 0.708 0.97 0.715 0.89 0.424 E 0.77 0.762 0.8 0.764 0.96 0.727 0.96 0.705 0.95 0.703 0.66 0.410 PA-X 0.95 0.921 0.84 0.849 0.92 0.827 0.94 0.807 0.94 0.813 0.95 0.457 X 0.00 0.705 0.54 0.734 0.92 0.692 0.97 0.674 0.97 0.668 0.80 0.437 SE 0.01 0.694 0.52 0.732 0.92 0.691 0.94 0.664 0.97 0.671 0.79 0.428 5792 DINA 0.92 0.647 0.85 0.658 0.96 0.638 0.97 0.608 0.97 0.600 0.82 0.358 E 0.73 0.633 0.66 0.648 0.96 0.611 0.97 0.582 0.94 0.589 0.69 0.351 PA-X 0.91 0.768 0.87 0.713 0.98 0.701 0.99 0.674 0.91 0.659 0.89 0.381 X 0.00 0.606 0.41 0.624 0.97 0.565 0.93 0.564 0.97 0.568 0.65 0.368 SE 0.00 0.594 0.39 0.624 0.92 0.575 0.97 0.558 0.95 0.552 0.68 0.360
Sample Meth- size od cvrg width cvrg width cvrg width cvrg width cvrg width cvrg width 1024 DINA 0.92 1.84 0.93 1.67 0.96 1.61 0.97 1.55 0.97 1.56 0.95 1.09 E 0.87 1.91 0.91 1.66 0.96 1.58 0.96 1.54 0.92 1.51 0.92 1.11 PA-X 0.95 3.38 0.98 3.23 0.97 2.14 1.00 2.01 0.97 2.04 0.97 1.20 X 0.97 1.62 0.75 1.53 0.93 1.40 0.96 1.41 0.97 1.38 0.95 0.971 SE 0.95 1.55 0.67 1.49 0.91 1.40 0.96 1.39 0.97 1.39 0.86 0.868 1448 DINA 0.92 1.52 0.88 1.33 0.93 1.29 0.97 1.29 0.94 1.27 0.90 0.885 E 0.77 1.55 0.94 1.36 0.96 1.27 0.96 1.25 0.93 1.27 0.88 0.879 PA-X 0.94 2.35 0.97 2.25 0.99 1.55 0.95 1.51 0.98 1.53 0.93 0.865 X 0.88 1.30 0.43 1.25 0.94 1.15 0.94 1.15 0.91 1.11 0.94 0.770 SE 0.89 1.29 0.51 1.26 0.95 1.15 0.93 1.15 0.95 1.15 0.83 0.718 2048 DINA 0.96 1.24 0.95 1.11 0.93 1.06 0.93 1.05 0.91 1.04 0.94 0.720 E 0.73 1.28 0.94 1.11 0.89 1.04 0.95 1.03 0.91 1.02 0.96 0.734 PA-X 0.92 1.77 0.94 1.68 0.97 1.20 0.95 1.19 0.98 1.18 0.94 0.672 X 0.92 1.08 0.25 1.02 0.91 0.954 0.95 0.943 0.94 0.963 0.94 0.639 SE 0.86 1.07 0.27 1.01 0.97 0.947 0.93 0.944 0.95 0.941 0.74 0.589 2896 DINA 0.93 1.04 0.88 0.926 0.93 0.868 0.95 0.866 0.94 0.873 0.90 0.586 E 0.72 1.05 0.91 0.939 0.94 0.869 0.97 0.855 0.93 0.855 0.96 0.595 PA-X 0.91 1.43 0.96 1.34 0.93 0.964 0.97 0.946 0.93 0.954 0.96 0.543 X 0.93 0.903 0.19 0.838 0.94 0.799 0.95 0.776 0.94 0.778 0.96 0.530 SE 0.88 0.881 0.19 0.844 0.95 0.785 0.90 0.772 0.95 0.788 0.56 0.468 4096 DINA 0.98 0.869 0.93 0.770 0.99 0.737 0.97 0.714 0.96 0.703 0.93 0.501 E 0.48 0.872 0.91 0.777 0.99 0.724 0.96 0.715 0.97 0.717 0.93 0.486 PA-X 0.92 1.14 0.94 1.06 0.98 0.805 0.97 0.786 0.98 0.772 0.92 0.453 X 0.90 0.758 0.05 0.711 1.00 0.667 0.97 0.677 0.98 0.663 0.93 0.439 SE 0.84 0.742 0.04 0.706 0.90 0.661 0.97 0.654 0.96 0.652 0.51 0.400 5792 DINA 0.93 0.715 0.93 0.633 0.93 0.605 0.94 0.594 0.92 0.595 0.93 0.410 E 0.39 0.720 0.96 0.646 0.93 0.600 0.95 0.585 0.91 0.584 0.91 0.408 PA-X 0.91 0.904 0.93 0.868 0.95 0.638 0.97 0.629 0.96 0.650 0.97 0.372 X 0.85 0.623 0.02 0.590 0.94 0.546 0.95 0.541 0.98 0.546 0.99 0.369 SE 0.82 0.619 0.00 0.590 0.97 0.549 0.94 0.542 0.94 0.541 0.30 0.327
Sample Meth- size od cvrg width cvrg width cvrg width cvrg width cvrg width cvrg width 1024 DINA 0.96 1.39 0.97 1.40 0.94 1.29 0.97 1.30 0.89 1.30 0.92 0.746 E 0.96 1.39 0.97 1.40 0.94 1.29 0.97 1.30 0.89 1.30 0.92 0.746 PA-X 0.93 1.43 0.86 1.35 0.92 1.26 0.99 1.21 0.95 1.20 0.95 0.787 X 0.87 1.34 0.75 1.40 0.95 1.27 0.96 1.18 0.94 1.22 0.94 0.784 SE 0.80 1.28 0.92 1.27 0.92 1.20 0.93 1.07 1.00 1.06 0.95 0.778 1448 DINA 0.99 1.16 0.91 1.14 0.93 1.09 0.94 1.11 0.88 1.11 0.94 0.617 E 0.99 1.16 0.91 1.14 0.93 1.09 0.94 1.11 0.88 1.11 0.94 0.617 PA-X 0.97 1.18 0.92 1.14 0.87 1.06 0.93 0.998 0.91 0.996 0.97 0.647 X 0.89 1.12 0.81 1.19 0.93 1.03 0.96 1.01 0.91 1.02 0.93 0.650 SE 0.85 1.04 0.89 1.05 0.91 0.968 0.96 0.88 0.91 0.887 0.92 0.650 2048 DINA 0.93 0.956 0.95 0.954 0.94 0.933 0.91 0.917 0.93 0.919 0.97 0.530 E 0.93 0.956 0.95 0.954 0.94 0.933 0.91 0.917 0.93 0.919 0.97 0.530 PA-X 0.96 0.992 0.89 0.965 0.91 0.900 0.90 0.837 0.94 0.821 0.95 0.546 X 0.82 0.927 0.74 0.970 0.90 0.888 0.93 0.84 0.97 0.821 0.96 0.547 SE 0.77 0.889 0.89 0.889 0.88 0.858 0.94 0.716 0.94 0.727 0.89 0.531 2896 DINA 0.92 0.797 0.87 0.819 0.94 0.765 0.89 0.758 0.95 0.765 0.94 0.446 E 0.92 0.797 0.87 0.819 0.94 0.765 0.89 0.758 0.95 0.765 0.94 0.446 PA-X 0.91 0.831 0.85 0.808 0.88 0.755 0.90 0.687 0.93 0.688 0.93 0.450 X 0.79 0.764 0.65 0.833 0.89 0.736 0.91 0.692 0.92 0.695 0.94 0.454 SE 0.83 0.745 0.90 0.740 0.86 0.697 0.96 0.590 0.92 0.602 0.94 0.437 4096 DINA 0.95 0.682 0.86 0.686 0.96 0.638 0.95 0.648 0.98 0.639 0.94 0.367 E 0.95 0.682 0.86 0.686 0.96 0.638 0.95 0.648 0.98 0.639 0.94 0.367 PA-X 0.93 0.706 0.88 0.688 0.84 0.637 0.94 0.584 0.96 0.573 0.93 0.375 X 0.83 0.649 0.72 0.711 0.88 0.624 0.95 0.581 0.96 0.576 0.92 0.382 SE 0.67 0.629 0.90 0.628 0.91 0.597 0.96 0.496 0.95 0.495 0.95 0.373 5792 DINA 0.95 0.562 0.93 0.572 0.94 0.550 0.96 0.550 0.89 0.541 0.91 0.307 E 0.95 0.562 0.93 0.572 0.94 0.550 0.96 0.550 0.89 0.541 0.91 0.307 PA-X 0.89 0.589 0.88 0.576 0.87 0.538 0.96 0.476 0.92 0.476 0.95 0.311 X 0.79 0.55 0.62 0.582 0.91 0.516 0.97 0.477 0.91 0.479 0.92 0.316 SE 0.61 0.521 0.92 0.530 0.91 0.516 0.97 0.401 0.96 0.410 0.89 0.312
Sample Meth- size od cvrg width cvrg width cvrg width cvrg width cvrg width cvrg width 1024 DINA 0.93 1.59 0.92 1.63 0.96 1.53 0.91 1.53 0.94 1.52 0.97 0.897 E 0.91 1.65 0.96 1.70 0.96 1.61 0.92 1.58 0.91 1.55 0.95 0.913 PA-X 0.91 1.80 0.91 1.86 0.93 1.70 0.95 1.58 0.97 1.59 0.92 1.10 X 0.92 1.63 0.88 1.79 0.96 1.63 0.96 1.53 0.97 1.52 0.94 1.04 SE 0.82 1.50 0.93 1.52 0.94 1.45 0.96 1.28 0.97 1.27 0.94 0.934 1448 DINA 0.89 1.30 0.95 1.37 0.90 1.24 0.93 1.22 0.93 1.22 0.92 0.728 E 0.90 1.33 0.91 1.38 0.89 1.31 0.92 1.26 0.96 1.28 0.91 0.752 PA-X 0.95 1.50 0.97 1.50 0.89 1.36 0.94 1.27 0.98 1.27 0.94 0.875 X 0.90 1.33 0.96 1.48 0.88 1.33 0.95 1.22 0.96 1.23 0.95 0.825 SE 0.74 1.21 0.97 1.27 0.91 1.20 0.96 1.04 0.96 1.04 0.89 0.776 2048 DINA 0.91 1.09 0.96 1.11 0.98 1.03 0.92 1.03 0.92 1.03 0.97 0.607 E 0.89 1.10 0.88 1.11 0.98 1.08 0.93 1.04 0.91 1.04 0.97 0.608 PA-X 0.97 1.21 0.88 1.22 0.87 1.14 0.94 1.05 0.92 1.04 0.99 0.708 X 0.80 1.07 0.84 1.20 0.91 1.07 0.93 1.00 0.97 1.00 0.99 0.676 SE 0.55 0.986 0.98 1.04 0.92 0.990 0.94 0.848 0.92 0.847 0.86 0.622 2896 DINA 0.97 0.913 0.94 0.925 0.95 0.866 0.89 0.859 0.93 0.859 0.88 0.506 E 0.94 0.893 0.88 0.926 0.95 0.890 0.89 0.868 0.93 0.856 0.84 0.514 PA-X 0.96 1.01 0.88 1.00 0.86 0.933 0.96 0.846 0.95 0.844 0.96 0.583 X 0.77 0.907 0.86 1.00 0.90 0.877 0.97 0.840 0.97 0.817 0.96 0.567 SE 0.50 0.842 0.95 0.867 0.93 0.811 0.97 0.678 0.90 0.682 0.86 0.522 4096 DINA 0.91 0.753 0.95 0.773 0.92 0.732 0.95 0.722 0.91 0.702 0.93 0.420 E 0.85 0.757 0.86 0.761 0.93 0.734 0.92 0.711 0.96 0.730 0.88 0.422 PA-X 0.96 0.841 0.91 0.826 0.84 0.765 0.92 0.676 0.96 0.689 0.96 0.464 X 0.75 0.750 0.85 0.828 0.87 0.740 0.93 0.666 0.96 0.672 0.95 0.459 SE 0.43 0.699 0.93 0.720 0.90 0.668 0.95 0.557 0.97 0.557 0.82 0.423 5792 DINA 0.94 0.635 0.97 0.646 0.97 0.622 0.96 0.610 0.94 0.607 0.91 0.363 E 0.89 0.633 0.83 0.636 0.91 0.618 0.97 0.607 0.93 0.597 0.85 0.357 PA-X 0.95 0.699 0.86 0.715 0.92 0.664 0.92 0.579 0.97 0.569 0.95 0.396 X 0.61 0.619 0.81 0.686 0.96 0.615 0.91 0.544 0.94 0.550 0.94 0.379 SE 0.33 0.582 0.95 0.619 0.84 0.569 0.96 0.450 0.91 0.444 0.78 0.359
Sample Meth- size od cvrg width cvrg width cvrg width cvrg width cvrg width cvrg width 1024 DINA 0.95 0.712 0.91 0.769 0.91 0.694 0.95 0.670 0.91 0.676 0.92 0.392 E 0.95 0.719 0.89 0.766 0.89 0.701 0.95 0.692 0.95 0.694 0.94 0.410 PA-X 0.81 0.701 0.93 0.733 0.86 0.650 0.96 0.568 0.96 0.559 0.97 0.396 X 0.84 0.666 0.92 0.722 0.90 0.648 0.97 0.569 0.95 0.568 0.95 0.384 SE 0.82 0.594 0.82 0.637 0.77 0.576 0.97 0.487 0.94 0.493 0.92 0.387 1448 DINA 0.97 0.580 0.94 0.632 0.90 0.565 0.95 0.552 0.91 0.562 0.92 0.331 E 0.98 0.608 0.96 0.628 0.95 0.583 0.95 0.569 0.92 0.551 0.93 0.339 PA-X 0.89 0.581 0.86 0.601 0.75 0.547 0.93 0.462 0.98 0.462 0.92 0.332 X 0.91 0.555 0.86 0.600 0.77 0.533 0.95 0.466 0.97 0.470 0.91 0.323 SE 0.76 0.492 0.77 0.541 0.71 0.476 0.96 0.404 0.97 0.399 0.92 0.317 2048 DINA 0.92 0.484 0.95 0.523 0.94 0.485 0.93 0.476 0.95 0.480 0.91 0.271 E 0.94 0.492 0.92 0.525 0.94 0.471 0.95 0.468 0.95 0.468 0.92 0.279 PA-X 0.86 0.487 0.83 0.499 0.78 0.458 0.94 0.378 0.96 0.378 0.92 0.268 X 0.89 0.462 0.84 0.502 0.87 0.462 0.93 0.384 0.98 0.387 0.91 0.275 SE 0.69 0.413 0.77 0.445 0.73 0.396 0.95 0.325 0.92 0.329 0.96 0.265 2896 DINA 0.95 0.405 0.93 0.445 0.89 0.402 0.91 0.400 0.94 0.395 0.94 0.233 E 0.96 0.407 0.92 0.437 0.92 0.400 0.92 0.390 0.96 0.387 0.92 0.239 PA-X 0.79 0.403 0.80 0.425 0.81 0.395 0.94 0.320 0.96 0.314 0.95 0.224 X 0.78 0.391 0.82 0.415 0.84 0.389 0.96 0.315 0.95 0.320 0.94 0.223 SE 0.59 0.352 0.79 0.372 0.79 0.329 0.96 0.266 0.94 0.256 0.91 0.216 4096 DINA 0.97 0.344 0.93 0.37 0.94 0.342 0.94 0.338 0.89 0.329 0.93 0.195 E 0.98 0.344 0.89 0.362 0.94 0.334 0.96 0.320 0.91 0.324 0.95 0.198 PA-X 0.86 0.341 0.81 0.346 0.77 0.329 0.95 0.260 0.94 0.261 0.93 0.186 X 0.89 0.331 0.86 0.357 0.81 0.324 0.93 0.263 0.96 0.261 0.91 0.187 SE 0.51 0.301 0.70 0.304 0.63 0.281 0.94 0.213 0.94 0.213 0.91 0.182 5792 DINA 0.94 0.295 0.93 0.313 0.98 0.290 0.90 0.218 0.95 0.237 0.94 0.166 E 0.96 0.287 0.91 0.308 0.95 0.280 0.92 0.212 0.94 0.231 0.89 0.162 PA-X 0.78 0.291 0.79 0.299 0.76 0.278 0.96 0.216 0.92 0.214 0.95 0.157 X 0.81 0.278 0.83 0.297 0.79 0.278 0.95 0.216 0.94 0.221 0.92 0.157 SE 0.48 0.253 0.46 0.258 0.53 0.231 0.93 0.169 0.97 0.173 0.93 0.155
Sample Meth- size od cvrg width cvrg width cvrg width cvrg width cvrg width cvrg width 1024 DINA 0.95 1.86 0.95 1.74 0.94 1.69 0.96 1.63 0.99 1.63 0.95 1.05 E 0.90 1.86 0.95 1.74 0.97 1.66 0.93 1.62 0.94 1.63 0.96 1.06 PA-X 0.96 1.89 0.95 1.91 0.99 1.67 0.97 1.58 0.98 1.58 0.97 1.16 X 0.91 1.72 0.87 1.62 0.97 1.61 0.98 1.57 0.97 1.58 0.94 1.12 SE 0.88 1.49 0.90 1.43 0.97 1.43 0.97 1.38 0.98 1.35 0.88 0.894 1448 DINA 0.98 1.47 0.91 1.40 0.94 1.35 0.91 1.31 0.94 1.33 0.95 0.837 E 0.95 1.46 0.91 1.39 0.98 1.30 0.91 1.31 0.98 1.31 0.92 0.837 PA-X 0.91 1.49 0.93 1.56 0.93 1.33 0.96 1.24 0.94 1.26 0.98 0.901 X 0.83 1.38 0.85 1.32 0.95 1.31 0.95 1.26 0.95 1.25 0.97 0.859 SE 0.79 1.19 0.90 1.16 0.88 1.18 0.95 1.12 0.92 1.11 0.80 0.717 2048 DINA 0.91 1.23 0.95 1.16 0.97 1.07 0.98 1.06 0.95 1.05 0.91 0.663 E 0.85 1.19 0.93 1.12 0.94 1.05 0.95 1.04 0.95 1.04 0.94 0.658 PA-X 0.93 1.21 0.93 1.25 0.93 1.05 0.97 1.02 0.94 1.01 0.97 0.699 X 0.78 1.14 0.77 1.05 0.96 1.06 0.99 1.01 0.93 0.997 0.97 0.675 SE 0.71 1.02 0.86 0.943 0.92 0.927 0.90 0.905 0.94 0.901 0.70 0.582 2896 DINA 0.96 0.975 0.96 0.943 0.96 0.907 0.97 0.883 0.95 0.887 0.85 0.541 E 0.90 0.973 0.94 0.917 0.95 0.879 0.94 0.838 0.94 0.856 0.93 0.534 PA-X 0.86 0.995 0.94 1.02 0.88 0.855 0.99 0.817 0.91 0.815 0.93 0.549 X 0.84 0.913 0.78 0.861 0.93 0.862 0.97 0.807 0.93 0.803 0.91 0.541 SE 0.65 0.812 0.87 0.777 0.90 0.760 0.95 0.712 0.92 0.719 0.52 0.478 4096 DINA 0.95 0.831 0.88 0.768 0.97 0.747 0.95 0.732 0.88 0.719 0.91 0.452 E 0.79 0.815 0.90 0.767 0.96 0.728 0.95 0.697 0.93 0.703 0.95 0.45 PA-X 0.85 0.830 0.97 0.835 0.89 0.717 0.96 0.652 0.97 0.645 0.90 0.444 X 0.71 0.770 0.78 0.737 0.92 0.707 0.95 0.669 0.93 0.648 0.92 0.437 SE 0.57 0.684 0.81 0.651 0.85 0.642 0.95 0.580 0.98 0.595 0.48 0.406 5792 DINA 0.92 0.696 0.93 0.632 0.92 0.599 0.97 0.583 0.95 0.598 0.91 0.382 E 0.81 0.675 0.89 0.620 0.94 0.594 0.98 0.577 0.97 0.575 0.96 0.375 PA-X 0.76 0.669 0.94 0.675 0.85 0.602 0.97 0.521 0.97 0.531 0.90 0.354 X 0.60 0.625 0.74 0.585 0.92 0.573 0.94 0.530 0.98 0.536 0.93 0.359 SE 0.48 0.569 0.91 0.529 0.80 0.518 0.95 0.478 0.97 0.483 0.24 0.331
References
- Andersen and Gill (1982) Andersen, P. K. and Gill, R. D. (1982) Cox’s regression model for counting processes: a large-sample study. The annals of statistics, 1100–1120.
- Athey and Imbens (2015) Athey, S. and Imbens, G. W. (2015) Machine learning methods for estimating heterogeneous causal effects. arXiv preprint arXiv:1504.01132.
- Bennett and Lanning (2007) Bennett, J. and Lanning, S. (2007) The netflix prize. In Proceedings of the KDD Cup Workshop, vol. 2007, 3–6. New York, NY, USA.
- Chernozhukov et al. (2018) Chernozhukov, V., Chetverikov, D., Demirer, M., Duflo, E., Hansen, C., Newey, W. and Robins, J. (2018) Double/debiased machine learning for treatment and structural parameters.
- Cox (1972) Cox, D. R. (1972) Regression models and life-tables. Journal of the Royal Statistical Society: Series B (Methodological), 34, 187–202.
- Daniel et al. (2021) Daniel, R., Zhang, J. and Farewell, D. (2021) Making apples from oranges: Comparing noncollapsible effect estimators and their standard errors after adjustment for different covariate sets. Biometrical Journal, 63, 528–557.
- Dorie et al. (2019) Dorie, V., Hill, J., Shalit, U., Scott, M. and Cervone, D. (2019) Automated versus do-it-yourself methods for causal inference: Lessons learned from a data analysis competition. Statistical Science, 34, 43–68.
- Dudík et al. (2011) Dudík, M., Langford, J. and Li, L. (2011) Doubly robust policy evaluation and learning. Proceedings of the 28th International Conference on Machine Learning.
- Fienberg (2007) Fienberg, S. E. (2007) The analysis of cross-classified categorical data. Springer Science & Business Media.
- Foster et al. (2011) Foster, J. C., Taylor, J. M. and Ruberg, S. J. (2011) Subgroup identification from randomized clinical trial data. Statistics in medicine, 30, 2867–2880.
- Gail et al. (1984) Gail, M. H., Wieand, S. and Piantadosi, S. (1984) Biased estimates of treatment effect in randomized experiments with nonlinear regressions and omitted covariates. Biometrika, 71, 431–444.
- Gao and Han (2020) Gao, Z. and Han, Y. (2020) Minimax optimal nonparametric estimation of heterogeneous treatment effects. arXiv preprint arXiv:2002.06471.
- Glas et al. (2003) Glas, A. S., Lijmer, J. G., Prins, M. H., Bonsel, G. J. and Bossuyt, P. M. (2003) The diagnostic odds ratio: a single indicator of test performance. Journal of clinical epidemiology, 56, 1129–1135.
- Greenland and Robins (1986) Greenland, S. and Robins, J. M. (1986) Identifiability, exchangeability, and epidemiological confounding. International journal of epidemiology, 15, 413–419.
- Greenland et al. (1999) Greenland, S., Robins, J. M. and Pearl, J. (1999) Confounding and collapsibility in causal inference. Statistical science, 29–46.
- Hahn et al. (2020) Hahn, P. R., Murray, J. S. and Carvalho, C. M. (2020) Bayesian regression tree models for causal inference: regularization, confounding, and heterogeneous effects (with discussion). Bayesian Analysis, 15, 965–1056.
- Hansen (2008) Hansen, B. B. (2008) The prognostic analogue of the propensity score. Biometrika, 95, 481–488.
- Hastie and Tibshirani (1993) Hastie, T. and Tibshirani, R. (1993) Varying-coefficient models. Journal of the Royal Statistical Society: Series B (Methodological), 55, 757–779.
- Hernán and Robins (2010) Hernán, M. A. and Robins, J. M. (2010) Causal inference.
- Hill (2011) Hill, J. L. (2011) Bayesian nonparametric modeling for causal inference. Journal of Computational and Graphical Statistics, 20, 217–240.
- Hu et al. (2021) Hu, L., Ji, J. and Li, F. (2021) Estimating heterogeneous survival treatment effect in observational data using machine learning. Statistics in Medicine, 00, 1–23.
- Imai et al. (2013) Imai, K., Ratkovic, M. et al. (2013) Estimating treatment effect heterogeneity in randomized program evaluation. The Annals of Applied Statistics, 7, 443–470.
- Imbens (2000) Imbens, G. W. (2000) The role of the propensity score in estimating dose-response functions. Biometrika, 87, 706–710.
- Imbens and Rubin (2015) Imbens, G. W. and Rubin, D. B. (2015) Causal inference for statistics, social, and biomedical sciences. Cambridge University Press.
- Künzel et al. (2019) Künzel, S. R., Sekhon, J. S., Bickel, P. J. and Yu, B. (2019) Metalearners for estimating heterogeneous treatment effects using machine learning. Proceedings of the National Academy of Sciences, 116, 4156–4165. URL: https://www.pnas.org/content/116/10/4156.
- Künzel et al. (2018) Künzel, S. R., Stadie, B. C., Vemuri, N., Ramakrishnan, V., Sekhon, J. S. and Abbeel, P. (2018) Transfer learning for estimating causal effects using neural networks. arXiv preprint arXiv:1808.07804.
- Lesko (2007) Lesko, L. (2007) Personalized medicine: elusive dream or imminent reality? Clinical Pharmacology and Therapeutics, 81, 807–816.
- Lin et al. (2013) Lin, N. X., Logan, S. and Henley, W. E. (2013) Bias and sensitivity analysis when estimating treatment effects from the cox model with omitted covariates. Biometrics, 69, 850–860.
- Low et al. (2016) Low, Y. S., Gallego, B. and Shah, N. H. (2016) Comparing high-dimensional confounder control methods for rapid cohort studies from electronic health records. Journal of comparative effectiveness research, 5, 179–192.
- Lu et al. (2018) Lu, M., Sadiq, S., Feaster, D. J. and Ishwaran, H. (2018) Estimating individual treatment effect in observational data using random forest methods. Journal of Computational and Graphical Statistics, 27, 209–219.
- Miettinen and Cook (1981) Miettinen, O. S. and Cook, E. F. (1981) Confounding: essence and detection. American journal of epidemiology, 114, 593–603.
- Murphy et al. (2016) Murphy, M., Redding, S. and Twyman, J. (2016) Handbook on personalized learning for states, districts, and schools. Center for Innovations in Learning, Philadelphia, PA.
- Newey (1994) Newey, W. K. (1994) The asymptotic variance of semiparametric estimators. Econometrica: Journal of the Econometric Society, 1349–1382.
- Neyman (1959) Neyman, J. (1959) Optimal asymptotic tests of composite statistical hypotheses. Probability and statistics, 57, 213.
- Nie and Wager (2017) Nie, X. and Wager, S. (2017) Quasi-oracle estimation of heterogeneous treatment effects. arXiv preprint arXiv:1712.04912.
- Powers et al. (2018) Powers, S., Qian, J., Jung, K., Schuler, A., Shah, N. H., Hastie, T. and Tibshirani, R. (2018) Some methods for heterogeneous treatment effect estimation in high dimensions. Statistics in medicine, 37, 1767–1787.
- Robinson (1988) Robinson, P. M. (1988) Root-n-consistent semiparametric regression. Econometrica: Journal of the Econometric Society, 931–954.
- Rosenbaum et al. (2010) Rosenbaum, P. R. et al. (2010) Design of observational studies, vol. 10. Springer.
- Rothman (2012) Rothman, K. J. (2012) Epidemiology: an introduction. Oxford university press.
- Rubin (1974) Rubin, D. B. (1974) Estimating causal effects of treatments in randomized and nonrandomized studies. Journal of Educational Psychology, 66, 688–701.
- Samuels (1981) Samuels, M. L. (1981) Matching and design efficiency in epidemiological studies. Biometrika, 68, 577–588.
- Shalit et al. (2017) Shalit, U., Johansson, F. D. and Sontag, D. (2017) Estimating individual treatment effect: generalization bounds and algorithms. In International Conference on Machine Learning, 3076–3085. PMLR.
- Splawa-Neyman et al. (1990) Splawa-Neyman, J., Dabrowska, D. and Speed, T. (1990) On the application of probability theory to agricultural experiments. essay on principles, section 9. Statistical Science, 465–472.
- Su et al. (2009) Su, X., Tsai, C.-L., Wang, H., Nickerson, D. M. and Li, B. (2009) Subgroup analysis via recursive partitioning. Journal of Machine Learning Research, 10, 141–158.
- Tian et al. (2012) Tian, L., Alizadeh, A., Gentles, A. and Tibshirani, R. (2012) A simple method for detecting interactions between a treatment and a large number of covariates. submitted on dec 2012. arXiv preprint arXiv:1212.2995.
- Tsiatis (1981) Tsiatis, A. A. (1981) A large-sample study of cox’s regression model. The Annals of Statistics, 9, 93–108.
- Van der Vaart (1998) Van der Vaart, A. (1998) Asymptotic statistics. Cambridge university press.
- Vansteelandt and Daniel (2014) Vansteelandt, S. and Daniel, R. M. (2014) On regression adjustment for the propensity score. Statistics in medicine, 33, 4053–4072.
- Wager and Athey (2018) Wager, S. and Athey, S. (2018) Estimation and inference of heterogeneous treatment effects using random forests. Journal of the American Statistical Association, 113, 1228–1242.
- Weisberg and Pontes (2015) Weisberg, H. I. and Pontes, V. P. (2015) Post hoc subgroups in clinical trials: Anathema or analytics? Clinical trials, 12, 357–364.
- Wendling et al. (2018) Wendling, T., Jung, K., Callahan, A., Schuler, A., Shah, N. and Gallego, B. (2018) Comparing methods for estimation of heterogeneous treatment effects using observational data from health care databases. Statistics in medicine, 37, 3309–3324.