Carinae: a very large hadron collider
Abstract
Context. Carinae is the colliding wind binary with the largest mass loss rate in our Galaxy and the only one in which hard X-ray emission has been detected.
Aims. Carinae is therefore a primary candidate to search for particle acceleration by probing its gamma-ray emission.
Methods. We used the first 21 months of Fermi/LAT data to extract gamma-ray ( GeV) images, spectra and light-curves, then combined them with multi-wavelength observations to model the non-thermal spectral energy distribution.
Results. A bright gamma-ray source is detected at the position of Carinae. Its flux at a few 100 MeV corresponds very well to the extrapolation of the hard X-ray spectrum towards higher energies. The spectral energy distribution features two distinct components. The first one extends over the keV to GeV energy range, and features an exponential cutoff at GeV. It can be understood as inverse Compton scattering of ultraviolet photons by electrons accelerated up to in the colliding wind region. The expected synchrotron emission is compatible with the existing upper limit on the non-thermal radio emission. The second component is a hard gamma-ray tail detected above 20 GeV. It could be explained by -decay of accelerated hadrons interacting with the dense stellar wind. The ratio between the fluxes of the and inverse Compton components is roughly as predicted by simulations of colliding wind binaries. This hard gamma-ray tail can only be understood if emitted close to the wind collision region. The energy transferred to the accelerated particles ( of the collision mechanical energy) is comparable to that of the thermal X-ray emission.
Conclusions. We have measured the electron spectrum responsible for the keV to GeV emission and detected an evidence of hadronic acceleration in Carinae. These observations are thus in good agreement with the colliding wind scenario suggested for Carinae.
Key Words.:
Gamma rays: stars – X-rays: binaries – X-rays: individuals: Carinae – X-rays: individuals: FGL J1045.0-5942 – Acceleration of Particles1 Introduction
About 30 early-type stellar systems feature synchrotron radiation in the radio domain, a signature of electron acceleration (De Becker 2007). Diffusive shock acceleration in stellar wind collisions (Benaglia & Romero 2003), either in colliding wind binaries or OB associations, is the most likely acceleration process and a candidate for cosmic ray acceleration (Axford 1981; Casse & Paul 1982). Gamma-rays, emitted by hadrons accelerated in stellar wind collisions, have however not yet been identified.
The gamma-ray emission expected from a colliding wind binary increases with the stellar wind mechanical luminosity, the fraction of the wind enduring collision, the photon energy density for inverse Compton emission and the matter density for proton-proton interaction and subsequently -decay. Located at a distance of 2.3 kpc (Smith 2006), $η$ Carinae is one of the most massive (80–120 ; Davidson & Humphreys 1997; Hillier et al. 2001) and brightest stellar system in the Galaxy and features the strongest mass loss rate known. As, in addition, its colliding wind region is relatively wide, Carinae is a primary candidate for gamma-ray detection.
The “Great Eruption” of 1843 saw Carinae become the second brightest object in the sky; it was followed by another noteworthy flare in 1890 (see e.g. Davidson et al. 1999; Fernández-Lajús et al. 2010). The Homunculus is the name given to the extended bipolar nebula observed around Carinae: it was crafted by the colossal amount of matter (10–20 ; Smith et al. 2003) that was ejected during the Great Eruption. The second burst led to the ejection of , creating the so-called little homunculus. Carinae keeps emitting matter thanks to its powerful stellar winds : the mass-loss rate is believed to be – yr-1 (Andriesse et al. 1978; Hillier et al. 2001; Pittard & Corcoran 2002; van Boekel et al. 2003).
Even if not all questions are settled, strong evidences suggest that Carinae is a binary system. For instance, radio (Duncan et al. 1995), millimeter (mm; Abraham et al. 2005), optical (Damineli 1996; Damineli et al. 2000), near-infrared (near-IR; Whitelock et al. 1994, 2004; Damineli 1996), and X-ray (Corcoran 2005) observations, obtained over the last decades, have unveiled the existence of a period of days (Damineli et al. 2008).
The first component in the binary system is very likely a luminous blue variable (LBV; Davidson & Humphreys 1997). The second component is probably a late-type nitrogen-rich O or Wolf-Rayet (WR) star (Iping et al. 2005; Verner et al. 2005). The semi-major axis of the orbit is AU (Hillier et al. 2001), and the eccentricity is very high (; Nielsen et al. 2007). Thus, the periastron distance is around 1.66 AU, while the primary star’s radius , although poorly constrained, is estimated between 0.7–1 AU (resp. Corcoran & Hamaguchi 2007; Damineli 1996).
The X-ray emission of Carinae can be discriminated into two components, precisely known thanks to Chandra observations (Seward et al. 2001). The softer part ( keV) prevails in the spectrum up to 1.5 keV. It is spatially extended, and is likely linked to the stellar winds colliding with the interstellar matter. The harder part ( keV) dominates over the 2–10 keV domain. It is punctual, centered on the binary system, and believed to be due to the hydrodynamical shock created by the stellar winds of both components colliding with each other.
The X-ray spectrum of Carinae supports the colliding-wind binary scenario (Usov 1992; Stevens et al. 1992; Corcoran 2005; Pittard 2007; Parkin et al. 2009). The basic idea is that the LBV emits a rather slow and dense stellar wind ( km/s, /yr; Pittard & Corcoran 2002), which collides into the faster, shallower wind originating from the secondary component ( km/s, /yr; Pittard & Corcoran 2002). In this framework, the wind collision region represents the location of the hydrodynamical shock, and thus of the X-ray emitting region.
A hard X-ray tail had first been observed towards Carinae by BeppoSAX (Viotti et al. 2004), and has subsequently been unambiguously confirmed by both INTEGRAL (Leyder et al. 2008, 2010) and Suzaku (Sekiguchi et al. 2009) observations. This gives a strong evidence that the wind collision leads to non-thermal electron acceleration, and suggests the possibility of a gamma-ray detection.
The Carina region has been observed with several gamma-ray experiments. Agile detected the source 1AGL J1043-5931 (=161.2, =–59.7, with an error of ) that could be related to Carinae (Tavani et al. 2009). A 2-day -ray flare has also been observed in October 2008, although its origin is unclear. Fermi/LAT detections where reported in the Fermi bright source list (BSL, Abdo et al. 2009) and in the first year catalog (1FGL, Abdo et al. 2010). In the BSL, the source 0FGL J1045.6-5937 lies at 5.4 arcmin of Carinae and is therefore not associated with it. In the 1FGL, the source 1FGL J1045.2-5942 lies at 1.7 arcmin from Carinae which is again too far for a formal identification. A possible association with the open cluster Trumpler 16, which may hold some energetic young pulsars, was suggested (Abdo et al. 2010). In the TeV domain, no detection has been reported in the vicinity of Carinae.
In the following sections, we describe our detailed analysis of the Fermi/LAT data, and discuss the resulting multi-wavelength spectrum of Carinae in terms of electronic and hadronic accelerations.
2 Fermi/LAT observations
The large area telescope (LAT) aboard the Fermi spacecraft is an electron-positron pair conversion telescope sensitive to photon energies from 20 MeV to GeV (Atwood et al. 2009). The LAT is made of 16 towers, each including a particle tracker and a calorimeter (allowing for the reconstruction of the direction and energy of the incident gamma-ray photons), and of an anti-coincidence shield rejecting the charged particle background.
The data are provided by the Fermi Science Support Center111http://fermi.gfsc.nasa.gov/, which also delivers dedicated analysis software, called the Fermi ScienceTools222http://fermi.gfsc.nasa.gov/ssc/data/analysis/software. The software modules allow to select events from an incoming region of the sky, to compute the corresponding live-time exposure map and the likelihood of an input sky model, and to derive significance maps, source spectra and light-curves.
2.1 Data analysis
We have used Fermi/LAT data accumulated in the Carina region during 21 months, from August 4, 2008 to April 3, 2010. The reconstructed gamma-ray photons were selected in a circular region centered on Carinae with a radius of , belonging to the diffuse class333http://www-glast.slac.stanford.edu/software/IS/glast_lat_performance.htm, and with energies between 200 MeV and 100 GeV. This upper limit is justified by the fact that at higher energies, systematics of the instrument and the role of cosmic-ray events are not yet fully understood. The low energy threshold was chosen for several reasons. Firstly, Carinae is located in the Galactic plane, where the galactic diffuse emission (whose spectrum can be described by a powerlaw with a photon index of 2.2) is very strong. Selecting a threshold of 200 MeV decreases the number of background events by a factor of 4. Secondly, the galactic diffuse emission, whose knowledge is crucial to estimate the sky model parameters at low energies, is affected by large systematic uncertainties, influencing the likelihood analysis. Thirdly, the size of the LAT point spread function decreases rapidly with increasing energy (from 100 MeV to 200 MeV, the event containment radius decreases from to ). As the analysed region encompasses a large number of sources (25 sources are listed in the 1FGL within of Carinae, out of which 10 are within ), the ability to distinguish photons from different sources is important.
2.2 Localisation
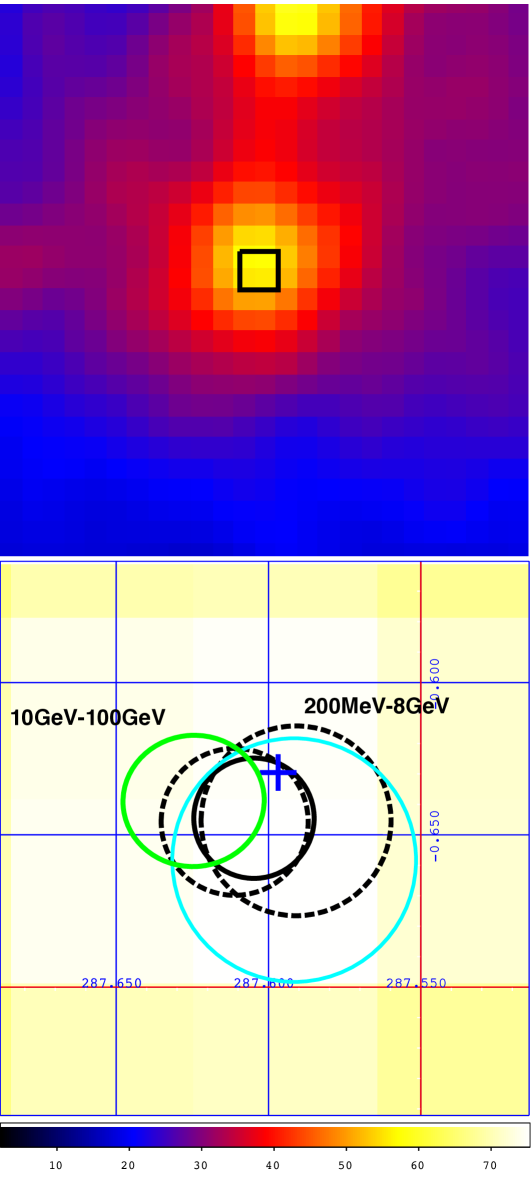
The source 1FGL~J1045.2-5942 (=161.3053, =–59.7057) was not formally associated with Carinae since the latter lies slightly outside of the confidence region. As we are using almost twice more data than was available when the 1FGL was generated, a more accurate source localisation can be obtained. After an initial fit of the parameters of the sources close to the location of Carinae, as well as of the normalisations of the diffuse galactic and isotropic emissions, we determined the position of the nearest source to Carinae with the tool gtfindsrc and found =161.265 and =–59.7015, with a confidence radius of 1.18 arcmin. Carinae is thus perfectly compatible with our improved position, as illustrated in Fig. 1.
Since the width of the point spread function for photons converted in the front part of the LAT is smaller than for these converted in the back, we also derived the position using the front events only, but the uncertainty did not decrease significantly. We also derived the source location for low ( 8 GeV) and high (10 GeV) energy events and obtained error circles also compatible with the position of Carinae (see Fig. 1).
The presence of the source is indubitable, with a test statistic (TS, Wilks 1938) ( 53 ) for the 200 MeV to 100 GeV energy range. The low and high-energy components have respectively TS of 2281 ( 47 ) and 73 ( 8.5 ). In the rest of the paper, we will name the Fermi/LAT source FGL J1045.0-5942, owing to its improved position.
2.3 Spectral analysis
The spectral analysis of FGL J1045.0-5942 was performed using the maximum likelihood method. The region modeling includes two diffuse emissions (Galactic plane and isotropic) and 35 point-like sources listed in the 1FGL catalogue. While most of these sources have been modeled as pure power-laws, four among them are known to be pulsars and have thus been modeled as power-laws with exponential cutoff (Abdo et al. 2010). This is particularly important for the pulsar PSR J1048-5832, located away from FGL J1045.0-5942.
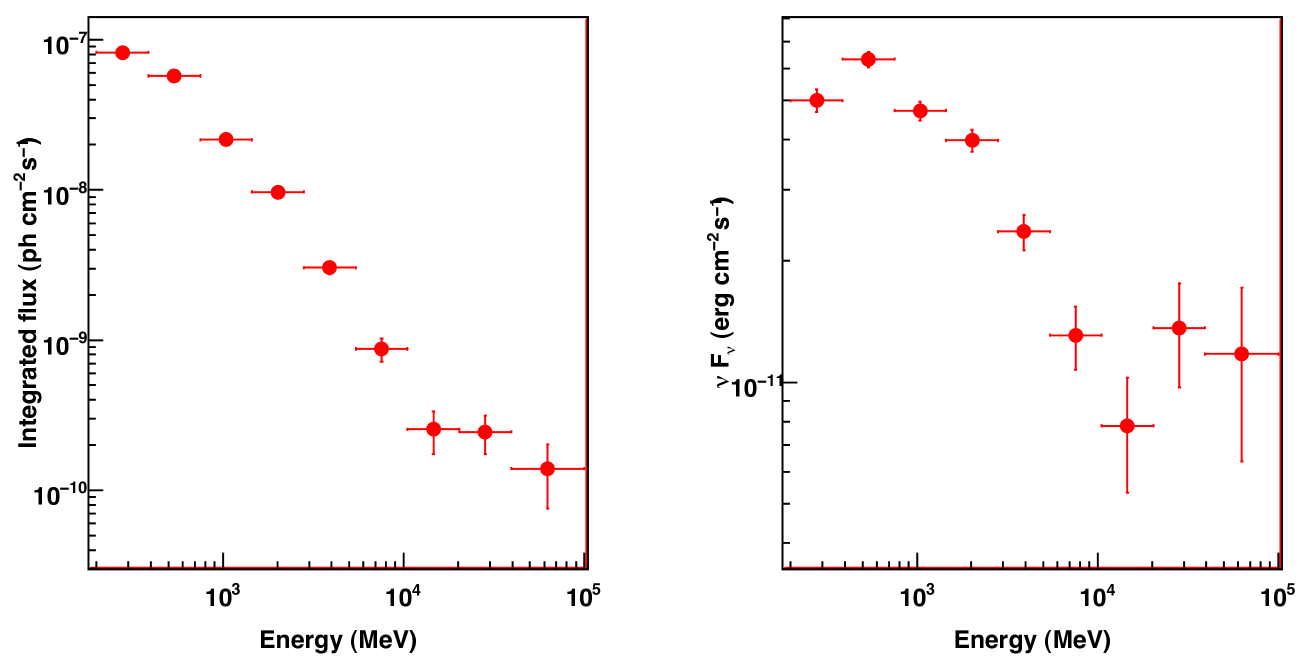
As the detection of FGL J1045.0-5942 is very significant, a spectrum could be extracted in 9 spectral bins. In each bin, the TS is larger than 25 (5 ). The resulting photon spectrum and spectral energy distribution are presented in Fig. 2. Both binned (Cash 1979) and un-binned (Mattox et al. 1996) likelihoods have been used and their results are in full agreement. A curvature at low energy and a modification of the spectral slope at high-energy are clearly detected.
The overall spectrum of FGL J1045.0-5942 differs from the standard power-law used to build the 1FGL catalogue, and has been modeled as a combination of two components: a power-law of photon index with an exponential cutoff plus another power-law at the highest energies. Since only a limited number of spectral shapes are available in the Fermi ScienceTools, the dataset has been split into two energy ranges (0.2–8 GeV and 10–100 GeV) to determine the two spectral components independently. We maximized the sum of the likelihood in both spectral bands together so that the parameters of all sources are constrained by the complete dataset. The resulting parameters are , GeV, F for the exponentially cutoff power-law and , F for the high-energy component.
2.4 Timing analysis
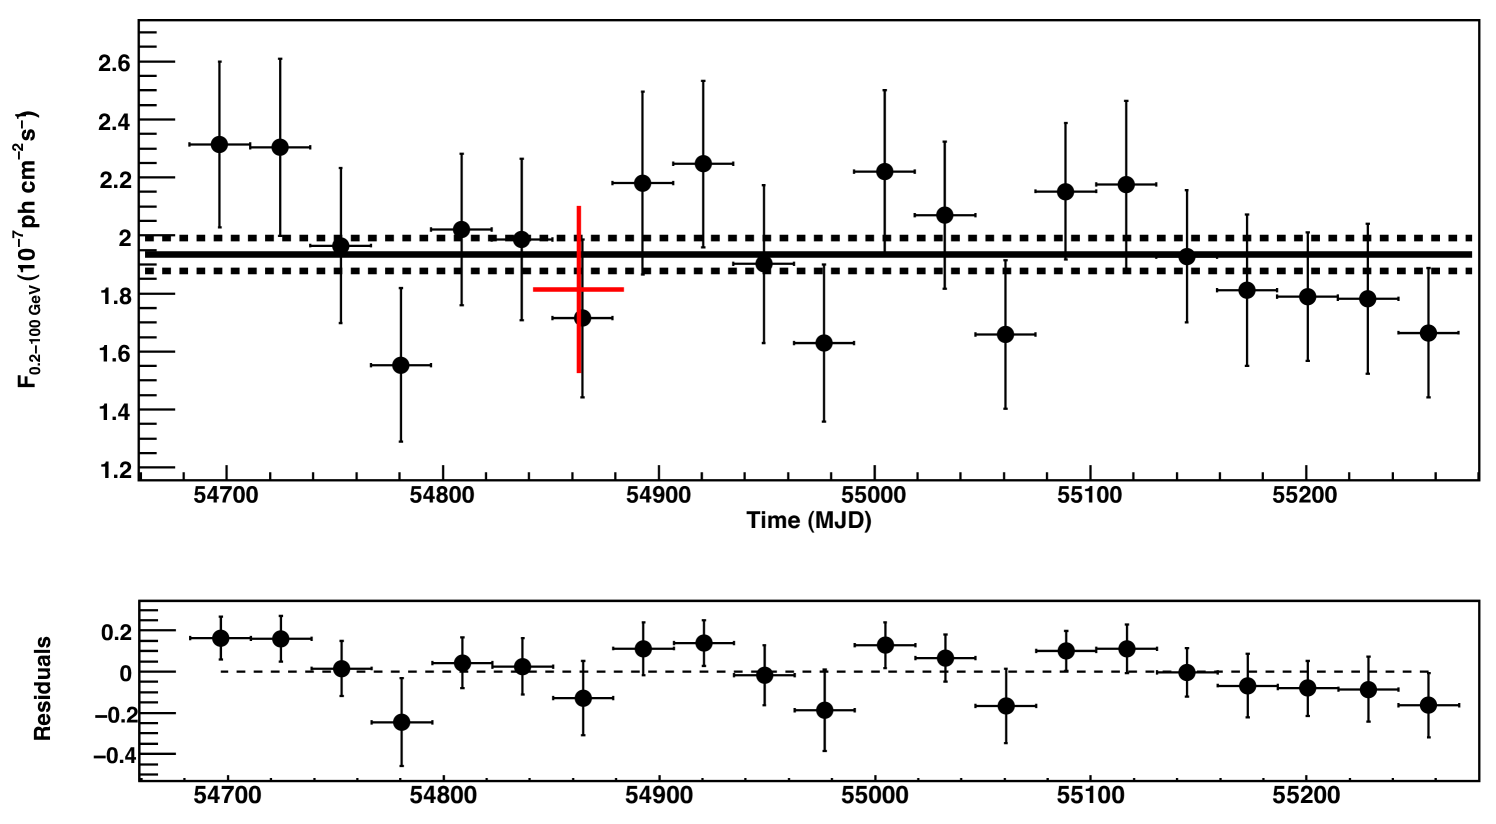
We constructed the light-curve of FGL J1045.0-5942 using the maximum likelihood technique with time bins of one month (see Fig. 3). The light-curve is consistent with a steady flux. The time-averaged flux of the source in the 0.2–100 GeV energy range is F.
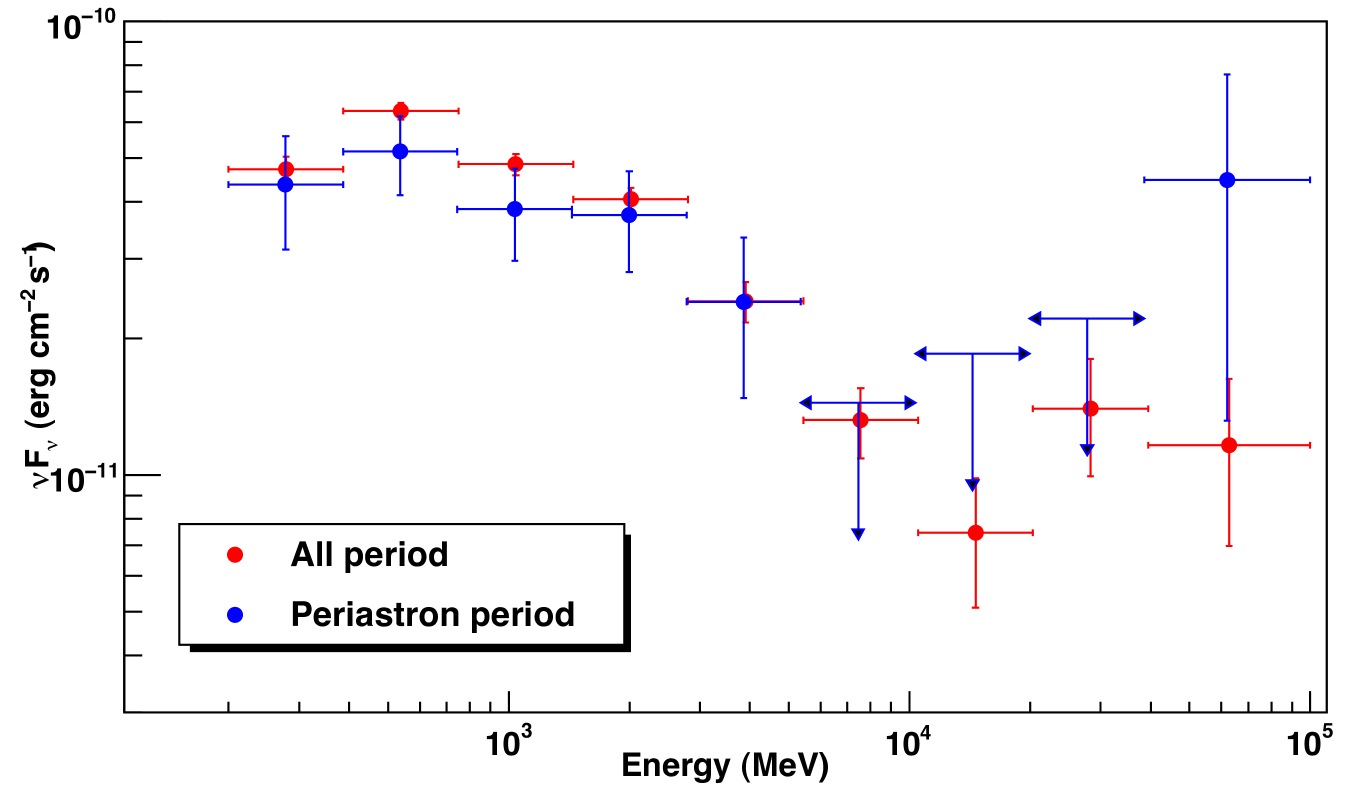
The flux was also determined for the period when Carinae was at the X-ray minimum, as measured by RXTE, (i.e. from MJD = 54843 to MJD = 54883). The flux level obtained for this period is reported in red in Fig. 3. It is compatible with the average flux at the 95% confidence level. The spectrum detected during the periastron period is also compatible with the average spectrum obtained over the 21 months period (bottom of Fig. 2). In particular the cutoff energy did not change significantly, nor the high-energy component, clearly detected above 40 GeV.
The gamma-ray emission does not vary by more than 50%, much less than observed in the X-ray band at periastron, where a variability factor larger than10 is observed.
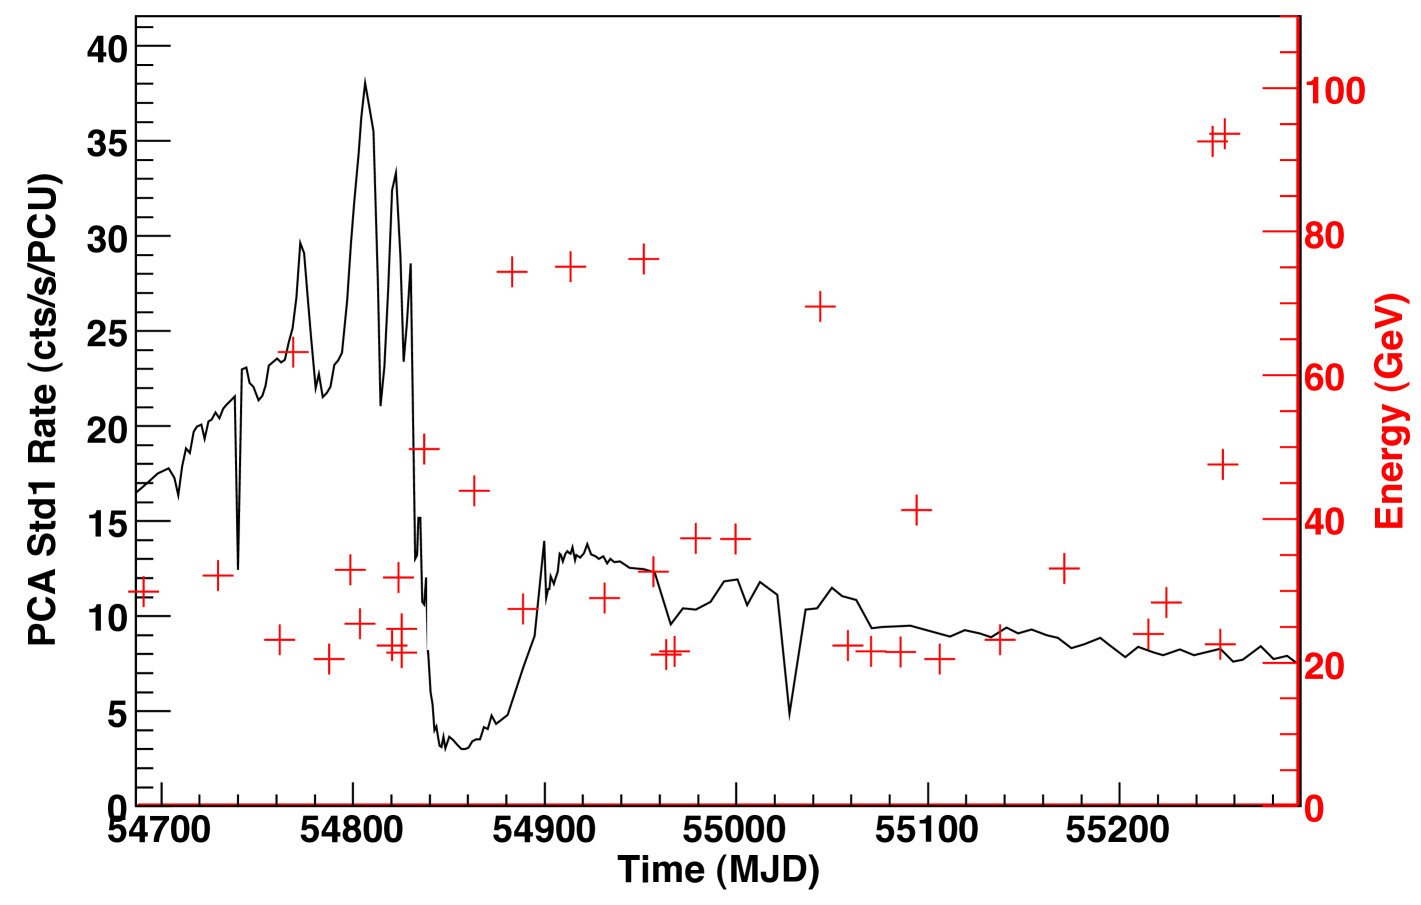
Fig. 4 shows the high-energy ( 20 GeV) events superimposed on the RXTE X-ray light-curve444ftp://legacy.gsfc.nasa.gov/xte/data/archive/ASMProducts/definitive_1dwell/lightcurves/. Despite the fact that this high-energy component is very significant (), there is also no apparent correlation between the high-energy component and the orbital phase of Carinae.
We also searched for gamma-ray flares using a flux aperture photometry method, but no significant deviation has been found. In particular, the two-day period during which Agile reported a flare from the Carina region has been investigated, but no sign of activity could be detected. During these two days, the average flux detected by Fermi/LAT is , well below the flux detected by Agile which is (Tavani et al. 2009). As Fermi and Agile have different orbits and as we used an energy threshold of 200 MeV, our analysis cannot exclude a very short and low energy flare.
3 Discussion
3.1 Association with Carinae
Since the spectral energy distribution observed by Fermi/LAT is made of two components (Fig. 2), a spatial coincidence of two distinct gamma-ray sources (for instance a pulsar and a blazar) cannot be excluded a priori. However this coincidence should match with the centroids of the low- and high-energy components, which are separated by less than 1.2′ (Fig. 1) and compatible within the uncertainties. This is rather unlikely as this would require two bright gamma-ray sources very close to Carinae.
Given the number of pulsars detected within 2° of the Galactic plane (26 or 28555The 1FGL quotes two potential -ray millisecond pulsars within 2° of the Galactic plane.), the probability to find one of them in the 95% confidence region of Carinae is . Moreover, we conducted a blind search frequency analysis and did not find any evidence for a pulsation in FGL J1045.0-5942.
Given the 685 sources associated with blazars in the 1FGL over the entire sky, the probability to find a blazar at the location of Carinae is . In addition, if the high-energy emission was related to a blazar, flaring episodes would be expected, but none is observed (see Fig. 4).
These two results imply that the probability to find a pulsar and a blazar at the location of Carinae is lower than .
With the above probabilities and the absence of any other bright X-ray source in the INTEGRAL error circle (Leyder et al. 2010), we can safely assume that the high-energy emission detected by Fermi and INTEGRAL comes from a single source, very likely Carinae.
Chandra images of Carinae (Weis et al. 2004) show an extended soft shell-like component (corresponding to an external shock at the boundary of the Homunculus nebula) around the harder, point-like emission. Ohm et al. (2010) have argued that the gamma-ray emission detected by Fermi could be emitted by this external shock. Their conclusion was based on the first eleven month spectrum, which did not exhibit the two spectral components presented above. The high-energy spectral component cannot be explained by the external shock, because the density is far too low to allow significant hadron interactions and cooling. In addition, Leyder et al. (2010) have shown that the contribution of this outer shell to the hard X-ray emission from Carinae was lower than 15%. Thus the outer shell interpretation seems unlikely.
3.2 Particle acceleration in Carinae
We will assume below that particle acceleration takes place in Carinae through diffusive shock acceleration in the colliding wind region of the binary system. In the shock region, particle acceleration is counterbalanced by four main cooling processes:
-
1.
Inverse Compton scattering of electrons in the intense ultraviolet radiation field of the stars. The cooling time scale is
where is the stellar ultraviolet luminosity of the primary star and is its distance to the colliding wind region.
-
2.
Proton-proton interactions and subsequent pion decay. Bednarek (2005) pointed out that high-energy hadrons in the wind of massive stars will be photo-disintegrated into protons and neutrons on a short timescale. The interaction timescale for protons is inversely proportional to the density of matter in the post-shock region, where the particles are trapped by the magnetic field. Hydrodynamic simulations (Pittard 2009) indicate that the density in the shock region is much larger than the unperturbed wind density, by a factor of 1–100. The p-p cooling time scale can therefore be written :
where is the typical wind velocity and is the mass loss rate of the primary star.
-
3.
Proton diffusion away from the shock region. The diffusion timescale is related to the bulk velocity of the post-shock material from the central regions towards the outside. Hydrodynamic simulations indicate that the material flows out of the shock region at a velocity smaller than, but of the order of, the pre-shock wind velocity (Pittard 2009). As the shock region has a size similar to the stellar separation, the bulk diffusion timescale can be estimated as (Bednarek 2005) :
-
4.
Electron bremsstrahlung in the post-shock region. For a density
the cooling timescale is given by (Aharonian 2004) :
Particle acceleration in the shock is therefore mainly counterbalanced by Inverse Compton scattering for electrons and by proton-proton interactions. Equating the acceleration time respectively with and for electrons and protons ( is the Larmor radius) provides the maximum characteristic energy of the particle distribution.
For electrons, a powerlaw spectrum is expected, with an exponential cutoff at an energy
where is the magnetic field in the shock region.
should be fairly independent of the orbital position in the dipole approximation for a magnetic field varying as . The gamma-ray spectrum will therefore feature an exponential cutoff at the maximal energy as derived by Eichler & Usov (1993). A cutoff energy of GeV (Sect. 2.3) corresponds to a magnetic field of at the stellar surface.
For protons, the maximum characteristic energy is limited by proton-proton interactions to
The non-thermal spectral energy distribution of Carinae has been represented with a model consisting of two cutoff powerlaw distributions for the electrons and for the interacting protons. The model and the data are shown together in Fig. 5. The parameters of the model are listed in Table 1. The magnetic field and the electron energy distribution were adjusted to match the upper limit on the radio synchrotron emission, derived from the minimal thermal emission detected with ACTA (Duncan & White 2003), and to match the inverse Compton continuum determined by INTEGRAL and Fermi. The slope and cutoff energy of the interacting proton energy distribution were fixed to 2.25 and , respectively, and its normalization was fitted to match the high-energy gamma-ray tail using the -decay model of Kelner et al. (2006). The proton and ultraviolet photon energy densities in the shock region were fixed to the values expected for an average distance cm.
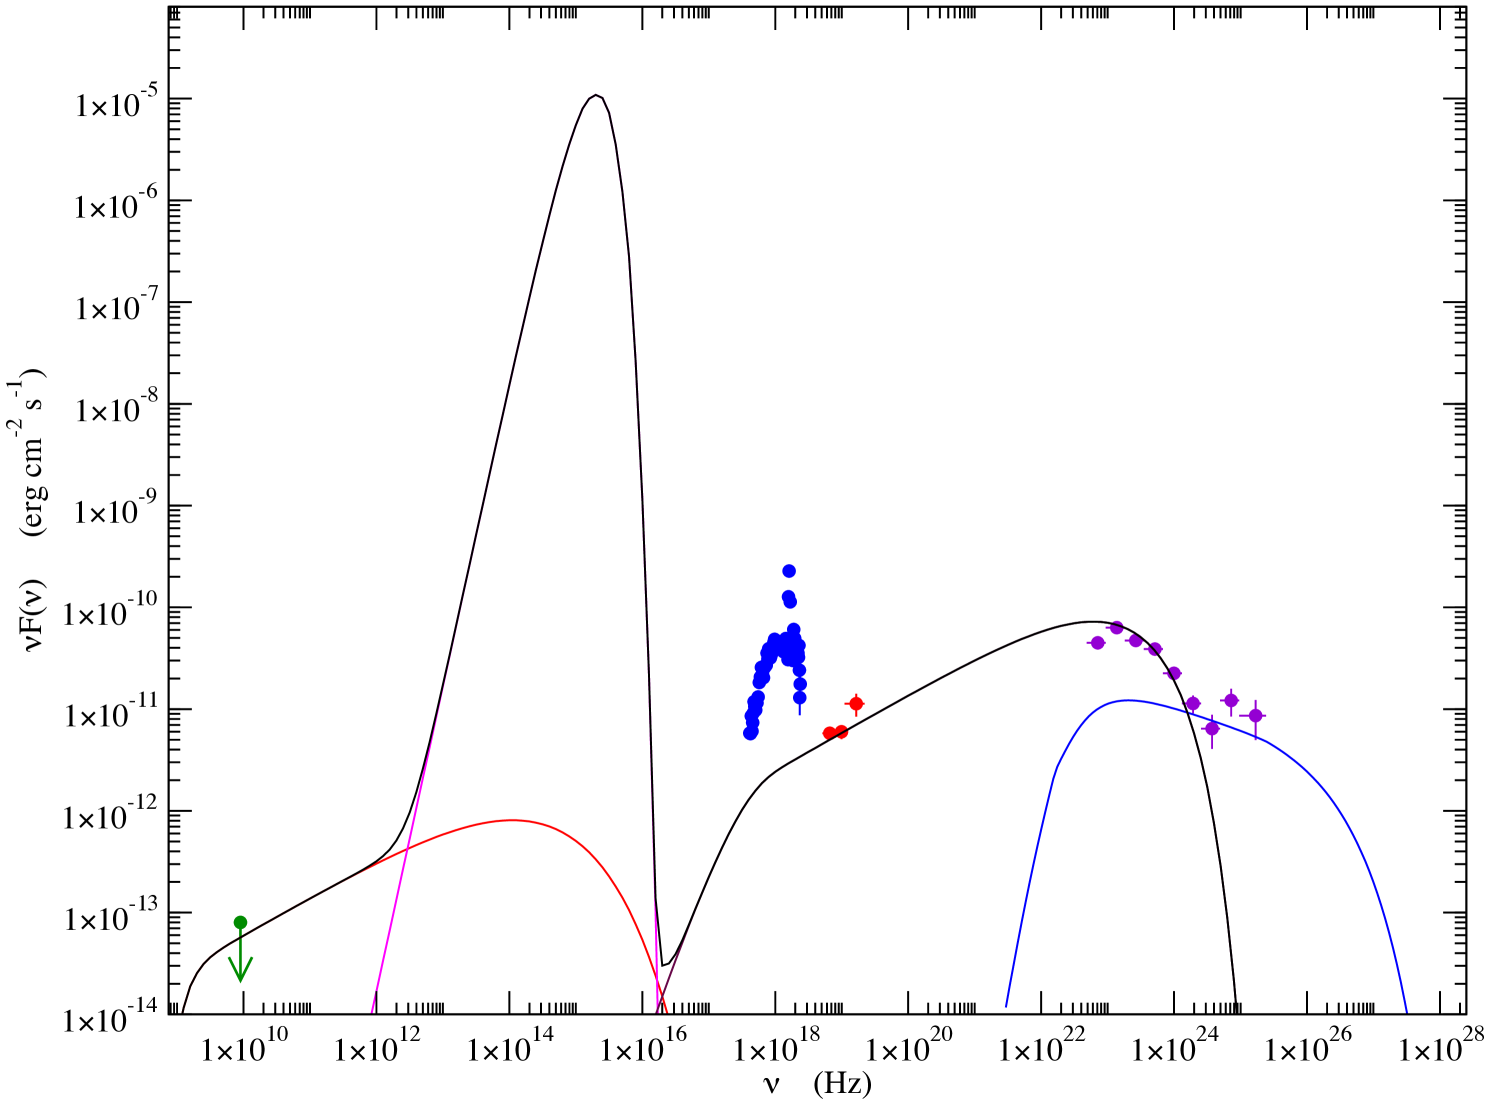
Parameter Value Environment Photon energy density 2.7 erg/cm3 Magnetic field 0.5 G Density cm-3 Electron distribution Powerlaw index 2.25 Total energy erg Proton distribution Powerlaw index 2.25 Total energy erg
3.3 Energetic Considerations
The wind momentum ratio of Carinae is (Pittard & Corcoran 2002). The half-opening angle of the shock region is therefore rad, the fraction of the wind involved in the wind collision region is , and the mechanical energy available in that region is .
For a density of cold protons of cm-3 in the shock region, the normalization of the -decay spectrum (Fig. 5) requires a total interacting proton energy erg. The energy injected in the shock to sustain the observed proton distribution is of the order of .
The gamma-ray spectrum of Carinae thus indicates that of the shock mechanical energy (or less than 1% of the total wind mechanical luminosity) is transferred to accelerated protons downstream. This is in agreement with recent numerical simulations of relativistic collisionless shocks (Spitkovsky 2008), if a significant fraction of the hadrons interacts and generates .
Modeling the thermal X-ray emission depends on detailed hydrodynamical simulations (see e.g. Pittard & Corcoran 2002) and could be affected by many phenomena (Parkin et al. 2009). Such simulations can explain an X-ray luminosity of above a few keV. Our analysis hence indicates that the fraction of the shock energy accelerating protons is similar to that emitting observable X-rays in Carinae.
The ratio between the inverse Compton or -decay and the X-ray emission observed in Carinae is larger than predicted by existing models applied to WR 140 (Pittard & Dougherty 2006; Reimer et al. 2006). The high-energy emissivity predicted for WR140 is however not well constrained and varies by a factor of 100 depending on the model parameters. The strong inverse Compton emission and the enhanced -emission (when compared to the X-ray emission) might be related to the strong ultraviolet photon field and to the very high density in the wind collision region of Carinae, strengthening simultaneously the proton-proton collision rate and the absorption of the thermal emission. Detailed modeling is outside the scope of this paper, but these observations of Carinae provide the first observational constraint on the fraction of the mechanical power injected into particle acceleration.
3.4 On the detection of neutrinos
The high-energy gamma-rays observed in Carinae are likely produced by -decay, a process which produces as many neutrinos as gamma-rays. Thus, the detection of neutrinos would provide a conclusive evidence that hadronic acceleration is at work in Carinae.
The neutrino spectrum resulting from the decay of has been studied by Kappes et al. (2007). In the case of Carinae, and based on 104, the expected spectrum is
The atmospheric neutrino background is far too high to expect any detection at such a low energy. However, since we have not measured the high-energy cutoff of the -decay emission, we cannot exclude that Cherenkov experiments might detect Carinae at energies higher () than anticipated. Unfortunately, even in that case, only a few neutrinos could be detected by KM3Net in 5 years of observations, not enough for a source detection.
3.5 Other sources
The density and magnetic field in the vicinity of the shock in Carinae are such that a large fraction of the energy carried by high-energy protons is converted to gamma-rays. Systems with lower stellar winds or magnetic fields will feature fainter -decay emission.
Scaling the emissivity of Carinae by the mass loss rate (i.e. the wind density) suggests that LBV systems could be detected by Fermi up to the Galactic center while WR or OB systems could be detected within 1 kpc and 0.1 kpc, respectively. Very few objects could therefore be detected. OB associations could have a combined stellar mass loss rate as strong as Carinae and similar efficiency in creating (Ozernoy et al. 1997). They could thus be detected up to distances of several kpc, although their extended emission is more difficult to measure, especially in the Galactic plane.
The mechanical energy in the stellar wind of a massive star, integrated over its lifetime, could reach some erg. From an energetic point of view, extrapolating on the particle acceleration efficiency of Carinae, stellar winds ejected during the massive star evolution in a suitable environment could be as effective as a SNR to accelerate hadrons. Future Cherenkov observations will tell if stellar wind collisions could accelerate particles up to to the knee of the cosmic-ray spectrum.
4 Conclusions
We have detected a bright gamma-ray source at the position of Carinae using 21 months of Fermi/LAT data. Its flux at a few 100 MeV corresponds very well to the extrapolation of the hard X-ray spectrum of Carinae (as measured by INTEGRAL and Suzaku) towards higher energies. The spectral energy distribution, which corresponds to an average over almost half of the orbit of Carinae, features two spectral components.
The first one is a powerlaw extending from keV to GeV energies, with an exponential cutoff at GeV. This component can be understood assuming inverse Compton scattering of stellar photons by electrons accelerated up to in the wind collision region. The observed cutoff energy implies a magnetic field G at the stellar surface.
The second component, a hard gamma-ray tail, is detected above 20 GeV. This bright component could be explained by -decay of accelerated hadrons interacting with the dense stellar wind in the shock region. The ratio between the fluxes of the and inverse Compton components is roughly as predicted by simulations (Pittard & Dougherty 2006; Reimer et al. 2006). Bremsstrahlung emission is expected at a much lower level and with a cutoff energy similar to that of the inverse Compton component.
The hard gamma-ray tail can only be understood if emitted close to the wind collision region. Indeed, the external shock between the Homunculus nebula and the interstellar medium occurs at a density and magnetic field strength that are much too small to explain the observed emission. It is possible that a part of the soft gamma-ray emission comes also from inverse Compton scattering of infrared photons in the external shock as suggested by Ohm et al. (2010) (see also Leyder et al. 2010). It is however difficult to account for the hard tail without a significant fraction of the soft gamma-ray emission being emitted by the colliding wind region. Detection of any hard X-ray or soft gamma-ray variability would rule out the external shock model.
The energy transmitted to the accelerated particles ( of the wind collision mechanical energy) is of the same order as that of the observed thermal X-ray emission, providing an important observational constraint for future numerical hydrodynamical models of the colliding wind region in Carinae.
With the exception of the short flare detected by Agile, the averaged hard X-ray (Leyder et al. 2010) and soft gamma-ray emissions do not vary by more than 50% along the orbit, not even during the periastron passage. This provides an interesting constraint on the evolution of the magnetic field and of the wind collision region along the orbit.
We finally suggest that Cherenkov telescopes could measure the hadronic cutoff energy in Carinae.
References
- Abdo et al. (2009) Abdo, A. A., Ackermann, M., Ajello, M., et al. 2009, ApJ. Supp., 183, 46
- Abdo et al. (2010) Abdo, A. A., Ackermann, M., Ajello, M., et al. 2010, ApJ. Supp., 187, 460
- Abraham et al. (2005) Abraham, Z., Falceta-Gonçalves, D., Dominici, T. P., et al. 2005, A&A, 437, 977
- Aharonian (2004) Aharonian, F. A. 2004, Very high energy cosmic gamma radiation : a crucial window on the extreme Universe (River Edge, NJ: World Scientific Publishing)
- Andriesse et al. (1978) Andriesse, C. D., Donn, B. D., & Viotti, R. 1978, MNRAS, 185, 771
- Atwood et al. (2009) Atwood, W. B., Abdo, A. A., Ackermann, M., et al. 2009, ApJ, 697, 1071
- Axford (1981) Axford, W. I. 1981, Annals of the New York Academy of Sciences, 375, 297
- Bednarek (2005) Bednarek, W. 2005, MNRAS, 363, L46
- Benaglia & Romero (2003) Benaglia, P. & Romero, G. E. 2003, A&A, 399, 1121
- Cash (1979) Cash, W. 1979, ApJ, 228, 939
- Casse & Paul (1982) Casse, M. & Paul, J. A. 1982, ApJ, 258, 860
- Corcoran (2005) Corcoran, M. F. 2005, AJ, 129, 2018
- Corcoran & Hamaguchi (2007) Corcoran, M. F. & Hamaguchi, K. 2007, in Revista Mexicana de Astronomia y Astrofisica Conference Series, Vol. 30, 29–34
- Damineli (1996) Damineli, A. 1996, ApJ, 460, L49
- Damineli et al. (2008) Damineli, A., Hillier, D. J., Corcoran, M. F., et al. 2008, MNRAS, 384, 1649
- Damineli et al. (2000) Damineli, A., Kaufer, A., Wolf, B., et al. 2000, ApJ, 528, L101
- Davidson et al. (1999) Davidson, K., Gull, T. R., Humphreys, R. M., et al. 1999, AJ, 118, 1777
- Davidson & Humphreys (1997) Davidson, K. & Humphreys, R. M. 1997, ARA&A, 35, 1
- De Becker (2007) De Becker, M. 2007, A&A Rev., 14, 171
- Duncan & White (2003) Duncan, R. A. & White, S. M. 2003, MNRAS, 338, 425
- Duncan et al. (1995) Duncan, R. A., White, S. M., Lim, J., et al. 1995, in Revista Mexicana de Astronomia y Astrofisica Conference Series, ed. V. Niemela, N. Morrell, & A. Feinstein, Vol. 2, 23–+
- Eichler & Usov (1993) Eichler, D. & Usov, V. 1993, ApJ, 402, 271
- Fernández-Lajús et al. (2010) Fernández-Lajús, E., Fariña, C., Calderón, J. P., et al. 2010, New Astronomy, 15, 108
- Hartman et al. (1999) Hartman, R. C., Bertsch, D. L., Bloom, S. D., et al. 1999, VizieR Online Data Catalog, 212, 30079
- Hillier et al. (2001) Hillier, D. J., Davidson, K., Ishibashi, K., & Gull, T. 2001, ApJ, 553, 837
- Iping et al. (2005) Iping, R. C., Sonneborn, G., Gull, T. R., Massa, D. L., & Hillier, D. J. 2005, ApJ, 633, L37
- Kappes et al. (2007) Kappes, A., Hinton, J., Stegmann, C., & Aharonian, F. A. 2007, Journal of Physics Conference Series, 60, 243
- Kelner et al. (2006) Kelner, S. R., Aharonian, F. A., & Bugayov, V. V. 2006, Phys. Rev. D, 74, 034018
- Leyder et al. (2008) Leyder, J., Walter, R., & Rauw, G. 2008, A&A, 477, L29
- Leyder et al. (2010) Leyder, J., Walter, R., & Rauw, G. 2010, A&A, in press
- Mattox et al. (1996) Mattox, J. R., Bertsch, D. L., Chiang, J., et al. 1996, ApJ, 461, 396
- Nielsen et al. (2007) Nielsen, K. E., Corcoran, M. F., Gull, T. R., et al. 2007, ApJ, 660, 669
- Ohm et al. (2010) Ohm, S., Hinton, J. A., & Domainko, W. 2010, ArXiv e-prints
- Ozernoy et al. (1997) Ozernoy, L. M., Genzel, R., & Usov, V. V. 1997, MNRAS, 288, 237
- Parkin et al. (2009) Parkin, E. R., Pittard, J. M., Corcoran, M. F., Hamaguchi, K., & Stevens, I. R. 2009, MNRAS, 394, 1758
- Pittard (2007) Pittard, J. M. 2007, ApJ, 660, L141
- Pittard (2009) Pittard, J. M. 2009, MNRAS, 396, 1743
- Pittard & Corcoran (2002) Pittard, J. M. & Corcoran, M. F. 2002, A&A, 383, 636
- Pittard & Dougherty (2006) Pittard, J. M. & Dougherty, S. M. 2006, MNRAS, 372, 801
- Reimer et al. (2006) Reimer, A., Pohl, M., & Reimer, O. 2006, ApJ, 644, 1118
- Sekiguchi et al. (2009) Sekiguchi, A., Tsujimoto, M., Kitamoto, S., et al. 2009, ArXiv e-prints
- Seward et al. (2001) Seward, F. D., Butt, Y. M., Karovska, M., et al. 2001, ApJ, 553, 832
- Smith (2006) Smith, N. 2006, ApJ, 644, 1151
- Smith et al. (2003) Smith, N., Gehrz, R. D., Hinz, P. M., et al. 2003, AJ, 125, 1458
- Spitkovsky (2008) Spitkovsky, A. 2008, ApJ, 682, L5
- Stevens et al. (1992) Stevens, I. R., Blondin, J. M., & Pollock, A. M. T. 1992, ApJ, 386, 265
- Tavani et al. (2009) Tavani, M., Sabatini, S., Pian, E., et al. 2009, ApJ, 698, L142
- Usov (1992) Usov, V. V. 1992, ApJ, 389, 635
- van Boekel et al. (2003) van Boekel, R., Kervella, P., Schöller, M., et al. 2003, A&A, 410, L37
- Verner et al. (2005) Verner, E., Bruhweiler, F., & Gull, T. 2005, ApJ, 624, 973
- Viotti et al. (2004) Viotti, R. F., Antonelli, L. A., Rossi, C., & Rebecchi, S. 2004, A&A, 420, 527
- Weis et al. (2004) Weis, K., Corcoran, M. F., Bomans, D. J., & Davidson, K. 2004, A&A, 415, 595
- Whitelock et al. (1994) Whitelock, P. A., Feast, M. W., Koen, C., Roberts, G., & Carter, B. S. 1994, MNRAS, 270, 364
- Whitelock et al. (2004) Whitelock, P. A., Feast, M. W., Marang, F., & Breedt, E. 2004, MNRAS, 352, 447
- Wilks (1938) Wilks, S. 1938, Ann. Math. Stat., 9, 60