Euphonic: inelastic neutron scattering simulations from force constants and visualisation tools for phonon properties
Abstract
Interpretation of vibrational inelastic neutron scattering spectra of complex systems is frequently reliant on accompanying simulations from theoretical models. Ab initio codes can routinely generate force constants, but additional steps are required for direct comparison to experimental spectra. On modern spectrometers this is a computationally expensive task due to the large data volumes collected. In addition, workflows are frequently cumbersome as the simulation software and experimental data analysis software often do not easily interface to each other. Here a new package, Euphonic, is presented. Euphonic is a robust, easy to use and computationally efficient tool designed to be integrated into experimental software and able to interface directly with the force constant matrix output of ab initio codes.
1 Introduction
The study of atomic vibrations is of both fundamental and applied interest as they have a significant role in many macroscopic material properties. They can drive phase transitions [9], transport heat [52], govern elastic properties [7] and even limit the coherence of qubits [23]. For this reason significant effort has been devoted to understanding atomic vibrations both theoretically and experimentally. Inelastic neutron scattering (INS) is a particularly powerful experimental technique as the momentum and frequency dependence of the atomic vibrations can be straightforwardly and quantitatively related to the experimental intensities, providing a stringent test of theoretical models.
The earliest experiments were performed using a triple-axis spectrometer (TAS) [8] and this remains a widely applied method. In its conventional form this instrument defines the incident (final) neutron energy with a crystal monochromator (analyser) and a single detector measuring at a single point in - (momentum-energy) space. Dispersion curves are mapped out by making a series of measurements as a function of energy transfer at fixed momentum, or as a function of momentum at fixed energy transfer, which collectively raster over a - region of interest. To improve efficiency, additional analyser-detector groups after the sample can be used [35], increasing data rates but also increasing the volume and complexity of the data to be modelled.
Alternatively, a time-structured beam may be used in conjunction with beam line components that define the incident neutron energy or final neutron energies, so that each detector in an array can map out many different energy transfers . These time-of-flight (TOF) instruments have become increasingly popular especially with the advent of high power, pulsed spallation sources. To maximise their efficiency these instruments have detector arrays which cover large solid angles broken up into pixels. For example, LET at ISIS [6] has a three steradian detector array that is split into 98304 pixels, in each of which the energy transfer range is resolved into 300 bins. For single crystal experiments the sample must be rotated, commonly in 0.5∘–1∘ steps over a 180∘ range, leading to the generation of a multidimensional dataset which consists of – individual - points. Data analysis frameworks to handle and interact with these objects exist and are widely used [17, 46, 3].
The calculation of vibrational properties from first-principles or parameterised atomistic lattice dynamics is well established within the computational chemistry and physics communities. As the equations needed are straightforward, many codes have been written to compute INS spectra for comparison between theory and experiment. These include SimPhonies [4], OpenPhonon [38], Scatter [47] for GULP [22], Ab2tds [39], the CLIMAX series [34, 44, 11] and PHONON [42] in addition to private and unreleased codes. Recent versions of Phonopy [50] also include functions for calculation of the dynamical structure factor. However no available software meets all of the requirements of a tool suitable for experimentalists at time-of-flight INS facilities, lacking one or more of some functionality such as flexible and customisable modelling of instrumental resolution, the scaling of computational performance to very large, high-resolution datasets, ease of use, and availability of maintained source code.
The force-constants approach of the above-mentioned codes is restricted to systems and excitations well described by the harmonic approximation of lattice dynamics. Anharmonic phenomena including frequency shifts of asymmetric bond vibrations and overtones, broadening, dynamically stabilized and high-temperature structural phases and nuclear quantum dynamics are poorly described or not included at all. In some cases it is feasible to still compute stable harmonic phonons using volume or temperature dependent effective potentials [31]. Computational approaches to strong anharmonicity are not as well established or widespread, but one which merits mention in the context of INS spectra is based on analysis of dynamical correlation functions computed using molecular dynamics simulations. The software packages of nMoldyn [48], MDANSE [28], Dynasor [21] and LiquidLib [51] all perform the calculation of dynamical structure factor from molecular dynamics trajectory data.
Here we present Euphonic [20], a software package to calculate inelastic neutron scattering intensities in the harmonic approximation using force constants obtained from ab initio calculations. It is written in Python, for ease of integration with other software and experimental workflows. This allows, for example, it to be used to simulate any part of a time-of-flight - dataset with instrumental resolution convolution via the data analysis package Horace [17]. Given the potential size of the - time-of-flight datasets described above, Euphonic has a focus on computational performance and uses an extension written in C and OpenMP to handle the most demanding steps. Euphonic is not strongly coupled to any particular atomistic code; currently, force constants can be read from CASTEP [13], which internally implements several schemes for phonon calculations, and Phonopy [50], which manages finite-displacement calculations with any of eleven force calculators. In addition to simulating large - time-of-flight datasets, it is intended as a general-purpose tool for analysis of phonon simulations. Command-line programs are included for quick calculation and plotting of phonon band structure, density of states (DOS) and the neutron dynamical structure factor, while the Python API allows Euphonic to be used as a more flexible library for optimised phonon frequency and eigenvector calculations and related quantities.
In this paper we will describe: the basic theory behind Euphonic; the software structure, its main features, and how it interacts with other software; show how its performance and results compare to similar existing software tools and, finally, compare Euphonic to experimental datasets for both single crystals and powders.
1.1 Availability
Euphonic has been developed following software development best practice: continuous integration processes test the functionality and validate numerical results as features are added, and the Python API has been explicitly designed to make it easy to use Euphonic with other projects. Euphonic is open-source under the GNU General Public License v3 – the source code is is freely available on Github, and packages are distributed by PyPI and Conda-forge for the pip and conda package managers. Links to the source code and online documentation, including installation instructions and how to use Euphonic, are available from the DOI landing page https://doi.org/10.5286/SOFTWARE/EUPHONIC [20].
1.2 Validation datasets
Throughout this paper a variety of simulated and experimental datasets will be used to compare Euphonic outputs to both other software tools and experimental data. The chosen materials are Nb, Al, Si, quartz and \ceLa2Zr2O7, and will be described and used in each section as appropriate. These datasets have been chosen to give a variety of unit cell sizes and crystal symmetries, and include both polar (quartz) and non-polar materials. Simulated force constants have been produced with either CASTEP or VASP [36] plus Phonopy in order to thoroughly test the features of Euphonic. Details of the force constant calculations for each material and where to obtain the results of the simulations and the neutron experimental data can be found in the supplementary material.
2 Theory
2.1 Harmonic lattice dynamics
Vibrational excitations — phonons — in crystalline materials are described within the theory of lattice dynamics [14]. Displacement of a single atom in an infinite periodic crystal gives rise to forces on every other atom in the crystal, which in the harmonic approximation are linearly related to the displacement by the force constant matrix
| (1) |
where is the force constant matrix, the unit cell containing the displaced atom is labelled , runs over unit cells in the crystal, runs over atoms in the unit cell, runs over the Cartesian directions, is the displacement of atom in cell in direction from its equilibrium position, and is the total lattice energy. These force constants decay rapidly with distance according to a power-law where in non-polar crystals. This allows for a truncation of at some radius beyond which the residual force constants may be neglected. Å is sufficient for almost all practical cases.
Substituting a plane-wave solution into the equation of motion yields an eigenvalue equation
| (2) |
where () is the dynamical matrix at wave vector , the eigenvalues are the square of the phonon frequencies of mode at , and the eigenvectors are the phonon polarisation vectors at of mode for atom . The dynamical matrix can be calculated as the mass-weighted Fourier transform of the force constant matrix
| (3) |
where is the mass of atom , is the vector from the origin to the unit cell, and includes unit cells with .
2.1.1 Deconvolution of periodic representation of
Though the force constant matrix, , is a finite matrix it does not map directly onto a modelling framework with supercell periodic boundary conditions as used in almost all ab initio lattice dynamics implementations. Instead these yield a convolution of with the lattice of a suitable supercell. Ideally this would be chosen so the magnitude of falls to a negligible value in half the supercell’s linear dimension to avoid overlap error. The force constants may either be directly computed using the supercell as the ab initio simulation cell, (the “direct method”), [1] or implicitly using Fourier interpolation either of density-functional perturbation theory [5] or finite displacements [1]. Therefore Euphonic must deconvolve a periodic dataset to recover the aperiodic force constant matrix, . For a very large supercell the supercell-periodic images of truncated at some radius do not overlap at all and the extraction is a straightforward mapping of the data values. However in practical ab initio calculations the supercell sizes are limited by computational resources, and there is always a small residual overlap between periodic images of . Euphonic adopts the “Cumulant image” approach [41], combining the deconvolution with the Fourier transform to compute the dynamical matrix in a formulation which respects point group symmetry.
2.1.2 Acoustic sum rule
The invariance of the total energy upon displacement of the entire crystal in space imposes a condition known as the acoustic sum rule which guarantees the presence of the usual three acoustic modes with zero frequency at and linear dispersion nearby. The sum rule applies to the force constant matrix or the -point dynamical matrix
| (4a) | ||||
| (4b) | ||||
where runs over the atoms in the unit cell and over the unit cells in the supercell. The zeros depend on an exact cancellation of an entire row of the dynamical or force constant matrices, whose elements are large and of opposite sign. In the presence of numerical convergence errors and symmetry breaking by typical ab initio computational grids the sum rule is not exactly satisfied, leading to non-zero acoustic modes at and nonlinear dispersion of acoustic modes nearby.
Euphonic optionally applies a correction using projection methods onto the pure translation modes to restore near-exact satisfaction of the sum rule. Two alternative adjustments are implemented; either to the dynamical matrices (the reciprocal-space method) or to the periodic representation of the force-constant matrix (the real-space method). If Equation 4b is imperfectly satisfied, the dynamical matrix (dropping indices for clarity) has three near-zero eigenvalues corresponding to the acoustic modes. A correction is applied
| (5) |
where is the matrix of eigenvectors of , is a matrix whose diagonal entries are the eigenvalues of for the acoustic modes and zero otherwise. As per [25], the correction at is also applied at non-zero . The alternative real-space correction is similarly formulated, but applied to the force constant matrix
| (6) |
where , and are all matrices. is the matrix of force constants, is the matrix of eigenvectors of , and is a matrix whose diagonal entries are the eigenvalues of for the acoustic modes, and zero otherwise. This method more faithfully restores the linearity of the acoustic branches near as well as the -point limit.
2.1.3 Polar crystals
For non-polar crystals, the decay of force constants with distance by a high inverse power law of 5–7 means that a cutoff radius of 8–10 Å is usually sufficient to contain the non-negligible elements of the force constant matrix. The resulting supercell of 16–20 Å in each dimension is well within the typical computational capability of ab initio DFT methods. (Typically these would be within the local-density approximation or generalised-gradient approximation, but hybrid functionals have become more accessible even for a system such as \ceLa2Zr2O7 [12].) However, in the case of ionic or polar crystals the Coulomb interactions add a tail that decays as , which precludes a converged calculation in a computationally practical supercell. This long-range tail is responsible for the phenomenon of splitting of the longitudinal optical and transverse optical modes (LO/TO splitting) and unwarranted truncation will lead to unphysical behaviour of LO modes at the origin. Fortunately this term may be computed analytically and subtracted from the force constant matrix leaving the remainder term, which can be represented within a feasibly sized supercell [26]. This is the approach adopted by CASTEP, Phonopy and several other codes, which output only the short-ranged part of the force constant matrix. Euphonic computes the dipole-dipole correction term of [26] using the Born effective charges and dielectric permittivity to reconstruct the full force constant matrix.
2.2 Coherent inelastic neutron scattering
The coherent one-phonon scattering structure factors can be calculated at momentum transfer of scattered neutrons [15, 49]
| (7) |
where is the reduced wave vector in the first Brillouin zone (i.e. where is a reciprocal lattice vector), is the coherent neutron scattering length of atom , is the vector from the origin to atom within the unit cell, is the mass of atom , is the phonon polarisation vector at of mode for atom and is the phonon frequency of mode at . The term is the anisotropic Debye–Waller factor for atom , where the exponents can be written
| (8) |
| (9) |
where the sum is over wave vectors and modes in the first Brillouin Zone (BZ), is the number of -points in the sum, is the temperature, and run over the Cartesian directions, is the reduced Planck constant and is the Boltzmann constant. The Debye–Waller factor has been written in this form to make it explicit that the expensive computation of the set of matrices need only be performed once over an appropriately fine grid in the first Brillouin Zone, leaving computation of the Debye–Waller factor for an arbitrary as the fast evaluation of a quadratic form for each atom, Eq. 8.
From the one-phonon structure factors the neutron dynamical structure factor can be calculated
| (10) |
where the upper and lower signs refer to phonon creation and annihilation respectively and is the Bose population function
| (11) |
Finally, the neutron scattering cross-section per unit cell in term of is
| (12) |
where and are the incident and scattered neutron wave vectors.
3 Implementation
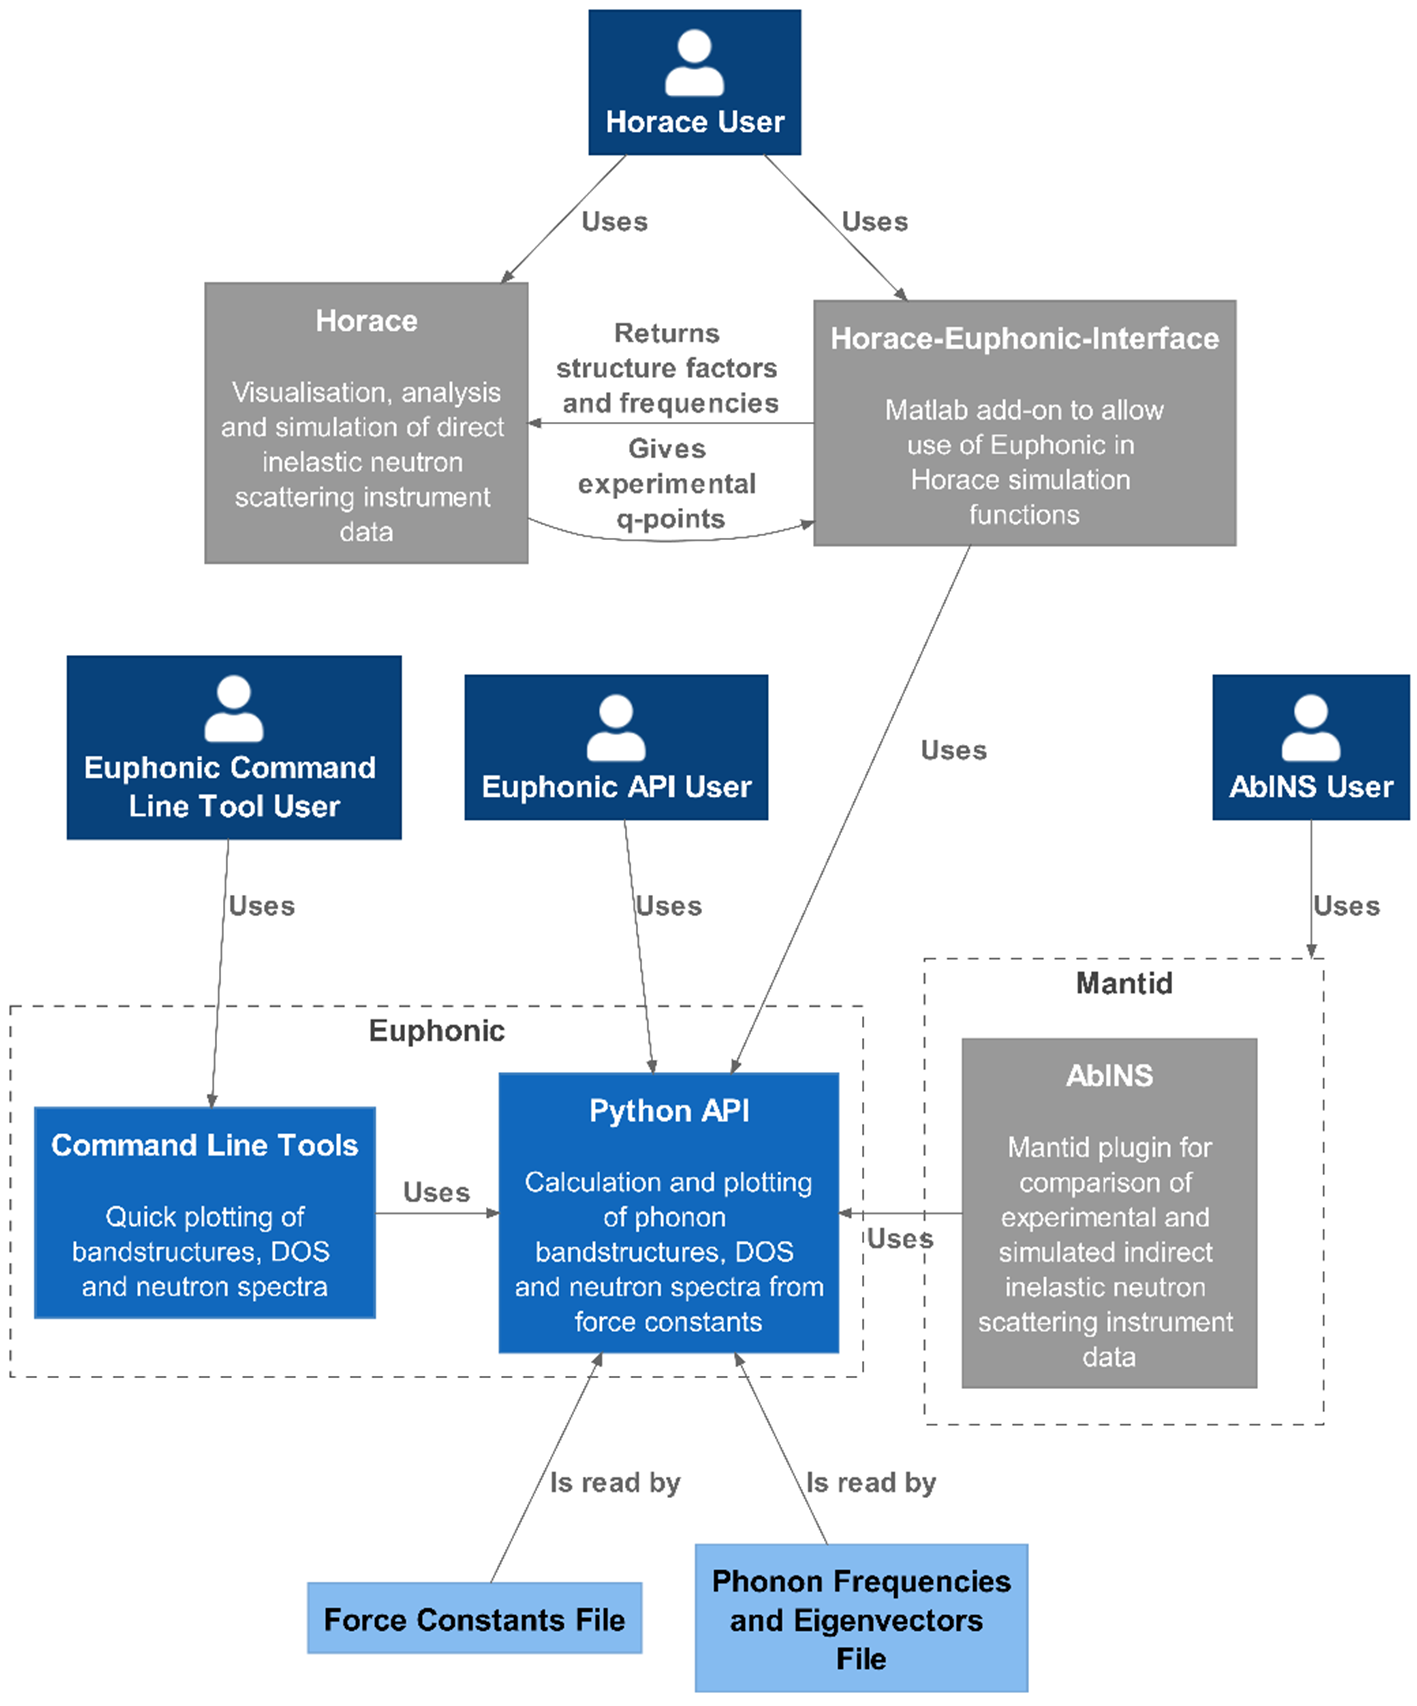
Euphonic provides an extensive Python API and a number of convenient command line tools. Fig. 1 shows how Euphonic connects with existing packages in the neutron software ecosystem. Established software such as Horace [17] and the Mantid [3] plug-in AbINS [16] make direct use of Euphonic as a calculator for simulated phonons and scattering intensities. The command line tools provide convenient plotting of phonon band structures, DOS and the neutron dynamical structure factor along specific reciprocal lattice directions (see Section 6.1). Euphonic can also be used directly from Python environments for customised plots, workflows or functionality development.
3.1 Context and API
In a typical Horace workflow, the scattering intensities at millions of -points can be combined to produce multidimensional plots of measured data. Prior to the availability of Euphonic, the workflow for generating such plots was limited by the need to read pre-computed phonon frequencies and eigenvectors from files produced by other programs. The bottleneck here becomes the activity of reading and writing to disk. For a system of atoms per unit cell, each -point has a set of eigenvectors whose storage requirements of floating-point numbers can become impractically large. For example, a 22-atom unit cell with a modest 25,000 -points would equate to a 5 GB text file in CASTEP .phonon format. In a typical cluster environment running the CASTEP phonons tool, more than 85% of run time is spent writing this file to disk (see Table 1 for specific timing examples). Furthermore, on a shared cluster resource this can be exacerbated by local network capacity and the activities of other users.
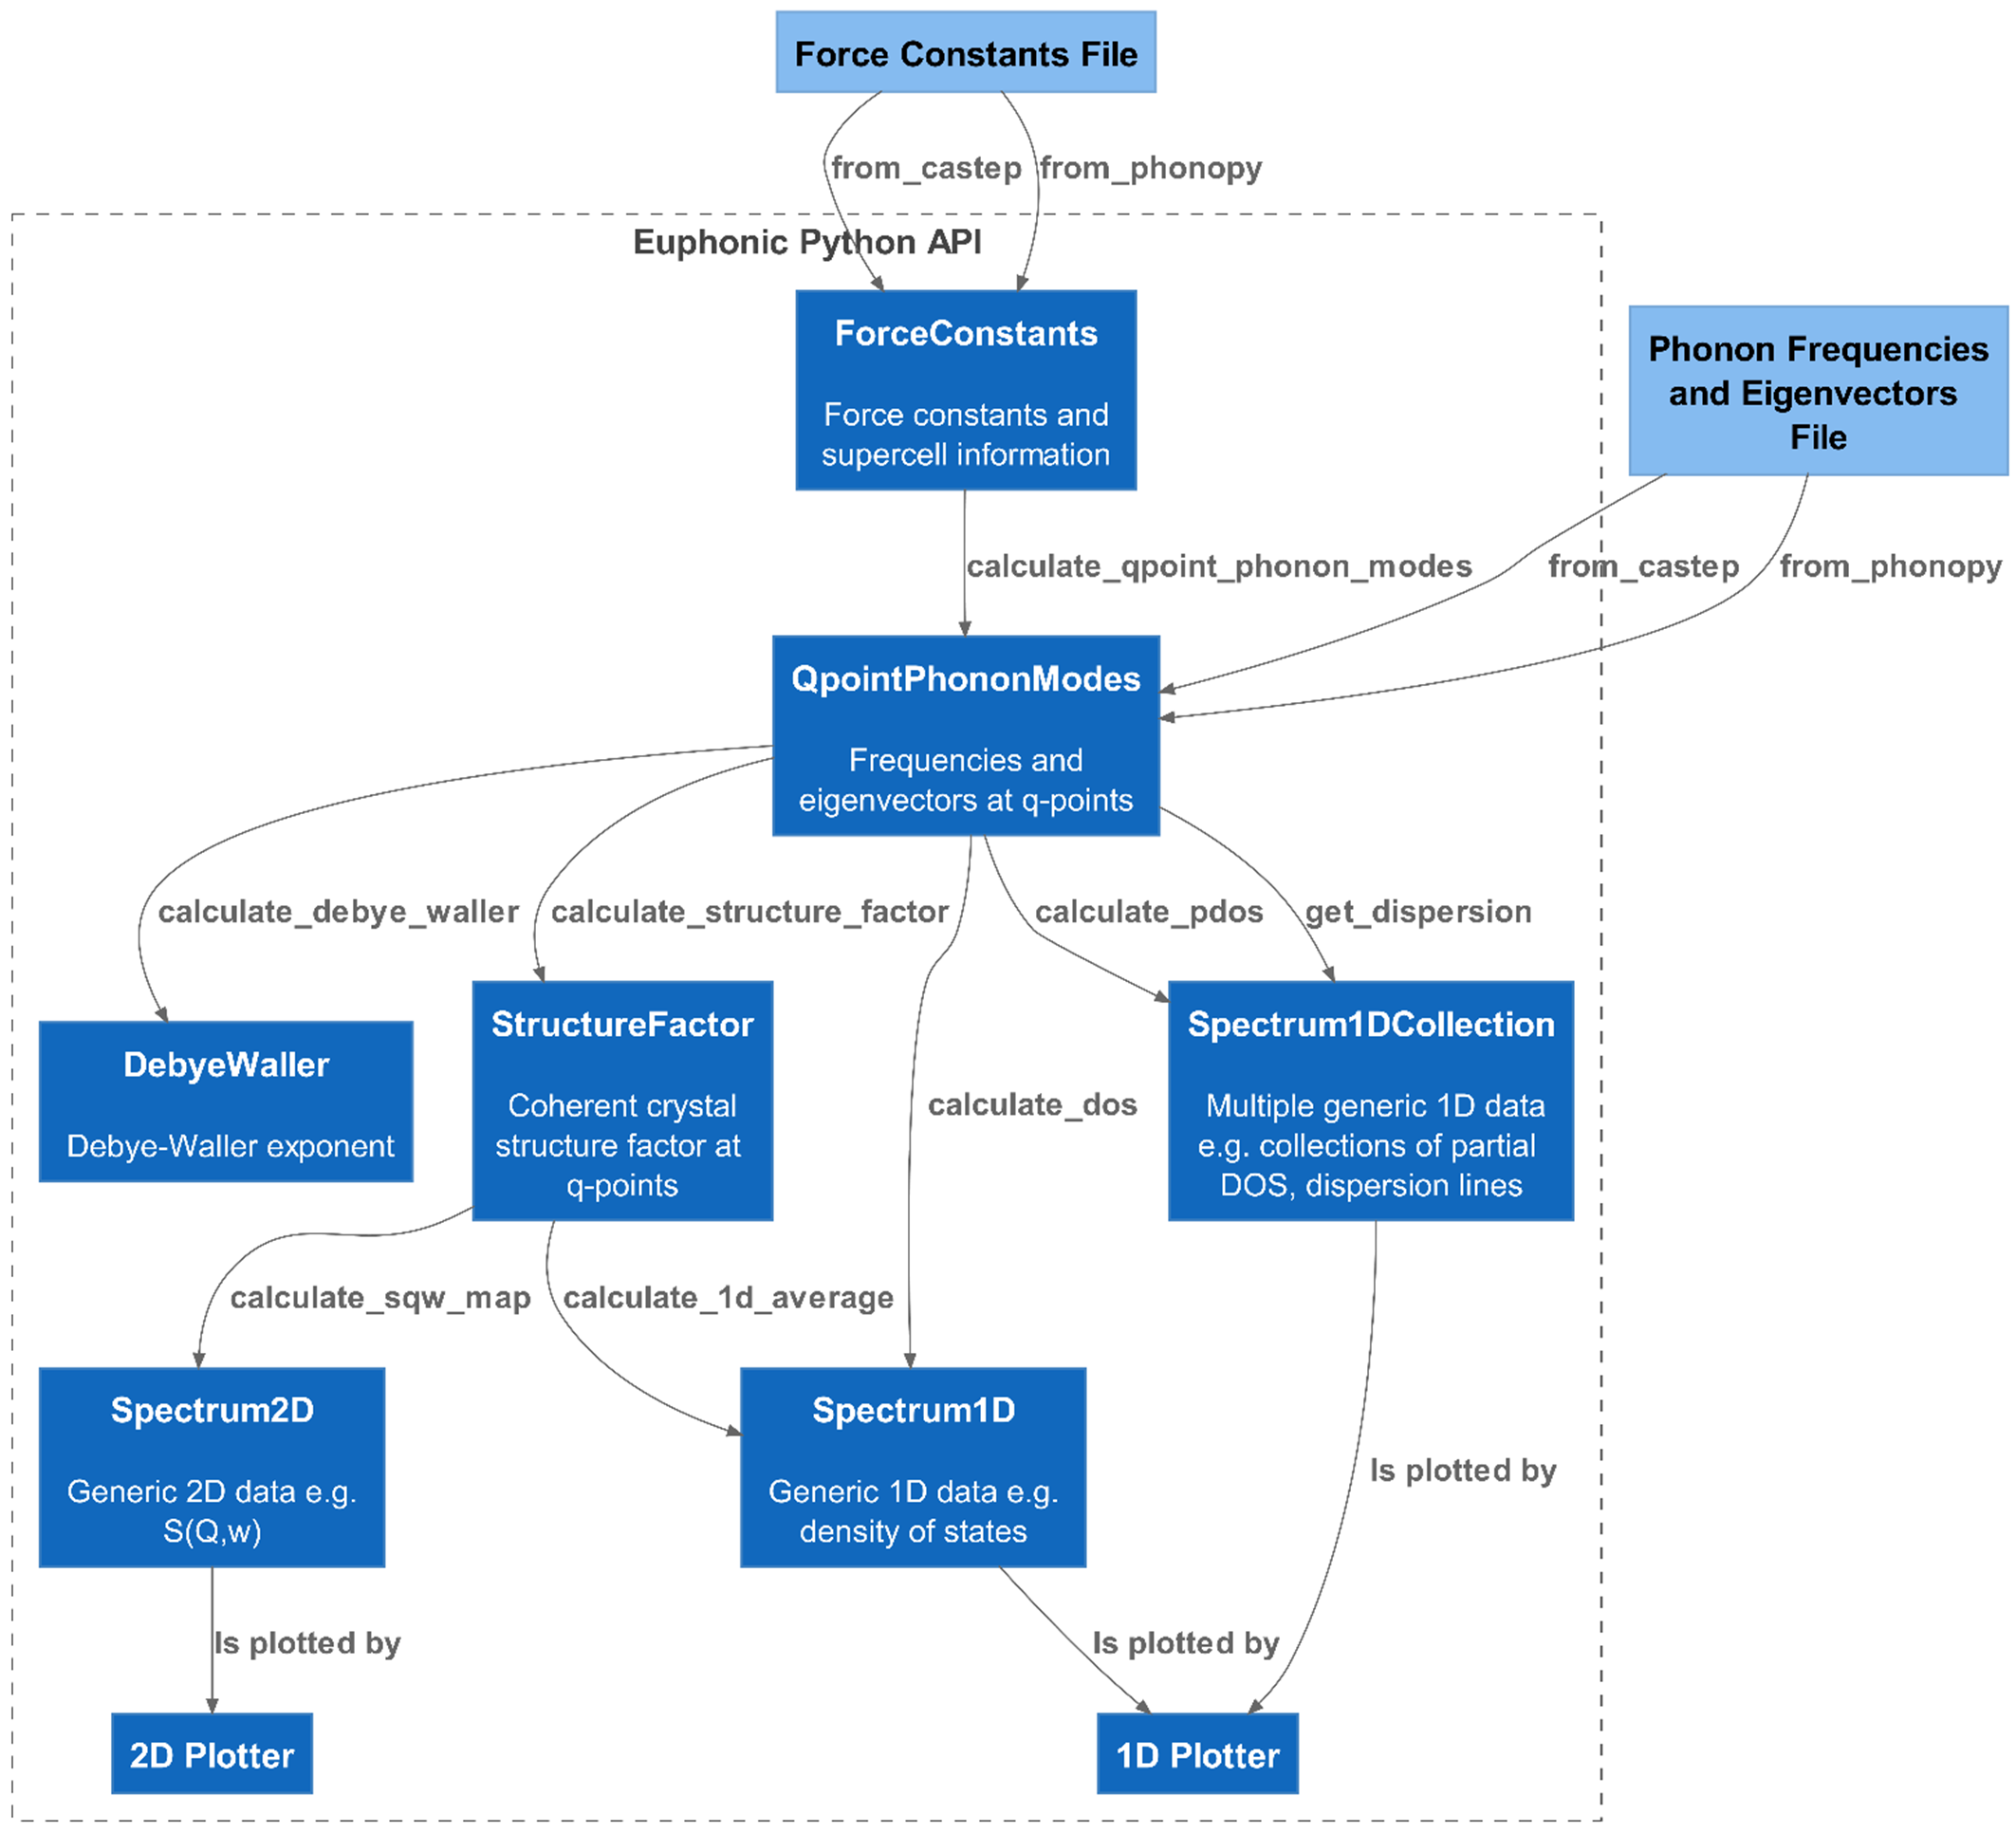
The requirement of efficiency for Euphonic has driven the decision to implement Fourier interpolation of phonon frequencies and eigenvectors directly from force constants. This allows for calculation of data for each -point on demand, removing any need for file-based data transfer from other codes. Accordingly, the representation of force constants as a class and associated methods forms the core of the Euphonic API, illustrated in Fig. 2 and described for reference below.
ForceConstants objects can be instantiated from Python data objects such as Numpy [30] arrays, but would typically be created from the data outputs of an external modelling code – currently CASTEP .castep_bin output and Phonopy phonopy.yaml, FORCE_CONSTANTS and force_constants.hdf5 output are supported. Through Phonopy, Euphonic force constants can be obtained using a wide variety of atomistic codes such as VASP [36], Abinit [27] and Quantum Espresso [24], making Euphonic accessible to a large portion of the materials modelling community. From the force constants, phonon frequencies and eigenvectors may be calculated at arbitrary -points using the methods described in Section 2.1.
QpointPhononModes represents phonon mode data: the -points, phonon frequencies and eigenvectors. QpointPhononModes can also be instantiated from external data files (currently, these are CASTEP .phonon and Phonopy mesh/band/qpoints files). The Pint Python library [29] is extensively used in Euphonic to represent dimensioned data as a Quantity with both a magnitude and a unit. This makes the units explicit, and facilitates conversion to the end user’s preferred units, usually one of meV, cm-1 or THz, in the case of phonon frequencies. No particular -point sampling is enforced; while, for example, a Monkhorst–Pack mesh is recommended for traditional DOS plotting, phonon modes can also be calculated along a high-symmetry path or sampled at random points depending on the use case. From the phonon modes, Euphonic can compute quantities such as the mode-resolved structure factors, the Debye–Waller exponent and total, partial and neutron-weighted DOS.
StructureFactor is derived from the phonon modes. This object contains the neutron structure factors resolved by -point and phonon mode index () and also the -points and frequencies. This can be binned in energy to produce a two-dimensional (2D) plot, or averaged over the contained -points to produce a one-dimensional (1D) spectrum.
DebyeWaller represents the temperature dependent Debye–Waller factor; specifically, it contains the set of matrices, one per atom, defined in Eq. 9. A DebyeWaller object is typically pre-computed over a uniform -point mesh and then applied during a structure factor calculation to perform the fast calculation of the atomic Debye–Waller exponent via Eq. 8 over whichever (potentially large) set of -points are appropriate to the task at hand.
Spectrum2D, Spectrum1D and Spectrum1DCollection are classes representing generic spectrum objects that can be used for various purposes, such as representing the DOS with Spectrum1D, or a or intensity map with Spectrum2D. Band structure and partial DOS data are represented with Spectrum1DCollection, which ensures consistent bins are used and allows individual lines to be tagged with metadata. The plotting tools in turn work with the generic spectrum objects to produce plots of phonon band structure, DOS, and intensity maps.
Crystal is a simple class containing the crystal structure information: the cell vectors, atom positions, species and masses. The above ForceConstants, QpointPhononModes, StructureFactor and DebyeWaller classes all contain an instance of this crystal class as an attribute, to ensure the data in each class remains complete and unambiguous.
3.2 Use with Horace
A widely used software application for analysis and visualisation of multidimensional time-of-flight inelastic neutron scattering data from single crystal experiments is Horace [17]. In addition to handling and plotting the data, it also allows simulation and fitting of these datasets with user-created models of the scattering function. A Matlab add-on has been developed, Horace-Euphonic-Interface [19] which provides interface functions that allow Euphonic to be used to simulate datasets directly in Horace. The way this works is illustrated in Fig. 1. First a user sets up a model with Horace-Euphonic-Interface, giving the path to the force constants file or folder, and adding other optional parameters such as the sample temperature or the Debye–Waller grid size. The user then calls a Horace simulation function with the dataset to be simulated and the model they have just created. Horace will automatically provide the -points to be simulated to Horace-Euphonic-Interface, which then calls Euphonic to calculate the structure factors and phonon frequencies at those -points. Horace-Euphonic-Interface then converts the output from Euphonic into the required form for Horace to create the simulated dataset.
This is a significant improvement over previous workflows to simulate scattering from phonons, which required users to program their own functions to calculate the structure factors from ab initio calculations. These would not usually include Fourier interpolation of the force constants, and hence were restricted to the -points output by the ab initio calculations. These bespoke scripts were also not typically optimised for fast computation. Horace-Euphonic-Interface has allowed users to easily simulate on exactly the same axes and in the same software as the experimental data, making fitting of scaling factors and quantitative comparisons much more convenient. The performance of Euphonic has also made application of the Monte Carlo based instrumental resolution convolution method [43] available in Horace tractable with phonons for the first time. Examples of data simulated and fitted with Euphonic and Horace are shown in Section 6.3. Horace-Euphonic-Interface is open source and distributed as a Matlab Toolbox file on Github and the Matlab File Exchange. Links to the source code and online documentation are available from the DOI landing page https://doi.org/10.5286/SOFTWARE/HORACEEUPHONICINTERFACE [19].
3.3 Use with AbINS
AbINS is a code which simulates powder-averaged INS spectra in an analytic incoherent approximation, and resides in the Mantid framework used for experimental data reduction and analysis [16, 3, 2]. AbINS has recently been updated to make use of Euphonic; as of Mantid version 6.3, it is possible to select force constants data in CASTEP or Phonopy format as an input file. End users do not need to know anything about Euphonic or change their workflow, except to ensure that force constants data is present in their .castep_bin or phonopy.yaml files. A single-parameter cutoff distance (as defined by [40], and hidden from the user interface) is used to determine a default Monkhorst–Pack mesh for the given crystal structure; eigenvalues and eigenvectors are computed using the Euphonic Python API and passed on to the usual incoherent inelastic scattering computation [16]. AbINS and Horace have different target users: with Euphonic as a common dependency, it becomes possible for these neutron-scattering simulation codes to develop overlapping feature sets while sharing implementation work.
4 Performance profiling and optimisation
Given the aim of calculating scattering intensities at millions of -points, performance optimisation of Euphonic has been a priority. Table 1 illustrates the potential cost of writing large eigenvector arrays to disk, which has been avoided in Euphonic by enabling its own interpolation from force constants. There are four main steps in computing the neutron dynamical structure factor from force constants: reading the force constants, computing the phonon frequencies and eigenvectors (interpolation), computing the mode-resolved structure factors and, finally, applying the Bose factor and binning these in energy to obtain . Reading the force constants only has to be done once, and the binning for large datasets is typically done via another program such as Horace.
Of the two remaining parts, the calculation of phonon frequencies and eigenvectors is by far the most expensive, illustrated in Table 2. Even in the case of \ceLa2Zr2O7, which has the most expensive structure factor calculation due to the number of atoms in the unit cell, the interpolation takes approximately 20 times longer. For this reason, this part of the calculation has been the focus of much of the optimisation effort, and performance comparisons have been made with another interpolation tool, the CASTEP phonons tool, rather than software that performs the cheaper structure factor calculations such as Ab2tds [39] or OClimax [11, 10]. The Phonopy software does perform phonon interpolation, but has not been chosen for performance comparisons as it does not (as of version 2.11.0) parallelise its calculation over -points.
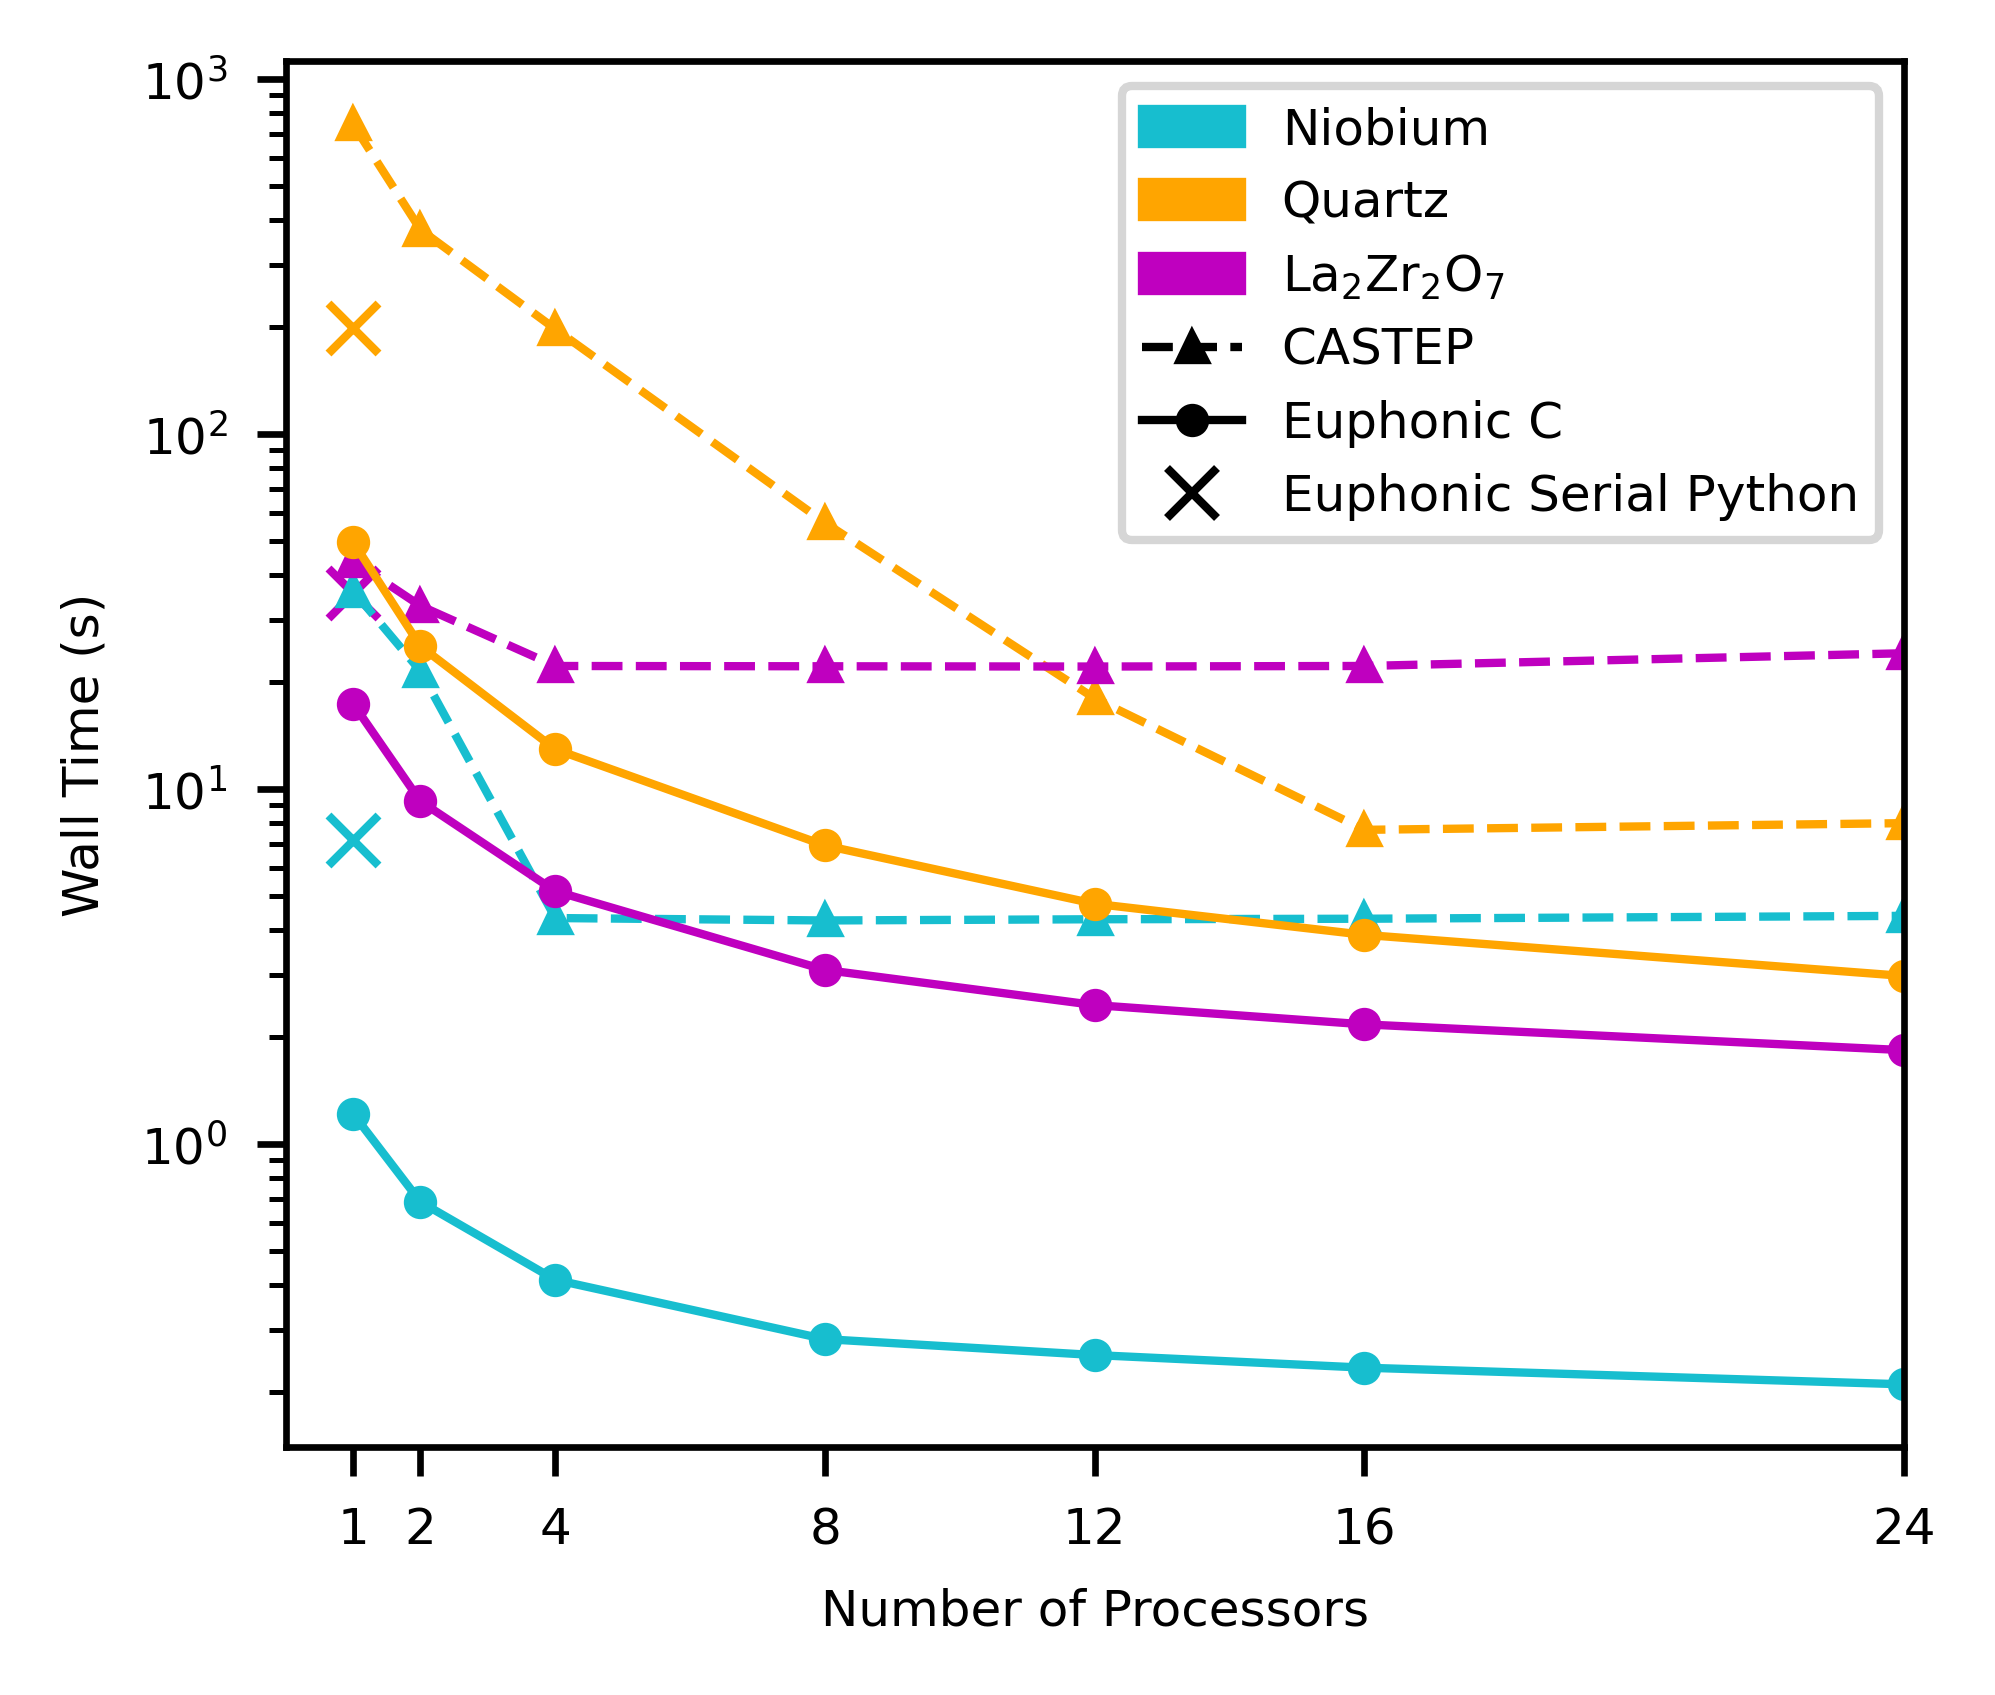
Euphonic makes extensive use of Numpy to improve its performance, but the serial Python performance shown in Table 2 is still not sufficient to simulate the numbers of -points contained in larger multidimensional - datasets in a reasonable time. Accordingly, an extension has been written in C and OpenMP to perform the interpolation part of the calculation, which both improves performance significantly and enables calculations to be carried out in parallel. The performance improvement can be seen in Fig. 3, which shows the time taken to run the calculate_qpoint_phonon_modes interpolation function in Euphonic for 25,000 -points for different materials, for both the serial Python and parallel C implementations. One metric for comparing performance is the speedup calculated as the ratio of the times to perform the same operation in the two implementations:
| (13) |
For one processor, use of the C extension gives speedups of 2.1, 4.0 and 6.0 over the pure Python implementation for \ceLa2Zr2O7, quartz and Nb respectively. Fig. 3 also shows how the wall time changes with increasing numbers of processors and compares it with the time taken to run the phonon_calculate function from the CASTEP phonons tool. Care has been taken to get a fair comparison, so CASTEP features that are not available in Euphonic which would have decreased the performance of CASTEP have been switched off (group theory analysis, dynamical matrix symmetrisation) and features that could not be turned off have been profiled and subtracted from the total time (writing the .phonon file, constructing the force constant matrix). Even with this taken into account, the performance of Euphonic is better than the CASTEP phonons tool by an order of magnitude in some cases, with Euphonic giving speedups of 13.1, 2.7 and 20.9 over the CASTEP tool for \ceLa2Zr2O7, quartz and Nb respectively for 24 processors.
It can be seen in Fig. 3 that interpolation for quartz is slower than \ceLa2Zr2O7, despite having fewer atoms per unit cell. This is due to the expensive Ewald sum correction that must be applied to the dynamical matrix for polar materials, described in Section 2.1. This calculation has been heavily optimised in Euphonic, and explains the performance difference between Euphonic and the CASTEP phonons tool for quartz. In the case of Nb and \ceLa2Zr2O7, the performance discrepancy largely comes from the fact that the CASTEP phonons tool uses distributed memory parallelism via MPI, so needs to communicate the phonon frequencies and eigenvectors back to the main process, which is where most time is spent. Euphonic does not have this issue as it makes use of shared memory parallelism via OpenMP. This was chosen specifically to satisfy the two main use cases for Euphonic: running smaller calculations on a single computer or node; and running larger calculations on a cluster via a data analysis tool such as Horace, in which case Horace would handle any multi-node parallelism.
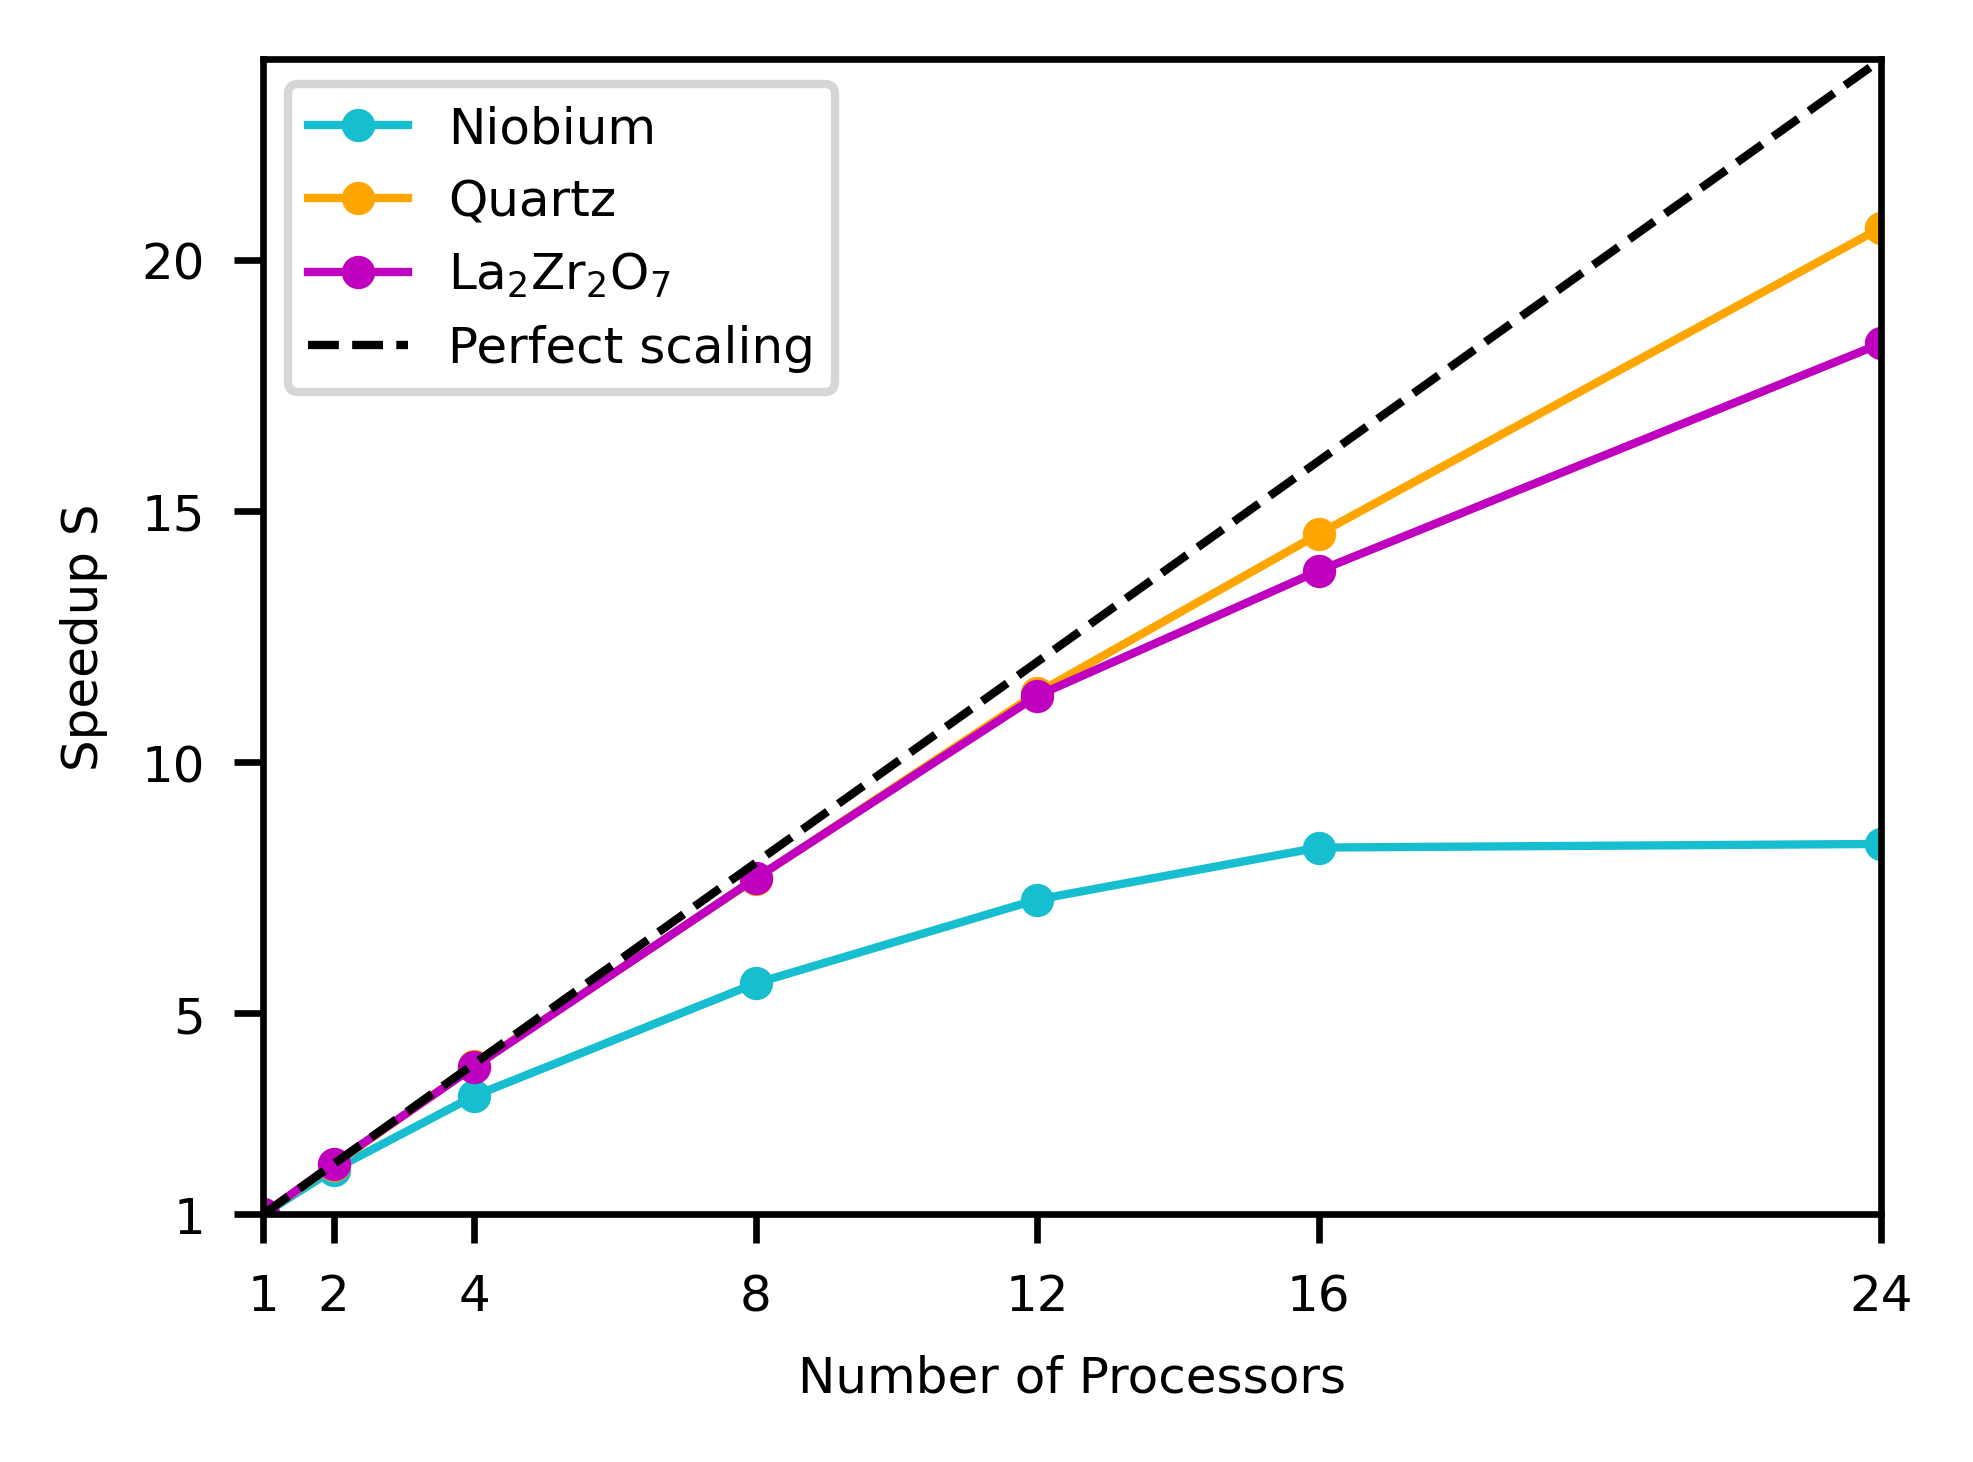
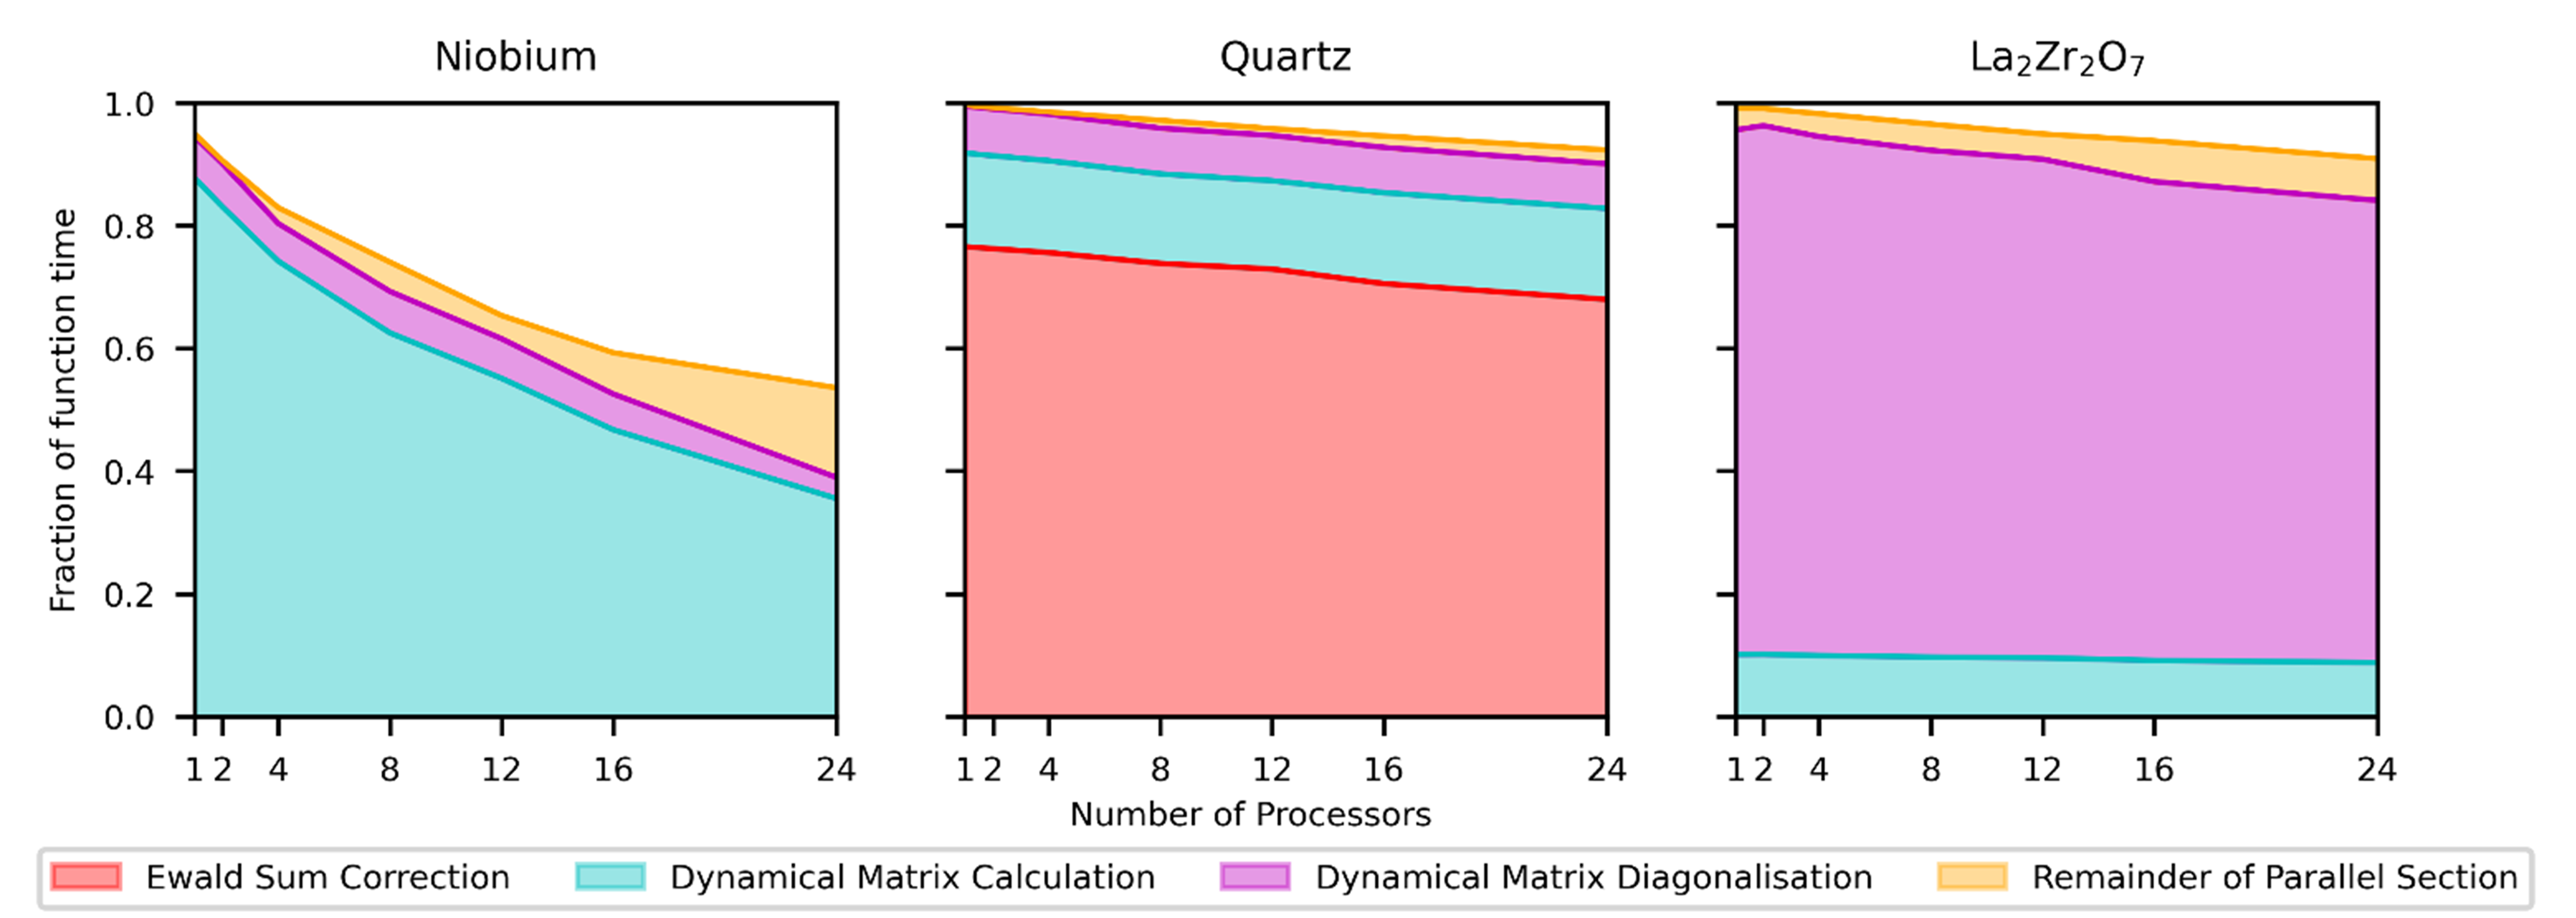
The number of -points used for comparison of Euphonic to other tools, 25,000 for the benchmarking presented above, was chosen because it pushes the limits of the CASTEP tool, and allows results to be obtained in a reasonable amount of time. However, the run times of just a few seconds for Euphonic for large numbers of processors are not enough to obtain good performance data, as a non-negligible amount of time will be spent in non-computational parts of the code, for example importing libraries or spawning threads. The interpolation in Euphonic has therefore also been profiled for 250,000 -points, and has been used to demonstrate the performance scaling, this is shown in Fig. 4. The speedup has been calculated as in Eq. 13, where is the serial interpolation function time, and is the parallel time. Each interpolated -point is independent, so the calculation can easily be parallelised over -points using a parallel for loop. Despite this independence of -points, the scaling is imperfect, particularly for Nb. This can be explained by looking at Fig. 5, which shows the time spent in different parts of the interpolation calculation in C for different numbers of processors and materials. In particular, the serial Python part of the calculation shown in white imposes a 0.1 s overhead, which limits the maximum possible speedup, especially for a small system like Nb where the parallelised part only takes 0.1 s with 24 processors. The serial part includes various set-up tasks, such as calculating the list of periodic supercell images as described in Section 2.1.1.
Fig. 5 also explains the longer run times for quartz seen in Fig. 3. Even after being the focus of much optimisation work, the Ewald sum still takes around 70% of the total interpolation time for quartz. This optimisation has included avoiding redundant calculation of -independent values by factorisation, and optimising the balance between the real and reciprocal space sums ( in equation 5 in [26]). Changing will not change the result but can drastically improve the performance if chosen correctly. The optimum value depends on the material and is not immediately obvious — Euphonic provides a command-line tool, euphonic-optimise-dipole-parameter, which profiles the calculation for a few -points and suggests the optimum value for that system for use in further calculations. Even with these optimisations, there is still a performance penalty for the calculation of phonons for polar materials, suggesting a target for further optimisation work. In non-polar materials, most of the time is spent either calculating or diagonalising the dynamical matrix. This depends strongly on the number of atoms in the unit cell vs. the number of cells in the supercell. In the case of \ceLa2Zr2O7, which has 22 atoms in the unit cell, over 70% of the interpolation time is spent diagonalising the dynamical matrices. By contrast Nb has 1 atom per unit cell and (ignoring serial overhead) over 80% of the time is spent calculating dynamical matrices.
4.1 Hardware and software libraries
All profiling in this section has been completed on the STFC Scientific Computing Department’s SCARF Cluster using the SCARF 18 hardware, which contains 2 Intel Gold 6126 processors per node (24 cores per node). Euphonic 0.6.1 and CASTEP 19.1 were used. Both the Euphonic C extension and the CASTEP phonons tool have been compiled with the Intel 2018.3 compiler, OpenMPI 3.1.1 and linked against Intel MKL 2018.3. The profiling results can be obtained at https://github.com/pace-neutrons/euphonic-performance.
5 Validation
The results of a comparison of Euphonic output to experimental inelastic neutron scattering data will be given in Section 6.3. In this Section, to test the calculation of the dynamical structure factor stringently, Euphonic is validated against two other programs - Ab2tds [39] and OClimax [11, 10]. This allows validation of the more subtle parts of the calculation (such as the Debye–Waller factor) without the complication of other scattering mechanisms or broadening due to the instrumental resolution, nor the possibility of the first-principles computation of the force constant matrix failing to fully capture the physics of the lattice dynamics. For the validation comparisons, four materials have been chosen: \ceLa2Zr2O7, quartz, Nb and Al. \ceLa2Zr2O7, quartz and Nb force constants, frequencies and eigenvectors have been computed using CASTEP, and the corresponding data for Al has been computed using VASP and Phonopy, to validate both the CASTEP and Phonopy readers available in Euphonic.
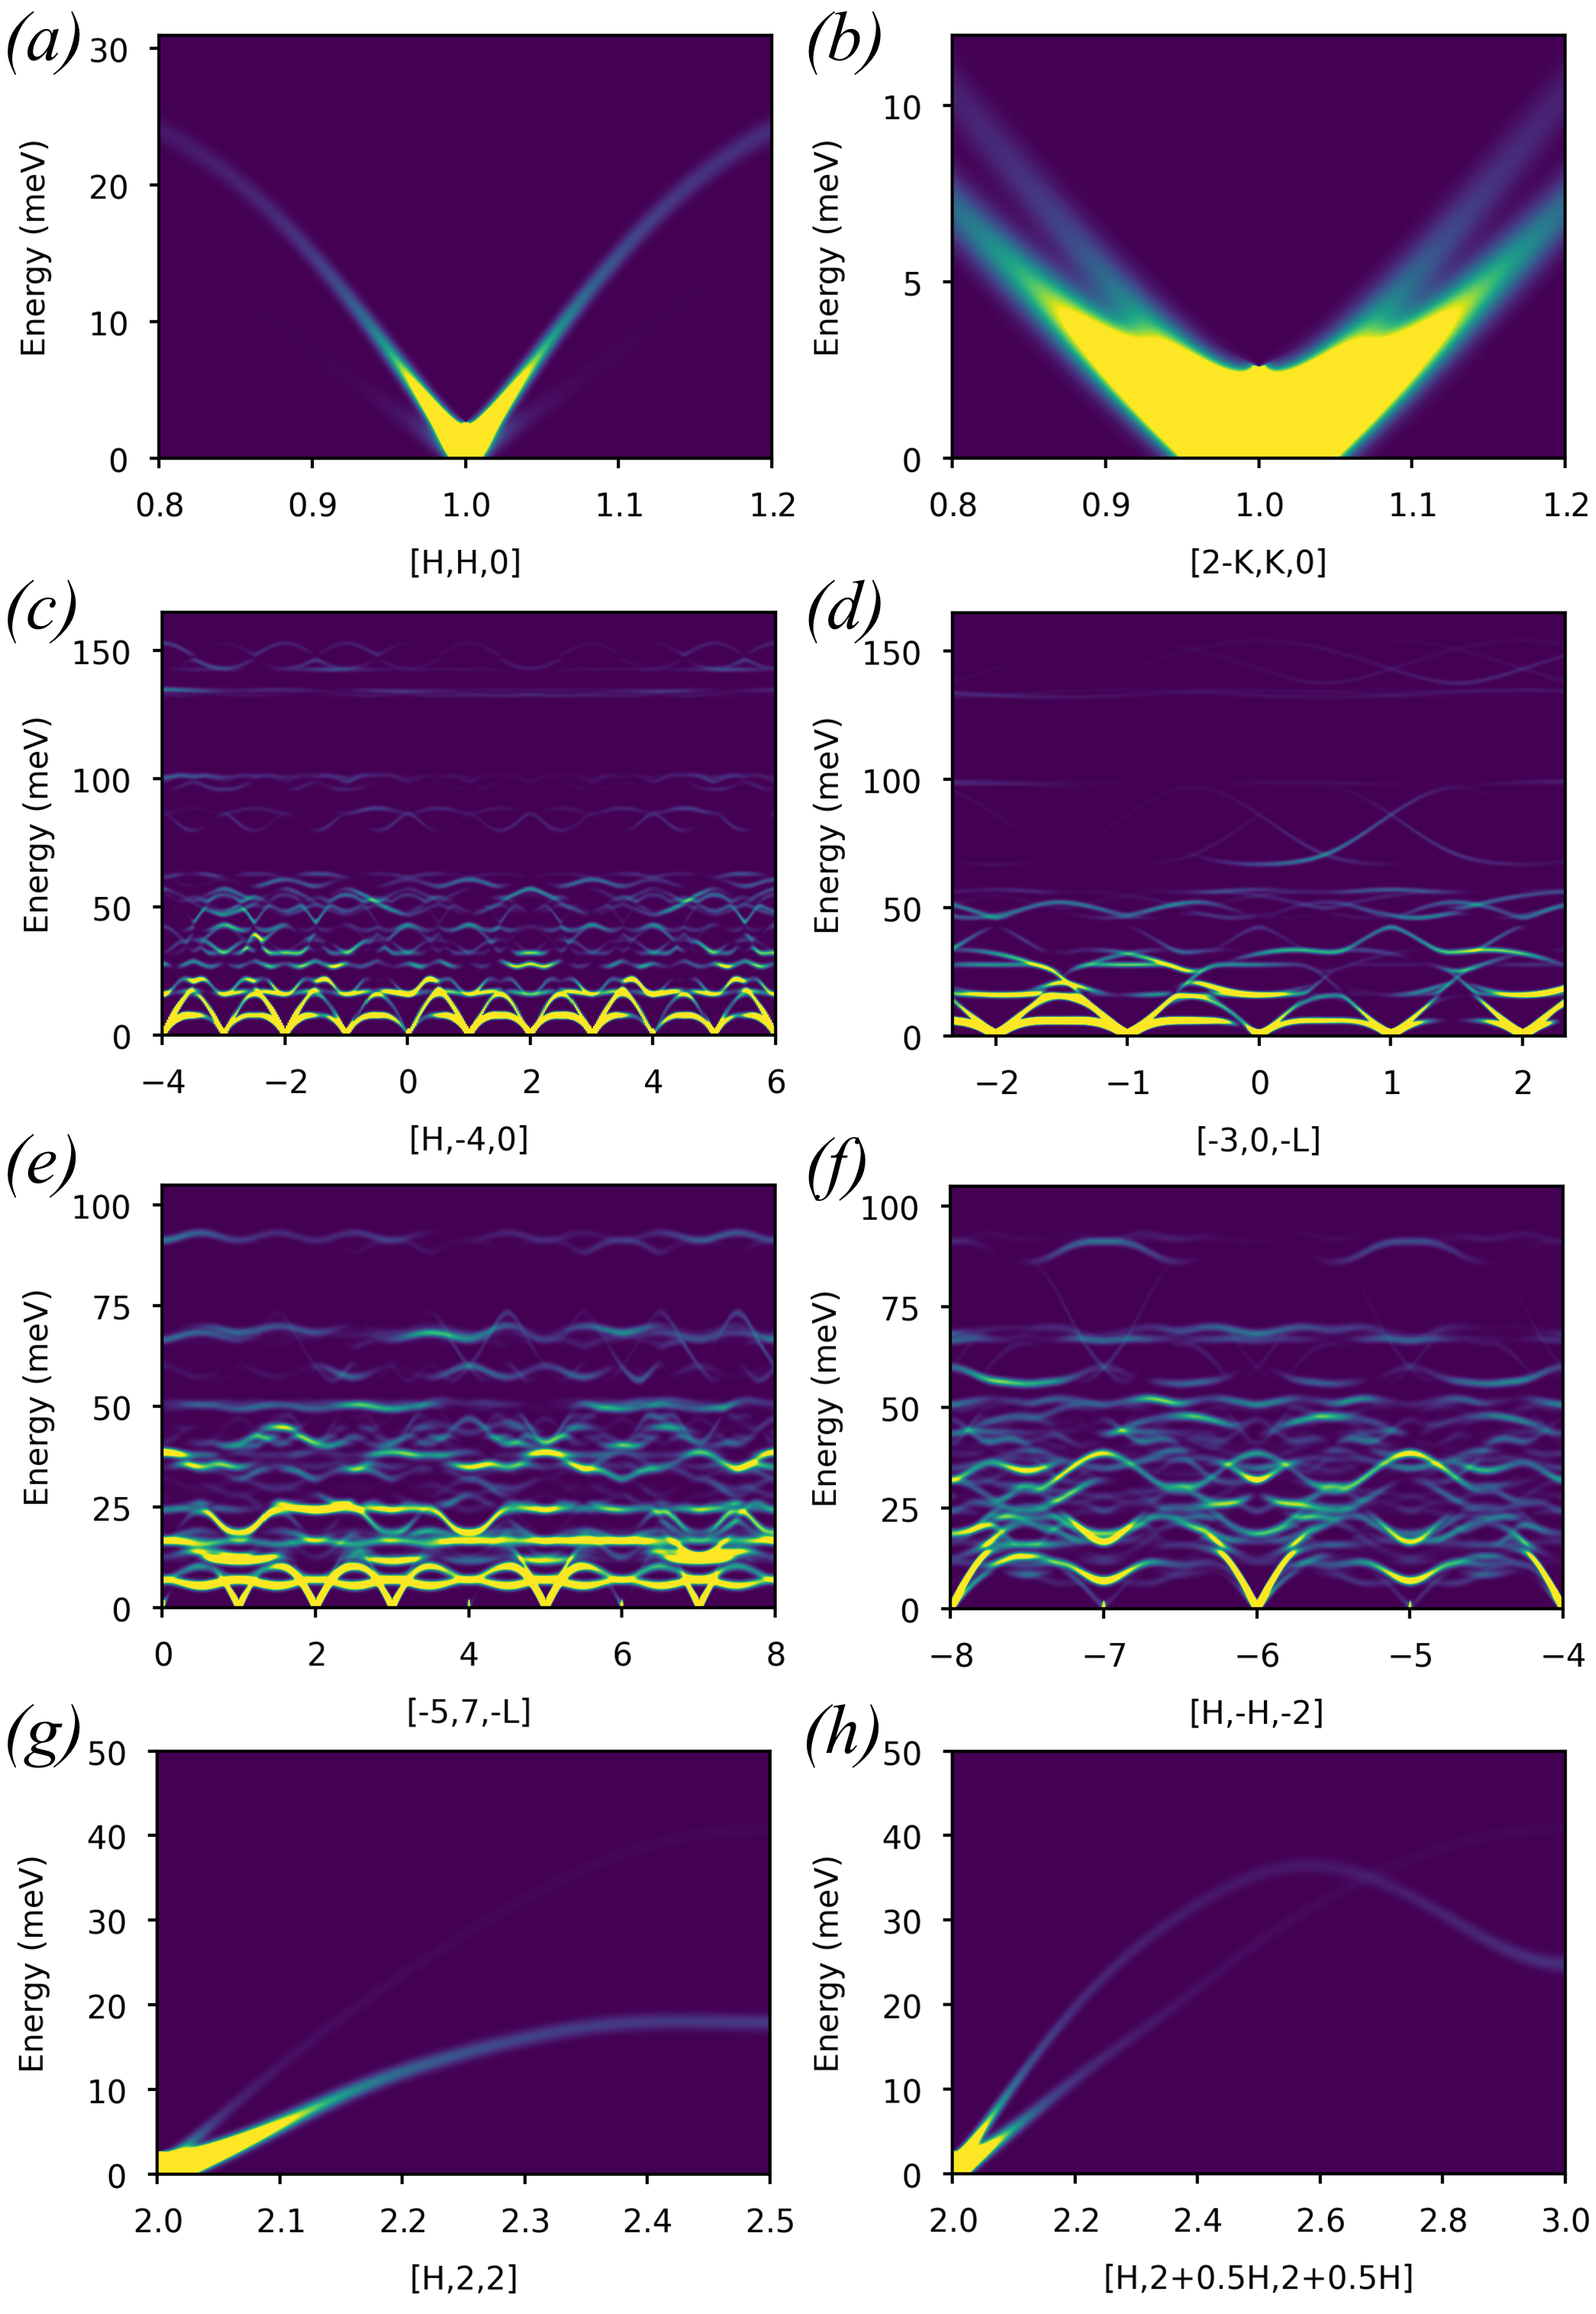
The data chosen for validation are all 2D (,) maps as these types of data can be calculated by all three programs. The data maps have a wide variation of magnitudes and directions in to ensure the variation of quantities such as structure factors and Debye–Waller factors across -space are reliably tested. Visualisations of the chosen (,) maps are shown in Fig. 6. The metric that has been used for comparison is the mean relative percentage difference (MRPD):
| (14) |
where is the neutron dynamical structure factor ( as in Eq. 10) calculated with Euphonic, and is the equivalent calculated with OClimax or Ab2tds. Acoustic modes close to the gamma point, which have diverging intensity, and very low intensity data have been excluded to avoid numerical instabilities (more details are in the supplementary material). The OClimax neutron dynamical structure factors have been read directly from OClimax output. In the case of Ab2tds, the instrumental resolution applied when creating such maps could not be completely removed from the Ab2tds output, so the dynamical structure factor has instead been calculated by binning in energy the Ab2tds mode-resolved output (which is equivalent to the one-phonon structure factor in Eq. 7 with the factor from Eq. 10 already applied).
The results of the comparisons are summarised in Table 3 (Ab2tds) and Table 4 (OClimax). The right-hand column of each table shows the MRPD for calculated from phonon frequencies and eigenvectors obtained from interpolation via CASTEP (Nb, quartz, \ceLa2Zr2O7) or Phonopy (Al). These MRPD test the computation of by Euphonic directly from the frequencies and eigenvectors. The previous column shows the comparison when in the case of Euphonic is computed from the force constants, in order to test the interpolation available in Euphonic in addition to the calculation from the phonon frequencies and eigenvectors computed by that interpolation. For Ab2tds the agreement is extremely good, with MRPDs of 0.05% or less. In the case of OClimax, the MRPDs are significantly larger, up to 2.62% for the \ceLa2Zr2O7 [-5, 7 -L] cut at 300K. However, the overall comparison is still reasonably good, without particularly systematic variation of the relative percentage difference across the slices. The scripts used for validation and the Euphonic, Ab2tds and OClimax inputs and outputs are available at https://github.com/pace-neutrons/euphonic-validation. Further details on the validation calculations are given in the supplementary material.
6 Examples
6.1 Command-line tools and plotting
This section illustrates some of the main features of Euphonic, using a variety of samples for both single crystals and powders, from a range of modelling codes. An overview of each of the command-line tools in Euphonic is shown in Table 5, with example figures referenced for each. Many of these tools allow sampling parameters (e.g. energy bins, broadening) and appearance options (e.g. unit conversions, axis labels and styling) to be easily specified via command-line arguments.
6.2 Experimental powder data comparison
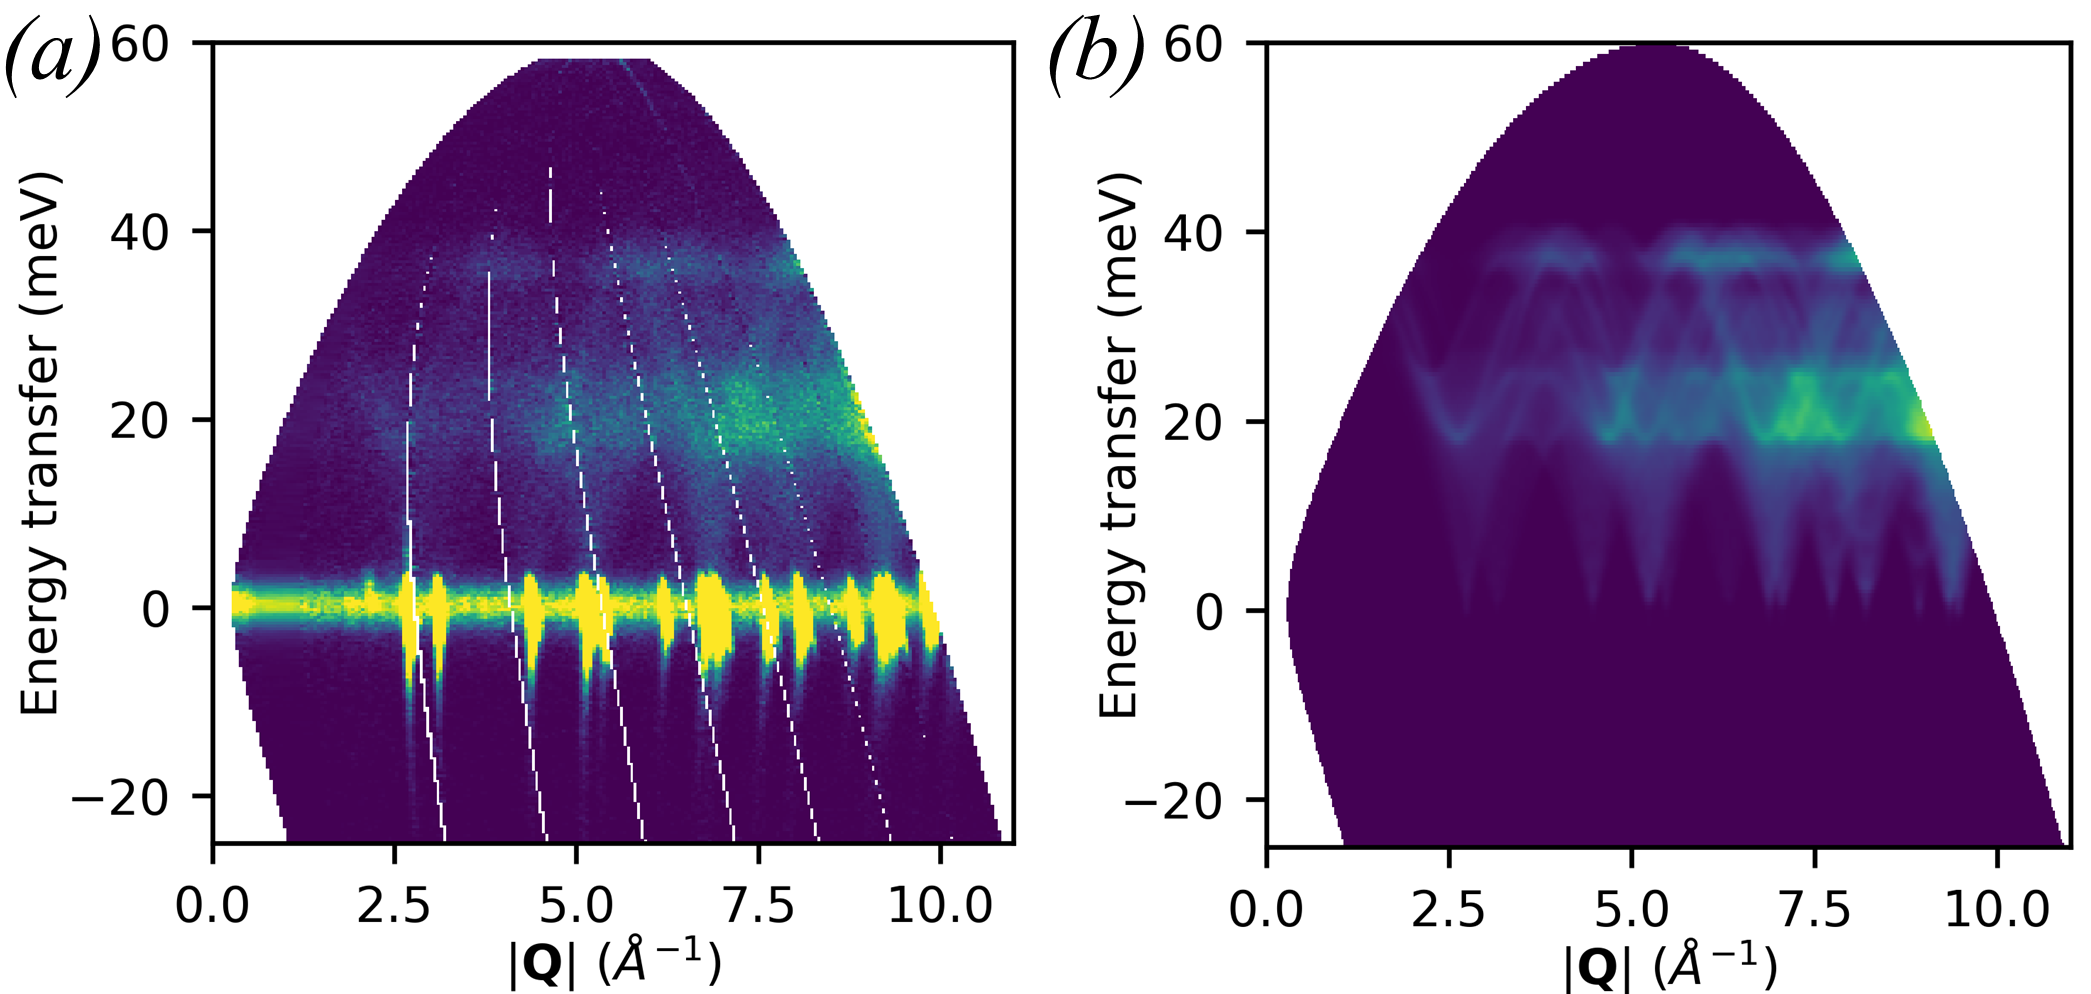
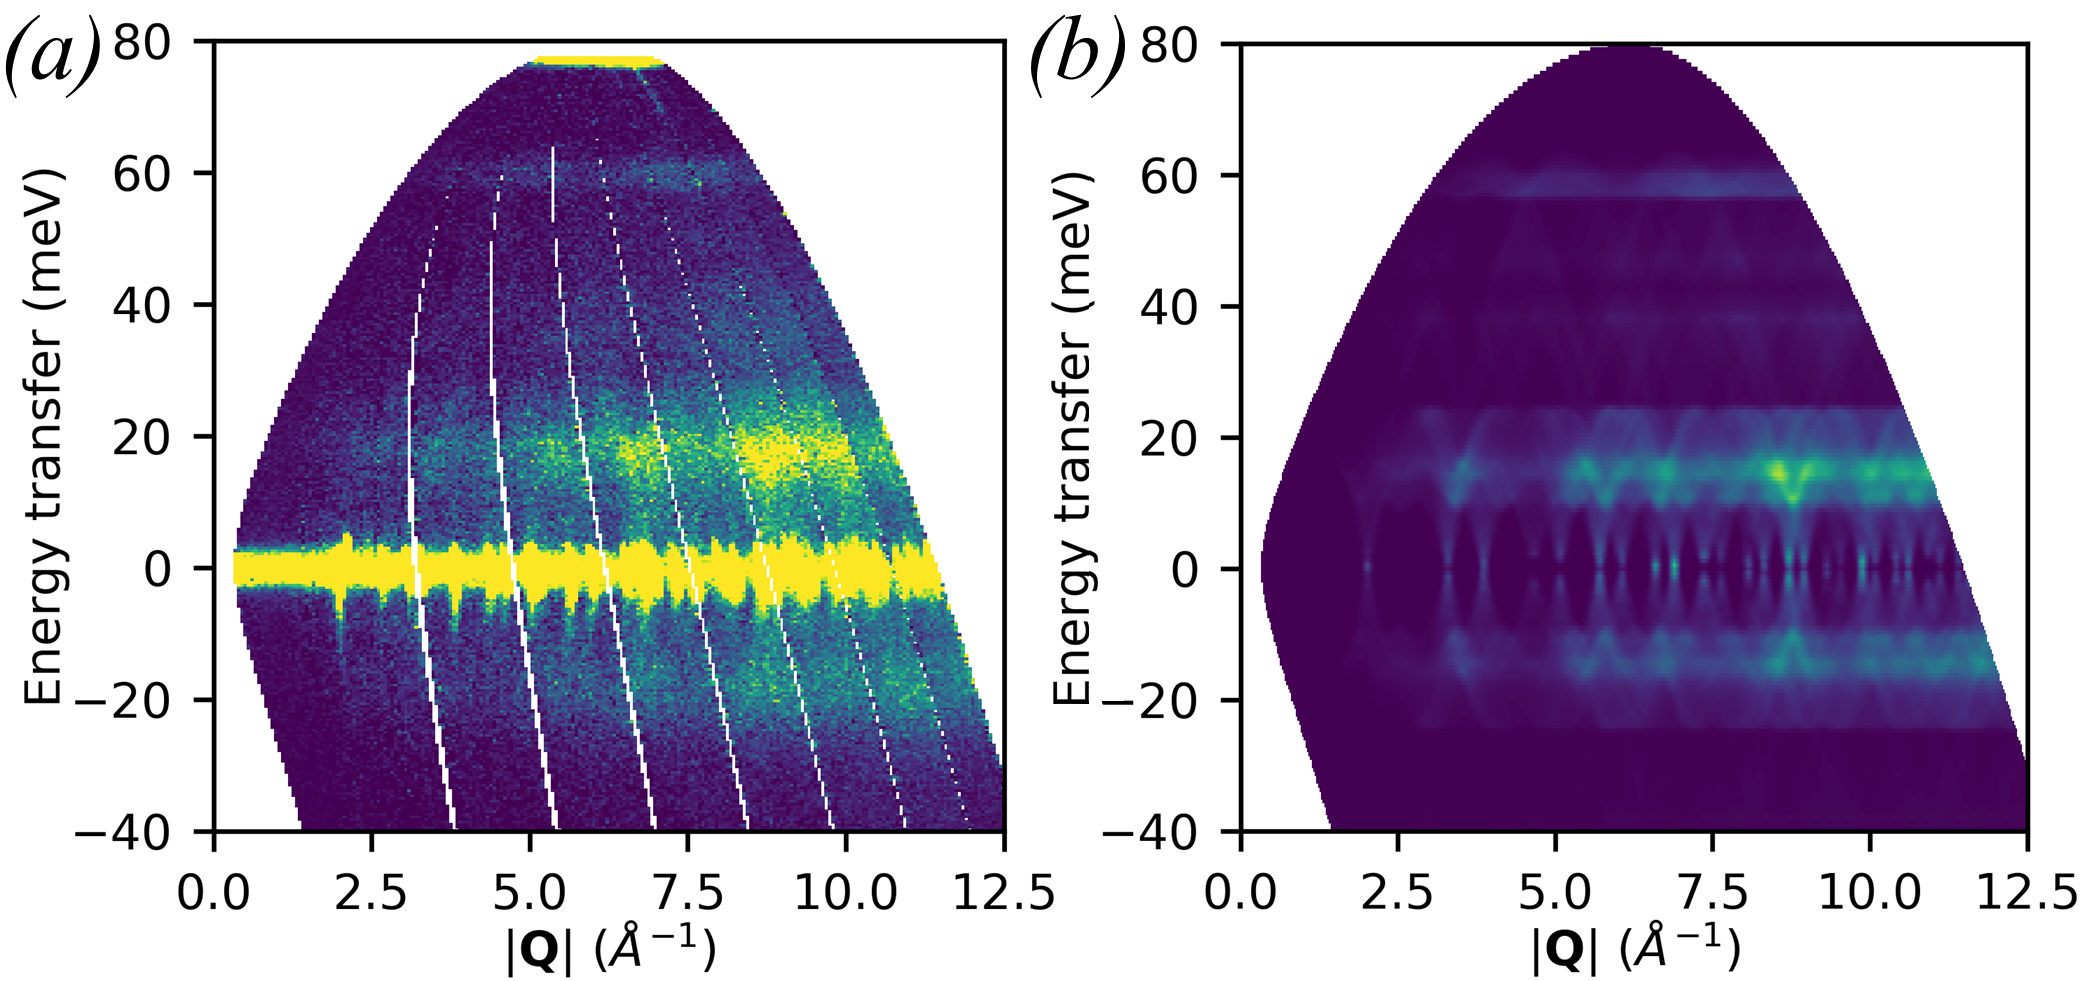
Here, prior experimental measurements are compared with newly simulated spectra [18]. Measurements of powdered elemental samples of Al (at 5 K with 60 meV incident energy and the Gd monochromating chopper running at 200 Hz) and Si (at 300 K with 80 meV incident energy with the “sloppy”111The term “sloppy” here means the chopper has relative wide openings to maximize flux over a wide range of energies (particularly low energies ¡ 100meV), in contrast to other choppers which are optimized for sharp resolution at specific (high) energies but at the cost of lower transmission and flux. monochromating chopper at 250 Hz) were recorded on the MARI instrument at ISIS, the data were reduced using Mantid and binned to 2D maps using MSLICE in Mantid (Fig. 10(a) and Fig. 11(a)). For the Al calculations, VASP 5.4.4 was used, and the force constants were obtained by finite displacements using Phonopy [36, 37, 50]. For Si, CASTEP was used, obtaining force constants by density-functional perturbation theory (DFPT) [13, 45]. For more details, see the supplementary material.
The resulting castep.bin and phonopy.yaml files were used with the euphonic-powder-map command-line tool to generate numerically sampled maps of . (Details of the parameters are given in the supplementary material). These results are plotted in Fig. 10(b) and Fig. 11(b) and include the main inelastic scattering features in the positive region of the experimental measurements. It is easy to see in both the experimental and simulated data how spherically averaged periodic features collide to create broad regions of higher intensity. In the case of the 300 K Si data, both the experimental and simulated results have significant intensity in the negative energy transfer region, whereas for the 5 K Al data the intensity is suppressed in this region. This arises from the Bose population factor suppressing the low temperature scattering. The high intensities seen around zero energy transfer in the experimental measurements in Fig. 10(a) and Fig. 11(a) are due to scattering from Bragg peaks which is not currently modelled by Euphonic, hence they are absent from the corresponding simulations in Fig. 10(b). and Fig. 11(b). The high intensity feature in Fig. 11(a) at 80 meV is an artefact due to a later pulse of neutrons which passes through the chopper system, and is not due to scattering from the sample, so is not reproduced in the simulated data in Fig. 11(b).
6.3 Experimental single crystal data comparison using Horace
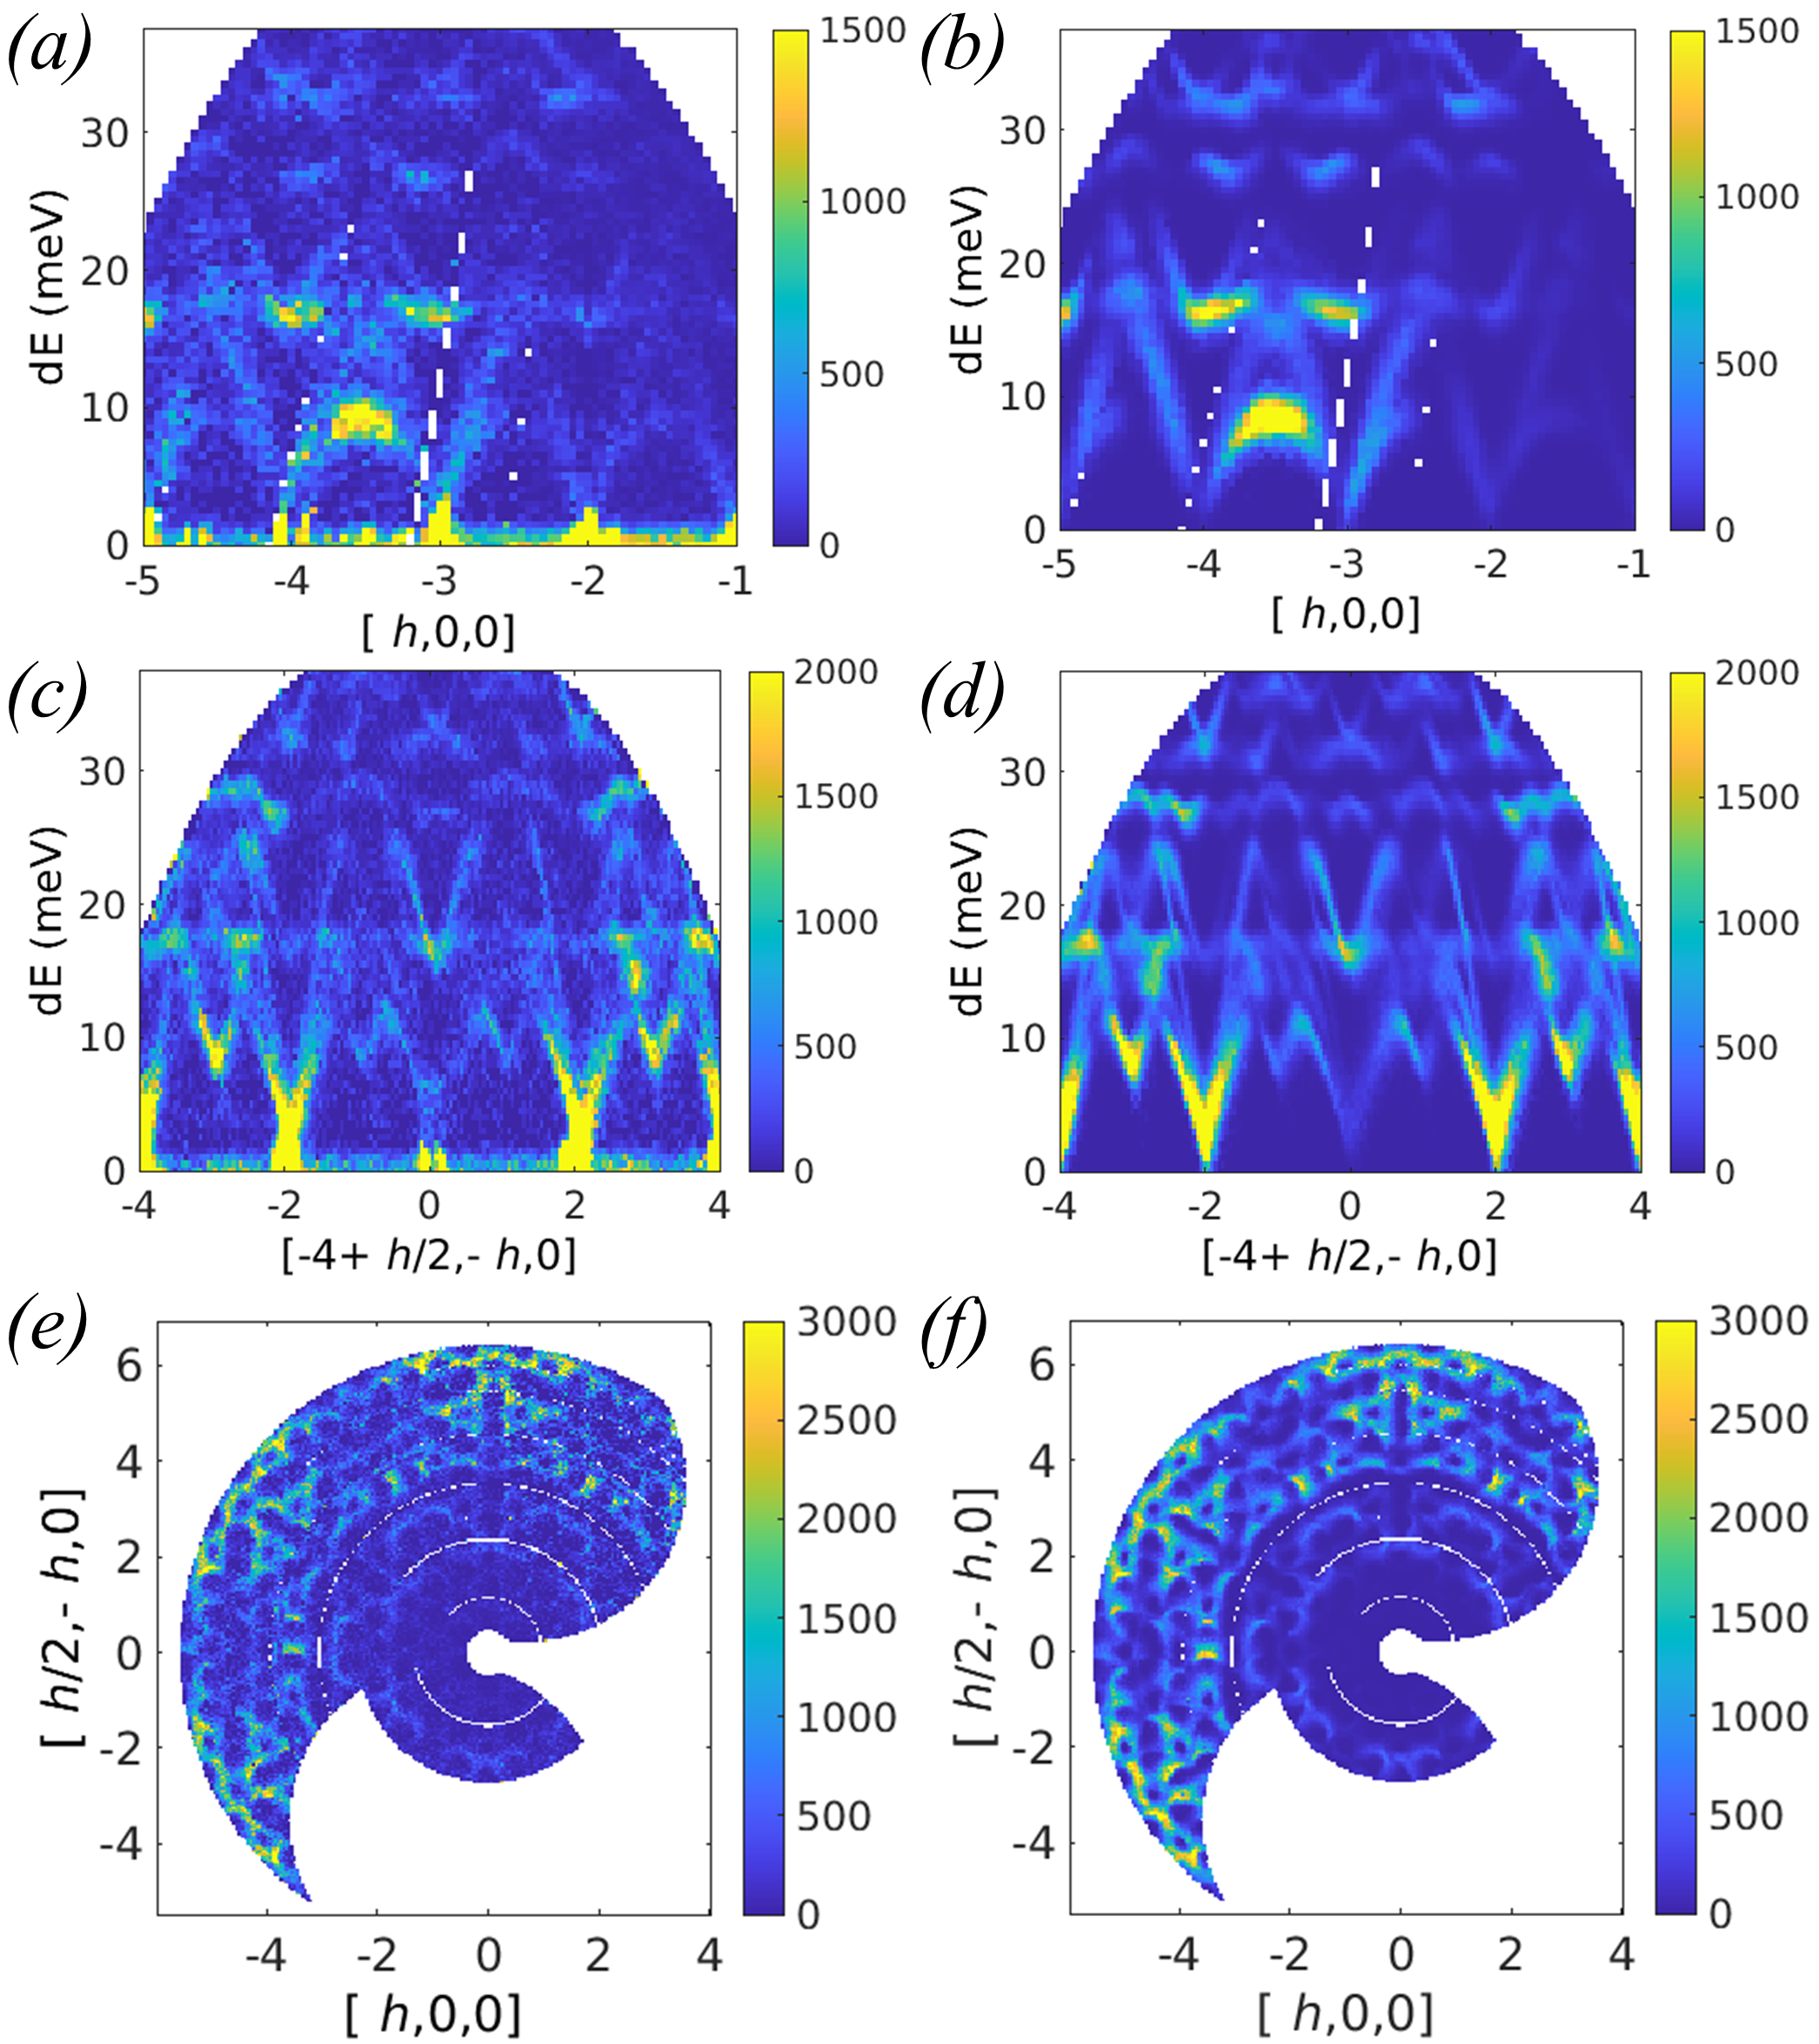
Simulations created from pre-existing quartz force constants calculations have been compared with newly collected experimental data [18]. Original quartz force constants calculations performed with CASTEP 6.1 have been re-processed for this work with CASTEP 19.1; more details are in the supplementary material. For the experimental measurements, a large single crystal of natural quartz was aligned with the c-axis vertical on an Al plate, secured in place with Al wire. It was cooled to 10 K using a closed cycle refrigerator. The MERLIN ‘G’ chopper at 350 Hz was phased to select 45 meV incident energy neutrons. The sample was rotated over 180 ∘ in 0.5 ∘ steps. The data for each individual angle were reduced using Mantid and then combined using Horace.
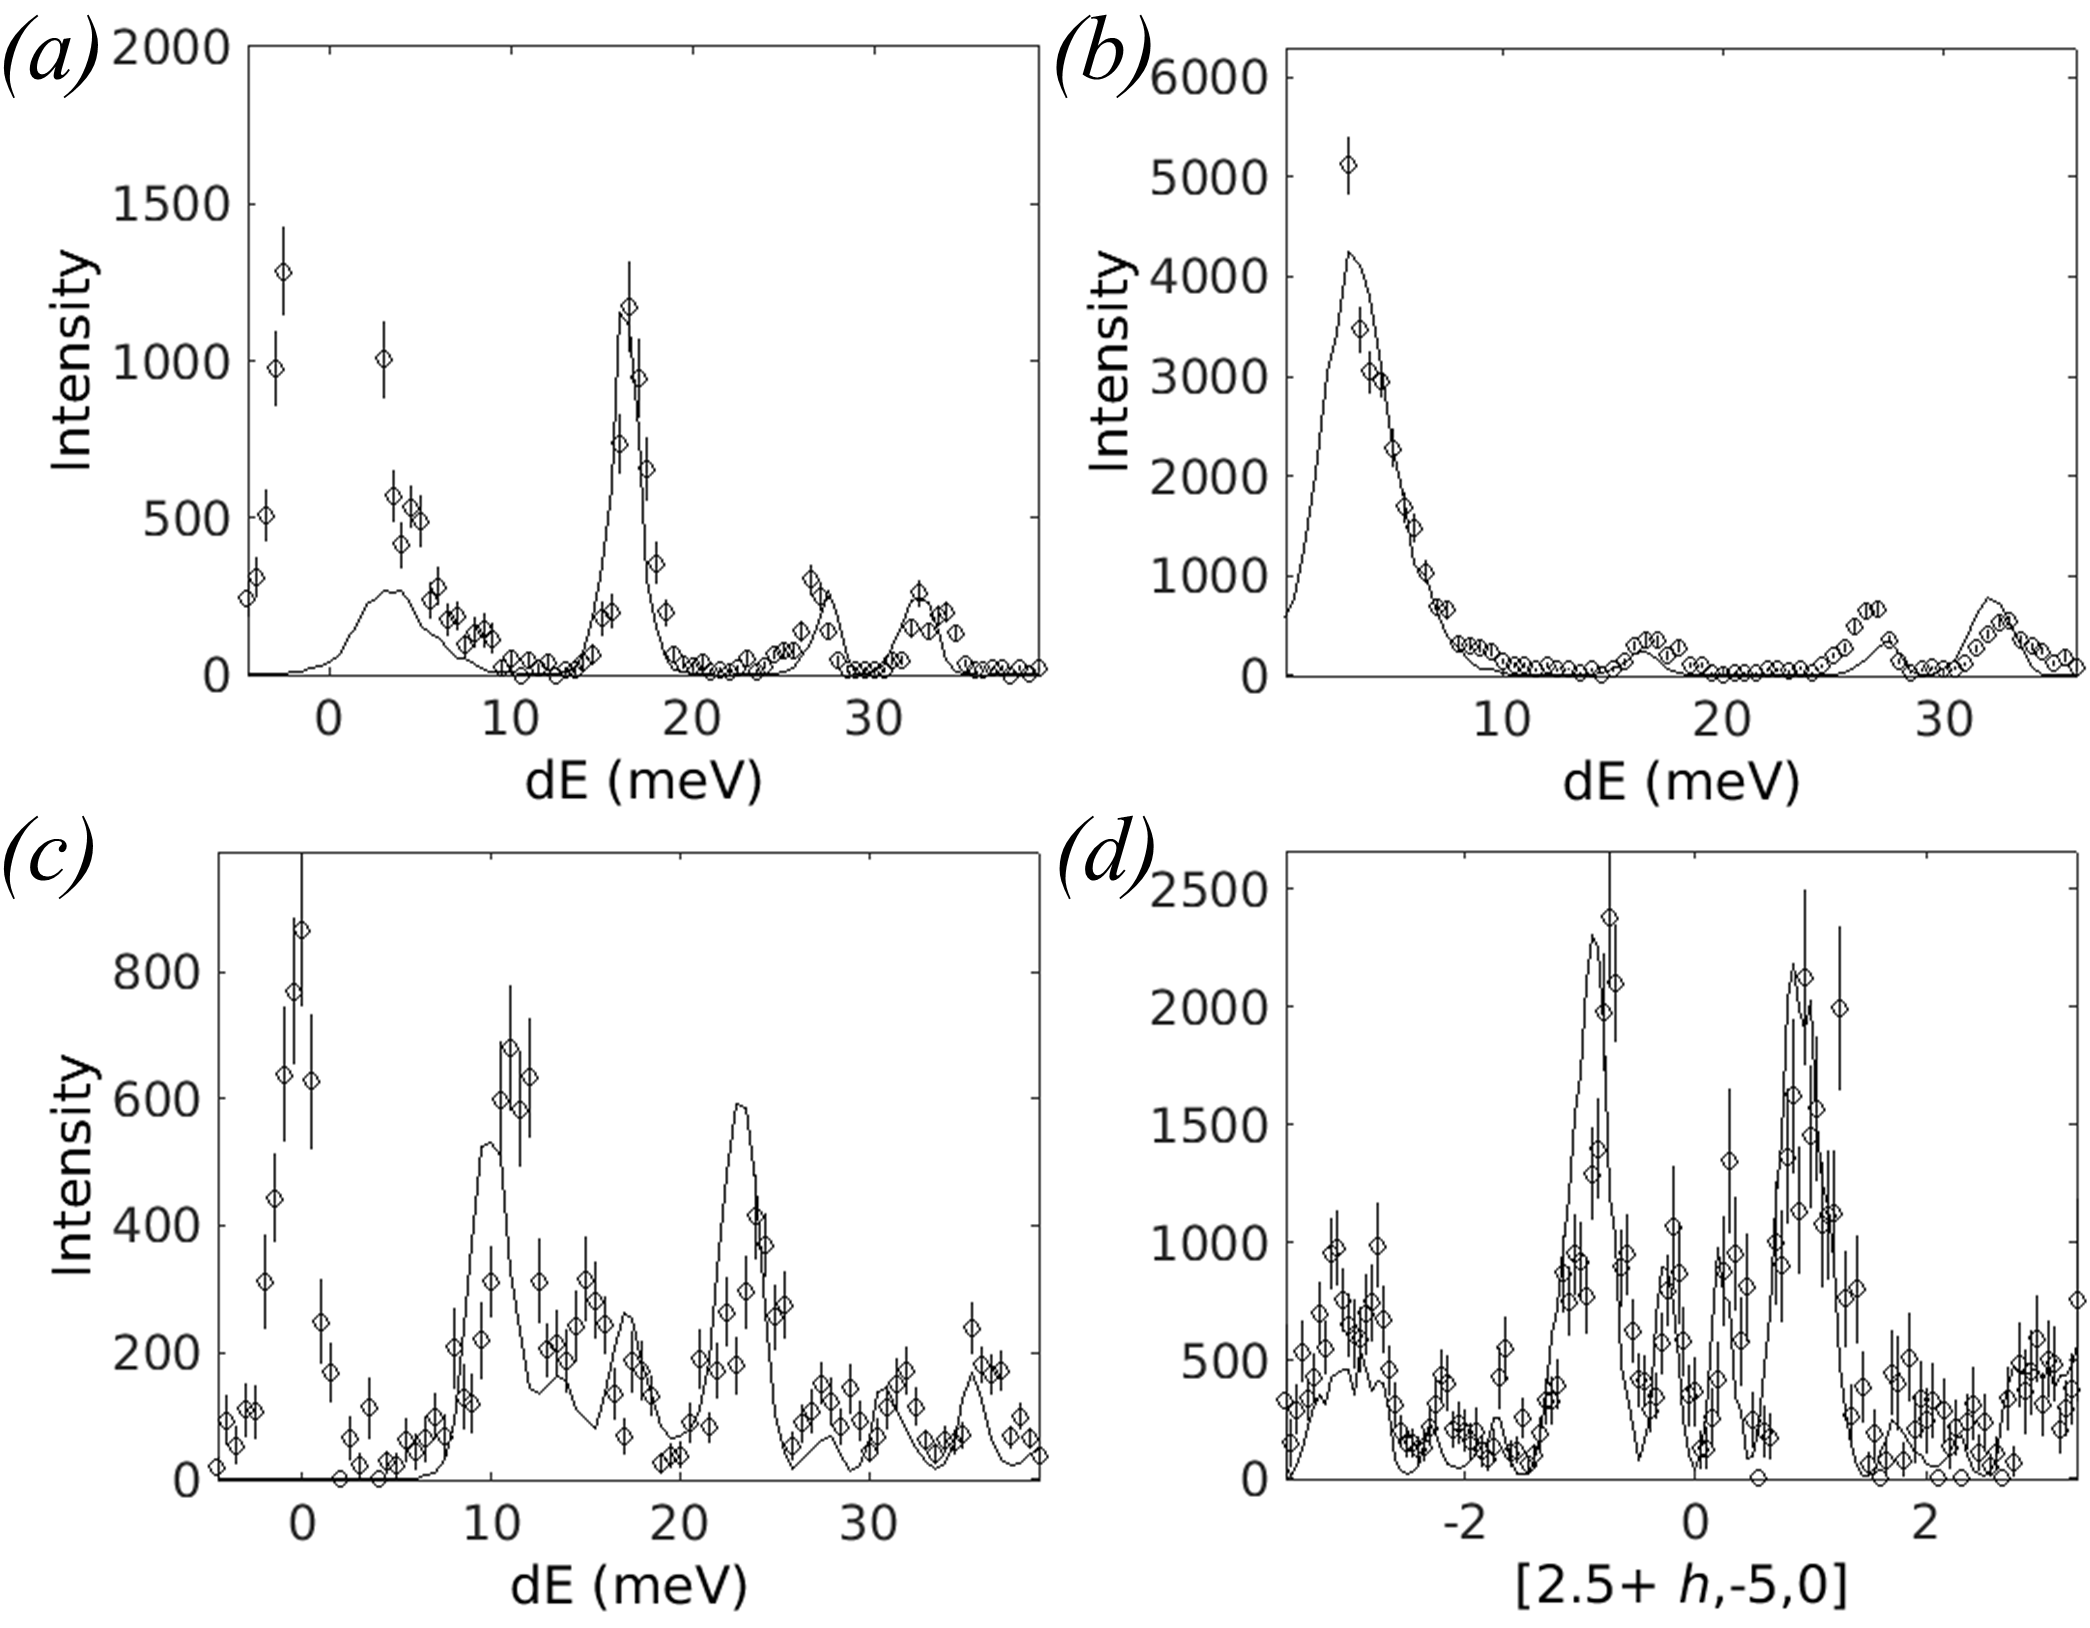
Several cuts through experimental and simulated data for quartz are shown in Fig. 12. The neutron dynamical structure factor has been computed with Euphonic, with the instrumental resolution accounted for by the Monte Carlo resolution convolution method [43] implemented in Horace. In addition, 1D cuts are shown in Fig. 13, with the simulated scattering likewise convolved with the instrumental resolution function. The only adjustable parameter in the comparison is a global scaling factor which has been determined by setting the integrated areas of the experimental and simulated data in Fig. 13(a) between 12 and 37 meV to be equal, which has then been applied to all 1D and 2D cuts. Aside from this (arbitrary) choice of intensity scale, no adjustable parameters have been used in any part of the calculation. There are small disagreements, for example the phonon frequencies do not match up perfectly. This is to be expected, as the LDA tends to overestimate bond strengths (and thus phonon frequencies). In addition there are small differences in particular mode intensities, for example around 27 meV in Fig. 13(b) where the intensity is underestimated or at 23 meV in Fig. 13(c) where it is overestimated. Given the lack of adjustable parameters however the agreement is remarkably strong. Notwithstanding disagreements that arise from the ab initio code not fully capturing the physics of the material, Fig. 13(a-d) show the importance of accounting for instrumental resolution when comparing calculation with experimental data.
7 Conclusions and future development
We have described the Euphonic package which is designed to efficiently compute phonon eigenvectors, eigenvalues and the inelastic neutron scattering cross-section for a large number of -points from force constants matrices. It has a set of command lines tools to plot the phonon band structure, DOS and the neutron dynamical structure factor along a path in reciprocal space, and an extensive Python API so that it can be used directly from Python environments for customised workflows and plotting. Euphonic also works directly from Horace [17] and the Mantid [3] plug-in AbINS [16].
Examples of the use of the Euphonic command line tools were shown in Section 6, together with comparison of simulated and experimental data from powders and single crystals, the latter also including convolution with the instrumental resolution function.
Euphonic has been extensively benchmarked and validated against other codes. It is now being used for the interpretation of phonon data at the ISIS Neutron and Muon Source, where it will continue to be maintained and developed as part of the core data analysis software portfolio. Promising avenues for future development include: support of other codes, particularly the Atomic Simulation Environment (ASE) [33]; performance improvements from symmetry-aware interpolation of the dynamical matrices, and other interpolation methods; corrections for thermal expansion/softening by using a quasi-harmonic force-constants matrix; and X-ray structure factors.
Euphonic is open-source and the source code is available to download from Github [20], with releases also available via the pip and conda package managers, as a service to the neutron scattering and the computational chemistry and physics communities. The authors welcome bug reports, feedback on usability and documentation, and suggestions for additional functionality. The authors also welcome contributions to the Euphonic package.
Acknowledgments
The computing resources for Section 4 were provided by STFC Scientific Computing Department’s SCARF cluster.
References
- [1] G J Ackland, M C Warren and S J Clark “Practical methods in ab initio lattice dynamics” In Journal of Physics: Condensed Matter 9.37, 1997, pp. 7861–7872 DOI: 10.1088/0953-8984/9/37/017
- [2] Freddie Akeroyd et al. “Mantid: Manipulation and Analysis Toolkit for Instrument Data.”, 2013 DOI: 10.5286/SOFTWARE/MANTID
- [3] O. Arnold et al. “Mantid—Data analysis and visualization package for neutron scattering and SR experiments” In Nuclear Instruments and Methods in Physics Research Section A: Accelerators, Spectrometers, Detectors and Associated Equipment 764, 2014, pp. 156–166 DOI: https://doi.org/10.1016/j.nima.2014.07.029
- [4] Feng Bao et al. “Complex optimization for big computational and experimental neutron datasets” Publisher: IOP Publishing In Nanotechnology 27.48, 2016, pp. 484002 DOI: 10.1088/0957-4484/27/48/484002
- [5] Stefano Baroni, Stefano Gironcoli, Andrea Dal Corso and Paolo Giannozzi “Phonons and related crystal properties from density-functional perturbation theory” In Reviews of Modern Physics 73.2, 2001, pp. 515–562 DOI: 10.1103/RevModPhys.73.515
- [6] R.I. Bewley, J.W. Taylor and S.M. Bennington. “LET, a cold neutron multi-disk chopper spectrometer at ISIS” In Nuclear Instruments and Methods in Physics Research Section A: Accelerators, Spectrometers, Detectors and Associated Equipment 637.1, 2011, pp. 128–134 DOI: 10.1016/j.nima.2011.01.173
- [7] Karl W. Böer and Udo W. Pohl “Elasticity and Phonons” In Semiconductor Physics Cham: Springer International Publishing, 2018, pp. 111–150 DOI: 10.1007/978-3-319-69150-3˙4
- [8] B.. Brockhouse “Energy Distribution of Neutrons Scattered by Paramagnetic Substances” In Physical Review 99.2, 1955, pp. 601–603 DOI: 10.1103/PhysRev.99.601
- [9] John D. Budai et al. “Metallization of vanadium dioxide driven by large phonon entropy” In Nature 515.7528, 2014, pp. 535–539 DOI: 10.1038/nature13865
- [10] Y.. Cheng and A.. Ramirez-Cuesta “Calculation of the Thermal Neutron Scattering Cross-Section of Solids Using OCLIMAX” In Journal of Chemical Theory and Computation 16.8, 2020, pp. 5212–5217 DOI: 10.1021/acs.jctc.0c00569
- [11] Y.. Cheng, L.. Daemen, A.. Kolesnikov and A.. Ramirez-Cuesta “Simulation of Inelastic Neutron Scattering Spectra Using OCLIMAX” In Journal of Chemical Theory and Computation 15.3, 2019, pp. 1974–1982 DOI: 10.1021/acs.jctc.8b01250
- [12] V.. Chernyshev “Structure and Lattice Dynamics of La2Zr2O7 Crystal: Ab Initio Calculation” Series Title: Lecture Notes in Computer Science In Computational Science and Its Applications – ICCSA 2019 11622 Cham: Springer International Publishing, 2019, pp. 625–638 DOI: 10.1007/978-3-030-24305-0“˙46
- [13] Stewart J. Clark et al. “First principles methods using CASTEP” In Zeitschrift für Kristallographie - Crystalline Materials 220.5-6, 2005, pp. 567–570 DOI: 10.1524/zkri.220.5.567.65075
- [14] Martin T. Dove “Introduction to lattice dynamics”, Cambridge topics in mineral physics and chemistry 4 Cambridge ; New York: Cambridge University Press, 1993
- [15] Martin T. Dove “Structure and dynamics: an atomic view of materials”, Oxford master series in condensed matter physics Oxford ; New York: Oxford University Press, 2003
- [16] Krzysztof Dymkowski, Stewart F. Parker, Felix Fernandez-Alonso and Sanghamitra Mukhopadhyay “AbINS: The modern software for INS interpretation” In Physica B: Condensed Matter 551, 2018, pp. 443–448 DOI: 10.1016/j.physb.2018.02.034
- [17] R.A. Ewings et al. “Horace : Software for the analysis of data from single crystal spectroscopy experiments at time-of-flight neutron instruments” In Nuclear Instruments and Methods in Physics Research Section A: Accelerators, Spectrometers, Detectors and Associated Equipment 834, 2016, pp. 132–142 DOI: 10.1016/j.nima.2016.07.036
- [18] R. Fair, A.. Jackson, M.. Le and D.. Voneshen “Phonon calculations and measurements dataset for use with the Euphonic program” Zenodo, 2022 DOI: 10.5281/zenodo.6620084
- [19] Rebecca Fair and Manh Duc Le “Horace-Euphonic-Interface” STFC, 2022 DOI: 10.5286/SOFTWARE/HORACEEUPHONICINTERFACE
- [20] Rebecca Fair et al. “Euphonic” STFC, 2022 DOI: 10.5286/SOFTWARE/EUPHONIC
- [21] Erik Fransson, Mattias Slabanja, Paul Erhart and Göran Wahnström “¡span style=”font-variant:small-caps;”¿dynasor¡/span¿ —A Tool for Extracting Dynamical Structure Factors and Current Correlation Functions from Molecular Dynamics Simulations” In Advanced Theory and Simulations 4.2, 2021, pp. 2000240 DOI: 10.1002/adts.202000240
- [22] Julian D. Gale “GULP: Capabilities and prospects” In Zeitschrift für Kristallographie - Crystalline Materials 220.5-6, 2005, pp. 552–554 DOI: 10.1524/zkri.220.5.552.65070
- [23] E. Garlatti et al. “Unveiling phonons in a molecular qubit with four-dimensional inelastic neutron scattering and density functional theory” In Nature Communications 11.1, 2020, pp. 1751 DOI: 10.1038/s41467-020-15475-7
- [24] Paolo Giannozzi et al. “QUANTUM ESPRESSO: a modular and open-source software project for quantum simulations of materials” In Journal of Physics: Condensed Matter 21.39, 2009, pp. 395502 DOI: 10.1088/0953-8984/21/39/395502
- [25] Xavier Gonze and Changyol Lee “Dynamical matrices, Born effective charges, dielectric permittivity tensors, and interatomic force constants from density-functional perturbation theory” In Physical Review B 55.16, 1997, pp. 10355–10368 URL: http://prb.aps.org/abstract/PRB/v55/i16/p10355%5C_1
- [26] Xavier Gonze, J.-C. Charlier, D.C. Allan and M.P. P. Teter “Interatomic force constants from first principles: The case of -quartz” In Physical Review B 50.17, 1994, pp. 13035–13038 DOI: 10.1103/PhysRevB.50.13035
- [27] Xavier Gonze et al. “The Abinit project: Impact, environment and recent developments” In Computer Physics Communications 248, 2020, pp. 107042 DOI: 10.1016/j.cpc.2019.107042
- [28] G. Goret, B. Aoun and E. Pellegrini “MDANSE: An Interactive Analysis Environment for Molecular Dynamics Simulations” In Journal of Chemical Information and Modeling 57.1, 2017, pp. 1–5 DOI: 10.1021/acs.jcim.6b00571
- [29] H. Grecco “Pint: Operate and manipulate physical quantities in Python”, 2012 URL: https://github.com/hgrecco/pint
- [30] Charles R. Harris et al. “Array programming with NumPy” In Nature 585.7825, 2020, pp. 357–362 DOI: 10.1038/s41586-020-2649-2
- [31] Olle Hellman, Peter Steneteg, I.. Abrikosov and S.. Simak “Temperature dependent effective potential method for accurate free energy calculations of solids” In Physical Review B 87.10, 2013, pp. 104111 DOI: 10.1103/PhysRevB.87.104111
- [32] Yoyo Hinuma et al. “Band structure diagram paths based on crystallography” In Computational Materials Science 128, 2017, pp. 140–184 DOI: 10.1016/j.commatsci.2016.10.015
- [33] Ask Hjorth Larsen et al. “The atomic simulation environment—a Python library for working with atoms” In Journal of Physics: Condensed Matter 29.27, 2017, pp. 273002 DOI: 10.1088/1361-648X/aa680e
- [34] G.. Kearley and J. Tomkinson “CLIMAX: A program for force constant refinement from inelastic neutron spectra” In Neutron Scattering Data Analysis 107, Institute of Physics Conference Series, 1990, pp. 245–252
- [35] M. Kempa et al. “The FlatCone multianalyzer setup for ILL’s three-axis spectrometers” In Physica B: Condensed Matter 385-386, 2006, pp. 1080–1082 DOI: 10.1016/j.physb.2006.05.371
- [36] G. Kresse and J. Furthmüller “Efficient iterative schemes for ab initio total-energy calculations using a plane-wave basis set” In Physical Review B 54.16, 1996, pp. 11169–11186 DOI: 10.1103/PhysRevB.54.11169
- [37] G. Kresse and D. Joubert “From ultrasoft pseudopotentials to the projector augmented-wave method” In Physical Review B 59.3, 1999, pp. 1758–1775 DOI: 10.1103/PhysRevB.59.1758
- [38] Alessandro Mirone and Matteo d’Astuto “OpenPhonon: an open source computer code for lattice-dynamical calculations”, 2006 URL: https://www.esrf.fr/computing/scientific/OpenPhonon/manual/index.html
- [39] Alessandro Mirone and Bjorn Wehinger “Ab2tds”, 2013 URL: http://ftp.esrf.fr/scisoft/AB2TDS/Introduction.html
- [40] Juana Moreno and José M. Soler “Optimal meshes for integrals in real- and reciprocal-space unit cells” Publisher: American Physical Society In Phys. Rev. B 45.24, 1992, pp. 13891–13898 DOI: 10.1103/PhysRevB.45.13891
- [41] K. Parlinski, Z.. Li and Y. Kawazoe “First-Principles Determination of the Soft Mode in Cubic ZrO 2” In Physical Review Letters 78.21, 1997, pp. 4063–4066 DOI: 10.1103/PhysRevLett.78.4063
- [42] Krzysztof Parlinski “PHONON”, 2014 URL: http://www.computingformaterials.com/phoncfm710/2phon610.html
- [43] Toby G. Perring “High energy magnetic excitations in hexagonal cobalt” Appendix A, 1991
- [44] Anibal J. Ramirez-Cuesta “aCLIMAX 4.0.1, The new version of the software for analyzing and interpreting INS spectra” In Computer Physics Communications 157.3, 2004, pp. 226–238 DOI: 10.1016/S0010-4655(03)00520-4
- [45] Keith Refson, Paul R. Tulip and Stewart J. Clark “Variational density-functional perturbation theory for dielectrics and lattice dynamics” In Physical Review B 73.15, 2006, pp. 155114 DOI: 10.1103/PhysRevB.73.155114
- [46] Dmitry Reznik and Irada Ahmadova “Automating Analysis of Neutron Scattering Time-of-Flight Single Crystal Phonon Data” In Quantum Beam Science 4.4, 2020, pp. 41 DOI: 10.3390/qubs4040041
- [47] D.. Roach, J.. Gale and D.. Ross “Scatter: A New Inelastic Neutron Scattering Simulation Subroutine for GULP” In Neutron News 18.3, 2007, pp. 21–23 DOI: 10.1080/10448630701492475
- [48] T. Róg, K. Murzyn, K. Hinsen and G.. Kneller “nMoldyn: A program package for a neutron scattering oriented analysis of molecular dynamics simulations” In Journal of Computational Chemistry 24.5, 2003, pp. 657–667 DOI: 10.1002/jcc.10243
- [49] G.. Squires “Introduction to the theory of thermal neutron scattering” Mineola, N.Y: Dover Publications, 1996
- [50] Atsushi Togo and Isao Tanaka “First principles phonon calculations in materials science” In Scripta Materialia 108, 2015, pp. 1–5 DOI: 10.1016/j.scriptamat.2015.07.021
- [51] Nathan P. Walter, Abhishek Jaiswal, Zhikun Cai and Yang Zhang “LiquidLib: A comprehensive toolbox for analyzing classical and ab initio molecular dynamics simulations of liquids and liquid-like matter with applications to neutron scattering experiments” In Computer Physics Communications 228, 2018, pp. 209–218 DOI: 10.1016/j.cpc.2018.03.005
- [52] Qiye Zheng et al. “Advances in thermal conductivity for energy applications: a review” In Progress in Energy 3.1, 2021, pp. 012002 DOI: 10.1088/2516-1083/abd082
| Material | Atoms | Size (GB) | Total Time (s) | Write Time (s) |
|---|---|---|---|---|
| Nb | 1 | 0.025 | 57.837 | 7.557 |
| Quartz | 9 | 0.913 | 811.430 | 64.930 |
| \ceLa2Zr2O7 | 22 | 5.187 | 302.167 | 258.243 |
| Material | Interpolation (s) | Structure Factor (s) |
|---|---|---|
| Nb | 7.070 | 0.104 |
| Quartz | 199.069 | 0.426 |
| \ceLa2Zr2O7 | 35.743 | 1.853 |
| Material | -direction | Mean Relative Percentage Difference | |
|---|---|---|---|
| Euphonic Interpolation | CASTEP Interpolation | ||
| Nb | <0.01 | <0.01 | |
| <0.01 | <0.01 | ||
| Quartz | 0.03 | 0.03 | |
| 0.05 | <0.01 | ||
| \ceLa2Zr2O7 | 0.05 | 0.05 | |
| 0.05 | 0.05 | ||
| Material | -direction | T (K) | Mean Relative Percentage Difference | |
| Euphonic | CASTEP/Phonopy | |||
| Interpolation | Interpolation | |||
| Nb | 300 | <0.01 | <0.01 | |
| 5 | <0.01 | <0.01 | ||
| 300 | <0.01 | <0.01 | ||
| 5 | <0.01 | <0.01 | ||
| Quartz | 300 | 0.87 | 0.87 | |
| 5 | 0.49 | 0.49 | ||
| 300 | 1.75 | 1.82 | ||
| 5 | 0.83 | 0.92 | ||
| \ceLa2Zr2O7 | 300 | 2.62 | 2.62 | |
| 5 | 1.83 | 1.83 | ||
| 300 | 2.05 | 2.05 | ||
| 5 | 1.42 | 1.42 | ||
| Al | 300 | 0.01 | <0.01 | |
| 5 | 0.01 | <0.01 | ||
| 300 | <0.01 | <0.01 | ||
| 5 | <0.01 | <0.01 | ||
| Tool | Description | Example Figure |
|---|---|---|
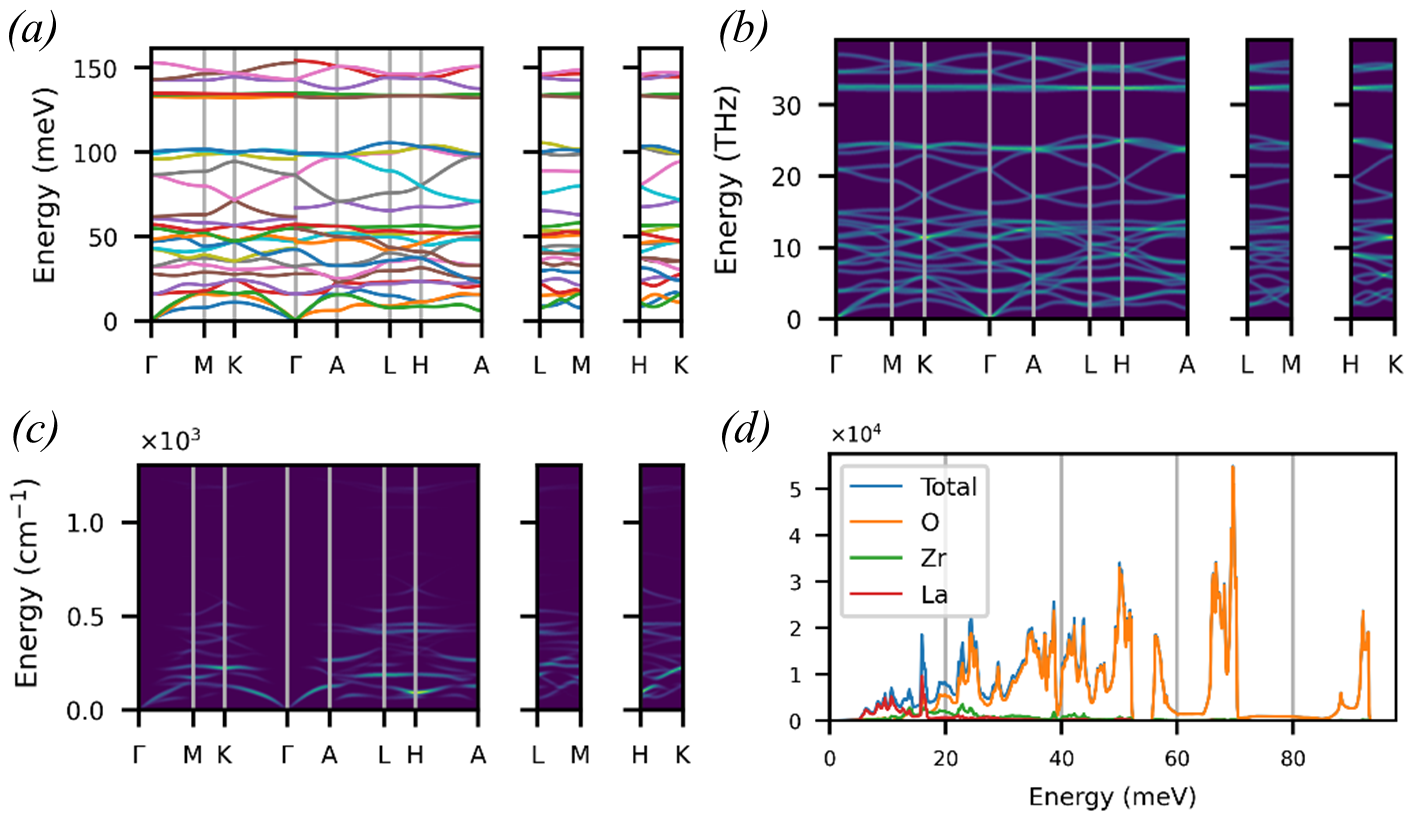
| euphonic-dispersion | Plots a phonon band structure along a recommended -point path (generated by SeeK-path[32]) if using a force constants file as input, or will plot existing phonon frequencies if using a phonon modes file as input (e.g. CASTEP .phonon) file | Fig. 7(a) |
| euphonic-dos | Plots a total or partial DOS on a specified Monkhorst–Pack grid if using a force constants file, or on a precalculated grid if using a phonon modes file. The spectrum can also be weighted by coherent or incoherent neutron-scattering cross-section | Fig. 7(d) |
| euphonic-intensity-map | Plots a 2D crystal intensity map along a recommended -point path if using force constants, or along a precalculated path if using phonon modes. The intensities can be weighted by the neutron dynamical structure factor or phonon DOS | Fig. 7(b) & Fig. 7(c) |
| euphonic-powder-map | Plots a 2D powder intensity map along a specified range in using spherical averaging; requires force constants. Intensities can be weighted by the neutron dynamical structure factor or phonon DOS | Fig. 10(b) and Fig. 11(b) |
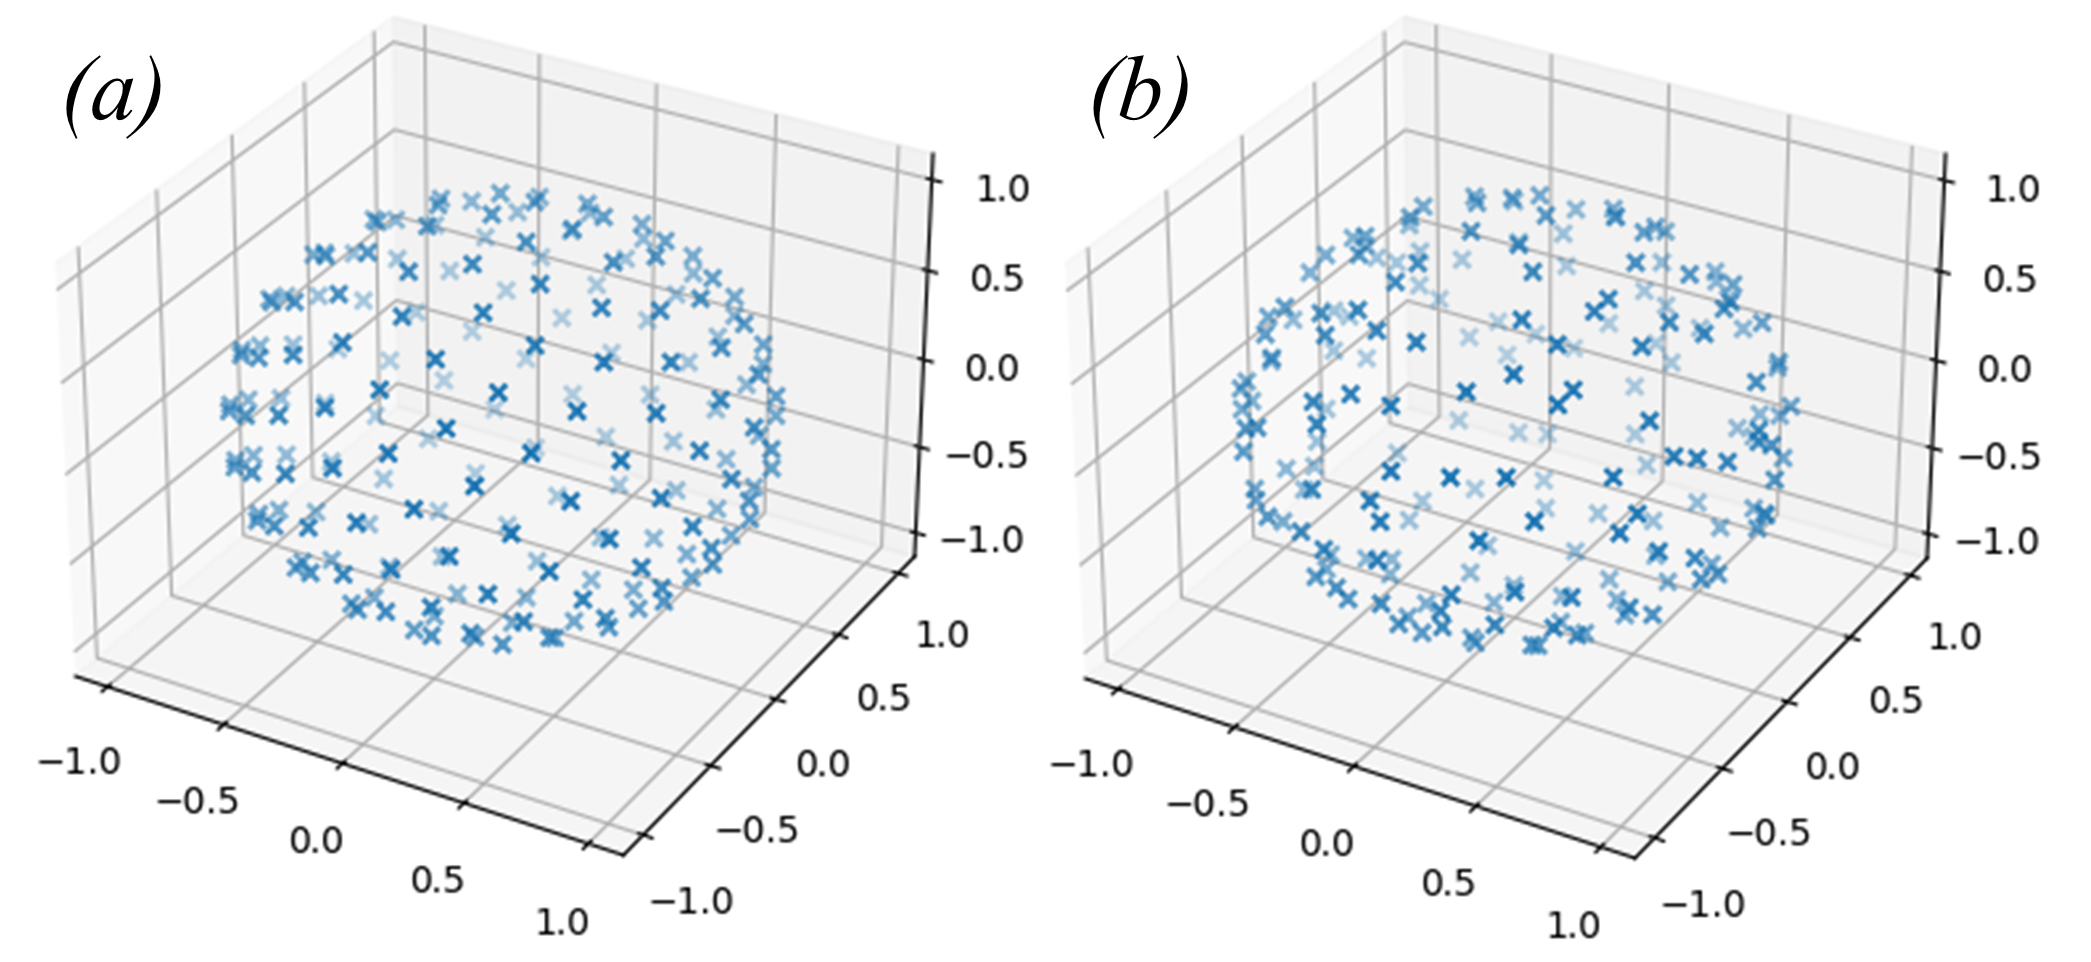
| euphonic-show-sampling | Plots a 3D visualisation of the distribution of -points over a sphere for the different spherical sampling schemes that are used in powder averaging | Fig. 8 |
| euphonic-optimise-dipole-parameter | The ’dipole parameter’ determines the balance of real and reciprocal terms used in the Ewald sum for calculating the dipole correction (see Section 2.1.3). A higher value uses more reciprocal terms, and a lower value more real terms. Tuning this parameter can improve performance; this tool runs the interpolation for a few -points for a few different values of the parameter, and suggests an optimum value | - |