Exploring Infrared Properties of Giant Low Surface Brightness Galaxies
Abstract
We present analysis of Spitzer Space Telescope observations of the three low surface brightness (LSB) optical giant galaxies Malin 1, UGC 6614 and UGC 9024. Mid- and far-infrared morphology, spectral energy distributions, and integrated colors are used to derive the dust mass, dust-to-gas mass ratio, total infrared luminosity, and star formation rate (SFR). We also investigate UGC 6879, which is intermediate between high surface brightness (HSB) and LSB galaxies. The 8 m images indicate that polycyclic aromatic hydrocarbon (PAH) molecules are present in the central regions of all three metal-poor LSB galaxies. The diffuse optical disks of Malin 1 and UGC 9024 remain undetected at mid- and far-infrared wavelengths. The dustiest of the three LSB galaxies, UGC 6614, has infrared morphology that varies significantly with wavelength; 160 m (cool) dust emission is concentrated in two clumps on the NE and NW sides of a distinct ring seen in the 24 and 8 m images (and a broken ring at 70 m) at a radius of 40″ (18 kpc) from the galaxy center. The 8 and 24 m emission is co-spatial with H emission previously observed in the outer ring of UGC 6614. The estimated dust-to-gas ratios, from less than to , support previous indications that the LSB galaxies are relatively dust poor compared to the HSB galaxies. The total infrared luminosities are approximately 1/3 to 1/2 the blue band luminosities, suggesting that old stellar populations are the primary source of dust heating in these LSB objects. The SFR estimated from the infrared data ranges , consistent with results from optical studies.
1 Introduction
The unprecedented imaging and spectroscopic sensitivity and higher spatial resolution of the Spitzer Space Telescope (SST; Werner et al. 2004) compared to past IR missions such as the Infrared Astronomical Satellite (IRAS; Neugebauer et al. 1984) and the Infrared Space Observatory (ISO; Kessler et al. 1996) provide a unique opportunity to probe the inter-stellar medium (ISM) of optically faint sources such as low surface brightness (LSB) galaxies. The goal of this study is to use the Spitzer data to analyze the IR properties of three LSB optical giants: Malin 1, UGC 6614, and UGC 9024. This is the first time we are able to view these galaxies in 3-160 m wavelength range.
The LSB galaxies are usually defined as diffuse spiral disks with low -band central surface brightness (e.g. mag arcsec-2; Bothun et al. 1997; Impey & Bothun 1997). These galaxies are either blue (B-V ) or red (B-V ) in color (O’Neil et al. 1997), metal poor ([O/H] ; McGaugh 1994; de Blok & van der Hulst 1998b; de Naray et al. 2004), rich in neutral hydrogen (H I) (Schombert et al. 1992; O’Neil et al. 2004), deficient in H II emission (McGaugh et al. 1995; de Naray et al. 2004), and have low star formation rate (SFR) M⊙ yr-1 (van den Hoek et al. 2000; Burkholder et al. 2001). The majority of these galaxies lack molecular (CO) gas (Schombert et al. 1990; de Blok & van der Hulst 1998a); only a handful have been reported to have molecular emission (O’Neil & Schinnerer 2004; Matthews et al. 2005; Das et al. 2006).The observed properties suggest that LSB disks are relatively unevolved systems and may have a different evolutionary history compared to their high surface brightness (HSB) counterparts (McGaugh 1994; van den Hoek et al. 2000; Vallenari et al. 2005; Zackrisson et al. 2005).
Most of our knowledge regarding the composition and structure of the ISM of LSB spirals comes from optical (Impey et al. 1996) and H I surveys (O’Neil et al. 2004). These surveys have demonstrated that the neutral hydrogen is by far the dominant component of the ISM in these galaxies (95% by mass; Matthews 2005). While we have improved understanding of the gaseous component of the ISM from decade long H I surveys, our knowledge of the inter-stellar dust, the component of the ISM radiating from mid-IR (8 m) through sub-millimeter (850 m) wavelengths, is still very limited. Because of the scarcity of information in this wavelength range, complementary observational facts such as low metal abundance (McGaugh 1994), strong similarities in optical and near-IR morphology (Bergvall et al. 1999; Bell et al. 2000), transparency of the stellar disks (O’Neil et al. 1998; Matthews et al. 1999), and deficiency in molecular emission (Schombert et al. 1990; de Blok & van der Hulst 1998a) have been used to probe the ISM of LSB galaxies. All these observations lead to a general consensus that the LSB disks are deficient in dust and molecular gas.
Given that LSB spirals comprise of the local disk galaxy population (McGaugh et al. 1995b), they deserve equal attention as their HSB cousins. To develop a consistent picture of the local galaxy populations it is therefore necessary to probe each population at all wavelength regimes as have been done in most cases for HSB galaxies. Previous long wavelength studies on LSB galaxies involved a few cases in sub-millimeter and millimeter wavelengths (de Blok & van der Hulst 1998b; Pickering & van der Hulst 1999; O’Neil & Schinnerer 2004; Matthews et al. 2005; Das et al. 2006). Hoeppe et al. (1994) made the first attempt to investigate long wavelength (60 m, 100 m, and 20 cm) properties of LSB dwarfs; however, no study has been made in the mid-IR and far-IR for LSB disks. In this study we have made the first attempt to explore 3-160 m properties of three LSB giants: Malin 1, UGC 6614, and UGC 9024, recently observed by the SST. We focus on the IR morphology to probe extent of dust in the ISM, on the SEDs for the IR energy budget and dust content, and on the IR colors to establish the dust temperature of the ISM. The organization of this paper is as follows: we describe observation and data reduction in section and present our results in section . Discussions and conclusions are given in section .
2 Observation and Data Reduction
We describe the Infrared Array Camera (IRAC; Fazio et al. 2004) and Multiband Imaging Photometer for Spitzer (MIPS; Rieke et al. 2004) imaging data for Malin 1, UGC 6614, and UGC 9024. These extended disk galaxies with radial scale length 5 kpc are observed as part of a larger guaranteed time observing program (Spitzer PID #62). The program also includes two LSB galaxies (UGC 5675 and UGC 6151) with 2 kpc 3 kpc, an edge-on disk (UGC 6879) with 2.5 kpc, and a HSB dwarf (UGC 10445) with 1 kpc. The central brightness of UGC 6879 is mag arcsec-2. A simple correction for inclination, using brings its central brightness to mag arcsec-2. It is lower than the conventional choice ( mag arcsec-2) but close to the Freeman value ( mag arcsec-2; Freeman 1970). The central brightness of this galaxy falls in between the range of LSB and HSB galaxies and hence, we include it as a representative of the intermediate class. The properties of UGC 5675 and UGC 6151 will be explored in a forthcoming paper. The readers are refereed to Hinz et al. (2006) for an analysis of UGC 10445.
The IRAC 3.6, 4.5, 5.8, and 8 m images and the MIPS 24, 70, and 160 m images were acquired, respectively, in the mapping and photometry modes. The IRAC images were reduced with the standard Spitzer Science Center data pipeline, and aligned, re-sampled, and combined into a mosaic image using the Mopex111http://ssc.spitzer.caltech.edu/postbcd/ software. The MIPS 24 m data required the use of the self-calibration procedure described in the MIPS Data Handbook222http://ssc.spitzer.caltech.edu/mips/dh/ to remove latent image artifacts. The corrected images were then combined into a mosaic using Mopex. Time filtering and column filtering was applied to the 70 m images using IDL routines created by D. Fadda. The filtered images were then combined using Mopex. The 160 m images were combined into a mosaic using Mopex. The IRAC spatial resolution is 2 for all bands. The MIPS spatial resolutions are 6, 18, and 40 for the respective bands.
Sky subtraction was carried out through the use of multiple sky apertures placed near the source which do not overlap with the faintest isophotes visible from the galaxy. For each galaxy we measured flux densities from the sky subtracted images within the aperture covering the entire galaxy. The flux density contributed by foreground stars within a galaxy aperture was removed by measuring each such star in a small aperture and subtracting the result from the total flux within the galaxy aperture. The calibration uncertainty in the IRAC flux densities is at the level of 10% (Reach et al. 2005; Dale et al. 2005). Aperture corrections have been applied to all IRAC flux densities (T. H. Jarrett 2006; private communication). The MIPS flux density calibration uncertainties are 10% at 24 m and 20% at 70 and 160 m.
Near-IR (1.3, 1.7, and 2.2 m) flux densities from the Two Micron All Sky Survey (2MASS; Jarrett et al. 2000), upper limits on IRAS flux densities, and those derived from the IRAC and MIPS bands are given in Table 1. Basic properties of the galaxies obtained from the literature, the NASA/IPAC Extragalactic Database (NED), the Lyon-Meudon Extragalactic Database (LEDA), and derived in this study are summarized in Table 2. The IRAS flux densities for UGC 6614 and UGC 6879 were computed using the SCANPI tool available from IRSA as linked via NED where IRAS flux density limits represent SCANPI’s inband total measurement, . No IRAS detections were available for Malin 1 and UGC 9024. Distances for the galaxies are estimated from heliocentric radial velocity after correcting for the local group, infall into the Virgo cluster, the Great Attractor, and the Shapley supercluster following the Mould et al. (2000) flow model.
2.1 Contamination from Galactic Cirrus
A basic concern about faint extragalactic sources with highly diffuse disk structure is confusion by foreground Galactic “cirrus” emission. This is especially critical in the case of far-IR cool sources (defined below) such as LSB galaxies. The far-IR ratio of typical local cirrus is (Gautier 1986). UGC 6614 and UGC 6879 are well above this limit (Fig. 8c). From its Galactic latitude and the observed ratio, it is reasonably safe to assume that UGC 9024 has not been affected by cirrus emission. In the absence of far-IR information it is uncertain for Malin 1. However, its high galactic latitude can be used to argue against any cirrus contamination.
We should also stress the fact that whether there is cirrus in the foreground is less significant as compared to whether the cirrus in the foreground varies on scales of the IRAC and MIPS field of view. If its spatial variation is negligible across the IRAC and MIPS mosaic, it gets subtracted out as “sky” in the data reduction process.
3 Results
In this section we present IR morphology, SEDs, and IR colors of LSB galaxies. Using this information we estimate dust mass (), dust-to-(atomic) gas ratio (), total infrared luminosity (), and star formation rate (SFR). To obtain a qualitative assessment of the observed properties of LSB disks compared to their HSB counterparts, we take the Spitzer Infrared Nearby Galaxy Survey (SINGS; Kennicutt et al. 2003) sample as a representative sample of local HSB galaxies. This sample contains 75 galaxies of various Hubble types as well as dwarfs and irregular galaxies, and thus making it a suitable reference for comparative analysis with LSB spirals.
3.1 Infrared Morphology
The IR emission beyond 25 m is dominated by the inter-stellar dust under various heating conditions. On the other hand, mid-IR (5-25 m) emission marks the transition from stellar photospheres to inter-stellar dust dominating the emission. Whereas the morphology of a galaxy at 3.6 and 4.5 m represents the stellar disk, at 5 m and beyond it shows the structure of the ISM. The IRAC 3.6 and 4.5 m bands are sensitive to the underlying stellar populations typically consisting of red giants and old stars. In some galaxies 3.6 m band is also known to contain emission from a hot dust component (Bernard et al. 1994; Hunt et al. 2002; Lu et al. 2003; Helou et al. 2004). The hot dust is also visible in the other IRAC bands. While 3.6 m is only sensitive to hot dust near the sublimation temperatures (1000 K), the longer wavelength IRAC bands can detect dust at lower temperatures down to several hundred Kelvin.
The IRAC 5.8 and 8 m bands are primarily sensitive to the PAH emission at 6.2, 7.7, and 8.6 m (Puget & Leger 1989; Helou et al. 2000; Lu et al. 2003). The PAH is the hot component of the inter-stellar dust with effective temperature K stochastically excited to high energy levels by stellar photons. Stellar photospheric emission also contributes to these two IRAC wavebands. The fraction of stellar emission at 5.8 and 8 m, respectively, are 40% and 20% (Helou et al. 2004; Pahre et al. 2004).
The emission detected by the MIPS bands are coming from dust grains with different size distributions. Very small grains (1-10 nm) emit in the mid-IR region (15 m), intermediate between thermal equilibrium and single-photon heating. Large, classical grains (100-200 nm) are in thermal equilibrium with the radiation field and responsible for far-IR emission (Desert et al. 1990). To begin with we should bear in mind that the demarcation lines among various heating environments are ad-hoc and we assume the following effective color temperature ranges for large grains in thermal equilibrium: warm (40 K 100 K), cool (20 K 30 K), cold (10 K 20 K), and very cold (10 K ).
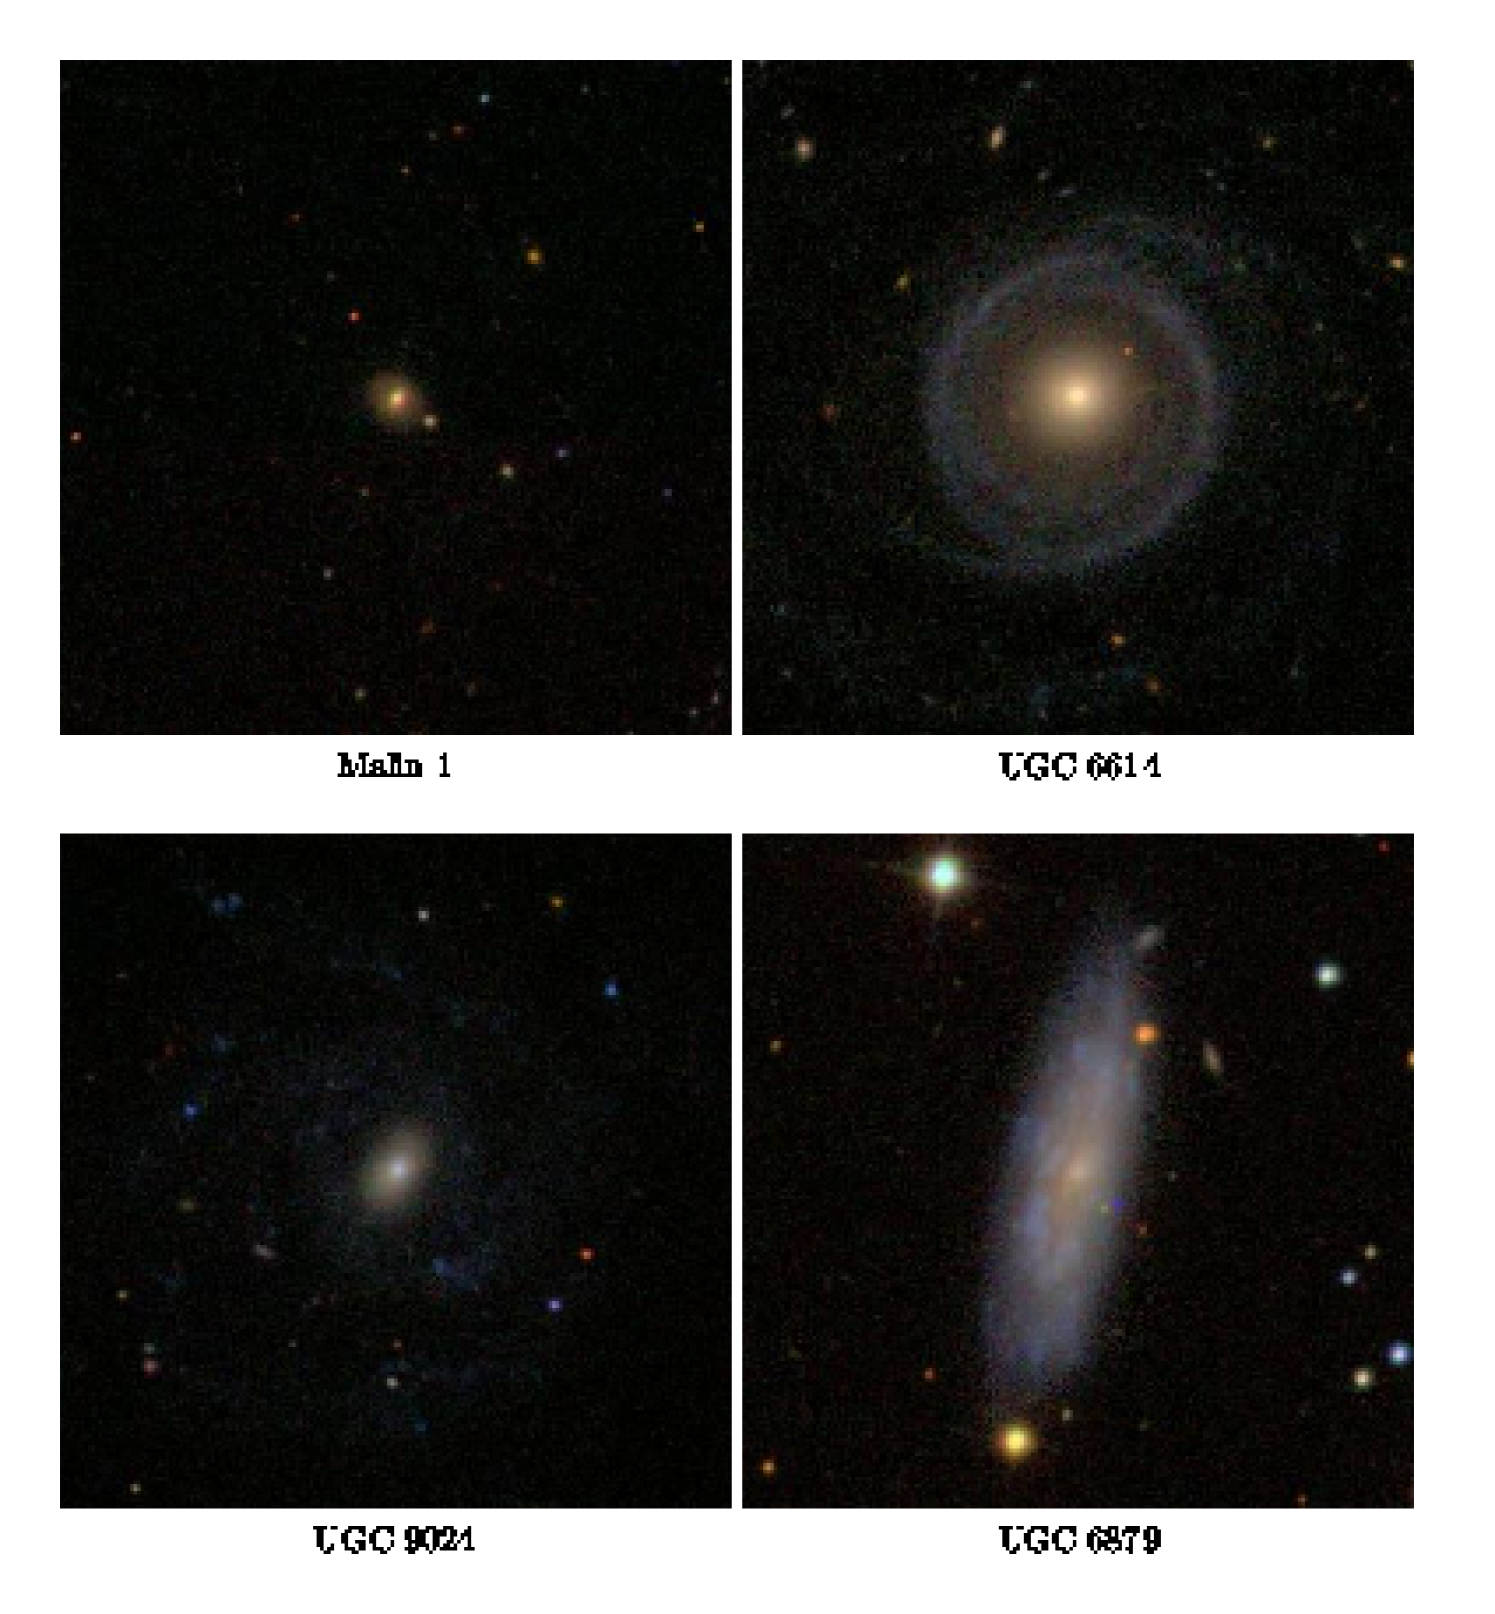
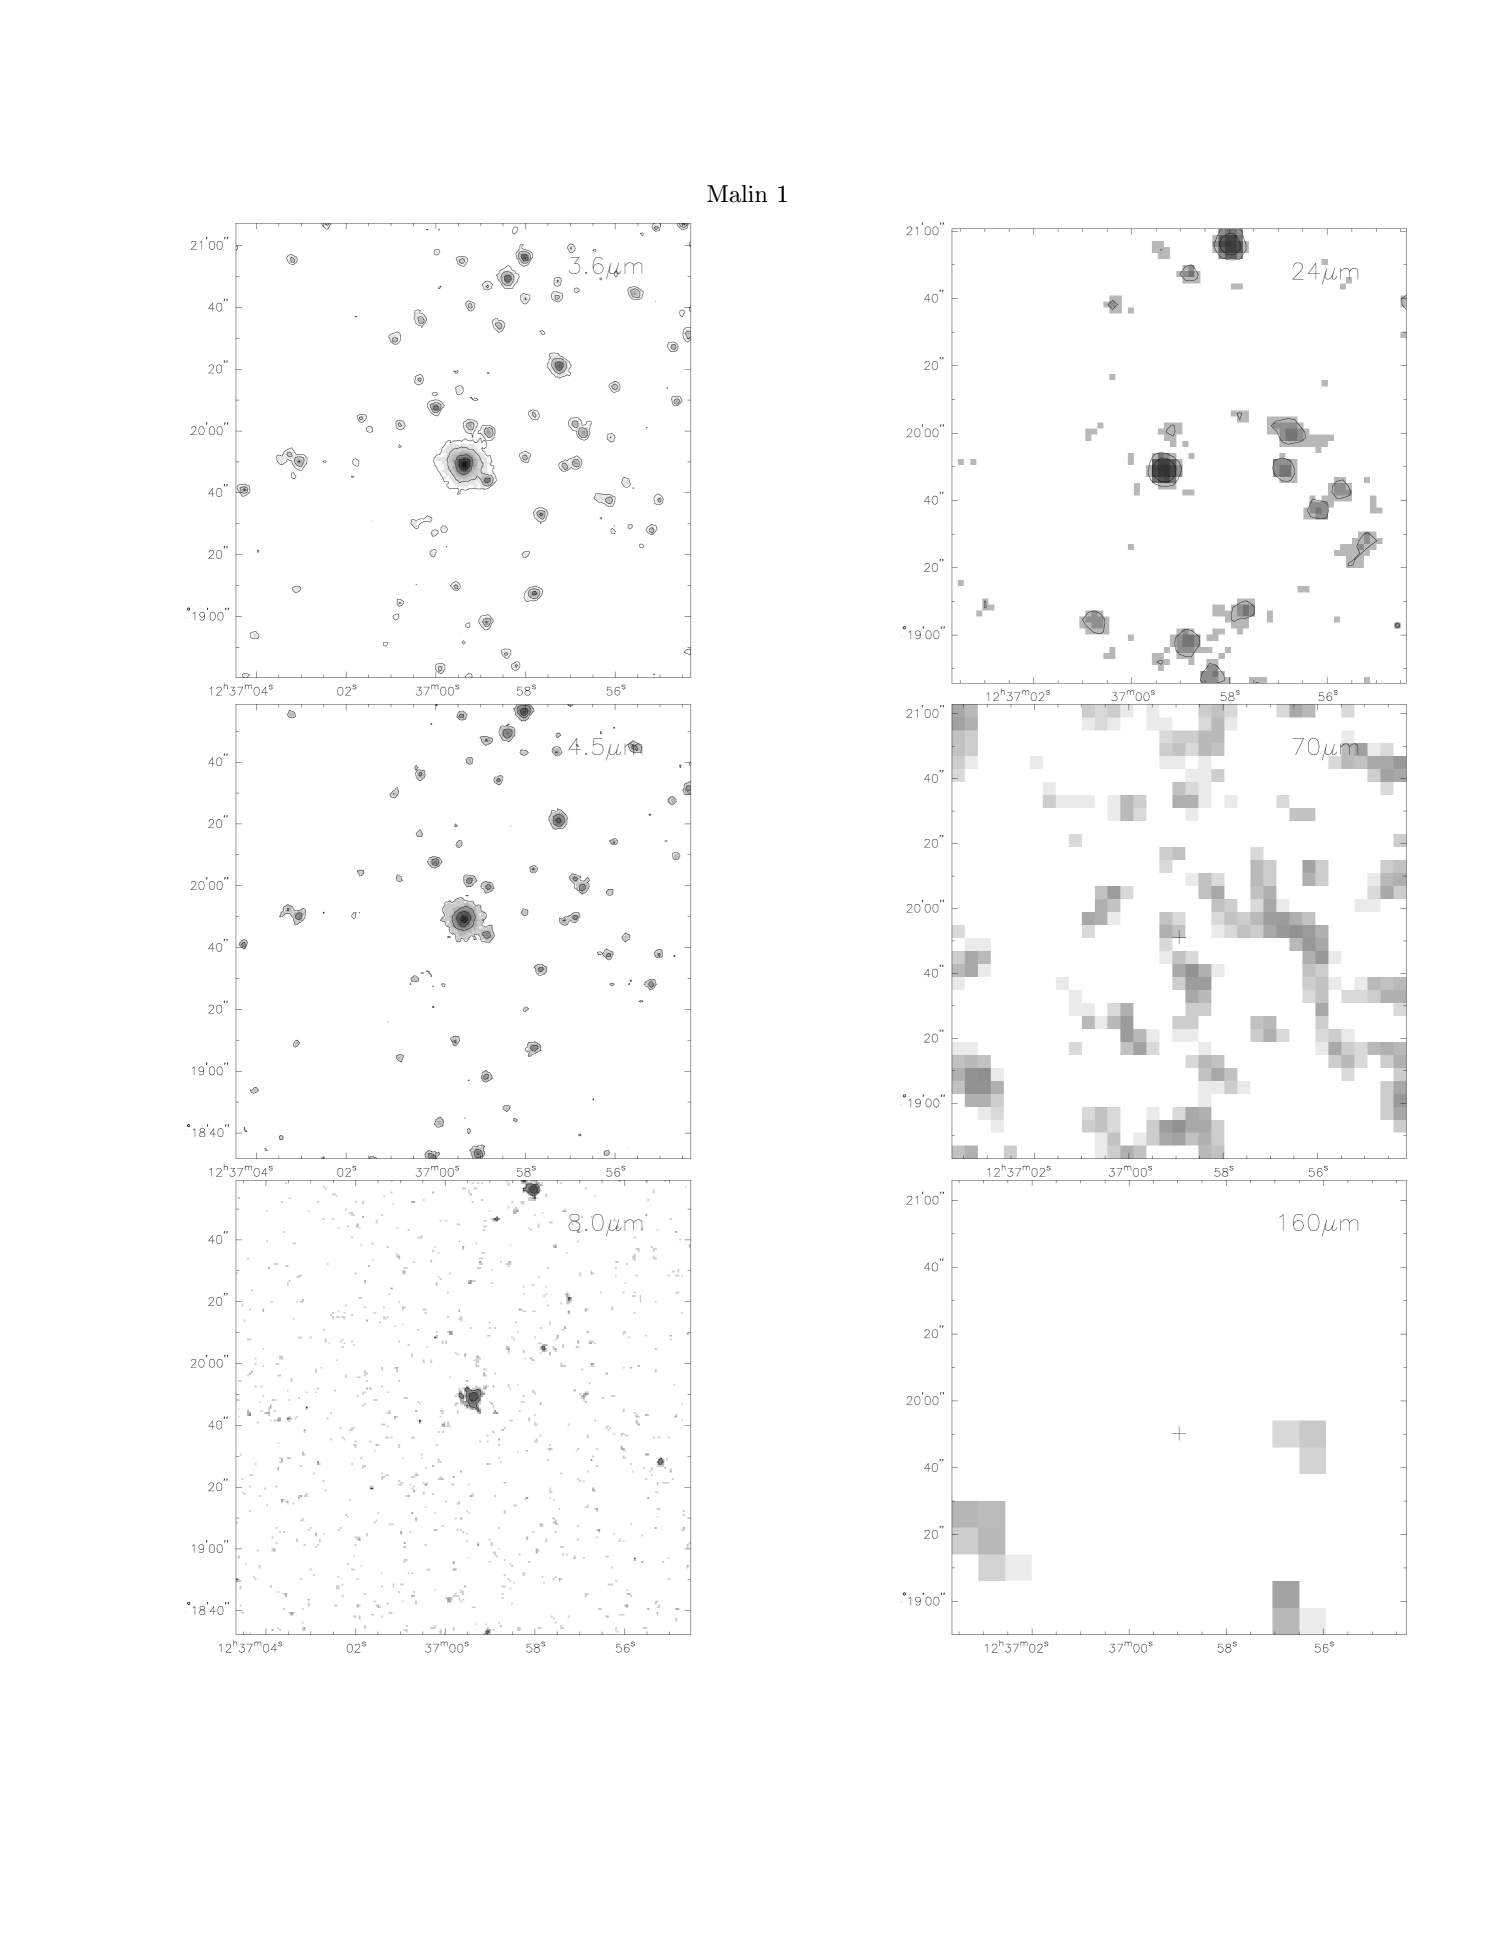
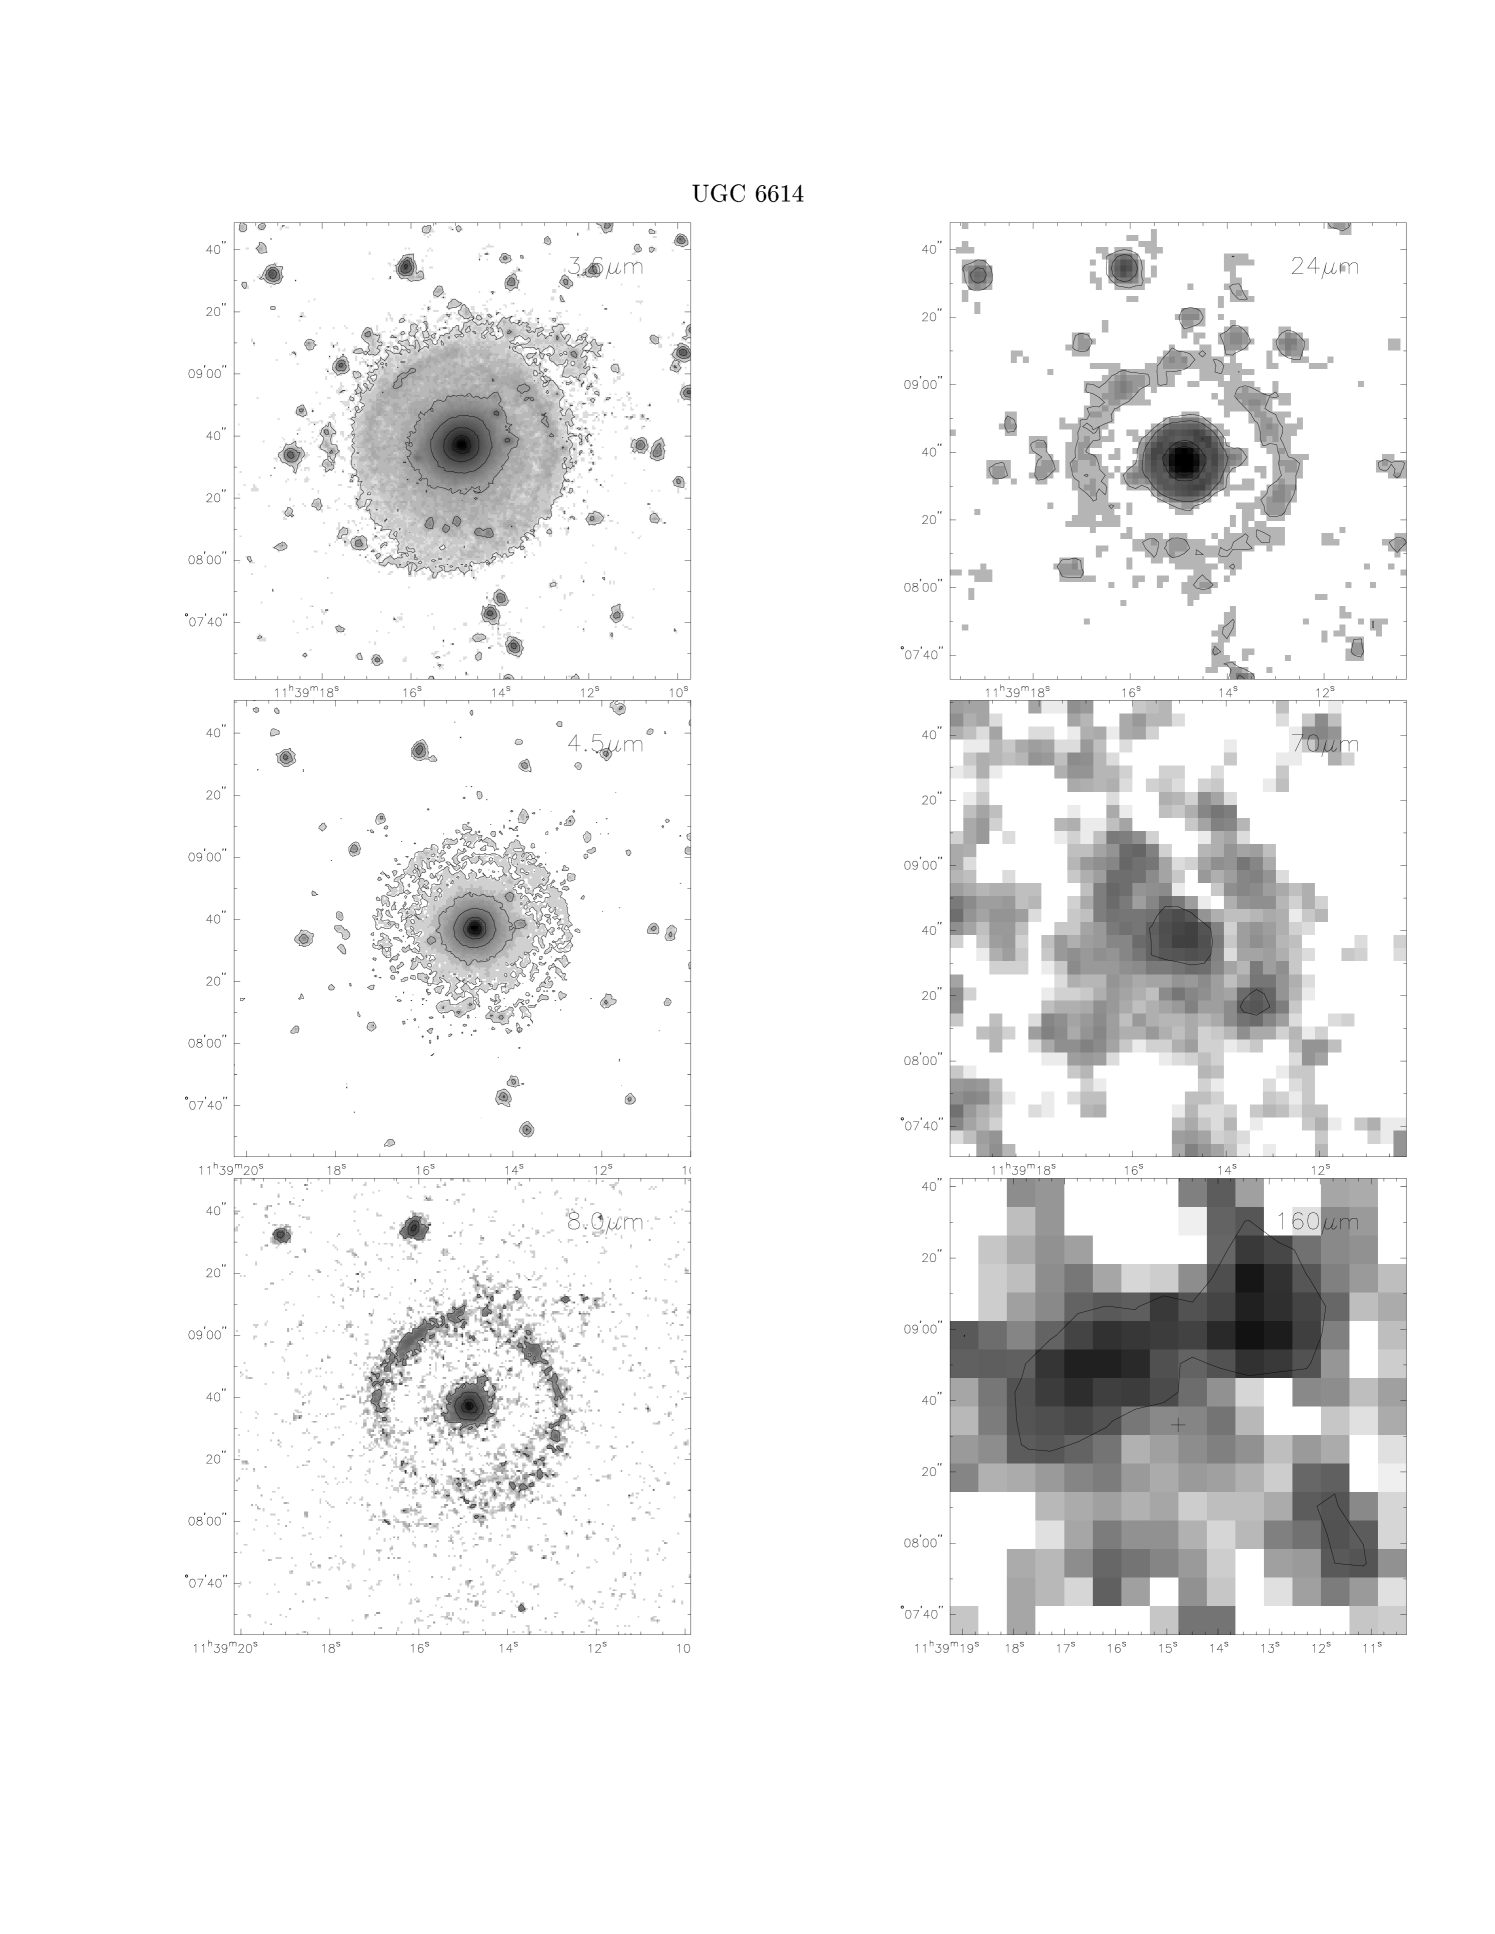
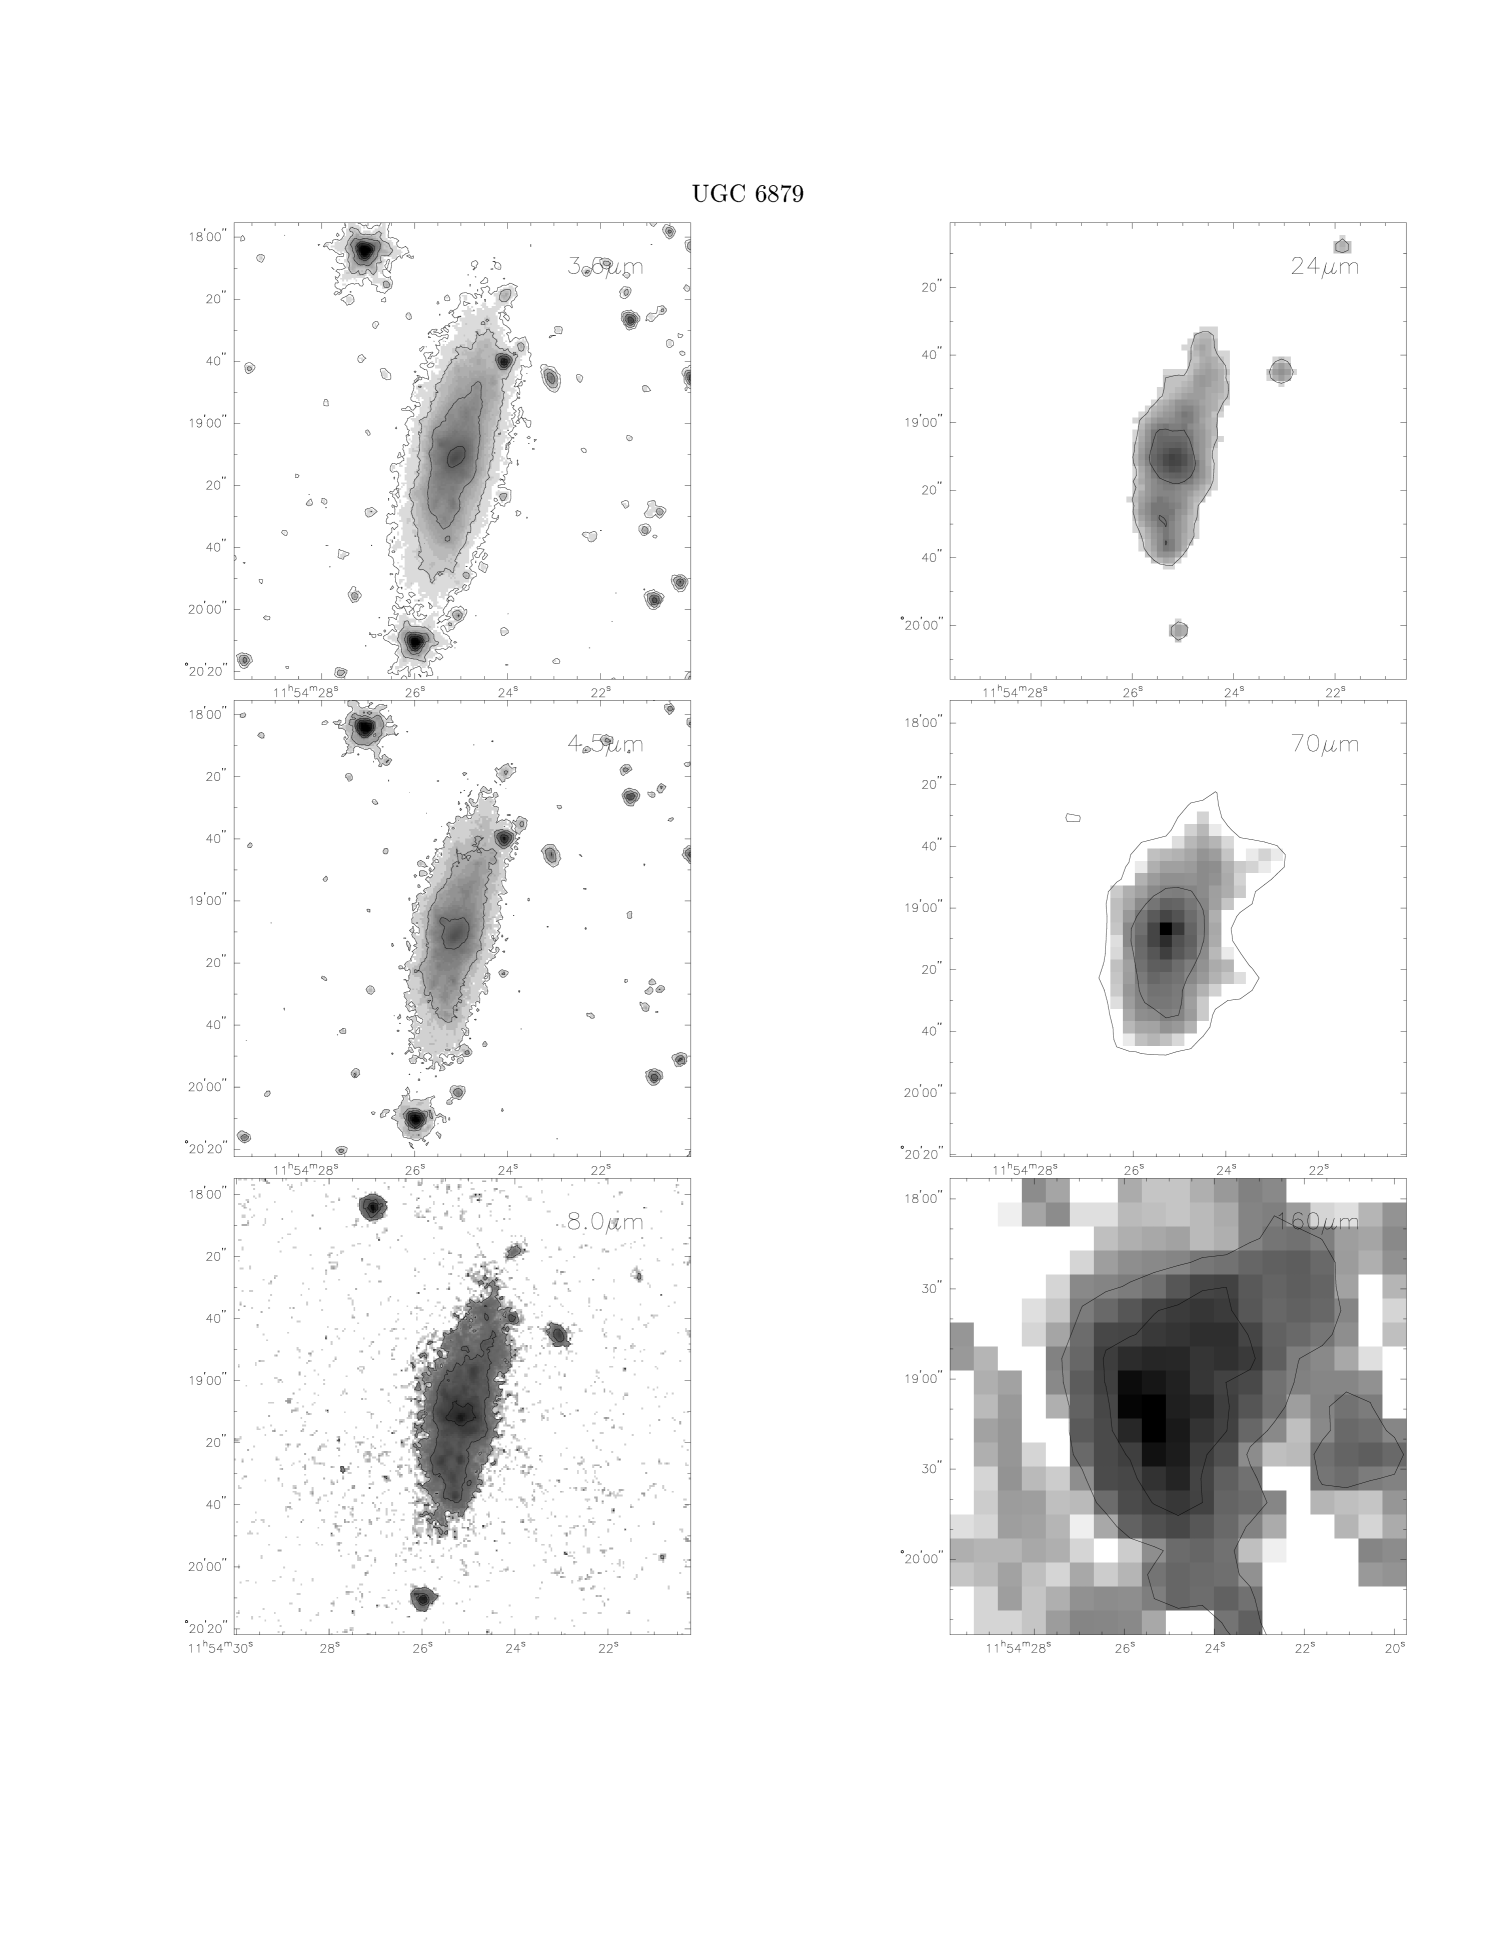
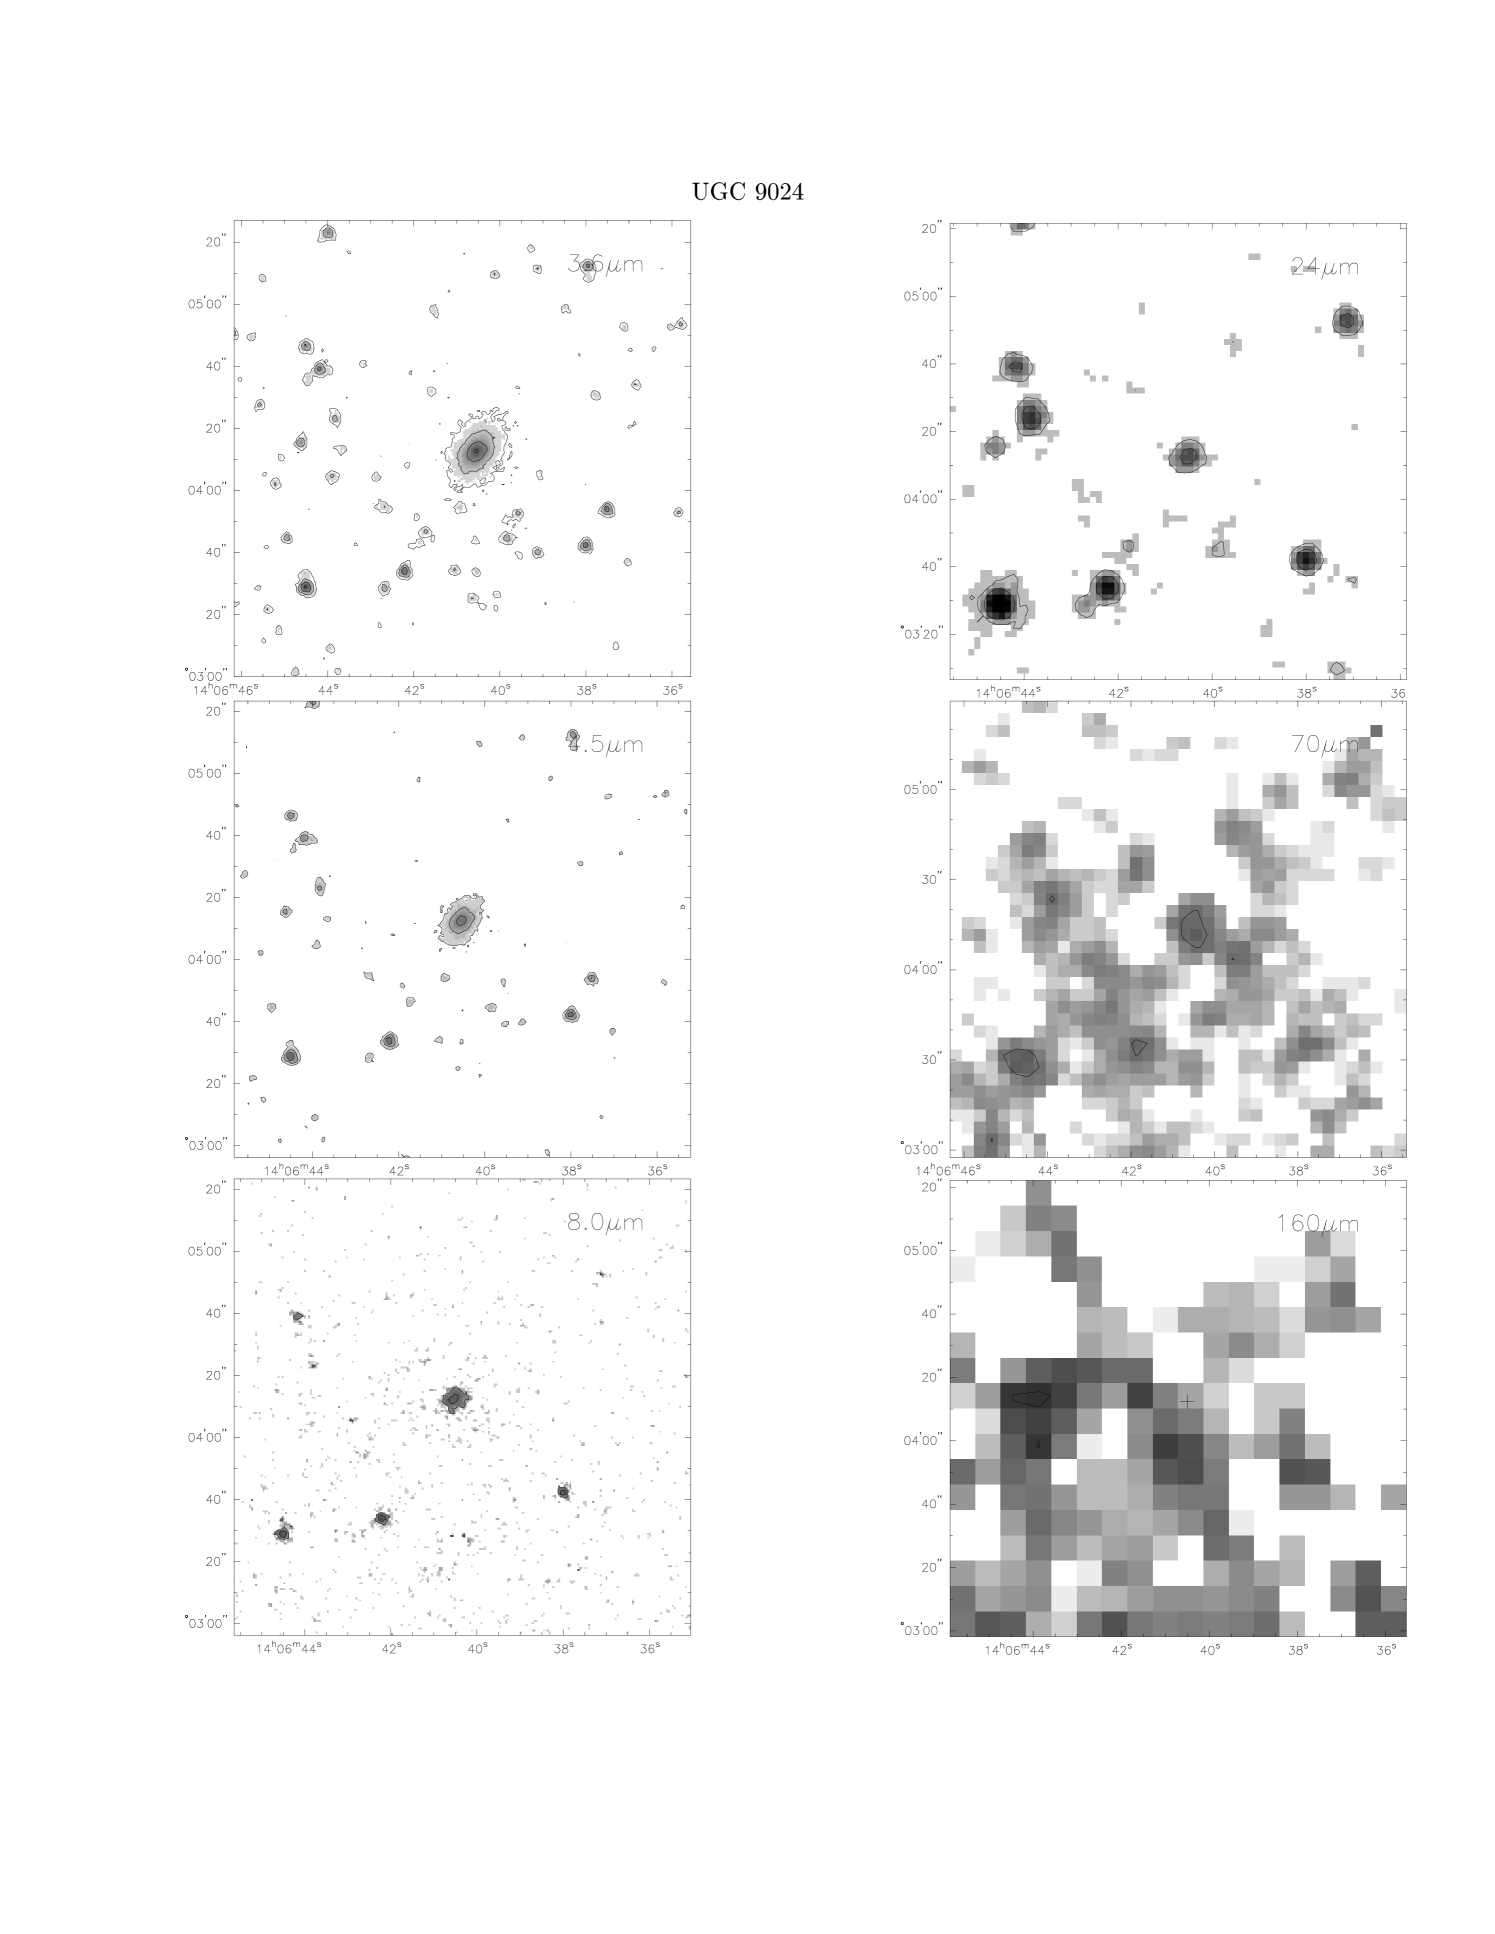
The Solan Digital Sky Survey (SDSS) images of target galaxies are shown in Fig. 1. The Spitzer images of the LSB galaxies are shown in Fig. 2 (Malin 1), Fig. 3 (UGC 6614), and Fig. 4 (UGC 9024). UGC 6879 is shown in Fig. 5. Galaxy images are shown using Gaussian equalization (Ishida 2004). The images are oriented such that north is up and east is to the left. Malin 1 is too faint to be detected by the MIPS 70 and 160 m channels. The other three galaxies were detected by all IRAC and MIPS bands. We do not show 5.8 m images in these figures since the morphological appearances of each of these galaxies at 5.8 m closely follow that at 8 m. For all galaxies, the IRAC 4.5 and 8 m images are shown without subtracting stellar photospheric emission. The contours represent surface brightness with intervals of where the lowest level is 4 above the background. The lowest level of contours at different bands are 0.04 (3.6 m), 0.05 (4.5 m), 0.30 (8 m), 0.08 (24 m), 1.6 (70 m), and 2.1 (160 m) expressed in MJy/Sr.
The giant optical disks in Malin 1 and UGC 9024 appear as point sources in the IRAC images. While we detect the stellar bulges of these galaxies, their optically diffuse disks remain undetected long-ward of the IRAC bands. This suggests that the low surface brightness structures at larger radii might be photometrically distinct components rather than smoothed extensions of the normal inner disks (see Barth 2007 for a discussion on Malin 1 based on Hubble data). That the disks appear in the -band but are undetected at 3.6 m suggest that these disks have a small population of young stars rather than a large population of old stars. The bulge spectrum of Malin 1 is consistent with a predominantly old stellar population (Impey & Bothun 1989). For both of these galaxies, the mid-IR emissions at 8 and 24 m are concentrated in the central few kpc, within a region of 12″ (20 kpc) radius for Malin 1 and 24″ (5 kpc) radius for UGC 9024.
Undetected far-IR emission from the disk of Malin 1 implies that it contains either very cold ( K) cirrus-like dust emitting in the submillimeter and millimeter wavelengths or it lacks cold dust altogether and contains only neutral gas. For UGC 9024, 70 m emission comes from the central region but 160 m emission is very hard to measure because of large scale diffuse emission in the field. This result in an upper limit of mJy.
The optical morphology of UGC 6614 shows a massive bulge and spiral structure. A thin ring 40″ from the core is prominent in H (McGaugh et al. 1995). The 3.6 and 4.5 m emission is spread over the entire disk of this galaxy. The 3.6 m image shows a discernible spiral arm pattern closely resembling the optical morphology. At 4.5 m this feature disappears and the disk shrinks in radius showing only its inner region. This galaxy appears markedly different at 5.8 and 8 m compared to the other IRAC bands. The 8 m morphology suggests that the PAH emission is coming from two distinct regions: the central bulge and an outer ring surrounding the bulge. The 8 m morphology closely traces the H image. The MIPS 24 m morphology is similar to the 8 m PAH emission although the outer ring appears a bit more disjointed at this band. The dust emission at 24 m is coming mostly (70%) from the central disk. The lower resolution image at 70 m indicates that only 25% of the dust emission is coming from the central part of the galaxy, with the remaining 75% emission co-spatial with the ring of radius 40″. Surprisingly a dumbbell shaped region is the dominant source (90%) of 160 m emission; these two peaks are located on the NE and NW sides of the ring. The far-IR images of this galaxy show a small, localized region within the ring, SW from the center. Whether or not this region coincide with the spatial location showing the CO emission in this galaxy disk (Das et al. 2006) is not entirely clear. We will investigate this in the forthcoming paper.
UGC 6879 is an edge on spiral with a red central part and a blue (optical) disk. This radial color gradient is perhaps related to greater concentrations of dust in the nucleus than in the overall disk. Being a transitional disk, with a central surface brightness in between HSB and LSB spirals, it is not unexpected to find that UGC 6879 is a strong IR emitting source compared to the LSB galaxies. Both PAH emission and warm dust (24 m ) emission show spatial variation along the disk. These emissions peak at the central region and diminish toward the edge.
3.2 Infrared Diagnostics
3.2.1 IR Spectral Energy Distributions
The flux densities obtained from the 2MASS and IRAS archives and those estimated from the IRAC and MIPS images are given in Table 1. These flux densities are used to construct the observed infrared SEDs of LSB galaxies as shown in Fig. 6. The open and solid circles represent, respectively, 2MASS and IRAC data. The open triangles represent the MIPS data whereas the IRAS upper limits for UGC 6614 and UGC 6879 are shown by filled triangles. Since Malin 1 was undetected by the MIPS far-IR channels we show the detection limits at 70 and 160 m for the total integration time (252 sec. and 42 sec. respectively). We include four SINGS galaxies with different ISM properties for comparison. These are NGC 0337 (a normal star forming galaxy), NGC 2798 (a star burst galaxy), NGC 2976 (a normal galaxy with nuclear H II region), and NGC 3627 (a Seyfert galaxy). They are shown, respectively, by dotted, dashed, dashed-dotted, and long dashed lines. The motive is to make a visual comparison between SEDs of LSB and HSB galaxies. All flux densities are normalized by the 3.6 m flux density.
There are several noticeable features in these SEDs. First, the amplitude of the mid-IR and far-IR dust emissions of LSB galaxies are lower compared to those of HSB galaxies. An obvious and expected result is that the LSB galaxies have less dust content and hence have lower IR emission. Second, Malin 1 is deficient in the integrated 8 m emission compared to its 4.5 m emission. This is quite opposite for other LSB galaxies and more like the SED of an elliptical galaxy (see Fig. 4 in Pahre et al. 2004). Third, the 24 m emission is suppressed in both Malin 1 and UGC 9024. For UGC 6614 it is slightly above the IRAC bands. This feature suggests that the ISM of UGC 9024 lacks warm dust emission, and is made mostly of cool dust. Fourth, the SEDs show a tendency to turnover at relatively longer wavelength, a signature that the low density and low surface brightness ISM have low radiation intensity. On the other hand, the shape of the SED of UGC 9024 is quite similar to those of the representative HSB galaxies. We discuss this in detail in section
3.2.2 Dust Mass
Dust mass is frequently estimated by fitting the far-IR peak by a single temperature modified blackbody function (Hildebrand 1983). However, the inability of a single temperature or even two temperature blackbody function to fit the observed flux densities suggests that a more sophisticated model of the IR SED is needed. The global SED models of Dale et al. (2001) and Dale & Helou (2002; hereafter DH02) provide a robust treatment of the multiple grain populations that contribute to the IR emission in a galaxy. This model allows a realistic derivation of dust mass since it combines information from the full range of heating environments (10K-1000K). Previous studies have shown that dust mass is underestimated by a factor of 5-10 for quiescent galaxies (i.e. IR cool) if one simply fits the far-IR and sub-millimeter continuum data points with a simple single temperature black body instead of exploiting information from the full range of the SED.
Figure 7 shows the fits to the observed SEDs obtained from the DH02 model (solid line). The dashed and dotted lines represent, respectively, empirical stellar SED (Pahre et al. 2004) and stellar synthesis model prediction fitted only to the 2MASS fluxes from Vazquez & Leitherer (2005). We use the model fit (solid line) to estimate and noting that DH02 model does not provide ideal fits to very extended, low density, diffuse disks like Malin 1 and UGC 9024. However, within the measurement and observational uncertainties the model fits provide useful insight. A rigorous and detailed treatment of infrared SEDs of LSB disks will be presented in a future study.
The estimated mass is given in Table 2. We find that the ISM of UGC 6614 has the highest amount of dust with dust-to-gas ratio, 0.01. Both Malin 1 and UGC 9024 are 3 times less dusty than UGC 6614. Given that IR emission coming only from the central regions of the latter two galaxies, it is not surprising that they show low dust content. In a recent study Das et al. (2006) detected CO(1-0) emission localized in a specific region on the disk of UGC 6614. They estimated molecular gas mass () which is almost equal to the total dust content ( ) that we measure distributed over the bulge and disk. The difference between and dust-to-(total) gas mass is negligible.
The (systematic) calibration uncertainty in the observed flux densities and the uncertainty in the distance estimates result in a 30% uncertainty in . Additional uncertainty comes from the mass absorption coefficient. The different sizes used to measure IR and H I fluxes will also attribute additional uncertainty in . Besides, considering that the long-wavelength end of the SED is poorly constrained the estimate of overall dust mass and gas-to-dust ratio is a bit uncertain. All of these errors compound to make Md and uncertain by a factor of 2 or more.
3.2.3 Infrared Luminosity
DH02 proposed a simple relation to compute total IR luminosity using the MIPS bands (see Eq. 4 in DH02). Due to uncertainties in the MIPS flux densities for Malin 1 and UGC 9024 we use the empirical relation given by Calzetti et al. (2005) to estimate . Calzetti et al. relate flux densities at 8 m and 24 m to derive for M 51, a normal star forming galaxy. Estimated total IR luminosities are given in Table 2 with estimated uncertainty of 35%. We find comparable IR luminosity for both Malin 1 and UGC 6614. UGC 9024 is the least luminous because of its suppressed 24 m warm dust emission. In spite of its border line HSB nature, the IR output of UGC 6879 resembles a normal quiescent galaxy.
We also estimate using DH02 model fits. We follow Sanders & Mirabel (1996) to define where flux densities at 12, 25, 60, and 100 m are obtained from the model SEDs by interpolation. The result is presented in Table 2. Interestingly, these two estimates are within a factor of 2.5 where the model estimates are always higher. The largest difference is noted for UGC 9024 which is a result of relatively poor fit to the data.
Within the uncertainty, the IR energy output of LSB galaxies are smaller by a factor of a few compared to their -band luminosities . The infrared-to-blue ratio, , compares the luminosity processed by dust to that of escaping starlight (see Table 2). The ratio ranges from 0.01 (in quiescent galaxies) to 100 (in ultra-luminous galaxies). It can be used to characterize optical depth of a system composed of dust and stars as well as recent (100 Myr) SFR to the long term (1 Gyr) average rate. The ratio is in the range 0.3-0.5 (see Table 2) indicating that the current level of star formation is low, a consistent result with previous studies on star formation in the LSB ISM (van den Hoek et al. 2000; Burkholder 2001). However, there is a potential degeneracy in this parameter and one can only make an indirect assessment of the ISM of a galaxy if this degeneracy can be lifted. The fact that is less than unity can arise from two different physical conditions. In one hand, a galaxy may be undergoing intense heating by young stars (large ) but have very little neutral ISM left (less IR emission) resulting in low . On the other hand, a quiescent galaxy may generate most of its IR emission in H I clouds heated by older stellar populations and will display a similarly low (Helou 2000).
3.2.4 Star Formation Rate
A widely used recipe for estimating SFR from IR luminosity is given by Kennicutt (1998). However, far-IR luminosity in Kennicutt model is based on IRAS data. Without a proper calibration between IRAS and MIPS far-IR flux densities the uncertainty will loom large in the SFR estimate. We use a new SFR estimator, derived recently by Alonso-Herrero et al. (2006; hereafter AH06) using 24 m flux density. Our estimates are given in Table 2. The error associated with this SFR is 10%.
van den Hoek et al. (2000) derived a current SFR ranging 0.02-0.2 M⊙ yr-1 from -band photometry for a sample of LSB galaxies generally found in the field. Their estimate agree within a factor of two with our results based on infrared data. For Malin 1 and UGC 6614 the infrared SFR are 0.38 M⊙ yr-1 and 0.88 M⊙ yr-1 , respectively, whereas it is 0.01 M⊙ yr-1 for UGC 9024. The fact that these galaxies have low dust content indicates that extinction is less likely to cause the difference between SFR derived from IR and optical data. The higher SFR of UGC 6614 compared to the other two galaxies is consistent with the fact that this galaxy has a prominent H morphology which indicate modest level of current star formation. A very low SFR for UGC 9024 implies that more light is scattered off from the central disk than being absorbed by the ISM.
The SFR of these three LSB galaxies, as derived from IR data, are thus significantly below the rate 5-10 M⊙ yr-1 derived for the HSB galaxies (Kennicutt 1998) but considerably larger than the rate 0.001-0.01 yr-1 observed typically in dwarf irregular galaxies (Hunter & Elmegreen 2004).
The star formation efficiency (SFE), quantified by , is also shown in Table 2. This measure represents the amount of unprocessed gas available to be consumed in subsequent star formation. As expected the LSB galaxies have a SFE that is of the SFE of HSB galaxies.
3.3 Infrared Colors
Panels 8a and 8b show, respectively, mid-IR colors and the well known PAH-metallicity connection. In these diagrams we highlight two extreme classes (in terms of their IR SEDs) of HSB galaxies: the dwarf systems represented by the decimal numerals and the massive elliptical galaxies represented by the roman numerals. All of these galaxies are obtained from the SINGS sample.
Panel 8a compares PAH emission in various classes of galaxies. Metal-rich HSB galaxies preferentially show high ratio in and low ratios of non-stellar 4.5-to-8 m dust emission. Metal poor (e.g. dwarfs and irregulars) and extremely metal poor HSB galaxies such as blue compact dwarfs (BCDs), show the opposite trend and fall within the PAH-deficient box (Engelbracht et al. 2005; hereafter E05). Note that E05 only looked at star-forming galaxies. “Red and dead” ellipticals should have little or no PAH emission, yet are nowhere near the PAH-deficient region. So this region will not necessarily contain all PAH deficient galaxies. Also note that the result of E05 could also arise from selection bias since recent studies have shown that dwarf galaxies are not necessarily PAH defficient systems (Rosenberg et al. 2006).
Panel 8b, on the other hand, illustrates the PAH- connection in HSB galaxies. E05 showed that galaxies with low PAH emission have relatively unpolluted ISMs. They noted a sharp boundary between galaxy metallicity with and without PAH emission, although the trend may have been affected by selection bias. We show this trend in panel 8b, where the PAH deficient galaxies reside inside the dashed region and galaxies with higher metallicites avoid two regions in the diagram which are shown by the dotted lines. We are interested to see where the LSB galaxies fit in these diagrams.
Panel 8a shows that the LSB galaxies are different than the PAH-deficient dwarf galaxies in terms of their mid-IR colors. In the color space, LSB galaxies occupy a region similar to HSB galaxies and reside significantly farther (, along the horizontal axis) from PAH-deficient galaxies. While UGC 6614 stays right in the middle of the locus, both Malin 1 and UGC 9024 falls in the edge because of the shapes of their SEDs at 8 and 24 m. The mid-IR colors of these galaxies closely resemble those of elliptical galaxies which is surprising given that their apparent different star formation histories.
The LSB galaxies are metal poor with (McGaugh 1994; de Bloke & van der Hulst 1998b; de Naray et a. 2004). McGaugh (1994) provided an estimate of oxygen abundance for UGC 6614 but it is highly uncertain. Following the general trend shown by the LSB galaxies we assign one-third solar value to Malin 1 and a solar value to UGC 6879. The full range and the median values of published oxygen abundance are shown for UGC 6614 and UGC 9024.Having very limited information it is, therefore, extremely difficult to explore the PAH-metallicity connection for these galaxies. We are interested in the question whether LSB galaxies being low systems, will appear close to the PAH-deficient box or will they fall in the region shunned both by HSB dwarfs and HSB spirals with extended disks (dotted regions; Fig 8b)? While it is tempting to give more weight to the latter case, only three data points with large errors are insufficient to derive any trend. A larger sample of LSB galaxies with 8 m detections is needed to shed more light on this topic.
Panel 8c shows the connection between mid-IR and far-IR colors which basically describe the nature of dust emission at these wavelengths. In this panel, the far-IR color of Malin 1 is shown with respect to a far-IR flat SED, i.e. same flux density at 70 and 160 m. For the other two galaxies the diagram shows rather low and high ratios. While low far-IR color suggest that they are IR cool sources, the mid-IR color may be linked with the destruction of very small grains (but not the PAH molecules) and thus can be used as a parameter which can signal evolutionary stages of an ISM. A higher value of can mean that is high (large amount of PAH) or that is low (little or no warm dust). Ellipticals are in the latter category (see Pahre et al. 2004) whereas LSB systems are in the first category. It should be noted that the 24 m emission is very closely associated with H II regions (Helou et al. 2004). Therefore, the lack of emission at this wavelength is more likely a deficiency in H II region which is quite consistent with the H images of LSB galaxies (McGaugh et al. 1995; de Naray et al. 2004).
The vertical arrow in panel 8d represents a probable range of IRAS far-IR color for UGC 9024 assuming that Spitzer far-IR ratio is the same as the IRAS far-IR ratio. The sequence of IR colors can be associated with a progression toward greater dust heating intensity and thus with a sequence of star formation activity. The cool end of the color sequence corresponds to cool diffuse H I medium and quiescent molecular clouds, whereas the warm end corresponds to the colors of H II regions, starbursts, and galaxies with higher ratios. Although the IR nature of these three LSB galaxies are explicit in this diagram, the interesting feature is that they are not the extreme cases in terms of IR SEDs as shown by some of the SINGS galaxies.
Two primary sources have been proposed to explain the heating of the dust which produces IR luminosity in spiral galaxies - massive young (OB) stars and associated H II regions (Helou et al. 1985; Devereux & Young 1990, 1993), and non-ionizing A and later stars (Lonsdale & Helou 1986; Walterbos & Schwering 1987; Bothun et al. 1989). Some authors, however, suggest contribution from both sources (Smith 1982; Habing et al. 1984; Rice et al. 1990; Sauvage & Thuan 1992; Smith et al. 1994; Devereux et al. 1994). The dominance of the heating source is, therefore, governed by the availability of discrete and dense star forming regions in the ISM. While observational evidence suggests that the global IR emission from luminous IR spiral galaxies provides a measure of high mass SFR (Kennicutt 1998), the diffuse IR emission in quiescent galaxies is caused mainly by the thermal radiation of the interstellar dust heated by the interstellar radiation field (ISRF) (Jura 1982; Mezner et al. 1982; Cox et al. 1986; Jura et al. 1987).
The dust color temperature () deduced for galaxies from the IRAS 60 and 100 m flux densities are typically 25-40 K assuming emissivity index (Rahman et al. 2006). This range is similar to the temperature of dust in Galactic star-forming regions (Wynn-Williams & Becklin 1974; Scoville & Good 1989), and considerably greater than the 15-20K temperatures expected for dust heated by the ambient ISRF (Jura 1982; Mezner et al. 1982; Cox et al. 1986; Jura et al. 1987). The color temperature derived from the MIPS 70 and 160 m of LSB galaxies ranges 17-21 K.
From a statistical study of a large sample of optically selected galaxies, Bothun et al. (1989) demonstrated that in the absence of UV radiation, far-IR color ratio of can result from dust which is heated by old stars. Galaxies with requires a steadily increasing proportion of UV heated dust, while galaxies with are entirely dominated by the UV heated dust. From panel 8d we find that the LSB galaxies have cool effective dust temperatures and therefore lack intense heating from massive stars.
It should be mentioned here that in the IR color analysis we did not subtract the stellar contributions from the 8 and 24 m measurements to exactly reproduce the E05 diagram. Assuming conservatively that the 3.6 m emission is coming from the stellar photosphere, the stellar contributions obtained from the empirical stellar SED of Pahre et al. (2004) derived for early type galaxies are 59%, 38%, and 19% at 4.5, 5.8, and 8 m, respectively. The stellar contribution at 24 m emission is 5% or less. Applying corrections to the corresponding flux densities do not change our results since these corrections systematically shift the parameters in the color space. Note that we use the same set of numbers for each galaxy ignoring the variation in amount of stellar contributions from galaxy to galaxy. However, error due to this is negligible. To find stellar contributions, preference is given to the empirical SED than any stellar synthesis model because of unknown SFHs and poor metallicity constraints for LSB galaxies.
In summary, from the four panels of Fig. 8 we conclude that: (a) Malin 1, UGC 6614, and the intermediate HSB/LSB object UGC 6879 have mid-IR colors similar to quiescent HSB disk galaxies; UGC 9024 falls in the region of HSB elliptical galaxies in this color plane. (b) There is insufficient data to conclude whether LSB galaxies have PAH emission properties significantly different from HSB galaxies with comparably low metallicities. Observations of many more LSB galaxies are needed to settle this. (c) Available far-IR detections and upper limits indicate that LSB galaxies are far-IR cool sources. The dust temperatures derived from the MIPS 70 and 160 m of LSB galaxies ranges 17-21 K, similar to many quiescent HSB spiral and elliptical galaxies.
3.4 Molecular ISM
The LSB galaxies are rich in neutral hydrogen (H I). Molecular hydrogen () gas inferred from CO emission has been detected in only a handful of such galaxies (Matthews & Gao 2001; O’Neil & Schinnerer 2004; Matthews et al. 2005; Das et al. 2006). The low rate of CO detection has been attributed to an ISM with low dust content and a low surface density of neutral gas. Dust opacity is crucial for the formation and survival of molecules since it provides them necessary shielding from the ISRF. A larger column density is needed to self-shield the H2 molecule. A low density and less dusty environment exposes H2 to UV photons which can easily dissociate these molecules. The low star formation and far-IR cool nature of LSB galaxies implies lower energy density of the radiation field and consequently lower dissociation of CO and H2 (de Blok & van der Hulst 1998b).
The deficiency of molecular gas detections in LSB galaxies may point to a dynamical condition such as the absence of large-scale instability in the disk preventing formation of giant molecular clouds (Mihos et al. 1997). Local instabilities may lead to cloud condensation resulting in localized star formation which may escape detection by current observations (de Blok & van der Hulst 1998b). Local instability in the disk invokes energetic phenomena such as SN explosions and the frequency of such occurrence in LSB galaxies is low (Hoeppe et al. 1994; McGaugh 1994). The enhanced cooling by molecules is crucial in the onset of instability of molecular clouds. Therefore, the effect of less efficient cooling of the ISM can also prevent local instabilities. Long cooling time leads to higher cloud temperatures and thus makes it difficult for a cold molecular phase to exist (Gerritson & de Blok 1999).
If the low density ISM truly lacks H2 and CO molecules, what other types of molecule can exist in this environment? Are they very cold or very warm molecules of known types? To which dust components do they belong? Along with millimeter wavelength observations, can we use currently available IR data to shed light into these questions? One of the three LSB galaxies, UGC 6614, has been reported to have CO(1-0) emission at a certain localized region in the disk (Das et al. 2006), while the other two galaxies have not been observed in this wavelength. On the other hand, the Spitzer observation of UGC 6614 shows the presence of enhanced PAH emission on the bulge and almost entirely along the outer disk. This 8 m emission, however, is concentrated in the central regions of the other two galaxies.
A possible source of the origin of PAH molecules is the dense, high temperature, carbon-rich ([C]/[O] ) environment of circumstellar envelopes surrounding mass-losing AGB carbon stars. PAH formation by stars with more normal, oxygen-rich, photospheric abundances ([C]/[O] ) will be negligible because nearly all the available carbon is bound up in the CO molecules (Latter 1991). Therefore, if the stellar population responsible for the enrichment of the ISM are dominantly old carbon-rich stars, the warm PAH molecules will be ubiquitous resulting in lower abundance of CO molecules. While a detailed investigation is beyond the scope of this study, we believe the observed PAH emission and lack of CO emission holds the potential clue to probe not only the ISM but also to better understand the SFHs in LSB galaxies.
3.5 Mid-IR Photometry of UGC 6614
The optical spectra of large LSB disks show an unexpected high occurrence of low-level active galactic nuclei (AGN) type activity (Spraybarry et al. 1995; Schombert 1998). UGC 6614, a optical giant LSB galaxy, is suspected to harbor a weak AGN from the optical spectrum (Schombert 1998) and from excess emissions at millimeter (Das et al. 2006) and radio wavelengths (Condon et al. 2000). Integrated mid-IR photometry provides a robust technique to identify AGN in HSB galaxies where AGN tend to be redder than normal star forming galaxies in the mid-IR (Lacy et al. 2004; Stern et al. 2005).
To determine whether one can use a similar technique to detect AGN signatures in a LSB bulge, we analyze the IRAC colors ([3.6]-[4.5] vs. [5.8]-[8.0]) of UGC 6614. The colors are measured for two regions of radius 1 and 5.5 kpc, respectively, encircling the galaxy center (Fig. 9; left panel). We find that in the color space, along the vertical [3.6]-[4.5] axis, the galaxy resides well outside the Stern et al “AGN box”. Although the lower end of the AGN box is within the error bar of this galaxy, its overall mid-IR color put it in a region occupied mostly by star forming galaxies suggesting that broad band colors may not be an efficient tracer for weak AGNs.
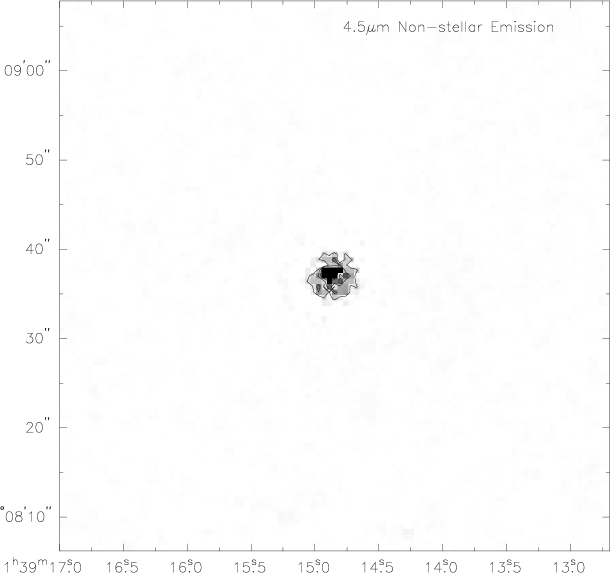
The contribution from an AGN to the measured IRAC fluxes can be estimated by combining image subtraction with assumptions about the nature of the SED coming from starlight and AGN emission. We use Pahre et al. (2004) for stellar flux ratios, and a power law SED for AGN (Clavel et al. 2000). Following the procedure of Howell et al. (2007), a 4.5 m image of the non-stellar emission was constructed (Fig. 9; right panel). Unlike the procedure of E05 which simply measures , this procedure includes an additional factor to account for the contribution of non-stellar emission to the 3.6 m image. The non-stellar flux density measured this way indicates that, within a 12″ aperture, the AGN contributes 12% of the light at 4.5 m and 6% at 3.6 m. At 8 m, starlight and the AGN each contribute 35% of the light, with PAHs contributing the remaining. Note that the selected aperture includes only the bulge of the galaxy, excluding the spiral arm/ring structure.
UGC 6614 illustrates that although [3.6]-[4.5] color can identify strong AGN, weaker AGN will not be clearly separated from pure stellar sources. The procedure of E05, measuring , will identify regions of non-stellar emission but will not provide quantitative picture of stellar emission. Given reasonable assumptions the procedure of Howell et al. allows a quantitative decomposition of the stellar and non-stellar flux densities.
4 Summary and Conclusions
The Spitzer observations of the three optical giant low surface brightness galaxies Malin 1, UGC 6614, and UGC 9024 have been examined to study the mid and far-IR morphology, spectral energy distributions, and IR color to estimate dust mass, dust-to-(atomic) gas mass ratio, total IR luminosity, and star formation rate (SFR). We also investigate UGC 6879, which is intermediate between HSB and LSB galaxies.
The 8 m images indicate that polycyclic aromatic hydrocarbon (PAH) molecules are present in the central regions of all three metal-poor LSB galaxies. The diffuse optical disks of Malin 1 and UGC 9024 remain undetected at mid- and far-infrared wavelengths. The dustiest of the three LSB galaxies, UGC 6614, has infrared morphology that varies significantly with wavelength; 160 m (cool) dust emission is concentrated in two clumps on the NE and NW sides of a distinct ring seen in the 24 and 8 m images (and a broken ring at 70 m) at a radius of 40″ (18 kpc) from the galaxy center. The 8 and 24 m emission is co-spatial with H emission previously observed in the outer ring of UGC 6614. The estimated dust-to-gas ratios, from less than to , support previous indications that LSB galaxies are relatively dust poor compared to HSB galaxies. The total infrared luminosities are approximately 1/3 to 1/2 the blue band luminosities, suggesting that old stellar populations are the primary source of dust heating in these LSB objects. The SFR estimated from the infrared data ranges , consistent with results from optical studies. The mid-IR colors of UGC 6614 shows the presence of a weak AGN at the central bulge.
Questions can be raised such as what is the most viable reason for these LSB galaxies to have ? To answer this question we first note that observables such as stellar populations and SED shapes can be used to break the degeneracy in infrared-to-blue ratio (Helou 2000). That LSB galaxies have low infrared-to-blue luminosities, stellar populations spanning a wide range of mean ages, are not dominated by OB stars (McGaugh 1994), have less dust than the HSB galaxies (see Fig. 6), and are IR cool sources (see Fig. 8) suggest a composite scenario. The LSB disks are less dusty and the older stellar populations are the primary source of the IR emission from their ISMs.
The presence of PAH emission in these three galaxies indicates that the ISM of the region contributing to the emission in these galaxies have significant amount of carbon enrichment over cosmic time and the ISRF in the ISM must have been significantly weak and thus it is unable to reduce the strength of PAH emission. In other words, the small grains are more exposed to the ISRF so that their destruction rate is larger than for PAH molecules.
The detection of mid and far-IR emission from a larger sample will be crucial to understand the properties of ISM in LSB galaxies and probing their star formation histories. This will have a significant effect on analytical modeling of galaxy formation and evolution, the role of different galaxy populations in observed number counts and possibly metallicity effects in the observed number counts. Whether star formation in LSB disks occurred in a continuous fashion but with a low rate, or in an exponentially decreasing rate, or as sporadic bursts with quiescent periods in between is still a matter of debate. Since each type of formation history will lead to a stellar population that could be traced by optical photometry (i.e. blue or red), the formation scenario must follow the route where the ISM would be in a state having significant carbon enrichment with substantial amount of dust. The constraints coming from SST such as mid-IR 8 m emission and moderate dust mass could be used as probes to understand the nature of LSB spirals.
Metal poor HSB objects such as blue compact dwarf galaxies are PAH deficient systems (E05; Wu et al. 2006). Their SEDs are markedly different in the 5-15 m wavelength range compared to metal rich HSB galaxies. The LSB galaxies are metal poor but have substantial PAH emission. Although these galaxies are not the extreme cases in metal deficiency such as BCDs, they fill an interesting niche among local populations, distinct from HSB dwarfs and from HSB regular galaxies. They may also represent a significant fraction of the galaxy population at earlier epochs (Zackrisson et al. 2005), and therefore, may have important implication in the interpretation of galaxy number counts in the infrared/submillimeter as well as in the visible and near-IR wavelengths.
Previous analytical studies suggest that metal abundances have profound implications on galaxy number counts observed at 24, 70, and 160 m (Lagache et al. 2003; Dale et al. 2005). To date, in analytical models metallicity effects have been incorporated in an ad hoc manner by artificially manipulating SEDs of HSB galaxies in the wavelength range mentioned above (Lagache et al. 2003). When template SEDs of many nearby metal-poor LSB galaxies become available, one can incorporate these in galaxy evolution models as an independent class along with various other classes such as normal star forming, starburst, luminous and ultra-luminous, and AGNs to understand the observed galaxy number counts and the origin of the IR background.


References
- Alfonso-Herrero et al. (2006) Alfonso-Herrero, A., Reike, G. H., Reike, M. J., Colina, L., Perez-Gonzalez, P. G., & Ryder, S. D. 2006, ApJ, 650, 835
- Asplund et al. (2004) Asplund, M., Grevesse, N., Sauval, A. J., Allende Prieto, C., & Kiselman, D. 2004, A&A, 417, 751
- Barth (2007) Barth, A. J., 2007, AJ, 133, 1085
- Bell et al. (2000) Bell, E. F., Barnaby, D., Bower, R. G., et al. 2000, MNRAS, 312, 470
- Bergvall et al. (1999) Bergvall, N., Rõnnback, J., Masegosa, J., & Östlin, G. 1999, A&A, 314, 679
- Bernard et al. (1994) Bernard, J. P., Boulanger, F., Desert, F. X., Giard, M., Helou, G., & Puget, J. L. 1994, A&A, 291, L5
- Bothun et al. (1997) Bothun, G. D., Impey, C. D., McGaugh, S. S. 1997, PASP, 109, 745
- Bothun et al. (1989) Bothun, G. D., Lonsdale, C. J., & Rice, W. 1989, ApJ, 341, 129
- Burkholder et al. (2001) Burkholder, V., Impey, C., & Sprayberry, D. 2001, ApJ, 122, 2318
- Calzetti et al. (2005) Calzetti, D., Kennicutt, R. C., Jr., Bianchi, L., et al. 2005, ApJ, 633, 871
- Clavel et al. (2000) Clavel, J., Schulz, B., Altieri, B., et al. 2000, A&A, 357, 839
- Cox et al. (1986) Cox, P., Krugel, E., & Mezgner, P. 1986, A&A, 155, 380
- Dale et al. (2001) Dale, D., Helou, G., Contursi, A., Silbermann, N. A., & Kolhatkar, S. 2001, 549, 215
- Dale & Helou (2002) Dale, D., & Helou, G. 2002, 576, 159 (DH02)
- Dale et al. (2005) Dale, D., Smith, J. D. T., Armus, L., et al. 2005, ApJ, 646, 161
- Das et al. (2006) Das, M., O’Neil, K., Vogel S. N., & McGaugh, S. S. 2006, ApJ, 651, 853
- (17) de Blok, W. J. G., & van der Hulst, J. M. 1998a, A&A, 335, 421
- (18) de Blok, W. J. G., & van der Hulst, J. M. 1998b, A&A, 336, 49
- de Naray et al. (2004) de Naray R. K., McGaugh S. S., & de Blok, W. J. G. 2004, MNRAS, 355, 887
- Desert et al. (1990) Desert, F. X., Boulanger, F., & Pugetet, J. L. 1990, AA, 237, 215
- Devereux & Young (1990) Devereux, N., & Young, J. 1990, ApJ, 359, 42
- Devereux & Young (1993) Devereux, N., & Young, J. 1993, AJ, 106, 948
- Devereux et al. (1994) Devereux, N., Price, R., Wells, L., & Duric, N. 1994, AJ, 108, 1667
- Engelbracht et al. (2005) Engelbracht, C. W., Gordon, K. D., Rieke, G. H., Werner, M. W., Dale, D. A., & Latter, W. B. 2005, ApJ, 628, L29 (E05)
- Fazio et al. (2004) Fazio, G. G., Hora, J. L., Allen L. E., et al. 2004, ApJS, 154, 10
- Freeman (1970) Freeman, K. C. 1970, ApJ, 160, 811
- Gerritsen & de Blok (1999) Gerritsen, J. P. E., & de Blok, W. J. G. 1999, A&A, 342, 655
- Gautier (1986) Gautier, T. N. III. 1986, in Light on Dark Matter, ed. F. P. Israel (Dordrecht: Reide), p. 49
- Habing et al. (1984) Habing, H. J., Miley, G., Young, E., et al. 1984, ApJ, 278, L59
- Helou et al. (1985) Helou, G., Soifer, B. T., & Rowan-Robinson, M. 1985, 305, L15
- Helou (2000) Helou, G. 2000, in Les Houches Summer School, Vol 70, Infrared Space Astronomy: Today and Tomorrow, ed. F. Casoli, J. Lequex, & F. David (Springer, New York), p. 337
- Helou et al. (2000) Helou, G., Lu, N. Y., Werner M. W., Malhotra, S., & Silbermann, N. 2000, ApJ, 532L, 21
- Helou et al. (2004) Helou, G., Roussel, H., Appleton, P., et al. 2004, ApJS, 154, 253
- Hildebrand (1983) Hildebrand, R. H. 1983, QJRAS, 24, 267
- Hinz et al. (2006) Hinz, J. L., Misselt, K., Rieke, M. J., Rieke G. H., Smith, P. S., Blaylock, M., & Gordon, K. D. 2006, ApJ, 651, 874
- Hoeppe et al. (1994) Hoeppe, G., Brinks, E., Klein, U. et al. 1994, AJ, 108, 446
- Howell et al. (2007) Howell, J. H., Mazzarella, J. M., Chan, B., et al. 2007, in preparation
- Hunt et al. (2002) Hunt, L. K., Gio vandani, C., & Helou, G. 2002, A&A, 394, 873
- Hunter & Elmegreen (2004) Hunter, D. A., & Elmegreen, B. G. 2004, AJ, 128, 2870
- Impey & Bothun (1997) Impey, C. D., & Bothun, G. D. 1997, ARA&A, 35, 267
- Impey et al. (1996) Impey, C. D., Sprayberry, D., Irwin, M. J., & Bothun, G. D. 1996, ApJS, 105, 209
- Ishida (2004) Ishida, C. M. 2004, Ph.D. Thesis, University of Hawaii
- Jarrett et al. (2000) Jarrett, T. H., Chester, T., Cutri, R., Schneider, S., Skrutskie, M., & Huchra, J. P. 2000, AJ, 119, 2498
- Jura (1982) Jura, M. J. 1982, ApJ, 254, 70
- Jura et al. (1987) Jura, M. J., Kim, D. W., Knapp, G., & Guhathakurta, P. 1987, ApJ, 312, L11
- Kennicutt et al. (2003) Kennicutt, R. C., Jr., Armus, L., Bendo, G., et al. 2003, PASP, 115, 928
- Kennicutt (1998) Kennicutt, R. C., Jr. 1998, ApJ, 498, 541
- Kessler et al. (1996) Kessler, M. F., Steinz, J. A., Anderegg, M. E., et al. 1996, A&A, 315, L27
- Lacy et al. (2004) Lacy, M., Storrie-Lombardi, L. J., Sajina, A., et al. 2004, ApJS, 154, 166
- Latter (1991) Latter, W. B. 1991, ApJ, 377, 187
- Lonsdale & Helou (1987) Lonsdale, C. J. & Helou, G. 1987, ApJ, 314, 513
- Lu et al. (2003) Lu, N., Helou, G., Warner, M. W., et al. 2003, ApJ, 588, L199
- Matthews et al. (1999) Matthews, L. D., Gallagher, J. S., van Driel, W. 1999, AJ, 118, 2751
- Matthews et al. (2005) Matthews, L. D., Gao, Y., Uson, J. M., & Combes, F. 2005, ApJ, 129, 1849
- McGaugh (1994) McGaugh, S. S. 1994, ApJ, 426, 135
- McGaugh & Blok (1998) McGaugh, S. S., & de Blok, W. J. G. 1998, ApJ, 499, 41
- (57) McGaugh, S. S., Schombet, J., & Bothun, G. D. 1995a, ApJ, 109, 2019
- (58) McGaugh, S. S., Bothun, G. D., & Schombet, J. 1995b, ApJ, 110, 573
- Mihos et al. (1997) Mihos, J. C., McGaugh, S. S., & de Blok, W. J. G. 1997, ApJ, 477, L79
- Mezger et al. (1982) Mezger, P., Mathis, J., & Panagia, N. 1982, A&A, 105, 372
- Mould et al. (2000) Mould, J. R., Huchra, J. P., Freedman, W. L., et al. 2000, ApJ, 529, 786
- Neugebauer et al. (1984) Neugebauer, G., Habing, H. J., van Duinan, R., et al. 1984, ApJL, 278, L1
- O’Neil et al. (1997) O’Neil, K., Bothun, G. D., Schombert, J., Cornellm M. E., & Impey, C. D. 1997, AJ, 114, 2448
- O’Neil et al. (1998) O’Neil, K., Bothun, G. D., Impey, C. D., & McGaugh, S. S. 1998, AJ, 116, 657
- O’Neil & Schinnerer (2004) O’Neil, K., & Schinnerer, E. 2004, ApJL, 615, 109
- O’Neil et al. (2004) O’Neil, K., Bothun, G. D., van Driel, W., Monnier Ragaigne, D. 2004, A&A, 428, 823
- Pahre et al. (2004) Pahre, M. A., Ashby, M. L. N., Fazio, G. G., & Wilner, S. P. 2004, ApJS, 154, 229
- Pickering & van der Hulst (1999) Pickering, T. E., & van der Hulst, T. 1999, Bulletin of the American Astronomical Society, Vol. 31, p. 1525
- Puget & Leger (1989) Puget, J. L., & Leger, A. 1989, ARA&A, 27, 161
- Rahman et al. (2006) Rahman, N., Helou, G. & Mazzarella, J. M. 2006, ApJ, 653, 1068
- Reach et al. (2005) Reach, W. T., Megeath S. T., Cohen, M., et al. 2005, PASP, 117, 978
- Rice et al. (1990) Rice, W., Boulanger, F., Viallefond, F., Soifer, B. T., & Freedman, W. L. 1990, ApJ, 358, 418
- Richer & McCall (1995) Richer, M. G., & McCall, M. L. 1995, ApJ, 445, 642
- Rieke et al. (2004) Rieke, G. H., Young, E. T., Engelbracht C. W., et al. 2004, ApJS, 154, 25
- Rosenberg et al. (2006) Rosenberg, J. L., Ashby, M. L. N., Salzer, J. J., & Huang, J.-S., 2006, ApJ, 636, 742
- Sanders & Mirabel (1996) Sanders, D. B. & Mirabel, I. F. 1996, ARA&A, 34, 749
- Sauty et al. (2003) Sauty, S., Casoli, F., Boselli, A., et al. 2003, A&A, 411, 381
- Sauvage & Thuan (1992) Sauvage, M., & Thuan, T. 1992, ApJ, 396, L69
- Schombert (1998) Schombert, J. 1998, ApJ, 116, 1650
- Schombert et al. (1990) Schombert, J., Bothun, G. D., Impey, C. D. & Mundy L. G. 1990, AJ, 100, 1523
- Schombert et al. (1992) Schombert, J., Bothun, G. D., Schneider S. E., & McGaugh S. S. 1992, AJ, 103, 1107
- Scoville & Good (1989) Scoville, N. Z., & Good, J. C. 1989, ApJ, 339, 149
- Smith (1982) Smith, J. 1982, ApJ, 261, 463
- Smith et al. (1994) Smith, B., Harvey, P., Colome, C., et al. 1994, ApJ, 425, 1994
- Sprayberry et al. (1995) Sprayberry, D., Impey C. D., Bothun, G. D., & Irwin, M. J. 1995, ApJ, 109, 558
- Sprayberry et al. (1997) Sprayberry, D., Impey C. D., Irwin, M. J., & Bothun, G. D. 1997, ApJ, 482, 104
- Stern et al. (2005) Stern, D., Eisenhardt, P., Gorijan, V., et al. 2005, ApJ, 631, 163
- Vallenari et al. (2005) Vallenari, A., Schmidtobreick, L., & Bomans, D. J. 2005, A&A, 435, 821
- van den Hoek et al. (2000) van den Hoek, L. B., de Blok W. J. G., van der Hulst, J. M., & de Jong, T. 2000, A&A, 357, 2000
- Vazquez & Leitherer (2005) Vazquez, G. A., & Leitherer, C. 2005, ApJ, 621, 695
- Walterbos & Schwering (1987) Walterbos, R. A. M., & Schwering, P. B. W., 1987, A&A, 180, 27
- Warner et al. (2004) Werner, M., Roellig, T. L., Low, F. J., et al. 2004, ApJS, 154, 1
- Wu et al. (2006) Wu, Y., Charmandaris, V., Hao, L., Brandl, B. R., Bernard-Salas, J., Spoon, H. W. W., & Houck, J. R. 2006, ApJ, 639, 157
- Wynn-Williams & Becklin (1974) Wynn-Williams, C. G. & Becklin, E. 1974, PASP, 86, 5
- Zackrisson et al. (2005) Zackrisson, E., Bergvall, N., & Ostlin, G. 2005, A&A, 435, 29
| Source | Malin 1 | UGC 6614 | UGC 6879 | UGC 9024 | |||||
|---|---|---|---|---|---|---|---|---|---|
| (mJy) | (arcsec) | (mJy) | (arcsec) | (mJy) | (arcsec) | (mJy) | (arcsec) | ||
| 2MASS | 1.3 | 3.93 | 26.80 | 21.10 | 2.67 | ||||
| 2MASS | 1.7 | 3.41 | 35.50 | 40.90 | 3.62 | ||||
| 2MASS | 2.2 | 2.00 | 28.00 | 28.70 | 2.65 | ||||
| IRAC | 3.6 | 1.61 | 22.31 | 16.03 | 1.94 | ||||
| IRAC | 4.5 | 1.10 | 13.74 | 9.93 | 1.18 | ||||
| IRAC | 5.8 | 0.73 | 14.11 | 14.73 | 1.57 | ||||
| IRAC | 8 | 0.74 | 16.33 | 25.78 | 2.38 | ||||
| IRAS | 12 | – | – | 60 | – | 60 | – | – | – |
| MIPS | 24 | 0.57 | 22 | 28.35 | 1.00 | ||||
| IRAS | 25 | – | – | 170 | – | 330 | – | – | – |
| IRAS | 60 | – | – | 150 | – | 360 | – | – | – |
| MIPS | 70 | 5 | – | 147 | 447 | 98 | |||
| IRAS | 100 | – | – | 430 | – | 1080 | – | – | – |
| MIPS | 160 | 25 | – | 677 | 1529 | 268 | |||
Note. — The IRAC flux densities are aperture corrected. Malin 1 was undetected by the MIPS far-IR channels and hence the detection limits at 70 and 160 m are shown for the total integration time: 252 sec. at 70 m and 42 sec. at 160 m. In general, represents the radius of a circular aperture which is used to estimate the flux density. However, the 2MASS flux densities are given for “total” elliptical aperture radius in the archive (http://irsa.ipac.caltech.edu/applications/2MASS/PubGalPS) where elliptical radius represents the semi-major axis. UGC 6879 is edge-on and for this galaxy we use “effective radius”, defined by , where and are semi-major and minor axes.
| Property | Malin 1 | UGC 6614 | UGC | UGC 9024 | Reference |
|---|---|---|---|---|---|
| Type | S? | SAa | SABc | SAab | 1,2 |
| redshift, | 0.0834 | 0.0237 | 0.009 | 0.0088 | 1,2 |
| DA (Mpc) | 320.47 | 93.51 | 35.87 | 34.86 | 1,2 |
| inclination, | 16.1o | 34o | 90o | 32.2o | 1,2 |
| D25 (arcsec) | 16.15 | 75.54 | 87.75 | 104.26 | 1,2 |
| D (kpc) | 25.09 | 34.24 | 15.25 | 17.62 | 1,2 |
| (mag) | 17.92 | 14.12 | 13.40 | 17.11 | 1,2 |
| (mag) | -19.83 | -20.70 | -19.52 | -15.64 | 1,2 |
| (mag arcsec-2) | 26.50 | 24.50 | 20.40 | 24.71 | 4,5,6 |
| (kpc) | 73.3 | 16.00 | 2.50 | 7.47 | 4,5 |
| 8.66 | 7.35-9.16 | – | 7.98-8.35 | 3,9 | |
| 9.94 | 10.29 | 9.83 | 8.21 | 1,2,5 | |
| 10.66 | 10.42 | 9.08 | 9.40 | 5,7,8 | |
| – | 8.45 | – | – | 10 | |
| 8.14 | 8.42 | 7.81 | 6.94 | 11 | |
| 0.003 | 0.01 | 0.053 | 0.004 | 11 | |
| 9.49 | 9.72 | 9.05 | 7.90 | 11 | |
| 9.50 | 9.80 | 9.28 | 8.30 | 11 | |
| 0.35 | 0.27 | 0.17 | 0.49 | 11 | |
| SFR () | 0.38 | 0.88 | 0.20 | 0.01 | 11 |
| 0.07 | 0.20 | 0.93 | 0.03 | 11 |
Note. — ∗UGC 6879 is not strictly a LSB galaxy. Its central surface brightness
is intermediate between LSB and HSB galaxies.
We assume , , and km
sec-1 Mpc-1 to be consistent with the literature.
Notation:
DA is the angular diameter distance;
D25 is the -band 25 mag arcsec-2 isophotal diameter; D is the
physical diameter;
and , respectively, are -band apparent and absolute magnitude
corrected for Galactic extinction, internal extinction, and -correction;
is the -band central surface brightness; disk scale length
is in kpc;
the solar value of the oxygen abundance from
Asplund et al. (2004);
is neutral hydrogen mass; is molecular hydrogen mass;
is dust mass; the dust-to-gas ratio is ;
total IR luminosity is estimated from Calzetti et al. (2005);
total IR luminosity is estimated from the DH02 model fit;
star formation rate SFR is calculated from Alfonso-Herrero et al. (2006).
References:
1) LEDA;
2) NED;
3) McGaugh 1994;
4) Sprayberry et al. 1995;
5) Impey et al. 1996;
6) McGaugh & de Blok 1998;
7) Matthews et al. 2001;
8) Sauty et al. 2003;
9) de Naray et al. 2004;
10) Das et al. 2006;
11) This study.