Exploring the origins of perpendicular magnetic anisotropy in amorphous Tb-Co via changes in medium-range ordering
Abstract
Amorphous thin films of Tb17Co83 (a-Tb-Co) grown by magnetron co-sputtering exhibit changes in magnetic anisotropy with varying growth and annealing temperatures. The magnetic anisotropy constant increases with increasing growth temperature, which is reduced or vanishes upon annealing at temperatures above the growth temperature. The proposed explanation for this anisotropy in high orbital moment Tb-based transition metal alloys is an amorphous phase texturing with preferential in-plane and out-of-plane local bonding configurations for the rare-earth and transition metal atoms. Scanning nanodiffraction performed in a transmission electron microscope (TEM) is applied to a-Tb17Co83 films deposited over a range of temperatures to measure relative changes in medium-range ordering (MRO). These measurements reveal an increase in MRO with higher growth temperatures and a decrease in MRO with higher annealing temperatures. The trend in MRO indicates a relationship between the magnetic anisotropy and local atomic ordering. Tilting select films the TEM measures variations in the local atomic structure a function of orientation within the films. The findings support claims that preferential ordering along the growth direction results from temperature-mediated adatom configurations during deposition, and that oriented MRO correlates with the larger anisotropy constants.
Introduction
Amorphous rare earth – transition metal (RE-TM) alloys have tunable magnetic properties, such as compensation temperature and perpendicular magnetic anisotropy (PMA) Ding and Poon (2013); Andreenko and Nikitin (1997); Hasegawa et al. (1974); Hellman and Gyorgy (1992); Gambino (1998); Harris et al. (1994, 1993). These properties make them desirable as novel spintronic materials and for ultrafast magneto-optical recording devices. For REs with non-zero total orbital angular momentum, such as Tb, their magnetic anisotropy is believed to originate from the single ion anisotropy of the RE atoms as well as complex pair-bonding and preferential atomic configurations induced during film growth and subsequent thermal treatments Hellman and Gyorgy (1992). Out-of-plane (OOP) RE-TM bonding and in-plane (IP) TM-TM bonding have been correlated to bulk perpendicular magnetic anisotropy (PMA) in a-RE-TM systems Hellman and Gyorgy (1992); Harris et al. (1993, 1994). The amorphous nature of these systems complicates their analysis, as variations in magnetic anisotropy must instead be attributed to subtle variations in local atomic ordering Cochrane et al. (1978). Previous work shows that PMA is independent of film thickness, surface layer magnetic interactions, and macroscopic growth-induced strain Hellman and Gyorgy (1992).
The succinct description of crystalline structures with defined unit cells and permitted symmetry operations does not extend to amorphous materials. Their lack of translational and rotational symmetry requires a statistical approach for analysis Voyles and Muller (2002); Treacy et al. (2005). Two-body and multi-body distribution functions are applied to the study of amorphous structures to determine the probability that two or more atoms will be separated by a specific distance. Short-range ordering (SRO) is probed through two-body statistical analysis, such as radial distribution functions. However, SRO is limited to the first coordination shell of the constituent atom. Looking out a little further, medium-range ordering (MRO) on the 1 – 5 nm length scale, can be probed with transmission electron microscopy (TEM) Williamson (1995); Voyles and Muller (2002). Statistical analysis of MRO can determine the degree and type of ordering that exists between the extremes of long-range and short-range order Nakhmanson et al. (2001); Treacy et al. (2005).
In this work, a-Tb17Co83 is used as a representative a-RE-TM system. Tb (RE) atoms have more than half-filled 4f-electron orbitals and magnetic moments that align antiferromagnetically to the moments of the Co (TM) atoms Hansen (1991). The Curie temperature (TC), saturation moment, and compensation temperature (Tcomp) are solely dependent on composition, while PMA and coercivity depend as well on growth temperature, and other deposition parameters Hellman and Gyorgy (1992); Hasegawa et al. (1974). A series of a-Tb17Co83 films were deposited at 20∘C, 200∘C, and 300∘C. The films then either received no further heat treatment or were annealed at 200∘C or 300∘C. IP and OOP magnetization vs magnetic field measurements were collected from the films. Congruent with previous studies, the PMA was found to increase with growth temperature and decrease with annealing temperatureMergel et al. (1993); Hasegawa et al. (1974); Ceballos et al. (2021); Hellman and Gyorgy (1992). The TEM method of scanning nanodiffraction was used to probe the underlying structural mechanisms responsible for variations in the magnetic properties of a-Tb17Co83 as a function of film deposition and annealing temperature. The relative MRO across the series of samples is measured with fluctuation electron microscopy (FEM), a specialized application of scanning nanodiffraction that is sensitive to changes in diffracted intensity related to variations in atomic configurations within an amorphous system Voyles and Muller (2002). We determine that MRO in the films increases with higher deposition temperatures and decreases with higher annealing temperatures. The results support the model of magnetism in a-RE-TM systems in which PMA is related to atom-specific preferential local atomic ordering.
Experimental Details
a-Tb17Co83 films were produced using magnetron co-sputtering at 1.8 mTorr Ar pressure from separate Tb and Co targets. The base pressure of the chamber was 7 x 10⁻⁸ Torr. The a-Tb17Co83 films were sputtered at room temperature (20∘C), 200∘C, and 300∘C with a capping layer of a-SiNx sputtered at 3.0 mTorr of Ar pressure. The films were deposited on Norcada grids with 10 nm thick a-SiNx membranes. Samples consisted of 30 nm a-Tb17Co83 films capped with 10 nm of a-SiNx to prevent oxidation. The 30 nm thickness was selected for the a-Tb17Co83, as it was experimentally determined to produce a strong speckle intensity in scanning nanodiffraction. A control sample of 10 nm of a-SiNx was sputtered at 3.0 mTorr of Ar pressure to determine the influence of the capping layer on the diffraction data. After deposition at 20∘C, some films were annealed at 200∘C or 300∘C for an hour under high vacuum.
The magnetization as a function of applied magnetic field IP and OOP was measured in a Quantum Design Magnetic Properties Measurement System (MPMS) at 20∘C for a series of samples grown and annealed under identical conditions to those detailed above (Supplemental Materials). The films grown at 20∘C were annealed for an hour at 150∘C, 200∘C, 275∘C, and 350∘C to establish how magnetic anisotropy depends on annealing temperature. The applied field was varied between - 1 and 1 T, a range exceeding the magnetic saturation values for all samples. The intrinsic uniaxial anisotropy constant, Kui, is calculated using the relation below, where Ms is the saturation magnetization and Hk is the anisotropy field required to fully magnetize the films IP.Hellman et al. (1999); Ceballos et al. (2021)
| (1) |
For all samples, Tc = 190∘C, Tcomp = -73∘C, and Ms is approximately 150 emu/cc. All samples exhibited uniaxial PMA.
A subset of the films measured with magnetometry were analyzed using FEM. To measure changes in the MRO of the ferrimagnetic films, FEM experiments were carried out using scanning transmission electron microscopy (STEM) in an FEI TitanX operated at an accelerating voltage of 200 kV and a 2.2 nm diameter probe. Scanning nanodiffraction acquisition parameters are detailed in the Supplemental Materials. Additionally, the films deposited at 20∘C and 300∘C were tilted at an angle varied between 0∘ and 40∘ in 5∘ increments to determine whether MRO varies with orientation through the film. These two films were selected for tilting because they had the greatest difference in MRO as determined from FEM variance measurements.
FEM analysis was performed following the method outlined by Kennedy et al.Kennedy et al. (2020) Custom scripts were used to fit the radial profiles of the scanning nanodiffraction data using least squares fitting of the first diffracted ring as described by Gammer et al. Gammer et al. (2018) The fitting parameters are used to correct for any ellipticity in the patterns before calculating the variance in intensity as a function of scattering vector. For patterns collected from tilted films, the ellipticity is not corrected. Instead, changes in the major elliptical axes are used as a measure of relative changes in mean bond lengths. The procedure for collecting scanning nanodiffraction data and FEM analysis is outlined in the Supplemental Materials. For FEM, the variance is calculated with respect to scattering angle k, position on the sample r, and resolution (which is a function of r); however, in STEM FEM only the scattering vector varies and thus the equation for variance Vσ in diffracted intensity I becomesTreacy et al. (2005):
| (2) |
Additionally, Lorentz TEM images were collected from the as-deposited film grown at 20∘C and the film grown at 20∘C and annealed at 200∘C and 300∘C to probe the effect of annealing on domain structure. Lorentz TEM was carried out in a FEI ThemIS operated at 300 kV in Lorentz mode. All films had been previously subjected to a magnetic field of approximately 2 T during FEM image acquisition, but the magnetic field of the objective lens was minimized to less that 0.1 T for Lorentz imaging. The films were tilted 15∘ and the beam was defocused to produce visible magnetic domains.
Results
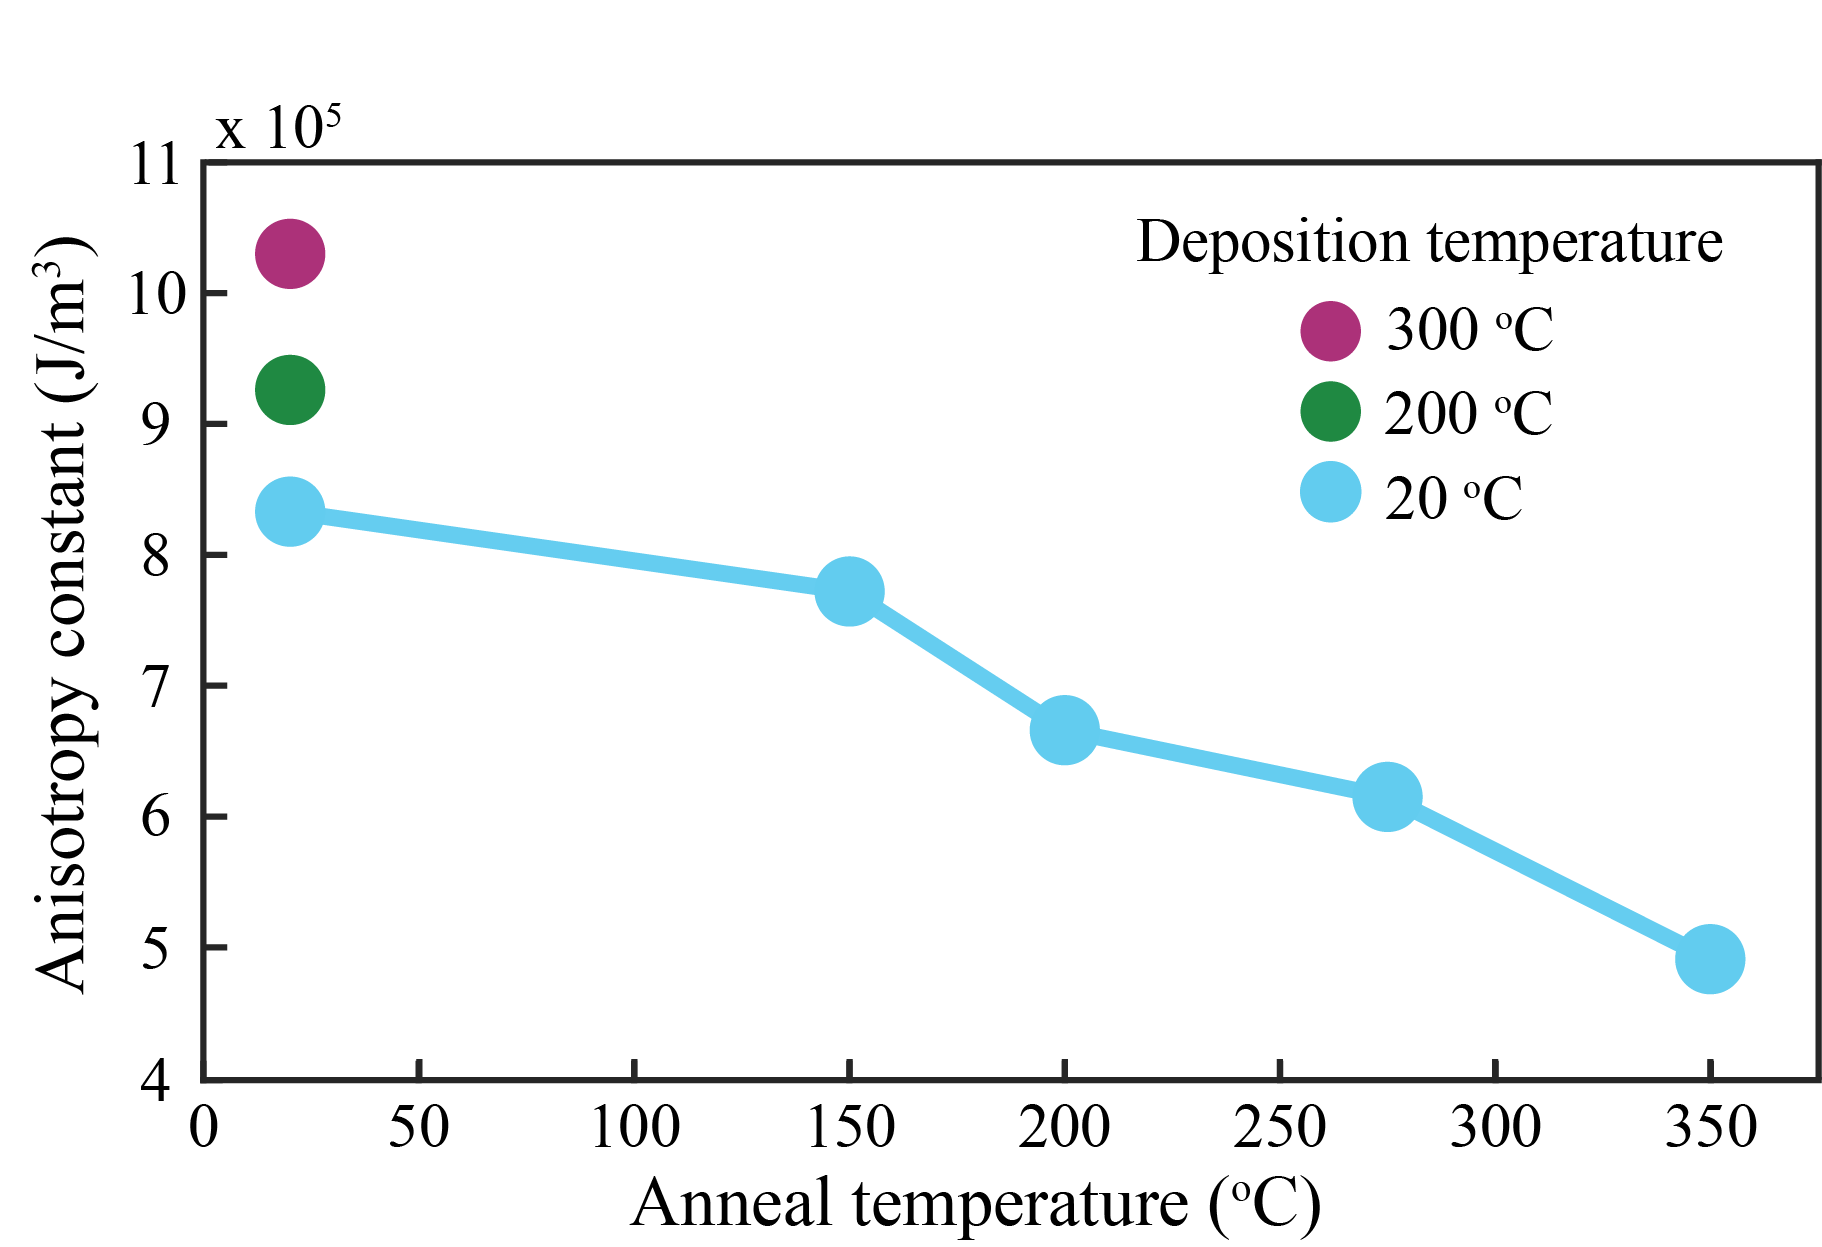
The magnetic anisotropy constant is 8.33 x 10⁵ J/m3 for films grown at 20∘C, and increases to 9.26 x 10⁵ J/m3 for films grown at 200∘C and to 10.30 x 10⁵ J/m3 for films grown at 300∘C. For films grown at 20∘C and subsequently annealed at temperatures between 150∘C and 350∘C, the magnetic anisotropy decreases with temperature. The relationships between deposition temperature, annealing temperature, and magnetic anisotropy are shown in Fig. 1. Similar trends have been shown in other amorphous RE-TM thin film systems Harris et al. (1994). The OOP magnetic saturation remains constant (150 emu/cc) for all samples in the series.
High resolution TEM imaging and the mean converged beam electron diffraction (CBED) patterns confirm that the samples are amorphous (shown in Supplemental Materials). The uniformity of the diffracted speckle in the scanning nanodiffraction patterns and lack of strong Bragg scattering indicates that the films lack long range order and have no nanocrystals.
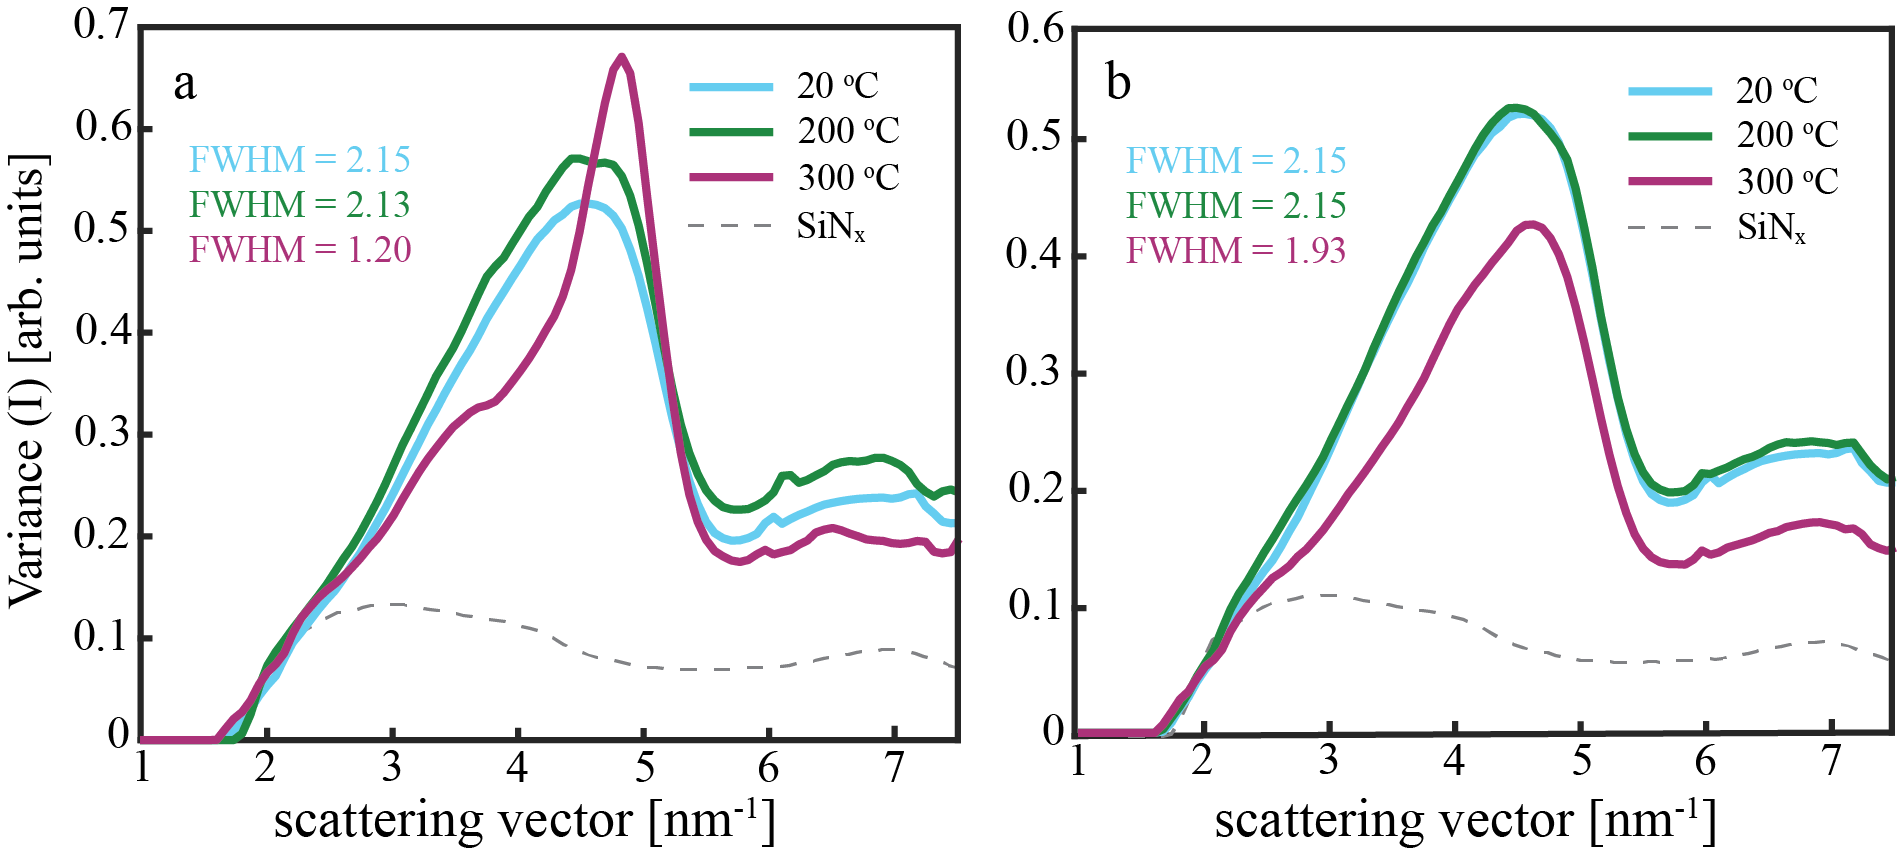
In Fig. 2, the normalized variance in intensity V(k) for films in their as-deposited state (a) and after annealing (b) is plotted as a function of scattering vector using mean statistics. The MRO increases with increasing growth temperature, as indicated by an increase in V(k). The variance for the 300∘C growth is significantly sharper than the 20∘C and 200∘C variances. There is an increase in the V(k) and a decrease in the full width at half maximum (FWHM) across the three films as a function of deposition temperature.
| Temperature parameters | Relative Height111The peak height of the film grown at 20∘C is used as the reference. Other peak heights are given relative to it. | Position (nm-1) |
|---|---|---|
| 20∘C deposition | 1 | 4.5 |
| 200∘C deposition | 1.10 | 4.5 to 4.7 |
| 300∘C deposition | 1.23 | 4.8 |
| 20∘C deposition, 200∘C anneal | 1.01 | 4.5 |
| 20∘C deposition, 300∘C anneal | 0.81 | 4.6 |
The peak heights correspond to relative MRO and the peak positions correspond to the mean interatomic distance of the MRO. The peaks in V(k) are typically attributable to oriented clusters of atoms (MRO) and not to individual bond types (SRO) Voyles and Muller (2002); Li et al. (2014). Two main peak features emerge in the variance plots in Fig. 2. The first peak is centered around 2.4 nm-1 and is attributable to a-SiNx, as confirmed through FEM analysis of 10 nm of a-SiNx deposited onto a-SiNx membranes. The second peak is centered between 4.5 and 3.3 nm-1 and originates from the a-Tb17Co83. The peak positions of the a-Tb17Co83 growth series shift to larger k values with increasing deposition temperature. The change in the magnitude of the a-Tb17Co83 peak variance relates to degree of MRO in the films. Peak positions and relative heights are provided in Table 1.
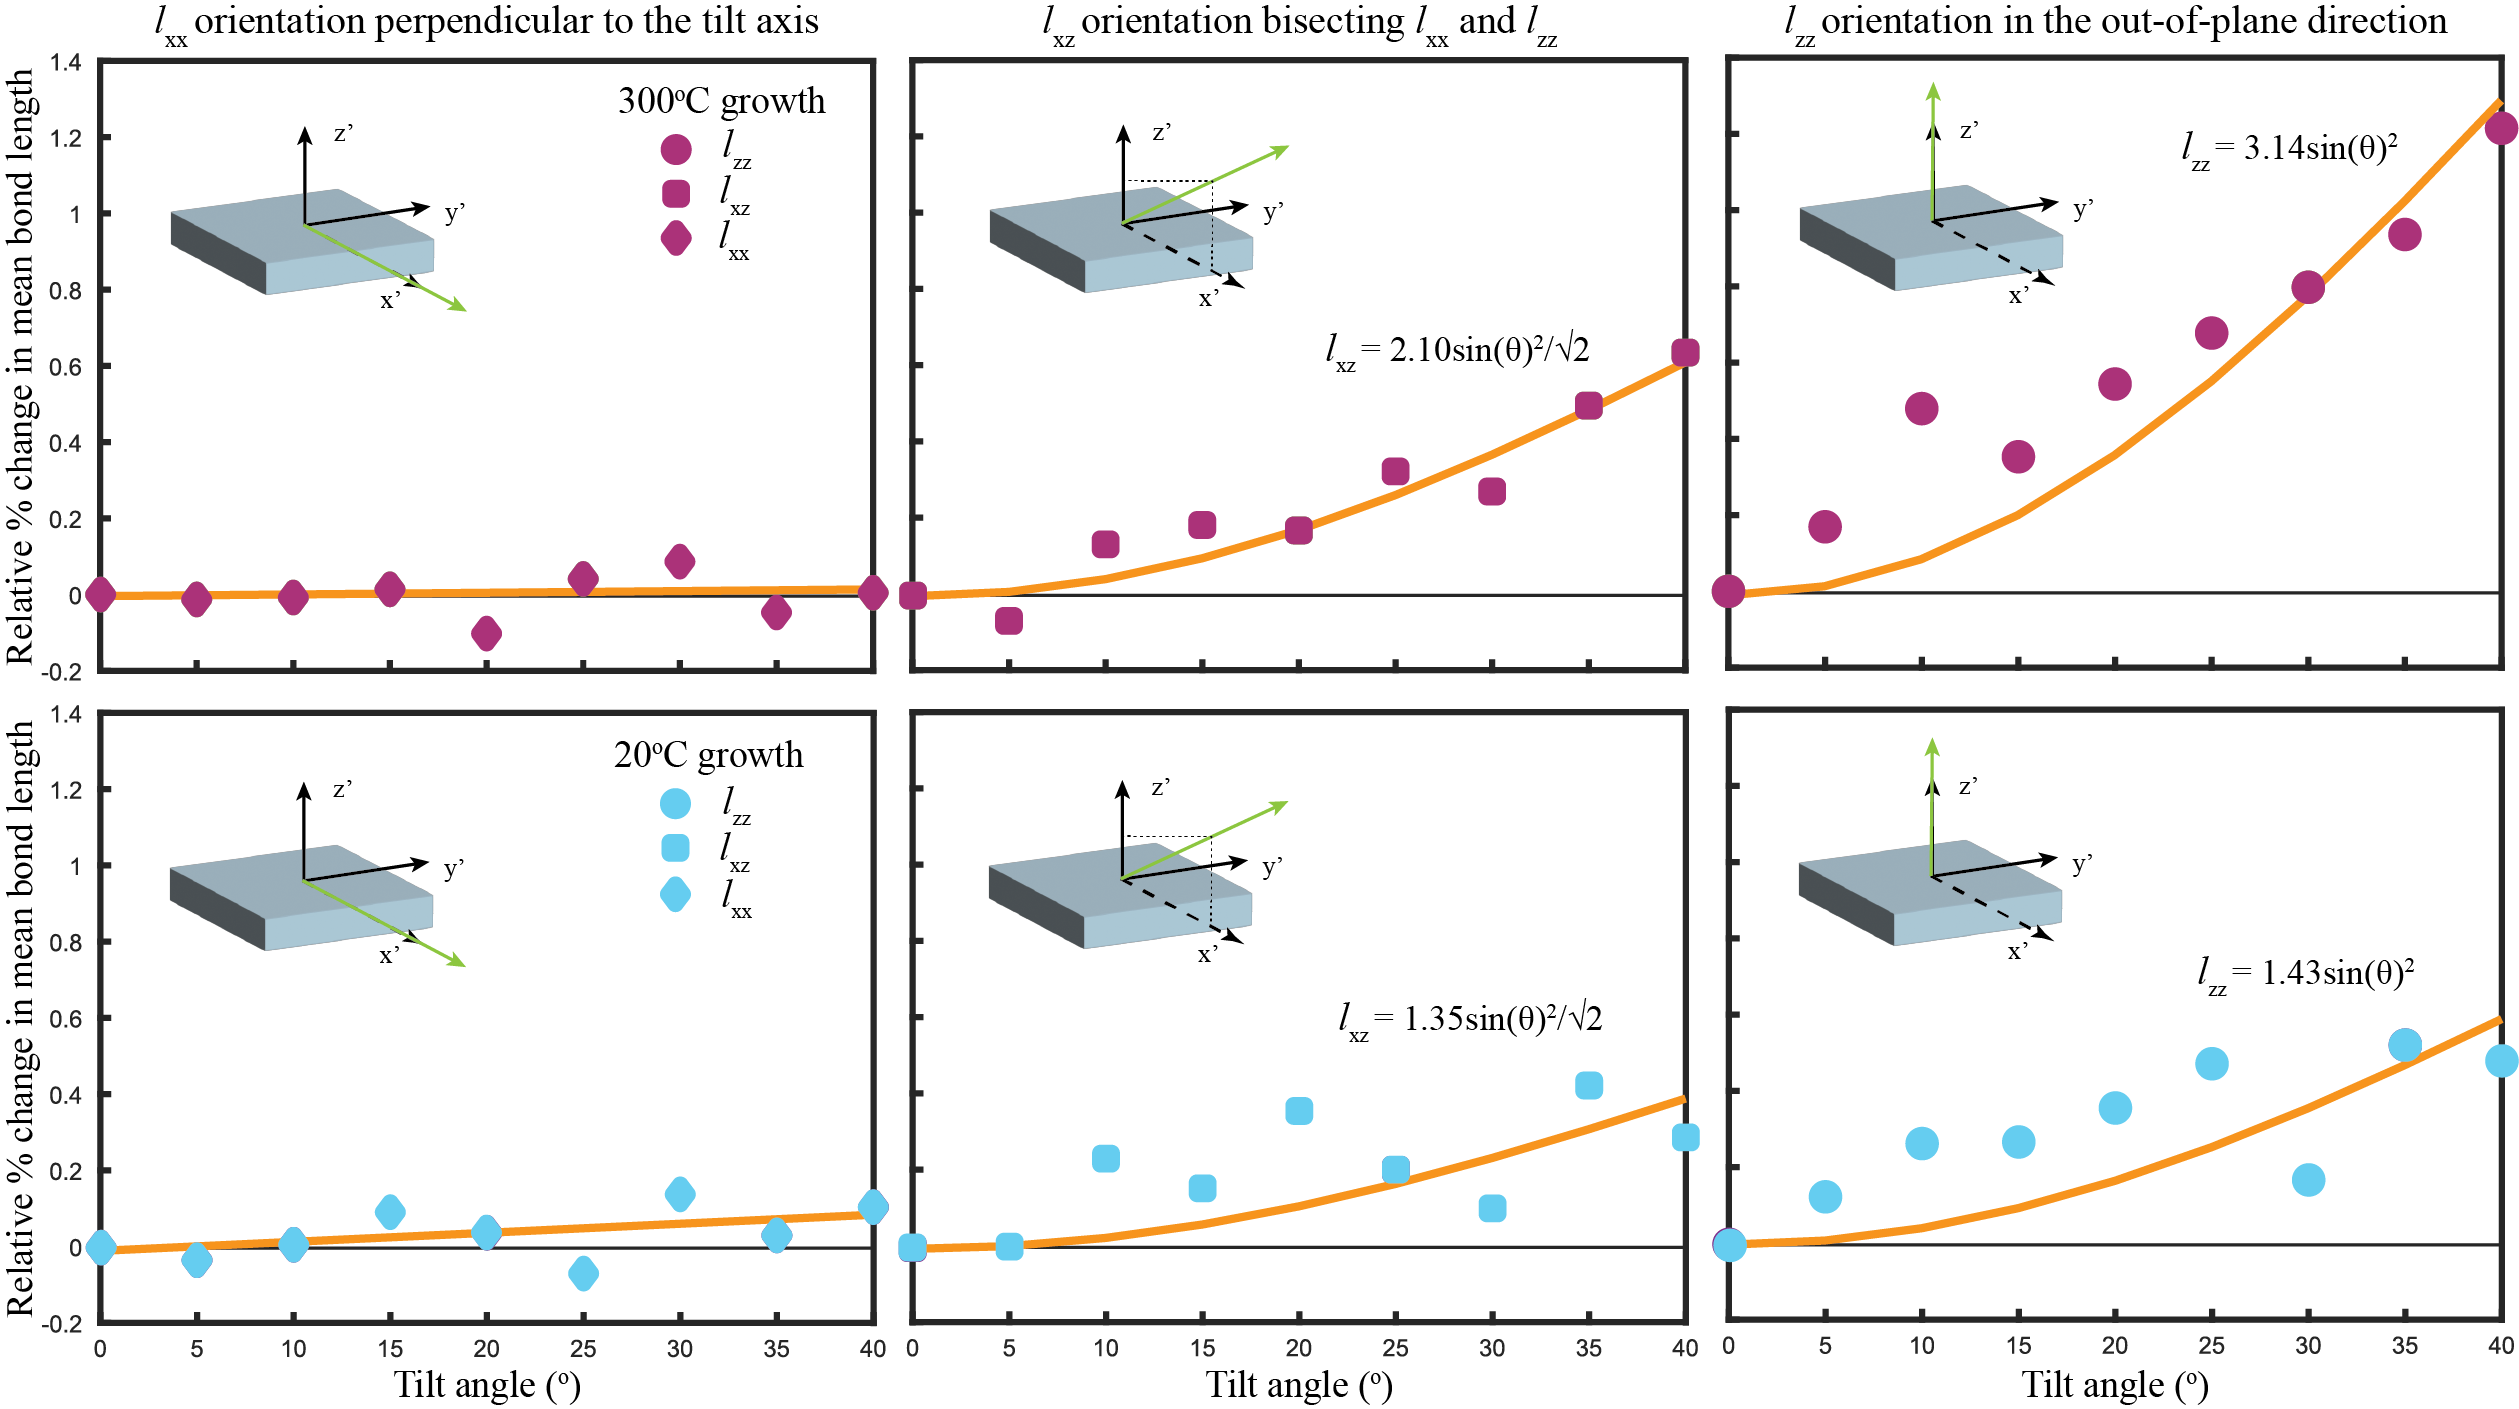
The FEM diffracted signal varies slightly as a function of orientation through the individual films, as shown in Fig. 3, suggesting directional dependency in bonding structure. The most significant difference in MRO as a function of tilt angle was observed between the films grown at 20∘C and 300∘C. These films were tilted in the TEM to 40∘C to check for directional dependency of the MRO. Changes in the ellipticity of the FEM patterns as a function of tilt angle reveal that the films deposited at 300∘C exhibit a greater change in the length of their major axes, compared to the major axes of the films grown at 20∘C. The mean bond length of both films decreases as a function of orientation away from the film normals. The decrease is more pronounced for the film deposited at 300∘C, indicating greater orientation-dependency of the MRO bond lengths. By assigning the changes in the FEM diffraction rings to changes in bond length in the IP and OOP directions, we can analyze the tilted data using strain relationships (Supplemental Materials). From this, we determine that the maximum change in mean bond length is 1.43% for the film deposited at 20∘C and 3.14% for the film deposited at 300∘C. These values assume the trend continues past the 40∘C tilt angle, to the OOP orientation. This implies that the films grown at 300∘C have greater directional dependence of interatomic ordering.
Discussion
Many models have been proposed for the origin of PMA in amorphous RE-TM thin films. Postulations include the formation of columnar microstructures, anelastic strains, surface layer anisotropy, growth-induced anisotropy resulting from magnetic interactions, microlite formation, and temperature-mediated subtle alignments of atoms around the RE atoms Leamy and Dirks (1978); Dirks and Gijsbers (1979); Yan et al. (1991); Fu and Mansuripur (1992); Clark (1973); Hellman and Gyorgy (1992). The mechanism described in the latter of these models is commonly referred to as amorphous phase texturing Hellman and Gyorgy (1992). Many of these models have been disproven by varying growth parameters and measuring the resulting variations in PMA. This work supports the model of texturing in which local adatom configurations arrange themselves to minimize surface energy during the deposition process.
In a-Tb17Co83, the itinerant 3d-electrons of Co influence the magnetic ordering of the localized 4f-electrons of Tb (RE) through an antiferromagnetic exchange interaction Brooks et al. (1989). The magnetic moments of the Tb 4f-electron orbitals, which are more than half-filled, align antiferromagnetically to the moments of the Co (TM) atoms. The combined effect of the resulting negative exchange together with local uniaxial anisotropy, which acts primarily on the Tb moments, is to produce non-colinear ferrimagnetism that is Co-dominant above Tcomp and Tb-dominant below Tcomp Vas’kovskiy et al. (2015); Finley and Liu (2016). a-Tb17Co83 has a Tcomp of approximately -73∘C, making it Co-dominant at 20∘C. The Curie temperature (TC) of a-Tb17Co83 is approximately 190∘C. The PMA increases with increasing growth temperature in the a-Tb17Co83 system, including for films grown above TC Hansen (1988). The same trend has been independently observed in other amorphous RE-TM systems Andreenko and Nikitin (1997); Hellman and Gyorgy (1992); Hajjar et al. (1990); Kobayashi et al. (1983); Zhang et al. (2010).
There is an inverse trend between PMA and annealing temperature. Similarly, as the annealing temperature increases, the MRO decreases, as shown in Fig. 2 and summarized in Table 1. Thus, increased deposition temperature increases MRO and PMA, while increased annealing temperature reduces MRO and PMA in a-Tb17Co83. The V(k) curves for the 20∘C growth and the film annealed at 200∘C are similar with nearly identical FWHM, position, and relative height. The similarity suggests that there is a minimum temperature required for MRO atomic rearrangement during annealing. Overcoming the energy barrier for atomic re-orientation detectable with FEM requires a long enough anneal time and high enough temperature. At 300∘C for one hour, the annealing parameters are sufficient to allow energy-minimizing atomic rearrangement in the bulk of the film.
Above TC, the system is paramagnetic and atomic interactions are not governed by magnetic interactions. Thus, the trend in MRO for the a-Tb17Co83 growth series cannot be ascribed to magnetic interactions. Instead, the relationship between MRO and growth temperature-mediated PMA supports models in which local adatom configurations arrange such that they minimize the surface energy during growth Hellman (1994). As layers build, the preferential configuration is preserved, leading to oriented local magnetic anisotropy that produces an overall macroscopic PMA.
The films grown at 20∘C and 300∘C were selected for tilted FEM analysis to understand the relationship between temperature-mediated atomic texturing during deposition and orientationally anisotropic MRO Kennedy et al. (2020). In this measurement, FEM data is acquired at varying stage tilt angles, which enables us to deduce the relative change in bond lengths associated with the MRO in the IP and OOP directions. Because the diffraction patterns contain information about d-spacings perpendicular to the direction of the beam, as the effective angle between the beam and the sample is varied, any changes in bond length between the IP and OOP directions in the film will cause an ellipticity in diffraction pattern (Supplemental Materials). This effect is similar to ellipticity in diffraction data caused by anisotropic strain, although in our case, decoupling the influences of strain and changes in preferential atomic orientations is not possible. For this reason, we consider changes in the major axis of the fitted ellipse to correspond broadly to changes in the average bond length, , as a function of orientation through the film. lxx is along the x-axis, lzz in the y-z plane along the z’-axis, and lxx bisects the x’ and z’ directions.
The stage tilt is limited to 40∘ in the TitanX, but the OOP bond length can be extrapolated from measurements at lower angles by considering the geometry of the experiment and the influence of infinitesimal shifts in bond length on the diffraction data, which gives a dependence to the projected OOP bond length. As shown in Fig. 3, lxx is modeled with a linear fit and lxz is modeled with a dependence. The geometric origins of these terms are illustrated in the Supplemental Materials.
Fig. 3 shows the trend in average relative % change in mean bond length as a function of tilt angle for the films grown at 20∘C and 300∘C. Relative % change below the margin of error indicates that the films are isotropic within the limit of the technique. Above this margin of error, the films exhibit changes in relative mean bond distances dependent on orientation through the films.
From the lzz fits, the extrapolated maximum bond lengths are calculated. For the film deposited at 20∘C, the extrapolated maximum relative % change in mean bond length is 1.4%. For the film deposited at 300∘C, the extrapolated maximum relative % change in mean bond length is 4.5%. These values are determined by extending the fitting curves to a theoretical 90∘ tilt. Both films exhibit shorter mean bond lengths in the IP direction compared to the OOP direction. The IP bond lengths in the film grown at 300∘C are larger, on average, than the bonds in the OOP orientation. Assuming the texturing model for PMA, this corresponds to a greater proportion of Co-Tb bonds in the OOP orientation relative to Co-Co bonds in the IP orientations. The greater relative % change in mean bond length for 300∘C indicates that at higher deposition temperatures adatoms with higher energies at impingement orient such that Co-Tb bonds form preferentially in the OOP direction, consistent with EXAFS data on a-Tb-Fe filmsHarris et al. (1992, 1993).
The dramatic decrease in PMA observed between the film grown at 20∘C and the films annealed at higher temperatures and the corresponding change in MRO prompted the use of Lorentz TEM. The Lorentz images, shown in Supplemental Materials, show the typical high-contrast domain patterns seen in films with strong PMA and corroborate the trends observed in variance and magnetization for a-Tb17Co83 annealed at increasing temperatures Hellman et al. (1999). Higher PMA causes a high energy cost of forming domain walls and narrower domain walls, with well defined domains, while lower PMA causes wider domain walls and less defined domains. The result is sharper domain walls and better defined domains in films deposited at higher temperatures, and less defined domains in films grown at lower temperatures after annealing.
The changes in mean bond length with varying orientation through the films, the increase in MRO as the deposition temperature increases, and the subsequent decrease in MRO after annealing, collectively indicate the presence of MRO bond length anisotropy in the a-Tb17Co83 films. During deposition, structural variations are introduced as a function of growth temperature. A higher deposition temperature favors a higher proportion of Tb-Co bonds in the OOP direction, which results in greater MRO and increased PMA. Annealing, on the other hand, allows for structural relaxation in the films, and atom rearrangement. Taken together, the observed trends in MRO with respect to growth conditions suggest that the evolution of PMA in the films is due to structural changes.
Conclusions
Numerous studies on amorphous RE-TM films have noted the relationships between growth temperature parameters and PMA, but the structural origin remains under debate. This work established a relationship between thermal growth parameters, PMA, and local atomic ordering using the TEM technique of scanning nanodiffraction. MRO increases with increasing film deposition temperature and decreases with increasing anneal temperature. Thus, there is a correlation between the degree of MRO and PMA in a-Tb17Co83 films grown via magnetron co-sputtering. These results support an amorphous phase texturing model in which adatom configuration varies as a function of deposition temperature and annealing allows for subsequent relaxations of preferential configurations within the films. Tb-Co (RE-TM) pairs prefer to form vertically during deposition, but annealing allows for rearrangement of atomic pairs such that there is greater uniformity across orientations. Analysis of tilted FEM data shows a greater local ordering anisotropy in the film exhibiting the highest degree of MRO (300 ∘C growth) compared to the the film grown at 20∘C with less MRO.
Acknowledgements.
This work was supported by National Science Foundation STROBE grant DMR-1548924. Work at the Molecular Foundry was supported by the Office of Science, Office of Basic Energy Sciences, of the U.S. Department of Energy under Contract No. DE-AC02-05CH11231. Growth and non-electron microscopy characterization of experimental a-Tb17Co83 and a-SiNx were performed by D.O. and E.H. and supported by the U.S. Department of Energy, Office of Science, Basic Energy Sciences, Materials Sciences and Engineering Division under Contract No. DE-AC02-05-CH11231, under the Nonequilibrium Magnetic Materials Program (KC2204). C.O. acknowledges support from the US Department of Energy Early Career Research Program.Data Availability Statement
The data that support the findings of this study are available from the corresponding author, M.C.S., upon reasonable request. The scripts used to process the FEM data are available at https://github.com/ScottLabUCB/FEM.
References
- Ding and Poon (2013) M. Ding and S. J. Poon, Journal of Magnetism and Magnetic Materials 339, 51 (2013).
- Andreenko and Nikitin (1997) A. S. Andreenko and S. A. Nikitin, Physics-Uspekhi 40, 581 (1997), publisher: IOP Publishing.
- Hasegawa et al. (1974) R. Hasegawa, R. J. Gambino, J. J. Cuomo, and J. F. Ziegler, Journal of Applied Physics 45, 4036 (1974), publisher: American Institute of Physics.
- Hellman and Gyorgy (1992) F. Hellman and E. M. Gyorgy, Physical Review Letters 68, 1391 (1992), publisher: American Physical Society.
- Gambino (1998) R. J. Gambino, MRS Online Proceedings Library 517, 555 (1998).
- Harris et al. (1994) V. G. Harris, W. T. Elam, N. C. Koon, and F. Hellman, Physical Review B 49, 3637 (1994), publisher: American Physical Society.
- Harris et al. (1993) V. G. Harris, F. Hellman, W. T. Elam, and N. C. Koon, Journal of Applied Physics 73, 5785 (1993), publisher: American Institute of Physics.
- Cochrane et al. (1978) R. W. Cochrane, R. Harris, and M. J. Zuckermann, Physics Reports 48, 1 (1978).
- Voyles and Muller (2002) P. M. Voyles and D. A. Muller, Ultramicroscopy 93, 147 (2002).
- Treacy et al. (2005) M. M. J. Treacy, J. M. Gibson, L. Fan, D. J. Paterson, and I. McNulty, Reports on Progress in Physics 68, 2899 (2005).
- Williamson (1995) D. L. Williamson, MRS Online Proceedings Library 377, 251 (1995).
- Nakhmanson et al. (2001) S. M. Nakhmanson, P. M. Voyles, N. Mousseau, G. T. Barkema, and D. A. Drabold, Physical Review B 63, 235207 (2001), publisher: American Physical Society.
- Hansen (1991) P. Hansen, in Handbook of Magnetic Materials, Vol. 6 (Elsevier, 1991) pp. 289–452.
- Mergel et al. (1993) D. Mergel, H. Heitmann, and P. Hansen, Physical Review B 47, 882 (1993), publisher: American Physical Society.
- Ceballos et al. (2021) A. Ceballos, A. Pattabi, A. El-Ghazaly, S. Ruta, C. P. Simon, R. F. L. Evans, T. Ostler, R. W. Chantrell, E. Kennedy, M. Scott, J. Bokor, and F. Hellman, Physical Review B 103, 024438 (2021), publisher: American Physical Society.
- Hellman et al. (1999) F. Hellman, A. L. Shapiro, E. N. Abarra, P. W. Rooney, and M. Q. Tran, Journal of the Magnetics Society of Japan 23, S1_79 (1999).
- Kennedy et al. (2020) E. Kennedy, N. Reynolds, L. Rangel DaCosta, F. Hellman, C. Ophus, and M. C. Scott, Applied Physics Letters 117, 091903 (2020), publisher: American Institute of Physics.
- Gammer et al. (2018) C. Gammer, C. Ophus, T. C. Pekin, J. Eckert, and A. M. Minor, Applied Physics Letters 112, 171905 (2018), publisher: American Institute of Physics.
- Li et al. (2014) T. T. Li, S. N. Bogle, and J. R. Abelson, Microscopy and Microanalysis 20, 1605 (2014).
- Leamy and Dirks (1978) H. J. Leamy and A. G. Dirks, Journal of Applied Physics 49, 3430 (1978), publisher: American Institute of Physics.
- Dirks and Gijsbers (1979) A. G. Dirks and J. R. M. Gijsbers, Thin Solid Films 58, 333 (1979).
- Yan et al. (1991) X. Yan, M. Hirscher, T. Egami, and E. E. Marinero, Physical Review B 43, 9300 (1991), publisher: American Physical Society.
- Fu and Mansuripur (1992) H. Fu and M. Mansuripur, Physical Review B 45, 7188 (1992), publisher: American Physical Society.
- Clark (1973) A. E. Clark, Applied Physics Letters 23, 642 (1973), publisher: American Institute of Physics.
- Brooks et al. (1989) M. S. S. Brooks, O. Eriksson, and B. Johansson, Journal of Physics: Condensed Matter 1, 5861 (1989).
- Vas’kovskiy et al. (2015) V. O. Vas’kovskiy, O. A. Adanakova, K. G. Balymov, N. A. Kulesh, A. V. Svalov, and E. A. Stepanova, Physics of the Solid State 57, 1142 (2015).
- Finley and Liu (2016) J. Finley and L. Liu, Physical Review Applied 6, 054001 (2016), publisher: American Physical Society.
- Hansen (1988) P. Hansen, Journal of Applied Physics 63, 2364 (1988), publisher: American Institute of Physics.
- Hajjar et al. (1990) R. A. Hajjar, F. L. Zhou, and M. Mansuripur, Journal of Applied Physics 67, 5328 (1990), publisher: American Institute of Physics.
- Kobayashi et al. (1983) H. Kobayashi, T. Ono, A. Tsushima, and T. Suzuki, Applied Physics Letters 43, 389 (1983), publisher: American Institute of Physics.
- Zhang et al. (2010) W. Y. Zhang, H. Shima, F. Takano, M. Takenaka, M. Yamazaki, K. Masuda, H. Akinaga, T. Nagahama, and S. Nimori, Journal of Magnetism and Magnetic Materials 322, 900 (2010).
- Hellman (1994) F. Hellman, Applied Physics Letters 64, 1947 (1994), publisher: American Institute of Physics.
- Harris et al. (1992) V. G. Harris, K. D. Aylesworth, B. N. Das, W. T. Elam, and N. C. Koon, Physical Review Letters 69, 1939 (1992), publisher: American Physical Society.