∎
CEREMADE, CNRS, UMR 7534, 75016 Paris, France
33email: chenda@ceremade.dauphine.fr
33email: cohen@ceremade.dauphine.fr
Fast Asymmetric Fronts Propagation for Image Segmentation
Abstract
In this paper, we introduce a generalized asymmetric fronts propagation model based on the geodesic distance maps and the Eikonal partial differential equations. One of the key ingredients for the computation of the geodesic distance map is the geodesic metric, which can govern the action of the geodesic distance level set propagation. We consider a Finsler metric with the Randers form, through which the asymmetry and anisotropy enhancements can be taken into account to prevent the fronts leaking problem during the fronts propagation. These enhancements can be derived from the image edge-dependent vector field such as the gradient vector flow. The numerical implementations are carried out by the Finsler variant of the fast marching method, leading to very efficient interactive segmentation schemes. We apply the proposed Finsler fronts propagation model to image segmentation applications. Specifically, the foreground and background segmentation is implemented by the Voronoi index map. In addition, for the application of tubularity segmentation, we exploit the level set lines of the geodesic distance map associated to the proposed Finsler metric providing that a thresholding value is given.
Keywords:
Finsler Metric Randers Metric Eikonal Partial Differential Equation Fast Marching Method Image Segmentation Tubular Structure Segmentation1 Introduction
Fronts propagation models have been considerably developed for the applications of image segmentation and boundary detection since the original level set framework proposed by Osher and Sethian osher1988fronts . Guaranteed by their solid mathematical background, the fronts propagation models lead to strong abilities in a wide variety of computer vision tasks such as image segmentation and boundary detection caselles1993geometric ; malladi1995shape ; caselles1997geodesic ; yezzi1997geometric . In their basic formulation, the boundaries of an object are modeled as closed contours, each of which can be obtained by evolving an initial closed curve in terms of a speed function till the stopping criteria reached. A typical speed function usually involves a curve regularity penalty, for instance the curvature, and an image data term. The use of curve evolution scheme for image segmentation can be backtrack to the original active contour model kass1988snakes which has inspired a amount of approaches cohen1991active ; xu1998snakes ; cohen1997global ; chen2017global ; kimmel2003regularized ; melonakos2008finsler .
Let be an open bounded domain. Based on the level set framework osher1988fronts , a closed contour can be retrieved by identifying the zero level set line of a scalar function such that . By this curve representation, the curve evolution can be carried out by evolving the function
| (1) |
where is a speed function and denotes the time. At any time , the curve can be recovered by identifying the zero-level set line of the function . Using the level set evolutional equation in Eq. (1), the contours splitting and merging can be adaptively handled.
The main drawback of the level set-based front propagation method is its expensive computational burden. In order to alleviate this problem, Adalsteinsson and Sethian adalsteinsson1995fast suggested to restrict the computation for the update of the level set function within a narrow band. In this case, only the values of at the points nearby the zero-level set lines are updated according to Eq. (1). Moreover, the distance-preserving level set method li2010distance is able to avoid level set reinitialization by enforcing the level set function as a signed Euclidean distance function from the current curves during the evolution.
Despite the efforts devoted to the reduction in the computation burden, the classical level set-based fronts propagation scheme (1) is still impractical especially for real-time applications. In order to solve this issue, Malladi and Sethian malladi1998real proposed a new geodesic distance-based front propagation model for real-time image segmentation. It relies on a geodesic distance map associated to a set of source points. The value of at a point in essence is equivalent to the minimal geodesic curve length between the point and a source point in the sense of an isotropic Riemannian metric, which is dependent on a potential function . The geodesic distance map coincides with the viscosity solution to the Eikonal equation, which can be efficiently computed by the fast marching methods sethian1999fast ; tsitsiklis1995efficient ; mirebeau2014anisotropic ; mirebeau2014efficient ; mirebeau2017anisotropic , leading to a possible real-time solution to the segmentation problem. In the context of segmentation, the potential function usually has small values in the homogeneous region and large values near the boundaries. Based on the geodesic distance map , a curve can be denoted by the -level set of the distance map , where is a geodesic distance thresholding value. In other words, a curve can be characterized by the distance value such that
| (2) |
By assigning large values to the potential function around image edges, the basic idea behind malladi1998real is to use the curve defined in Eq. (2) to delineate the boundaries of interesting objects. One difficulty suffered by the geodesic distance-based fronts propagation scheme is that the fronts may leak outside the targeted regions before all the points of these regions have been visited by the fronts. The leakages sometimes occur near the boundaries close to the source positions or in weak boundaries, especially when dealing with long and thin structures. The main reason for this leaking problem is the positivity constraint required by the metric (potential) functions for the Eikonal equation. In order to solve this problem, Cohen and Deschamps cohen2007segmentation suggested an adaptive freezing scheme for tubular structure segmentation. They took into account a Euclidean curve length criterion to prevent the fast marching fronts to travel outside the tubular structures in order to avoid the leaking problem. The main difficulty of this model lies at the choice of a suitable Euclidean curve length thresholding value. Chen and Cohen chen2016vessel considered an anisotropic Riemannian metric for vessel tree segmentation, where the vessel orientations are taken into account to mitigate the leaking problem. Li and Yezzi li2007local proposed a dual fronts propagation model for active contours evolution, where the geodesic metric includes both edge and region statistical information. The basic idea of li2007local is to propagate the fronts simultaneously from the exterior and interior boundaries of the narrowband. The optimal contours can be recovered from the positions where the two fast marching fronts meet. These meeting interfaces also correspond to the boundaries of the adjacent Voronoi regions. Arbeláez and Cohen arbelaez2004energy ; arbelaez2008constrained and Bai and Sapiro bai2009geodesic made use of the Voronoi index map and the Voronoi region for interactive image segmentation, both of which can be constructed through the geodesic distance maps associated to the pseudo path metrics. In their formulation, these models arbelaez2004energy ; arbelaez2008constrained ; bai2009geodesic allow the values of the metrics to be zero and to be dependent on path orientations. The image segmentation can be characterized by the Voronoi regions, each of which involves all the points labeled by the same Voronoi index. In this case, the contours indicating the tagged object boundaries are no longer the level sets of the geodesic distance map, but the common boundaries of the adjacent Voronoi regions. Other interesting geodesic distance map-based image segmentation methods include criminisi2008geos ; price2010geodesic ; cardinal2006intravascular .
A common point of the Eikonal front propagation models mentioned above is that the segmentation procedure is carried out by using the geodesic distance map itself. Finding geodesics through the gradient descent on the geodesic distance map is an alternative way of using the Eikonal equation framework for practical applications. Since the original work by Cohen and Kimmel cohen1997global , a broad variety of minimal path models have been proposed to solve various image analysis problems benmansour2009fast ; mille2015combination; chen2016finsler ; li2007vessels; benmansour2011tubular; kaul2012detecting. Recently, a significant contribution to the minimal path framework lies at the development of the curvature-penalized geodesic models such as bekkers2015pde; chen2017global ; duits2016optimal; mashtakov2017tracking. In the basic formulations of duits2016optimal; chen2017global ; chen2015global, the curve length values of the minimal geodesics with curvature penalization can be approximately measured by strongly anisotropic Riemannian metrics or Finsler metrics established in an orientation-lifted space. As a result, the geodesic distance maps associated to these metrics can be efficiently and accurately estimated by the Hamiltonian fast marching method mirebeau2017fast. The curvature-penalized geodesics can be recovered via a gradient descent scheme on the associated geodesic distance map.
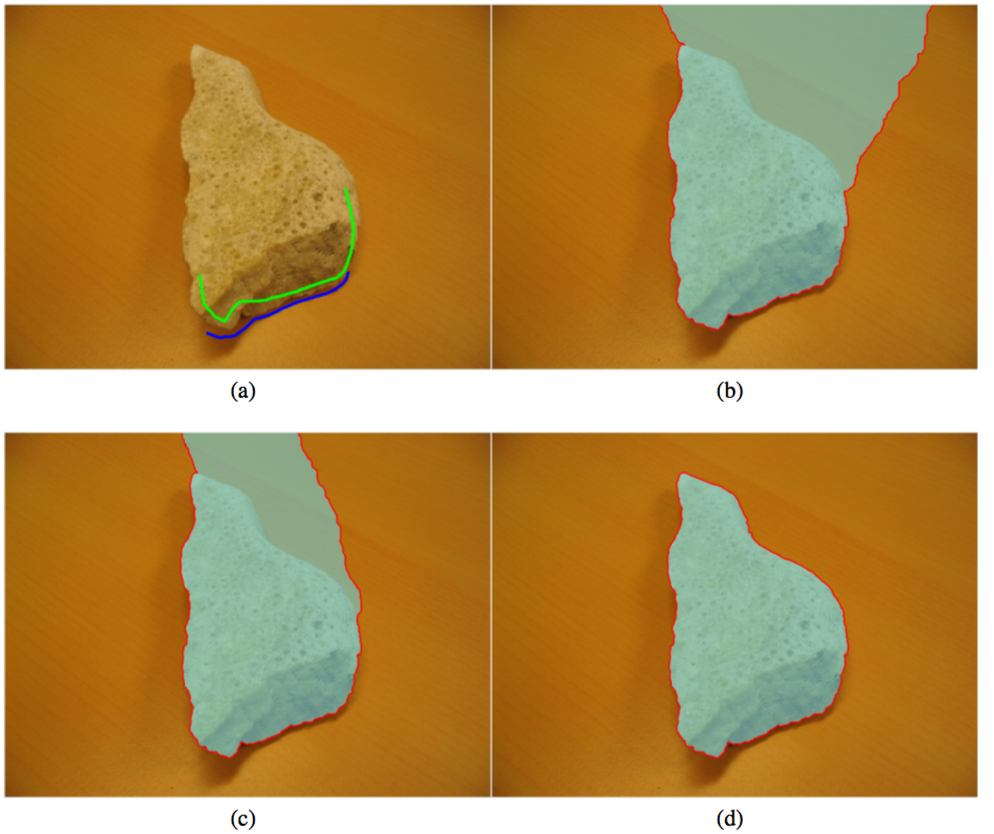
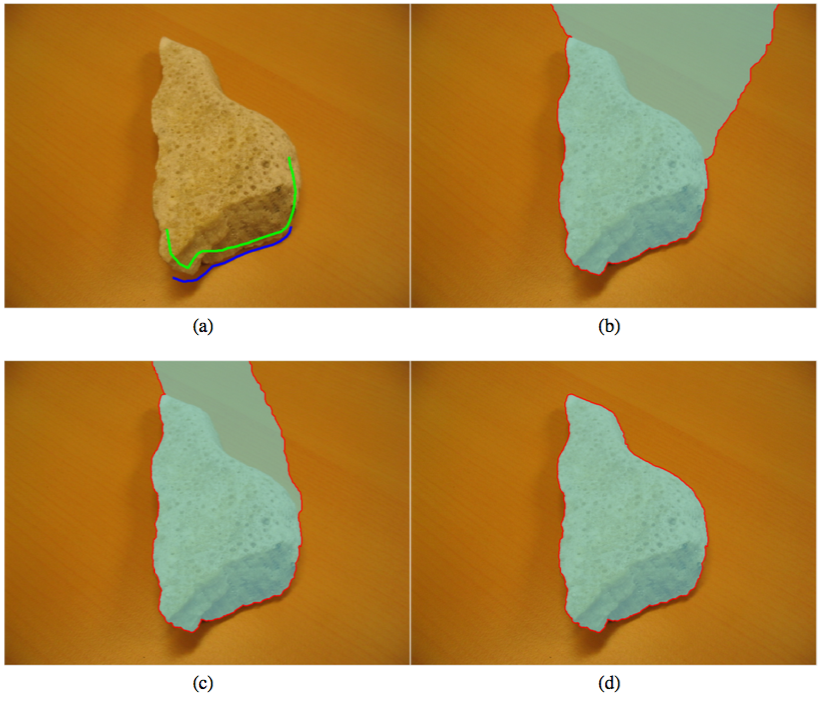
In this paper, we extend the geodesic distance map-based front propagation framework to a Finsler case, where both the edge anisotropy and asymmetry are taken into account simultaneously. Our model thus relies on the geodesic distance map itself instead of minimal paths. Moreover, we also present two ways to construct the Finsler metrics with respect to the applications of foreground and background object segmentation and tubularity segmentation. In order to quickly find suitable and reliable solutions in various situations, it is important for the fronts propagation models with a single-pass manner to be robust against to the leaking problem. The existing front propagation approaches invoking either Riemannian metrics cohen2007segmentation ; chen2016vessel or pseudo path metrics arbelaez2004energy ; arbelaez2008constrained ; bai2009geodesic , do not take into account the edge asymmetry information. This may increase the risk of the leaking problem especially when the provided seeds are close to the targeted boundaries. We show an example of the leaking problem in Fig. 1. In Fig. 1a, the source points inside the foreground and background are indicated by green and blue brushes, respectively. The contours in Figs. 1b and 1c obtained from the Riemannian metrics pass through the boundaries before the whole object has been covered by the fast marching fronts. In contrast, the segmented contour derived from the proposed Finsler metric can avoid such problem as shown in Fig. 1d.
1.1 Paper Outline
The remaining of this paper is organized as follows: In Section 2, we introduce the geodesic distance map associated to a general Finsler metric, the Voronoi regions and the relevant numerical tool. Section 3 presents the construction of the asymmetric Finsler metrics associated to different image segmentation applications. The numerical considerations for the Finsler metrics-based fronts propagation are introduced in Section 4. The experimental results and the conclusion are respectively presented in Sections 5 and 6.
2 Background on Geodesic Distance Map
A Finsler geodesic metric is a continuous function over the domain . For each fixed point , the geodesic metric can be characterized by an asymmetric norm of . In other words, the Finsler geodesic metric is convex and 1-homogeneous on its second argument. It is also potentially asymmetric such that and , the following inequality is held
| (3) |
The geodesic curve length associated to the metric along a Lipschitz continuous curve can be expressed by
| (4) |
where is the first-order derivative of the curve and is the arc-length parameter of the curve .
Letting be a set which involves all the source points. The minimal curve length from to with respect to the Finsler metric is defined by
| (5) |
where is the set of all the Lipschitz continuous curves linking from a point to .
The geodesic distance map associated to the geodesic metric can be defined in terms of the minimal curve length in Eq. (5) such that
| (6) |
The geodesic distance map is the unique viscosity solution to the Eikonal equation mirebeau2014efficient ; chen2017global
| (7) |
where denotes the standard Euclidean gradient of and is the Euclidean scalar product in the Euclidean space .
The Eikonal equation (7) can be interpreted by the Bellman’s optimality principle which states that
| (8) |
where is a neighbourhood of point and is the boundary of . This interpretation is a key ingredient for the numerical computation of the geodesic distance map via the fast marching method mirebeau2014efficient .
2.1 Voronoi Index Map
In this section, we consider a more general case for which a family of source point sets are provided. Suppose that these source point sets are denoted by and are indexed by with the total number of source point sets. For the sake of simplicity, we note .
For a given geodesic metric , we can compute the respective geodesic distance map associated to each source point set by Eq. (6). A Voronoi index map is a function such that for any source point
| (9) |
and for any domain point , the Voronoi index is identical to the index of the closest source point set in the sense of the geodesic distance arbelaez2004energy ; benmansour2009fast . One can construct a Voronoi index map in terms of the geodesic distance maps () by
| (10) |
By the Voronoi index map , the whole domain can be partitioned into Voronoi regions
| (11) |
The common boundary of two adjacent Voronoi regions and is comprised of a collection of equidistant points to the source point sets and , i.e.,
| (12) |
Finally, we consider a geodesic distance map associated to the set which can be expressed by
| (13) |
where is the geodesic distance map with respect to the source point set indexed by .
2.2 Fast Marching Method
Many approaches bornemann2006finite ; weber2008parallel ; yatziv2006n ; rouy1992viscosity can be used to estimate the geodesic distance map . Among them, the fast marching method sethian1999fast ; tsitsiklis1995efficient solves the Eikonal equation in a very efficient way. It has a similar distance estimation scheme with Dijkstra’s graph-based shortest path algorithm dijkstra1959note . One crucial ingredient of the fast marching method is the construction of the stencil map , where defines the neighbourhood of a grid point . The isotropic fast marching methods sethian1999fast ; tsitsiklis1995efficient are established on an orthogonal 4-connectivity neighbourhood system, which suffers some difficulties for the distance computation associated to asymmetric Finsler metrics mirebeau2014efficient . In order to find accurate solutions to the Finsler Eikonal equation, more complicated neighbourhood systems are taken into account mirebeau2014anisotropic ; mirebeau2014efficient ; sethian2003ordered ; mirebeau2017fast. These neighbourhood systems or stencils are usually constructed depending on the geodesic metrics. In this paper, we adopt the Finsler variant of the fast marching method proposed by Mirebeau mirebeau2014efficient . It invokes a geometry tool of anisotropic stencil refinement and leads to a highly accurate solution, but requires a low computation complexity.
2.2.1 Hopf-Lax Operator for Local Distance Update
The Finsler variant of the fast marching method mirebeau2014efficient estimates the geodesic distance map on a regular discretization grid of the domain . It makes use of the Hopf-Lax operator to approximate (8) by
| (14) |
where denotes the stencil of involving a set of vertices in and is a piecewise linear interpolation operator in the neighbourhood . The estimate of the quality and order for the solution to (14) can be found in mirebeau2014efficient .
The Hopf-Lax operator is first introduced for the geodesic distance computation by Tsitsiklis tsitsiklis1995efficient from an optimal control point of view. The minimal curve length of a short geodesic from to is approximated by the length of a line segment . The geodesic distance value in Eq. (8) is estimated by a piecewise linear interpolation operator at located at the stencil boundary . It is comprised of a set of one-dimensional simplexes or line segments. Each simplex connects two adjacent vertices which are involved in the stencil . The solution to the Hopf-Lax operator (14) can be attained by
| (15) |
where is the solution to the minimization problem
| (16) |
For each simplex which joins two vertices and , the minimization problem (16) can be approximated by Tsitsiklis’ theorem tsitsiklis1995efficient such that
| (17) |
where subject to and .
2.2.2 Fast Marching Fronts Propagation Scheme
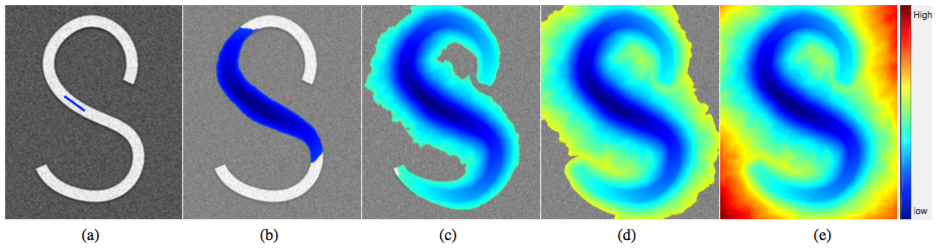
The fast marching method estimates the geodesic distance map in a wave front propagation manner. We demonstrate the course of the fast marching fronts propagation in Fig 2 on a synthetic image. In this figure, we invoke a Finsler metric for the computation of the geodesic distance map , where the metric will be presented in Section. 4. The fast marching fronts propagation is coupled with a procedure of label assignment operation, during which all the grid points are classified into three categories:
-
•
Accepted points, for which the values of have been estimated and frozen.
-
•
Far points, for which the values of are unknown.
-
•
Trial points, which are the remaining grid points in and form the fast marching fronts. A Trial point will be assigned a label of Accepted if it has the minimal geodesic distance value among all the Trial points.
In the course of the geodesic distance estimation, each grid point will be visited by the monotonically advancing fronts which expand from the source points involved in . The values of for all the Trial points are stored in a priority queue in order to quickly find the point with minimal . The label assignment procedure111Initially, each source point is tagged as Trial and the remaining grid points are tagged as Far. can be carried out by a binary map .
Suppose that with a source point set. The geodesic distance map and the Voronoi index map can be simultaneously computed benmansour2009fast ; cohen2001multiple , where the computation scheme in each iteration can be divided into two steps.
Voronoi index update. In each geodesic distance update iteration, among all the Trial points, a point that globally minimizes the geodesic distance map is chosen and tagged as Accepted. We set if . Otherwise, the geodesic distance value can be estimated in the simplex (see Eq. (15)), where the vertices relevant to are respective and . This is done by finding the solution to (17) with respect to the simplex , where the corresponding minimizer is . Then the Voronoi index map can be computed by
| (18) |
Local Geodesic Distance Update. For a grid point , we denote by the reverse stencil. The remaining step in this iteration is to update for each grid point such that and Accepted through the solution to the Hopf-Lax operator (14). This is done by assigning to the smaller value between the solution and the current geodesic distance value of . Note that the solution to (14) is attained using the stencil mirebeau2014efficient .
The algorithm for the fast marching method is described in Algorithm 1. In this algorithm, the computation of a map in Line 14 of Algorithm 1 is not necessary for the general fast marching fronts propagation scheme, but required by our method as discussed in Section 4.3.
Computation Complexity. The complexity estimate for the isotropic fast marching methods sethian1999fast ; tsitsiklis1995efficient established on the 4-neighbourhood system is bounded by , where denotes the cardinality of the discrete domain . The complexity estimates for the Finsler variant cases sethian2003ordered ; mirebeau2014efficient with adaptive stencil system rely on the anisotropic ratio of the geodesic metric . The estimate for the ordered upwind method sethian2003ordered is bounded by , which is impractical for image segmentation application. In contrast, for the method mirebeau2014efficient used in this paper, the complexity bound reduces to . Note that the anisotropic ratio is defined by
| (19) |
3 Finsler Metric Construction
Definition 1
Let be the collection of all the positive definite symmetric matrices with size . For any matrix , we define a norm .
3.1 Principles for Finsler Metric Construction
In this section, we present the construction method of the Finsler metric which is suitable for fronts propagation and image segmentation. Suppose that a vector field has been provided such that points to the object edges at least when is nearby them. In this case, the orthogonal vector field indicates the tangents of the edges.
Basically, the Eikonal equation-based fronts propagation models malladi1998real perform the segmentation scheme through a geodesic distance map. In order to find a good solution for image segmentation, the used geodesic metric should be able to reduce the risk of front leaking problem. For this purpose, we search for a direction-dependent metric satisfying the following inequality
| (20) |
Recall that for an edge point , both the feature vectors or are propositional to the tangent of the edge at . When the fast marching front arrives at the vicinity of image edges, it prefers to travel along the edge feature vectors and , instead of passing through the edges, i.e., prefers to travel along the direction .
The inequality (20) requires the geodesic metric to be anisotropic and asymmetric with respect to its second argument. Thus, we consider a Finsler metric with a Randers form randers1941asymmetrical involving a symmetric quadratic term and a linear asymmetric term for any and any vector
| (21) |
where is a positive symmetric definite tensor field and is a vector field that is sufficiently small. The function is a positive scalar-valued potential which gets small values in the homogeneous regions and large values around the image edges. It can be derived from the image data such as the coherence measurements of the image features, which will be discussed in detail in Section 4.3.
The tensor field and the vector field should satisfy the constraint
| (22) |
in order to guarantee the positiveness mirebeau2014efficient of the Randers metric .
We reformulate the Randers metric in Eq. (21) as
| (23) |
where is still a Randers metric which can be formulated by
| (24) |
The remaining part of this section will be devoted to the construction of the Randers metric in terms of the vector field which is able to characterize the directions orthogonal to the image edges.
Let us define a new vector field by
The tensor field used in Eq. (21) can be constructed dependently on two scalar-valued coefficient functions and such that
| (25) |
where is the orthogonal vector of and denotes the tensor product, i.e., . Note that the eigenvalues of are and , respectively corresponding to the eigenvectors and .
The vector is positively collinear to field for all
| (26) |
where is a scalar-valued coefficient function.
We estimate the coefficient functions , and through two cost functions , which assign the cost values , and to the Randers metric respectively along the directions , and for any point such that
| (27) |
Combining Eqs. (25) and (27) yields that
| (28) |
for any .
The positive symmetric definite tensor field and the vector field thus can be respectively expressed in terms of the cost functions and by
| (29) |
and
| (30) |
Based on the tensor field and the vector field respectively formulated in Eqs. (3.1) and (30), the positiveness constraint (22) is satisfied due to the assumption that and . The cost functions and can be derived from the image edge information such as the image gradients, which will be discussed in Section 4.
Note that if we set , the vector field will vanish, i.e., (see Eq. (30)). In this case, one has for any point and any vector , leading to a special form of the Randers metric . This special form is a symmetric (potentially anisotropic) Riemannian metric which depends only on the tensor field .
3.2 Tissot’s indicatrix
A basic tool for studying and visualizing the geometry distortion induced from a geodesic metric is the Tissot’s indicatrix defined as the collection of control sets in the tangent space chen2017global . For an arbitrary geodesic metric , the control set for any point is defined as the unit ball centered at such that
| (32) |
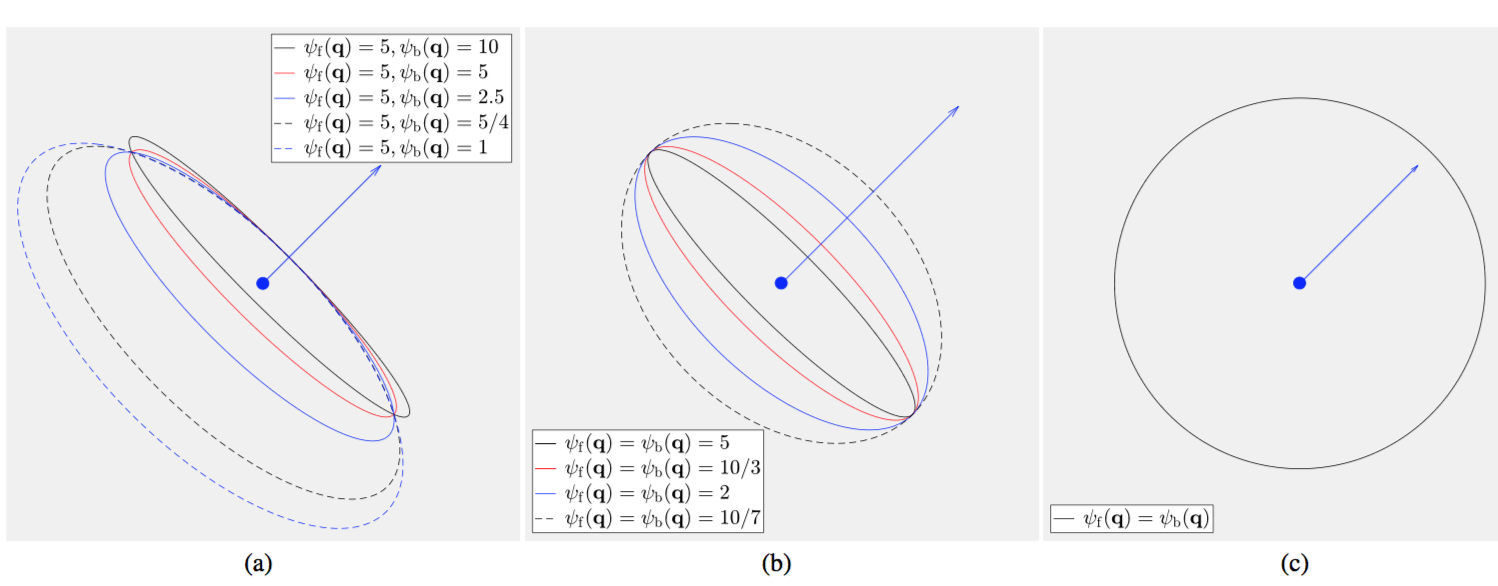
We demonstrate the control sets in Fig. 3 for the Randers metric with different values of and at a point . The vector is set as
In Fig. 3a, we show the control sets for the Randers metric with respect to different values of and a fixed value . One can point out that the common origin of these control sets have shifted from the original center of the ellipses222These ellipses are the boundaries of the control sets. due to the asymmetric property as formulated in Eq. (3). In Fig. 3b, the control sets for the Randers metric associated to are demonstrated, where gets to be anisotropic and symmetric on its second argument. When , the values of the Randers metric turn to be invariant with respect to as shown in Fig. 3c. In this case, the tensor is propositional to the identity matrix.
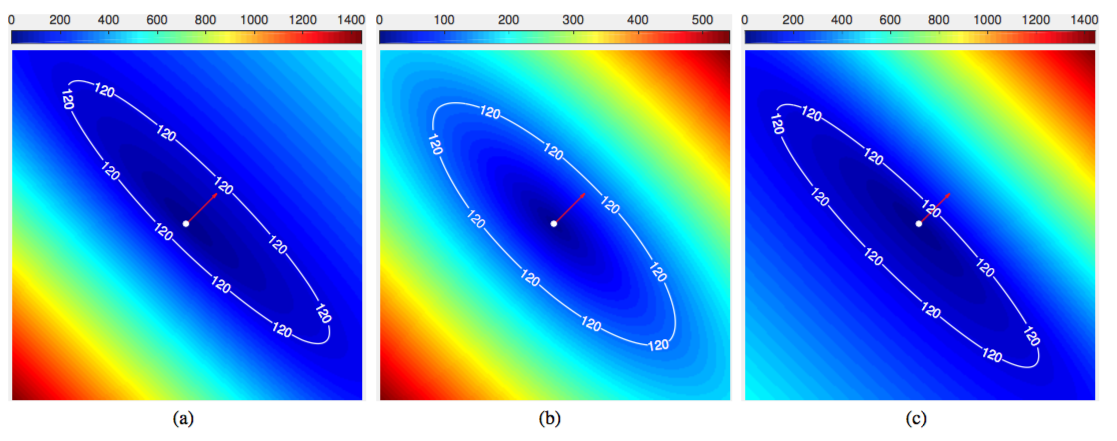
In Fig. 4, we show the geodesic distance maps associated to with different values of the cost functions and . The vector field is set to
In Figs. 4a and 4c, we can see that the geodesic distance maps have strongly asymmetric and anisotropic appearance. In Fig. 4b, we observe that the geodesic distance map appears to be symmetric and strongly anisotropic. This is because the respective propagation speed of the fast marching fronts along the directions and is identical to each other.
4 Data-Driven Randers Metrics Construction
4.1 Cost Functions and for the Application of Foreground and Background Segmentation
In this section, we present the computation method for the cost functions and using the image edge information, based on which the image data-driven Randers metric can be obtained.
Let be a vector-valued image in the chosen color space and let be a Gaussian kernel with variance (We set through all the experiments of this paper). The gradient of the image at each point is a Jacobian matrix
involving the Gaussian-smoothed first-order derivatives along the axis directions and
| (33) |
Let be an edge saliency map. It has high values in the vicinity of image edges and low values inside the flatten regions. For each domain point , the value of can be computed by the Frobenius norm of the Jacobian matrix
| (34) |
For a gray level image , the edge saliency map can be simply computed by the norm of the Euclidean gradient of the image such that
| (35) |
Construction of the Vector Field . We use the gradient vector flow method xu1998snakes to compute the vector field for the construction of the Randers metric . This can be done by minimizing the following functional with respect to a vector field , where can be expressed as
| (36) |
where is a constant and
| (37) | |||
| (38) |
The parameter controls the balance between the regularization term and the data fidelity term . As discussed in xu1998snakes , the values of should depend on the image noise levels such that a large value of is able to suppress the effects from image noise. We set through all the numerical experiments of this paper. The minimization of the functional can be carried out by solving the Euler-Lagrange equations of the functional with respect to the components and . The gradient vector flow is more dense and smooth than the original gradient filed . In the vicinity of edges, the values of are large and one has the approximation due to the effects of the data fidelity term , while in the flatten regions where the gradient nearly vanishes, the vector field is forced to keep smooth (i.e., slowly-varying), because within these regions the minimization of the regularization term plays a dominating role for the computation of . More details for gradient vector flow method can be found from xu1998snakes .
The vector field for the construction of the Randers metric can be obtained by normalizing the vector field
| (39) |
The cost functions and used in Eq. (27) for the foreground and background segmentation application can be expressed for any by
| (40) | ||||
| (41) |
where and are nonnegative constants dominating how anisotropic and asymmetric the Randers metric is.
Once the cost functions and have been computed by Eqs. (40) and (41), we can construct the tensor filed and the vector field respectively via Eqs. (3.1) and (30). Indeed, one has for the points located in the homogeneous region of the image where . In this case, the data-driven Randers metric expressed in Eq. (24) approximates to be an isotropic Riemannian metric. For each point around the image edges such that the value of is large, the Randers metric will appear to be strongly anisotropic and asymmetric.
4.2 Cost Functions and for Tubularity Segmentation
In this section, we take into account a feature vector field which extracts local orientation features from the image. A feature vector characterizes the orientation that a tubular structure should have at a point belonging to this structure. The feature vector field can be estimated by the steerable filters jacob2004design; law2008three; frangi1998multiscale; freeman1991design.
Based on the cost functions and in Eqs. (39) and (40), we are able to build a positive symmetric definite tensor field for the Randers metric . For each point inside the tubular structures where the gray levels vary slowly, the value of the gradient norm nearly vanishes, leading to . In this case, the Randers metric is approximately independent of the directions (see Section 4.1). However, with respect to tubular structure segmentation application, we expect that inside the tubular structure the fast marching fronts travel faster along the directions or than along the directions or in order to reduce the risk of the front leakages. For this purpose, we make use of a new tensor field based on in Eq. (3.1) such that
where is a constant. It is relevant to the anisotropy property of the tensor field . In the numerical experiments of this paper, we set .
In practice, we observe that inside the tubular structures, the feature vector field can be well approximated by the vector field which is the orthogonal vector field of derived from Eqs. (36) and (39). In order to reduce the computation time, we construct the tensor field by the vector field such that
| (42) |
In this case, we obtain a new Randers metric for the application of tubularity segmentation, which depends on the tensor field and can be formulated as
| (43) |
Note that we build by using the same vector field with the Randers metric . Based on the new Randers metric , inside the tubular structures the fast marching fronts will travel fast along the directions or , but slow when the fronts arrive at the boundaries and slower when the fronts tend to pass through them.
4.3 Computing the Potential
We present the computation methods for the potential function used by the data-driven Randers metric that is formulated in Eq. (23). Basically, the potential function should have small values in the homogeneous regions and large values in the vicinity of the image edges.
4.3.1 Foreground and Background Segmentation
For foreground and background segmentation application, the potential function has a form of
| (44) |
where is a positive constant and is the edge saliency map defined in Eqs. (34) or (35). The term which depends only on the edge saliency map will keep invariant during the fast marching fronts propagation. The dynamic potential function relies on the positions of the fronts. It will be updated in the course of the geodesic distances computation in terms of some consistency measure of image features bai2009geodesic . Basically, the values of the dynamic potential should be small in the homogeneous regions. We use a feature map with the dimensions of the feature vector to establish the dynamic potential . The feature map can be the image color vector (), the image gray level (), or the scalar probability map () as used in bai2009geodesic .
Recall that in each fast marching distance update iteration, the latest Accepted point is chosen by searching for a Trial point with minimal distance value ( is the set of the source points), i.e.,
| (45) |
Then the value of for each point such that and Accepted can be updated by evaluating the Euclidean distance between and (see Line 14 of Algorithm 1). In other words, one can compute the dynamic potential in each fast marching update iteration by
| (46) |
for all grid points such that and Accepted, where is a positive constant. Note that we initialize the dynamic potential by
Based on the potential in Eq. (44) and the Randers metric (see Section 4.1), the data-driven Randers metric for the foreground and background segmentation application can be expressed for any point and any vector by
| (47) |
Finally, we show the effects of the dynamic potential in Eq. (46) in the foreground and background segmentation application. The fronts propagation results are shown in Fig. (5) with respect to the Randers metric . In this experiment, we choose different values for the parameter that is used by the dynamic potential and a fixed parameter to compute the edge-based potential . The values of and are set to be and , respectively. Indeed, one can point out that the dynamic potential is able to help the fronts propagation scheme to avoid leakages.
4.3.2 Tubularity Segmentation
We assume that the gray levels inside the tubular structures are stronger than outside. For tubularity segmentation, we consider a potential function involving a static term and a dynamic term such that
| (48) |
where is a feature map that characterizes the tubularity appearance, i.e., the value of indicates the probability of a point belonging to a tubular structure. In practice, the map can be specified as the image gray levels or as a normalized vesselness map derived from a tubularity detector such as frangi1998multiscale; franken2009crossing; law2008three.
The dynamic potential is estimated in the course of the fast marching fronts propagation. The computation scheme of is almost identical to the dynamic potential presented in Section 4.3.1, except that the dynamic potential for tubularity segmentation is dependent on the feature map .
We also initialize the dynamic potential by . In each geodesic distance update iteration, we suppose be the latest Accepted point. For each grid point such that and Accepted, we update the dynamic potential by
| (49) |
The reason for the use of (49) is that if the latest Accepted point belongs to a tubular structure, then the inequality means that the neighbour point also belongs to this structure. Therefore, we assign a small value to . In this paper, we set the map as the normalized image gray levels, i.e., .
The data-driven Randers metric for tubularity segmentation can be formulated by
| (50) |
where the potential and the metric are expressed in Eqs. (48) and (43), respectively.
5 Experimental Results
5.1 Implementation Details
Parameter Setting. The anisotropy and asymmetry of the Randers metrics and are determined by the parameters and (see Eqs. (40) and (41)). We respectively denote by and the data-driven Randers metrics and with a pair of parameters . In this case, the corresponding Randers metrics in Eq. (47) and in (50) can be noted by and , respectively. The potential functions and rely on two parameters and . We fix through all the experiments, except in Fig. 8 for which we set . The values of are individually set for each experiment.
Note that the parameter indicates that the geodesic metrics and are isotropic with respect to the second argument. Furthermore, when with , the metrics and get to be the anisotropic Riemannian cases333Note that metrics and have the identical anisotropy and asymmetry properties to and , respectively..
Image Segmentation Schemes. The interactive foreground and background segmentation task can be converted to the problem of identifying the Voronoi index map or Voronoi regions in terms of geodesic distance bai2009geodesic ; arbelaez2004energy . Let and be the sets of source points which are respectively located at the foreground and background regions. The Voronoi regions and , indicating foreground and background regions respectively, can be determined by the Voronoi index map through Eq. (11) such that
With respect to the foreground and background segmentation, the computation complexity for the geodesic distance computation is consistent to the used fast marching method mirebeau2014efficient , which is bounded by with the number of the grid points in .
For tubularity segmentation, all the user-provided seeds are supposed to be placed inside the targeted structures. We make use of the -level set of the geodesic distance map as the boundaries of the targeted tubular structures. We denote by the number of the grid points in tagged as Accepted, i.e.,
In order to reduce the computation time of the fast marching method, we terminate the fronts propagation once the number of the grid points tagged as Accepted reaches the given thresholding value . In this case, the tubular structures can be recovered by the regions which are comprised of all the Accepted points. Let be the number of Trial grid points when points have been tagged as Accepted and let be the total number of grid points for which the distance values have been updated. The computation complexity for this application is bounded by , since only grid points are visited by the fast marching fronts.
5.2 Advantages of Using Anisotropy and Asymmetry Enhancements
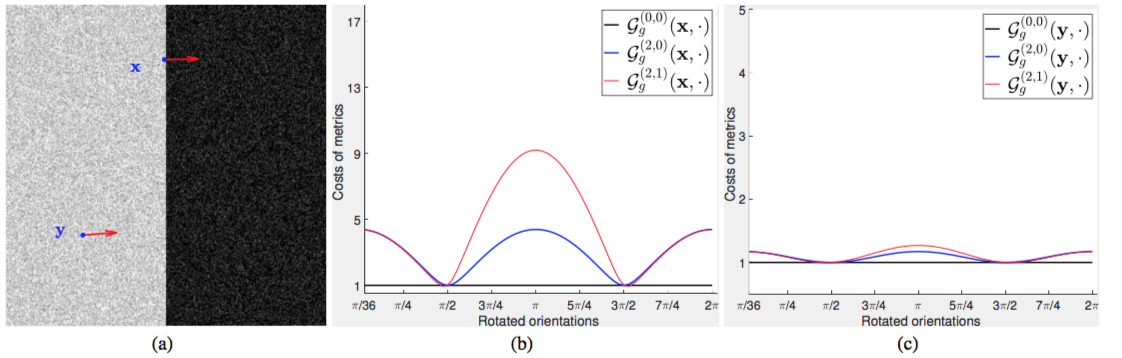
Let us consider a synthetic image as shown in Fig. 6a with two sampled points and indicated by blue dots. The arrows respectively indicate the directions of and , where is near the edges and is located inside the homogeneous region. In Fig. 6b, we plot the cost values of the metrics , and , along different directions . The directions are obtained by rotation such that
| (51) |
where is the angle resolution and is a rotation matrix with angle in a countclockwise order. In Fig. 6c, we plot the cost values for the metrics , and with
In Fig. 6b, we can see that all of the three metrics get low values around the directions and , which are orthogonal to the direction . However, around the direction , the Randers metric attains much larger values than the Riemannian cases and . Such an asymmetric property is able to reduce the risk of front leakages.
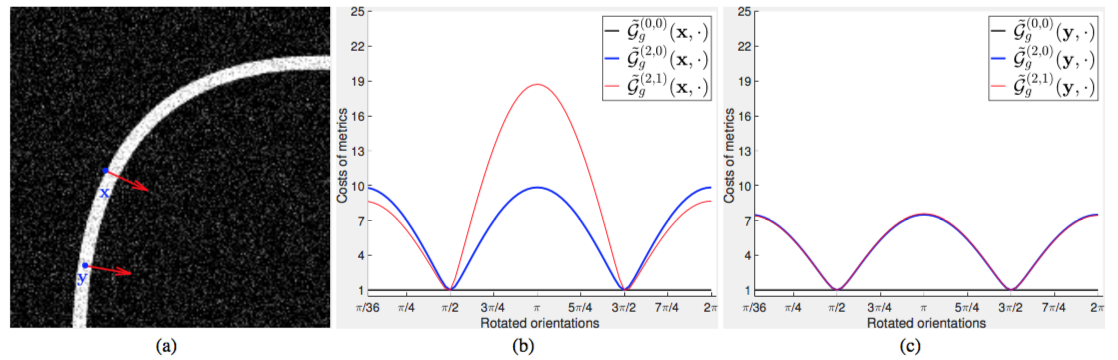
In Fig. 7, we plot the cost values for the metrics , and at the points and along different rotated directions. In Fig. 7b, the cost values (indicated by the red curve) of the Randers metric at the point near the edges and outside the tubular structure show strongly asymmetric property. In Fig. 7c, we can see that along all of the rotated directions, the cost values for both the Randers metric are equivalent to the anisotropic Riemannian metric . This anisotropic property is able to force the fast marching fronts travel faster along the tubularity orientations which are approximated by the vector field .
5.3 Experiments on Synthetic and Real Images
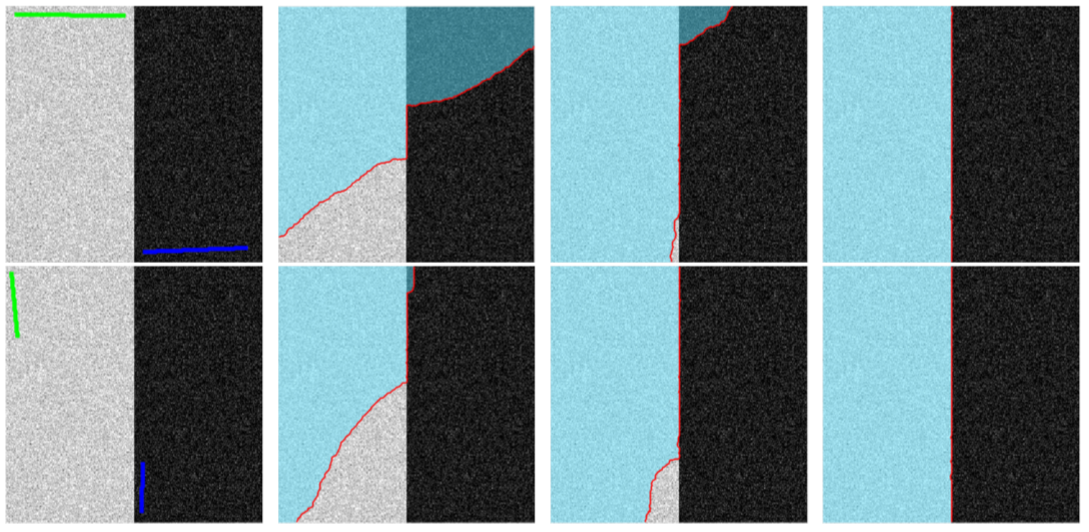
In Fig. 8, we show the fronts propagation results on a synthetic image. In the first column of Fig. 8, we initialize the sets of the source points in different locations, which are indicated by green and blue brushes. The columns to of Fig. 8 are the segmentation results from the isotropic Riemannian metric , the anisotropic Riemannian metric and the Randers metric , respectively. For the purpose of fair comparisons, the three metrics used in this experiment share the same potential function defined in Eq. (44). One can point out that the results from the metrics and suffer from the leaking problem, while the final boundaries (red curves) associated the proposed Randers metric are able to catch the expected edges thanks to the asymmetric enhancement. In this experiment, we choose .
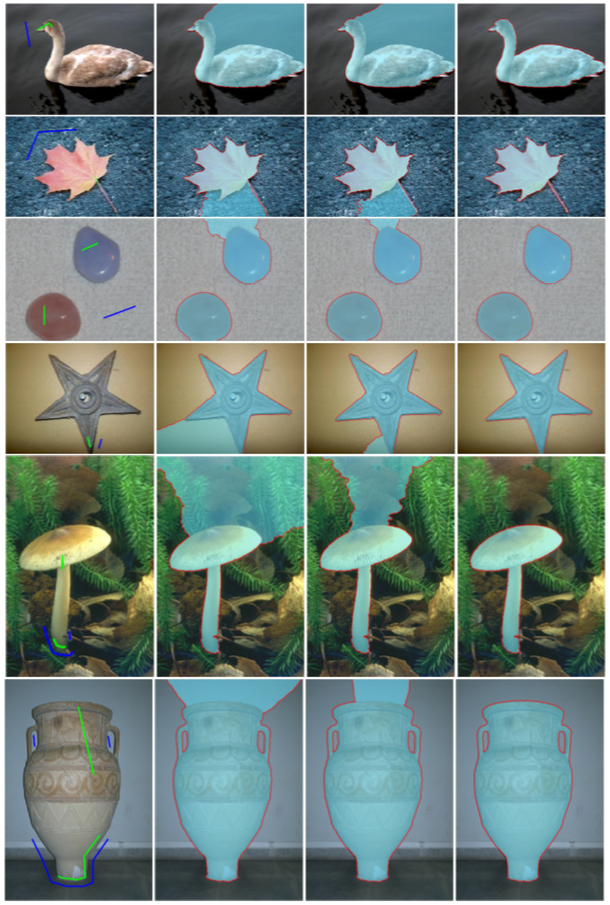
In Fig. 9, we compare the interactive image segmentation results via different geodesic metrics on real images which are obtained from the Weizmann dataset alpert2012image and the Grabcut dataset rother2004grabcut . The final segmentation results are derived from the boundaries of the corresponding Voronoi index maps. In column 1, we show the initial images with seeds indicating by green and blue brushes respectively inside the foreground and background regions. In columns to of Fig. 9, we demonstrate the segmentation results obtained via the isotropic Riemannian metric , the anisotropic Riemannian metric and the Randers Metric . For the results from the isotropic and anisotropic Riemannian metrics (shown in columns and ), the final contours leak into the background regions. In contrast, the segmentation contours associated to the Randers metric are able to follow the desired object boundaries.
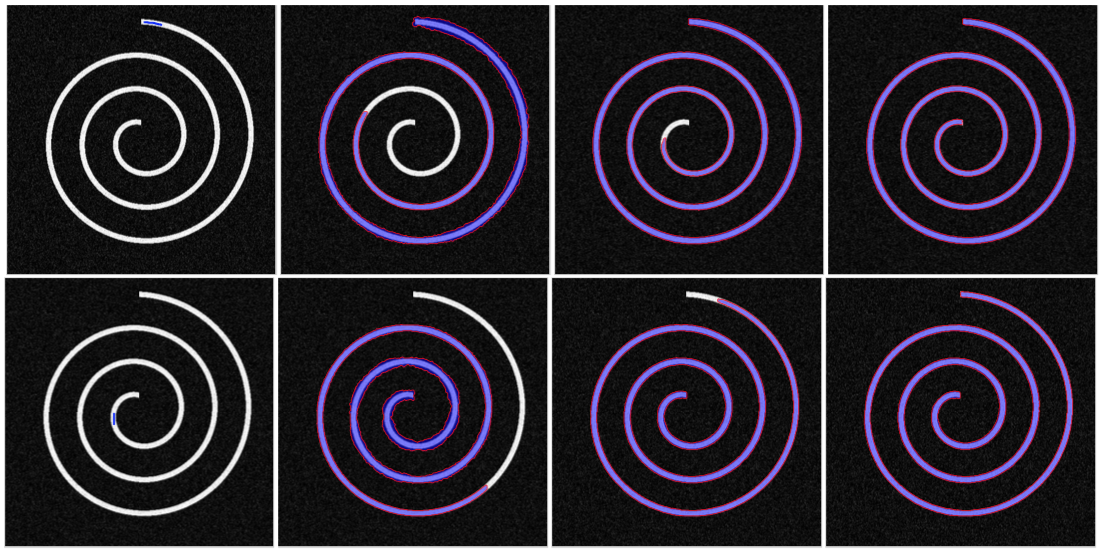
In Fig. 10, we compare the tubularity segmentation results on a Spiral respectively using the isotropic Riemannian metric , the anisotropic Riemannian metric and the Randers metric . The tubularity boundaries (red curves) are computed through the level set lines of the respective geodesic distance maps with an identical thresholding value of . The shadow regions indicate the segmented regions involving all the points tagged as Accepted. In the first column of Fig. 10, for each row the respective source points are placed at the end of the Spiral. One can point out that the final segmentation contours corresponding to the isotropic Riemannian metric (shown in column ) and the anisotropic Riemannian metric (shown in column ) leak into the background before the whole tubular structure has been covered by the fast marching fronts. Indeed, using the anisotropy enhancement can improve the segmentation results such that the leakages for the contours from the anisotropic Riemannian metric only occur at the locations far from the seeds. Finally, the segmentation contours shown in column resulted by the Randers metric with both anisotropic and asymmetric enhancements are able to delineate the desired tubularity boundaries.
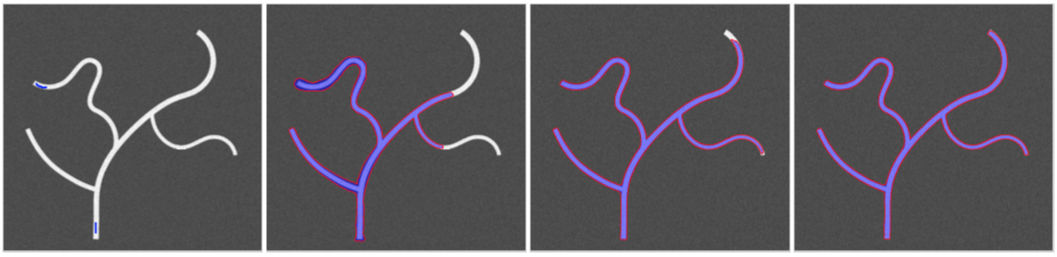
In Fig. 11, we perform the fast marching fronts propagation on a tubular tree structure. We again observe the leaking problem that occurs in the segmentation results derived from the isotropic Riemannian metric and the anisotropic Riemannian metric , which are shown in columns 2 and 3 respectively. While in column , the fronts are able to pass through the whole tubular tree structure before they leak into the background.
6 Conclusion
In this paper, we extend the fronts propagation framework from the Riemannian case to a general Finsler case with applications to image segmentation. The Finsler metric with a Randers form allows us to take into account the asymmetric and anisotropic image features in order to reduce the risk of the leaking problem during the fronts propagation. We presented a method for the construction of the Finsler metric with a Randers form using a vector field derived from the image edges. This metric can also integrate with a feature coherence penalization term updated in the course of the fast marching fronts propagation. We applied the fronts propagation model associated to the proposed Randers metrics to foreground and background segmentation and tubularity segmentation. Experimental results show that the proposed model indeed produces promising results.
Acknowledgment
The authors would like to thank all the anonymous reviewers for their detailed remarks that helped us improve the presentation of this paper. The authors thank Dr. Jean-Marie Mirebeau from Université Paris-Sud for his fruitful discussion and creative suggestions. The first author also thanks Dr. Gabriel Peyré from ENS Paris for his financial support. This work was partially supported by the European Research Council (ERC project SIGMA-Vision).
References
- (1) Adalsteinsson, D., Sethian, J.A.: A fast level set method for propagating interfaces. Journal of Computational Physics 118(2), 269–277 (1995)
- (2) Alpert, S., Galun, M., Brandt, A., Basri, R.: Image segmentation by probabilistic bottom-up aggregation and cue integration. IEEE Trans. on Pattern Analysis and Machine Intelligence 34(2), 315–327 (2012)
- (3) Arbeláez, P., Cohen, L.: Constrained image segmentation from hierarchical boundaries. In: Proceedings of CVPR, pp. 1–8 (2008)
- (4) Arbeláez, P.A., Cohen, L.D.: Energy partitions and image segmentation. Journal of Mathematical Imaging and Vision 20(1), 43–57 (2004)
- (5) Bai, X., Sapiro, G.: A geodesic framework for fast interactive image and video segmentation and matting. In: Proceedings of ICCV 2007, pp. 1–8 (2007)
- (6) Bai, X., Sapiro, G.: Geodesic matting: A framework for fast interactive image and video segmentation and matting. International Journal of Computer Vision 82(2), 113–132 (2009)
- (7) Benmansour, F., Cohen, L.D.: Fast object segmentation by growing minimal paths from a single point on 2d or 3d images. Journal of Mathematical Imaging and Vision 33(2), 209–221 (2009)
- (8) Bornemann, F., Rasch, C.: Finite-element discretization of static Hamilton-Jacobi equations based on a local variational principle. Computing and Visualization in Science 9(2), 57–69 (2006)
- (9) Cardinal, M.H., Meunier, J., et al.: Intravascular ultrasound image segmentation: a three-dimensional fast-marching method based on gray level distributions. IEEE Trans. on Medical Imaging 25(5), 590–601 (2006)
- (10) Caselles, V., Catté, F., Coll, T., Dibos, F.: A geometric model for active contours in image processing. Numerische Mathematik 66(1), 1–31 (1993)
- (11) Caselles, V., Kimmel, R., Sapiro, G.: Geodesic active contours. International Journal of Computer Vision 22(1), 61–79 (1997)
- (12) Chen, D., Cohen, L.D.: Vessel tree segmentation via front propagation and dynamic anisotropic riemannian metric. In: Proceedings of ISBI, pp. 1131–1134 (2016)
- (13) Chen, D., Mirebeau, J.M., Cohen, L.D.: Finsler geodesic evolution model for region-based active contours. In: Proceedings of BMVC (2016)
- (14) Chen, D., Mirebeau, J.M., Cohen, L.D.: Global minimum for a Finsler elastica minimal path approach. International Journal of Computer Vision 122(3), 458–483 (2017)
- (15) Cohen, L.: Multiple contour finding and perceptual grouping using minimal paths. Journal of Mathematical Imaging and Vision 14(3), 225–236 (2001)
- (16) Cohen, L.D.: On active contour models and balloons. CVGIP: Image Understanding 53(2), 211–218 (1991)
- (17) Cohen, L.D., Deschamps, T.: Segmentation of 3D tubular objects with adaptive front propagation and minimal tree extraction for 3D medical imaging. Computer Methods in Biomechanics and Biomedical Engineering 10(4), 289–305 (2007)
- (18) Cohen, L.D., Kimmel, R.: Global minimum for active contour models: A minimal path approach. International Journal of Computer Vision 24(1), 57–78 (1997)
- (19) Criminisi, A., Sharp, T., Blake, A.: Geos: Geodesic image segmentation. In: Proceedings of ECCV, pp. 99–112 (2008)
- (20) Dijkstra, E.W.: A note on two problems in connexion with graphs. Numerische Mathematik 1(1), 269–271 (1959)
- (21) Kass, M., Witkin, A., Terzopoulos, D.: Snakes: Active contour models. International Journal of Computer Vision 1(4), 321–331 (1988)
- (22) Kimmel, R., Bruckstein, A.M.: Regularized laplacian zero crossings as optimal edge integrators. International Journal of Computer Vision 53(3), 225–243 (2003)
- (23) Li, C., Xu, C., Gui, C., Fox, M.D.: Distance regularized level set evolution and its application to image segmentation. IEEE Trans. on Image Processing 19(12), 3243–3254 (2010)
- (24) Li, H., Yezzi, A.: Local or global minima: Flexible dual-front active contours. IEEE Trans. on Pattern Analysis and Machine Intelligence 29(1) (2007)
- (25) Malladi, R., Sethian, J., Vemuri, B.C.: Shape modeling with front propagation: A level set approach. IEEE Trans. on Pattern Analysis and Machine Intelligence 17(2), 158–175 (1995)
- (26) Malladi, R., Sethian, J.A.: A real-time algorithm for medical shape recovery. In: Proceeding of ICCV, pp. 304–310 (1998)
- (27) Melonakos, J., Pichon, E., Angenent, S., Tannenbaum, A.: Finsler active contours. IEEE Trans. on Pattern Analysis and Machine Intelligence 30(3), 412–423 (2008)
- (28) Mirebeau, J.M.: Anisotropic fast-marching on cartesian grids using lattice basis reduction. SIAM Journal on Numerical Analysis 52(4), 1573–1599 (2014)
- (29) Mirebeau, J.M.: Efficient fast marching with Finsler metrics. Numerische Mathematik 126(3), 515–557 (2014)
- (30) Mirebeau, J.M.: Anisotropic fast-marching on cartesian grids using voronoi’s first reduction of quadratic forms. Preprint (2017)
- (31) Osher, S., Sethian, J.A.: Fronts propagating with curvature-dependent speed: algorithms based on Hamilton-Jacobi formulations. JCP 79(1), 12–49 (1988)
- (32) Price, B.L., Morse, B., Cohen, S.: Geodesic graph cut for interactive image segmentation. In: Proceedings of CVPR, pp. 3161–3168 (2010)
- (33) Randers, G.: On an asymmetrical metric in the four-space of general relativity. Physical Review 59(2), 195 (1941)
- (34) Rother, C., Kolmogorov, V., Blake, A.: Grabcut: Interactive foreground extraction using iterated graph cuts. ACM Trans. on Graphics 23(3), 309–314 (2004)
- (35) Rouy, E., Tourin, A.: A viscosity solutions approach to shape-from-shading. SIAM Journal on Numerical Analysis 29(3), 867–884 (1992)
- (36) Sethian, J.A.: Fast marching methods. SIAM Review 41(2), 199–235 (1999)
- (37) Sethian, J.A., Vladimirsky, A.: Ordered upwind methods for static Hamilton–Jacobi equations: Theory and algorithms. SIAM Journal on Numerical Analysis 41(1), 325–363 (2003)
- (38) Tsitsiklis, J.N.: Efficient algorithms for globally optimal trajectories. IEEE Transactions on Automatic Control 40(9), 1528–1538 (1995)
- (39) Weber, O., Devir, Y.S., et al.: Parallel algorithms for approximation of distance maps on parametric surfaces. ACM Trans. on Graphics 27(4), 104 (2008)
- (40) Xu, C., Prince, J.L.: Snakes, shapes, and gradient vector flow. IEEE Trans. on Image Processing 7(3), 359–369 (1998)
- (41) Yatziv, L., Bartesaghi, A., Sapiro, G.: O (N) implementation of the fast marching algorithm. Journal of Computational Physics 212(2), 393–399 (2006)
- (42) Yezzi, A., Kichenassamy, S., Kumar, A., Olver, P., Tannenbaum, A.: A geometric snake model for segmentation of medical imagery. IEEE Trans. on Medical Imaging 16(2), 199–209 (1997)