Fast Bayesian estimation of brain activation with cortical surface fMRI data using EM
Abstract
Task functional magnetic resonance imaging (fMRI) is a type of neuroimaging data used to identify areas of the brain that activate during specific tasks or stimuli. These data are conventionally modeled using a massive univariate approach across all data locations, which ignores spatial dependence at the cost of model power. We previously developed and validated a spatial Bayesian model leveraging dependencies along the cortical surface of the brain in order to improve accuracy and power. This model utilizes stochastic partial differential equation spatial priors with sparse precision matrices to allow for appropriate modeling of spatially-dependent activations seen in the neuroimaging literature, resulting in substantial increases in model power. Our original implementation relies on the computational efficiencies of the integrated nested Laplace approximation (INLA) to overcome the computational challenges of analyzing high-dimensional fMRI data while avoiding issues associated with variational Bayes implementations. However, this requires significant memory resources, extra software, and software licenses to run. In this article, we develop an exact Bayesian analysis method for the general linear model, employing an efficient expectation-maximization algorithm to find maximum a posteriori estimates of task-based regressors on cortical surface fMRI data. Through an extensive simulation study of cortical surface-based fMRI data, we compare our proposed method to the existing INLA implementation, as well as a conventional massive univariate approach employing ad-hoc spatial smoothing. We also apply the method to task fMRI data from the Human Connectome Project and show that our proposed implementation produces similar results to the validated INLA implementation. Both the INLA and EM-based implementations are available through our open-source BayesfMRI R package.
Keywords— functional MRI, expectation maximization, neuroimaging, Bayesian, spatial model
1 Introduction
Task-based functional magnetic resonance imaging (fMRI) data measure the blood-oxygen level-dependent (BOLD) response, an indirect measure of neural activity, while a subject performs tasks (Lindquist, 2008; Poldrack et al., 2011). These relatively high spatial and temporal resolution data are widely-used, non-invasive experimental measures that allow researchers to study the way that the human brain works in vivo. fMRI data exhibit a low signal-to-noise ratio, requiring analyses to be as statistically efficient and powerful as possible to produce accurate results that reflect the full extent of activation rather than detecting only the extreme values. Traditional massive univariate analysis methods treat locations within the brain as independent before any clustering analysis methods are applied to the results, which diminishes the ability for models to make reliable conclusions about which areas of subjects’ brains are associated with a task (Elliott et al., 2020). Sophisticated models that leverage the spatiotemporal dependence structure of the data would improve inferential power, but estimating such models is difficult due to the size and complexity of the data. Recent advancements in computer processing and storage technology have begun to enable more complex analyses of fMRI data, improving the ability of scientists to detect brain signals amidst the noise of measurement and physiological mechanics. Recent models attempt to account for either spatial or temporal dependence, though often at the cost of computational efficiency.
The BOLD response is measured as an image array comprised of volumetric pixels, or voxels, each typically having a volume of about 8. A commonly-used modeling technique is known to the neuroscience community as the general linear model (GLM)111The meaning of GLM in the neuroimaging community is not to be confused with generalized linear models in the statistical sense. The term GLM has expanded beyond task fMRI to basically refer to any massive univariate regression model approach.. The classical GLM regresses the time series of measurements for each voxel individually against task covariates to determine the effect of the task on neural activity around the brain (Chatfield and Collins, 2018; Friston et al., 1994). These regressions can be used to test whether a specific voxel has a statistically significant association with the task covariates and is thus “activated” by a task. The classical GLM requires multiple comparisons corrections due to the massive number of voxels being tested. Cluster-based methods help to incorporate spatial information in determining activation (Poline and Mazoyer, 1993; Poline et al., 1997; Smith and Nichols, 2009) but are post-hoc and do not benefit the statistical efficiency of the estimates, which will limit power. Parametric assumptions about spatial dependence used in these methods have been shown to be unrealistic in volumetric fMRI data (Eklund et al., 2016, 2019).
An alternative is to avoid massive univariate analysis and instead perform analysis using spatial Bayesian methods, examining the posterior probability distribution of all voxels together to determine where activations occur. Such techniques explicitly state the assumptions about spatial dependence made in the model through the prior distributions, avoiding the pitfalls of null hypothesis testing. Bayesian models can leverage spatial information through a prior that allows for nonzero covariance between adjacent data locations in space and time. Several spatial Bayesian methods for volumetric fMRI have been proposed, typically relying on variational Bayes (VB) methods to decrease computational load (Penny et al., 2005) at the cost of underestimating posterior variance and poorly estimating the posterior mode (Wang and Titterington, 2005; Bishop and Nasrabadi, 2006; Rue et al., 2009; Sidén et al., 2017). Zhang et al. (2016) utilized a Bayesian nonparametric framework to detect activations using both Markov chain Monte Carlo (MCMC) and variational Bayes (VB) methods for both single and multiple subjects, though even the VB method is rather expensive and requires dimension reduction. Sidén et al. (2017) proposed a fast method using a spatial prior on volumetric single-subject data using both MCMC and VB methods that scale well, but does not allow for group analyses. Guhaniyogi and Spencer (2021) and Spencer et al. (2020) used shrinkage priors and tensor decompositions to model volumetric task-based fMRI for both single and multiple-subject studies that rely on MCMC methods, which are time-consuming. However, all of these studies apply spatial priors on volumetric data using Euclidean distance to determine covariance, which does not represent the folded nature of the cerebral cortex. This results in signal being averaged across volumetric pixels that are close together in space though they may be neurologically distal due to their location on different folds of the cortex, often as part of functionally or anatomically distinct cortical regions. In addition, spatial methods used with volumetric data implicitly blur activation signal with noise from white matter and cerebrospinal fluid.
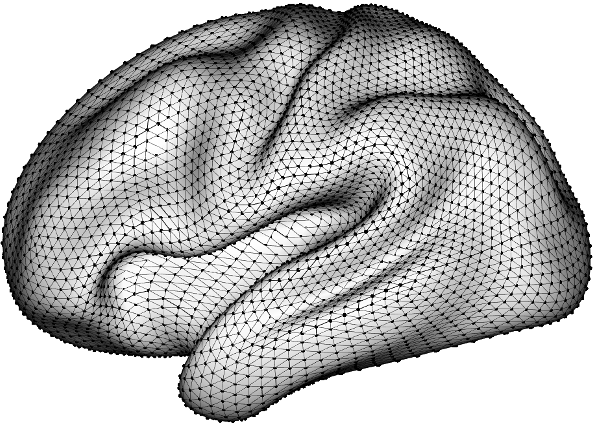
Recently, Mejia et al. (2020) proposed a surface-based spatial Bayesian (SBSB) GLM for cortical surface fMRI (cs-fMRI) data. Such data use a triangular mesh to represent the spatial configuration of the cortical surface. This mesh can be used to find the geodesic distances between points on the surface. These distances appropriately account for the cortex’s folded structure, unlike Euclidean distances in the volume. The SBSB GLM uses a stochastic partial differential equation (SPDE) prior, which is built on a triangular mesh and does not require a regular lattice structure. The SPDE prior is advantageous because it approximates a continuous Markov random field, it is invariant to finite resamplings, which allows for different resolutions in fMRI data, and it allows for dependence in neighboring data locations while keeping computational cost low through sparse precision matrices. In addition, results from single-subject analyses can be combined in a principled manner for group-level inference. Spencer et al. (2022) performed a comprehensive validation study of the SBSB GLM based on test-retest task fMRI data from the Human Connectome Project, showing gains in accuracy and power over the common practice of spatially smoothing data before model-fitting.
For Bayesian computation, Mejia et al. (2020) fit the SBSB GLM model using an empirical Bayes version of the integrated nested Laplace approximation (INLA) through the R software package R-INLA. The package is a powerful computational resource for spatial modeling, offering efficient backend code written in C++ that utilizes fast matrix operations and allows for parallelization via the PARDISO sparse linear algebra library (Alappat et al., 2020; Bollhöfer et al., 2020, 2019). These features of R-INLA drastically reduce model fitting times. However, there are some limitations of INLA in this context. First, the numerical approach to integrating out model hyperparameters used in INLA requires approximating their joint posterior using a multivariate Gaussian, which is memory intensive for more than 5 to 10 hyperparameters, effectively restricting its application to relatively simple task fMRI experimental designs (Opitz, 2017). Previous work has reported memory requirements of 30 - 50 GB for simple single-subject task analysis (Mejia et al., 2020), and in our experience, it is not uncommon to exceed 75GB of memory usage in many practical settings. Second, there are some challenges in developing and maintaining software that depends on R-INLA, which is not available on the Comprehensive R Archive Network (CRAN) and does not install easily on many systems. Therefore, carrying out model estimation can be especially difficult for researchers that do not administer their own computing. Third, in order to achieve reasonable computing speeds, a license for the PARDISO library is required, which is not always freely available. Finally, at the data scale of functional MRI, INLA requires significant system memory to run, which is prohibitive for some research teams.
In order to address these issues, in this paper we develop an efficient expectation-maximization (EM) algorithm (Dempster et al., 1977; Gelman et al., 2013) to produce posterior estimates and inference of activation for subject-level task in the SBSB GLM. We also develop results from these analyses that are combined across subjects in a principled way to identify group-level effects in multi-subject analysis. We compare this EM algorithm to the INLA-based implementation of the SBSB GLM from Mejia et al. (2020) using both simulated data and motor task fMRI data from the Human Connectome Project (HCP) (Barch et al., 2013). Using simulated data, we find that the EM algorithm achieves similar accuracy while cutting computation time dramatically. All model fitting and preprocessing steps have been implemented within the open source R package BayesfMRI222https://github.com/mandymejia/BayesfMRI/tree/1.8.EM.
This article will proceed with a description of the SBSB GLM and details of our EM algorithm in Section 2. Next, we compare our proposed EM algorithm with INLA in a study of simulated cortical surface fMRI data in Section 3. We show results from a study of task fMRI data from the HCP in Section 4. We end with conclusions and discussion of future work in Section 5.
2 Methodology
We will use the following matrix notation throughout this section. Fixed matrix-valued quantities will be represented using upper-case bold font, , while vectors are in lower-case bold font , and scalars are non-bold font in both upper- and lower-case, . Parameters in the model follow the same convention using Greek letters, i.e. represents a matrix, represents a vector, and represents a scalar. and represent the determinant and the trace of matrix , respectively. Following this convention, we now introduce the modeling methodology.
2.1 The surface-based spatial Bayesian general linear model
Consider cortical surface fMRI (cs-fMRI) data from a scan, a time series of length represented as for locations for locations in order to model data from a single subject. These data are gathered while a subject completes different tasks at specific time intervals. The expected BOLD response to task , , is generated by convolving the binary stimulus timing function (on/off) with a canonical haemodynamic response function (HRF) representing the time-lagged BOLD response that follows neuronal firing. After preprocessing the data to reduce noise, eliminating the baseline signal, and inducing residual independence as outlined in A, the general linear model can be written in the form
| (1) |
where is the activation effect in terms of percent signal change at location for task . Note that the task-based regressors vary across locations . This is because our preprocessing includes location-specific (or spatially variable) prewhitening to account for differences in residual autocorrelation across the cortex (Parlak et al., 2022). It is typical to fit this model in a massive univariate manner which we refer to as the classical GLM, which is able to be fitted quickly, even to high-resolution data. However, this advantage comes at the cost of ignoring the spatial dependence in brain activation, which reduces model power significantly when compared to the Bayesian GLM, as shown in Spencer et al. (2022).
In order to facilitate spatial Bayesian modeling, we rewrite the model in Equation (1) to represent data across all locations and times at once in Equation (2). Here, the preprocessed response at times and locations is explained by linear effects for each of tasks () and an error term .
| (2) |
This linear model facilitates incorporating spatial dependence, in contrast to the separate linear models constituting the classical GLM, which does not include spatial dependence at the model-fitting stage. We fit this model across an entire cortical hemisphere, and the two cortical surface hemispheres are analyzed separately for computational reasons, which does not affect the results because they are represented by separate surface meshes that are physically distinct.
The SBSB GLM incorporates spatial dependence in the activation amplitudes using a special class of Gaussian Markov random field (GMRF) processes known stochastic partial differential equation (SPDE) priors (Mejia et al., 2020; Spencer et al., 2022; Lindgren et al., 2011; Bolin and Lindgren, 2013). The specific construction of the prior is
| (3) | ||||||||
where maps the original data locations to a triangular mesh consisting of vertices. is a fixed diagonal matrix describing the relative mesh vertex precisions. is a fixed sparse matrix describing the neighborhood structure of the mesh vertices, in which entries corresponding to neighboring locations take nonzero values. The mesh is usually created to maximize the minimum interior angle across the triangles, and extra vertices may be added along the boundaries to avoid adverse boundary effects. An example of this mesh structure can be seen in Figure 7. The default setting for the INLA implementation used in Mejia et al. (2020) sets the priors for and to be log-Normal with mean 2 and variance 2. Under the SPDE representation in , the variance of the random field can be represented as where . Spectral theory shows that an integer must be picked for to obtain a Markov field. The form of the prior in Equation (3) assumes , which makes for a surface, which has dimension . Therefore, the variance of the random field simplifies to
| (4) |
The product in the variance remains the same if and for any constant , and early experiments showed that this can cause the EM algorithm to produce values for and in which one approaches infinity while the other approaches zero. Therefore, we rewrite the precision in the SPDE prior in terms of the variance of the random field as
| (5) |
In this form, controls the variance and controls the spatial correlation of the random field.
To avoid blurring across structural boundaries, cortical surface data are already represented on a triangular mesh.
For mathematical convenience, the model in Equation (2) can be rewritten using the notation in Equation (3) to include all task covariates in matrix form:
| (6) |
where is a column-bound matrix of the covariates, is a block diagonal matrix projecting the covariate values onto the triangular mesh, and is the vector of coefficients corresponding to the covariates on the mesh.
2.2 Expectation-Maximization Procedure
In order to provide a computational alternative to INLA for the SBSB GLM, here we derive an EM algorithm (Dempster et al., 1977; Gelman et al., 2013) to find the mode of the posterior distribution of , and by extension , along with maximum likelihood parameter estimates for . This algorithm could be easily extended to incorporate priors on these hyperparameters to account for uncertainty in their values and avoid underestimation of the posterior variance of the latent fields. In addition, we obtain an estimate of the posterior precision of , which can be used in conjunction with the excursions method developed by Bolin and Lindgren (2015, 2017, 2018) to determine areas of activation in the latent fields.
2.2.1 Expectation of the Log-Likelihood Density (E-step)
Beginning with the definition of the joint log likelihood , the expectation of the log likelihood density with respect to given at algorithm step is found to be:
| (7) | ||||
where , such that
In the interest of computational efficiency, we use several identities to avoid expensive matrix inversions (see Section 2.2.3). This avoids the calculation of which is computationally prohibitive, as it requires the inversion of an dense matrix, with between 1,000 and 30,000 in most practical applications. In the next section, we show the MLE of , and we outline the optimization strategy for and .
2.2.2 Maximization of the Log Likelihood Density (M-step)
Next, we expand the expected joint log-likelihood in Equation (7), which we maximize in order to find the MLEs of the elements in .
The two quantities and are scalars, and are therefore equivalent to their trace. The trace operation is invariant to circular permutations, so we can rewrite these two expectations as
We can now write the expected log-likelihood as
| (8) | ||||
The MLE for can be found through the maximization of with respect to :
| (9) |
Next, values for and must be found that maximize the log-likelihood. This is equivalent to optimizing with respect to and . Setting , we rewrite as
| (10) |
so that
The optimal value for is found by maximizing
| (11) |
with respect to . Convergence of the EM algorithm occurs when the average of the squared difference between and drops below a given stopping rule tolerance, , which we set to 0.001 in our analyses. This value is based on a study of different stopping rule tolerances using simulated datasets (see B).
2.2.3 Identities for computational efficiency
In order to perform each step of the EM algorithm, computationally-efficient identities are used in order to reduce time and memory requirements. To begin, to calculate , we solve the linear equation
Here, is sparse and inexpensive to calculate, and the Eigen C++ library (Guennebaud, Jacob, et al., 2010) has efficient routines for solving linear equations of the form when is sparse.
Finding the MLE values for and does not calculating the posterior precision in full, but approximating a trace for the matrix product involving the block-diagonal precision task component . This allows for operations to be performed on smaller matrices and in parallel across tasks. The EM algorithm requires finding a trace of the form for the hyperparameters and . This trace form can be simplified as
The calculation of is done via approximation using the Hutchinson trace estimator (Hutchinson, 1989). To begin, consider the following linear system , where is a lower-dimensional approximation to the inverse of , is a random matrix taking the values of 1 and -1 with equal probability, and is the size of the estimator. We choose to use in our analyses because it limits the relative error of the approximation to about 10% with 95% probability (Skorski, 2021). The symbolic representation of the Cholesky decomposition of is calculated before beginning the EM algorithm, reducing the memory and time requirements at each iteration when solving for . We update with new random values at each EM iteration to reduce sampling bias in the approximation. Combining these strategies results in the trace approximation
This method reduces the computation time of estimating the trace from to where .
The speed of the EM algorithm is improved through the use of the squared extrapolation (SQUAREM) method developed by Varadhan and Roland (2004) in order to reduce the total number of evaluations of the fixed-point function at any EM algorithm iteration . Code for the SQUAREM method in C++ is adapted from the ashr R package (Stephens et al., 2022).
All computations are implemented in the BayesfMRI package in R (Mejia et al., 2022), which uses the Rcpp and RcppEigen packages (Eddelbuettel and François, 2011; Eddelbuettel, 2013; Bates and Eddelbuettel, 2013) to implement C++ code. We rely upon the Eigen template library for linear algebra in C++ (Guennebaud et al., 2010) to achieve significant speed improvements for linear algebra operations.
Time to convergence is substantially decreased by using the classical GLM estimates for to inform the initial hyperparameter estimates . Initial values and are found by iteratively solving the following two equations until a threshold of convergence is met.
Finally, the variance in the residuals from the classical GLM is used as the initial value for the observed variance (). This computationally-efficient algorithm allows for rapid convergence to Bayesian estimates for the hyperparameters at the subject level, which can then be combined to allow for group-level inference.
2.3 Multi-subject analyses
Mejia et al. (2020) develops a joint multi-subject model that combines results across multiple single-subject models by taking a weighted average of their hyperparameters (), which results in the multi-subject posterior distribution for the SPDE hyperparameters. Our own multi-subject model differs because each single-subject result returns a point estimate of the maximum a posteriori values for for each subject , rather than a distribution. For our multi-subject model, we assume that the values found in the single-subject analysis are noisy estimates of the fixed true values of . Therefore, in order to find the maximum a posteriori values for across all subjects, the multi-subject estimate of the SPDE hyperparameters is found as
where is a vector of the maximum a posteriori values found for each subject and is a weight assigned to each subject’s observation, which can be assigned based on the amount of data in each subject’s scan and their respective noise levels. We then adjust the posterior distributions of found for each of the subjects to reflect these updated hyperparameter values, calculating as in Equation (10) using :
Next, samples are taken from these updated posterior distributions for the subjects, and a contrast vector is specified in order to find the multi-subject posterior distribution for a linear combination of tasks and subjects. For example, if an equally-weighted average of the task activation amplitudes across all subjects for the first task is desired, then the contrast vector would take the form
A contrast matrix is then created using the Kronecker product such that and the multi-subject posterior draws for the average activation amplitude for task 1 is found to be , where , and is a column-bound matrix constructed where and is the vector of the th draw from the posterior distribution of . This principled combination of single-subject results provides the distribution of a multi-subject average activation amplitude effect, which can be used with the excursions method to determine population-level areas of activation, as discussed in the next section.
2.4 Determination of Activation
In addition to assessing an estimate of an effect size for brain activation, it is also desirable to determine which regions of the brain are significantly activated above a given threshold. The Bayesian GLM proposed by Mejia et al. (2020) and validated by Spencer et al. (2022) takes advantage of the posterior distributions for the activation effects at all data locations on the cortical surface or subcortical volume through the use of the excursions set method proposed by Bolin and Lindgren (2015). The excursions method examines the joint distribution of the activation for task and location . Specifically, the excursions method finds the largest set of data locations such that for a given threshold and credible level . This is done using the posterior distributions, either at the single- or multi-subject, for the activation amplitudes . Implementation of the excursions method has been done in the excursions package in R (Bolin and Lindgren, 2015, 2017, 2018), which is used by the BayesfMRI package.
3 Simulated Data Analysis
Data were simulated for cortical surface in R using our brainSim333https://github.com/danieladamspencer/brainSim/tree/1.0 package. This package generates functional MRI data on the cortical surface using design matrices with spatially-dependent coefficients and temporally autoregressive error terms. The software can simulate data for a variable number of subjects, scanning sessions, and scanning runs, which allows for nested individual, session, and run variances from a “true” global coefficient.
3.1 Single-subject analysis
We begin with simulations for a single subject, simulating data under nine different conditions. These conditions are the combination of resampling resolution at cortical surface vertices per hemisphere, and setting the number of tasks to be . Under these conditions, the length of the scan is set to , and the maximum value for the spatial coefficient is set to 2. Under these conditions, the average value for the nonzero true coefficients is approximately 0.5 due to spatial smoothing in the data generation. The error term was set to have a variance of 1, and the error was assumed to be temporally independent.
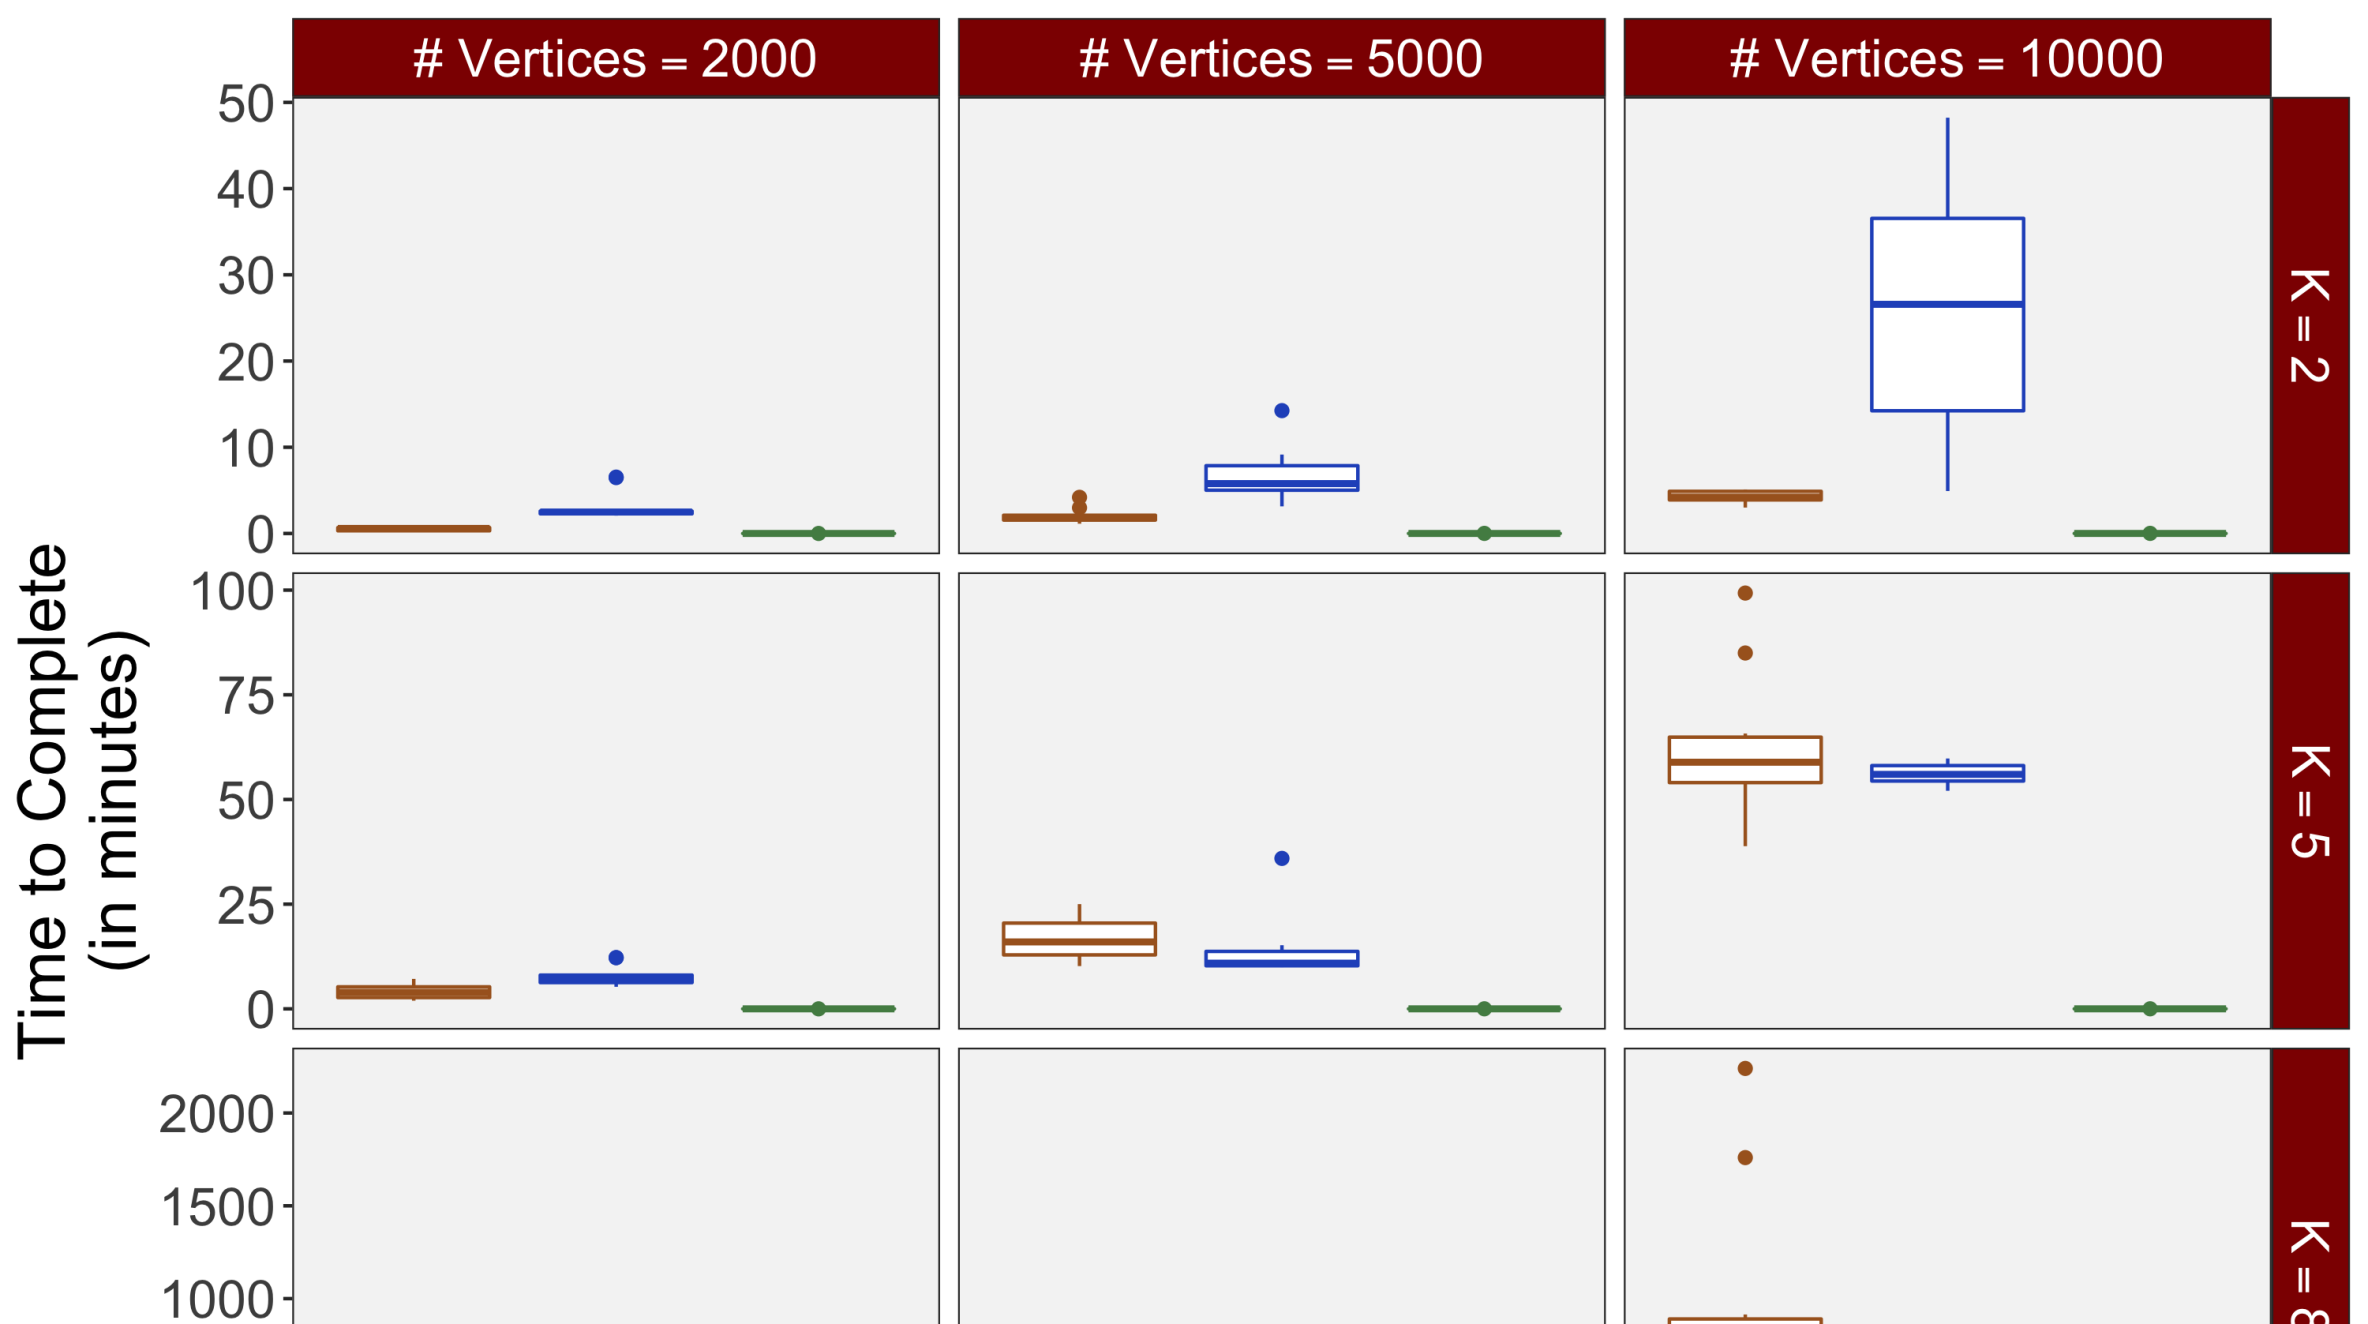
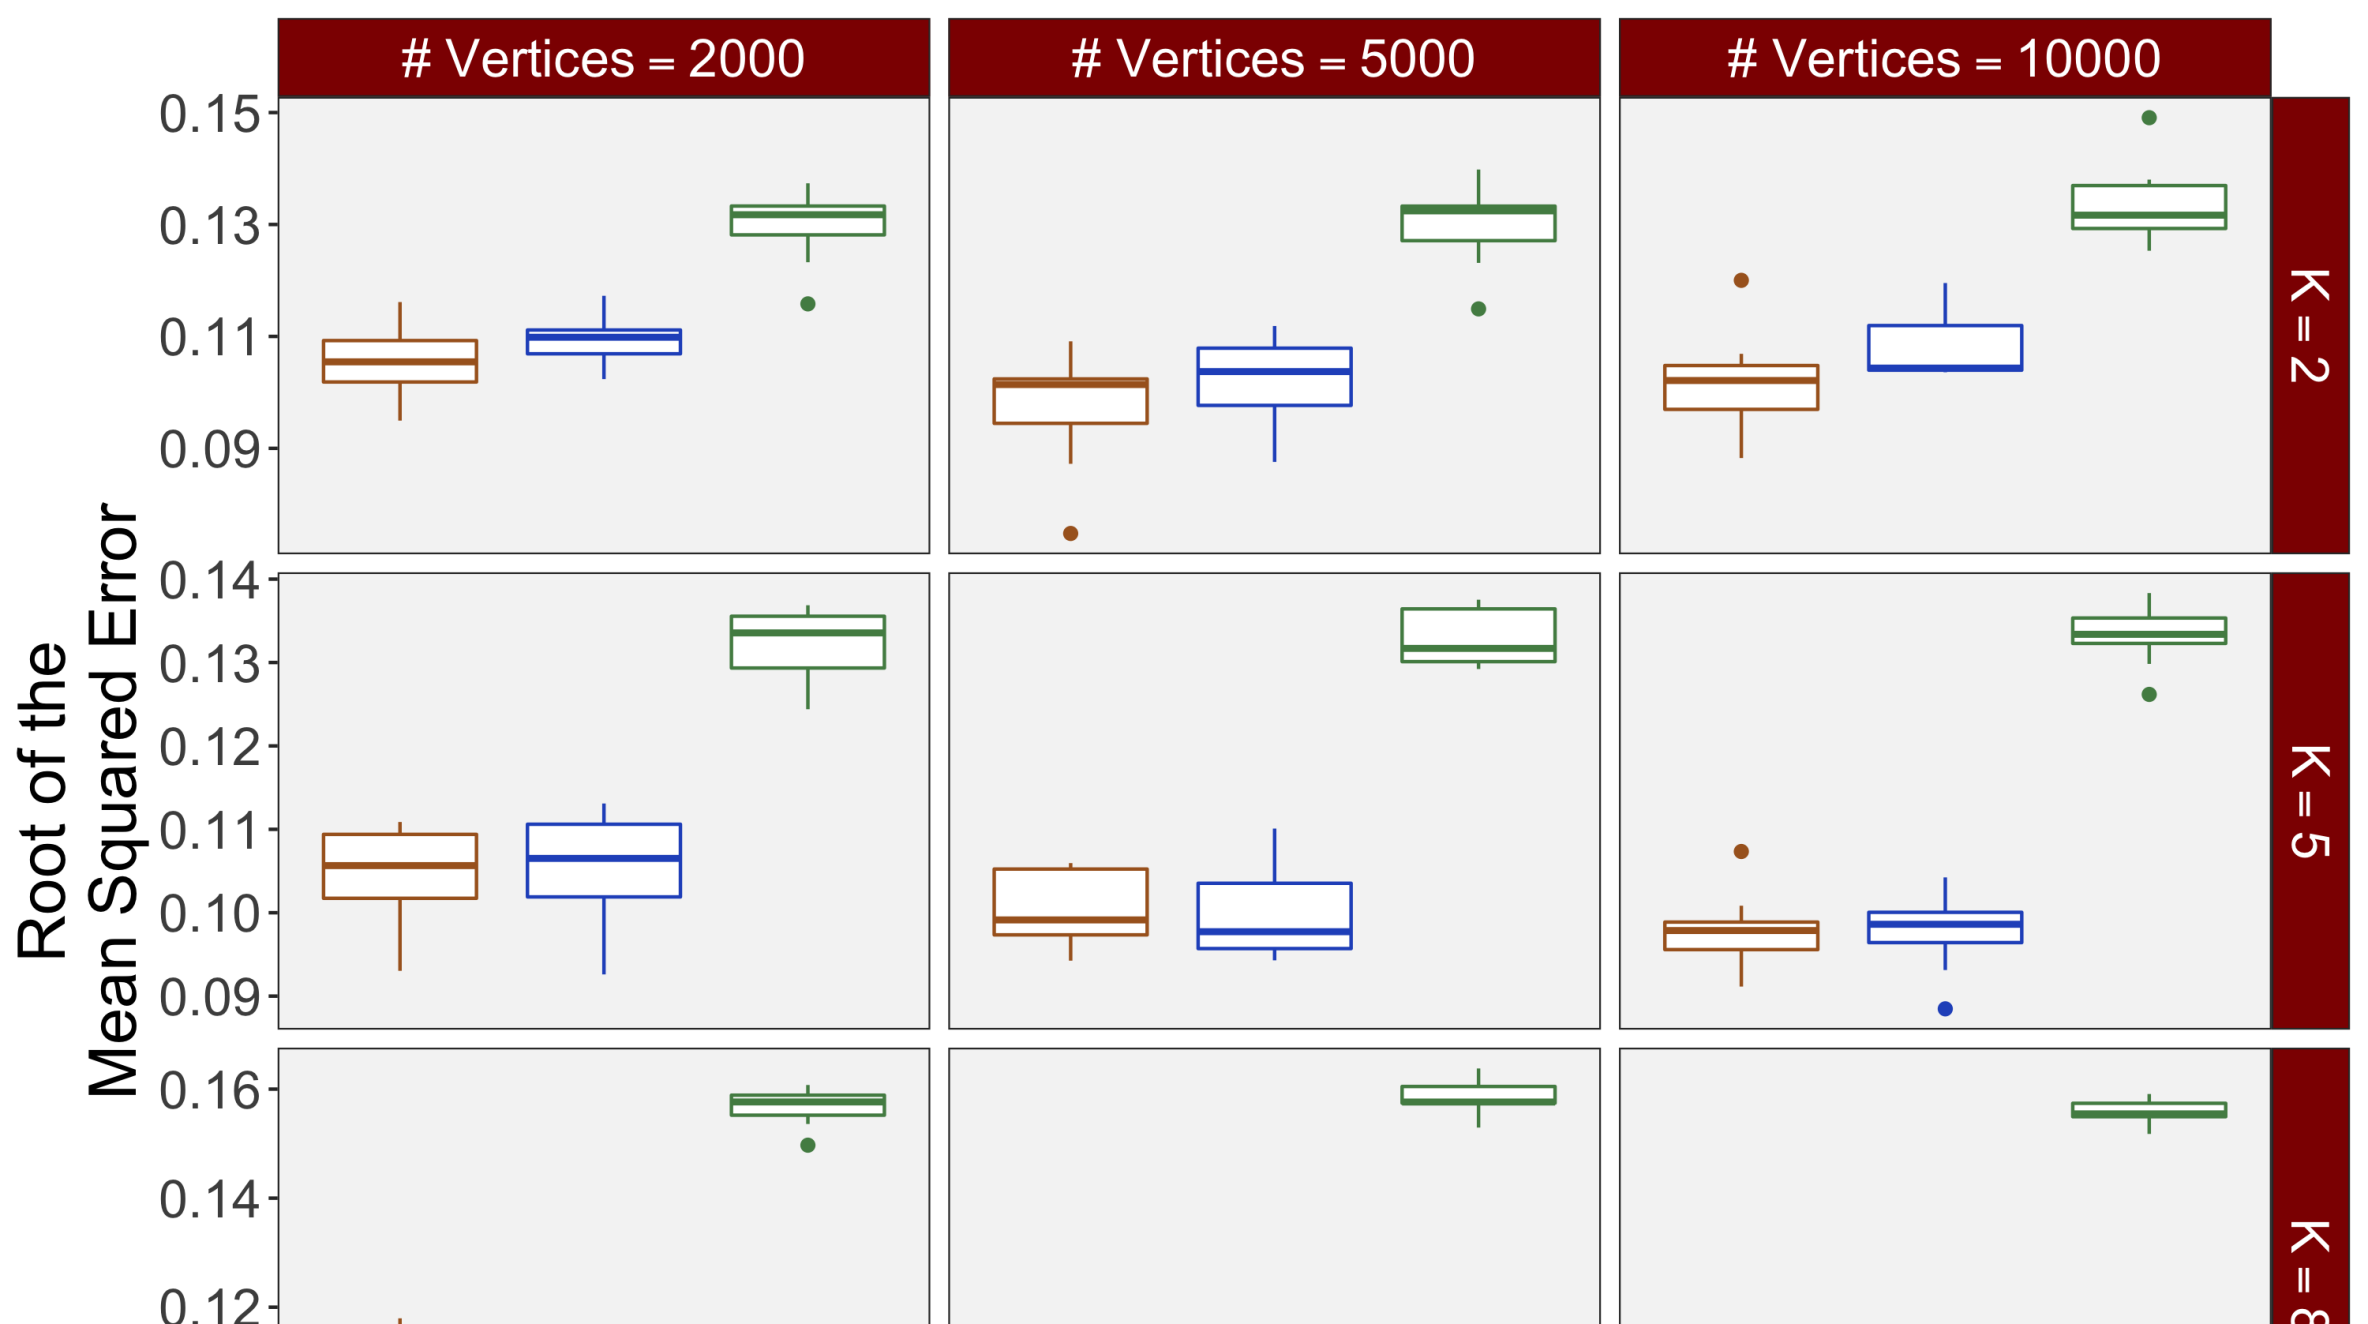
Each of the nine conditions was used to generate 10 datasets, which were all fit to the classical GLM, and the SBSB GLM using the INLA and EM implementations. The INLA implementation allows for the use of the PARDISO linear algebra library (Alappat et al., 2020; Bollhöfer et al., 2020, 2019), which allows for multiple processor threads to be used in expensive matrix solve computations. In these trials, the INLA implementation is allowed to use 6 threads as an advantageous setting for analysis. We compare the results in terms of the amount of time to perform the analysis after preprocessing (Figure 1(a)) and in terms of their root mean squared error (RMSE) (Figure 1(b)). These results show that the EM implementation is faster in terms of computation time than the INLA implementation when the number of tasks () is relatively small. The speeds are similar when , but the INLA implementation is currently faster than the EM implementation due to faster solve times stemming from its use of the PARDISO library. Implementing the EM algorithm to take advantage of a solver that allows the use of multiple cores is likely to further increase its speed, potentially outstripping the INLA implementation in terms of computation time across all settings. However, no parallelization libraries are currently available across UNIX and Windows systems that are also compatible with the RcppEigen library. Using the RMSE measure, the EM implementation’s accuracy is similar to that of the INLA implementation, though it is important to note that the INLA implementation failed to converge in the analysis of 13 of the 90 datasets, and thus did not produce estimates in these cases. Twelve of these datasets had the condition that , and of those, 7 had . This suggests that the EM algorithm is more stable than the INLA implementation when evaluating experiments with few tasks as resolution increases. A visualization of an estimated and true coefficient surface for the sampling condition when and can be seen in Figure 2(a).
Under the simulation condition with resolution and number of tasks , simulated data were generated for two runs in a single session to allow for sharing of the hyperparameters across the runs. The INLA and EM implementations of the Bayesian GLM were then used to analyze the first run by itself and the two runs combined. The effect estimates and activations illustrating the difference in the 1- and 2-run analyses can be seen in Figure 2. As there is a small run effect simulated in the generation of the data, the true values of the activation amplitude are not identical between the two runs. Therefore, the true coefficient nonzero region in the single run is not centered exactly in the same location as the true nonzero coefficient region across both runs. In terms of both the coefficient estimation and activation, the EM implementation performs very similarly to the INLA implementation. The posterior standard deviations for the activation amplitudes for a single-run analysis are shown for the EM and INLA implementations in Figure 8, which shows that the posterior standard deviations are slightly lower in the INLA implementation due to the prior imposed on the range and variance hyperparameters.
| 1 Run | 2-Run Average | |
|
Truth |
\addvbuffer[3pt 0pt]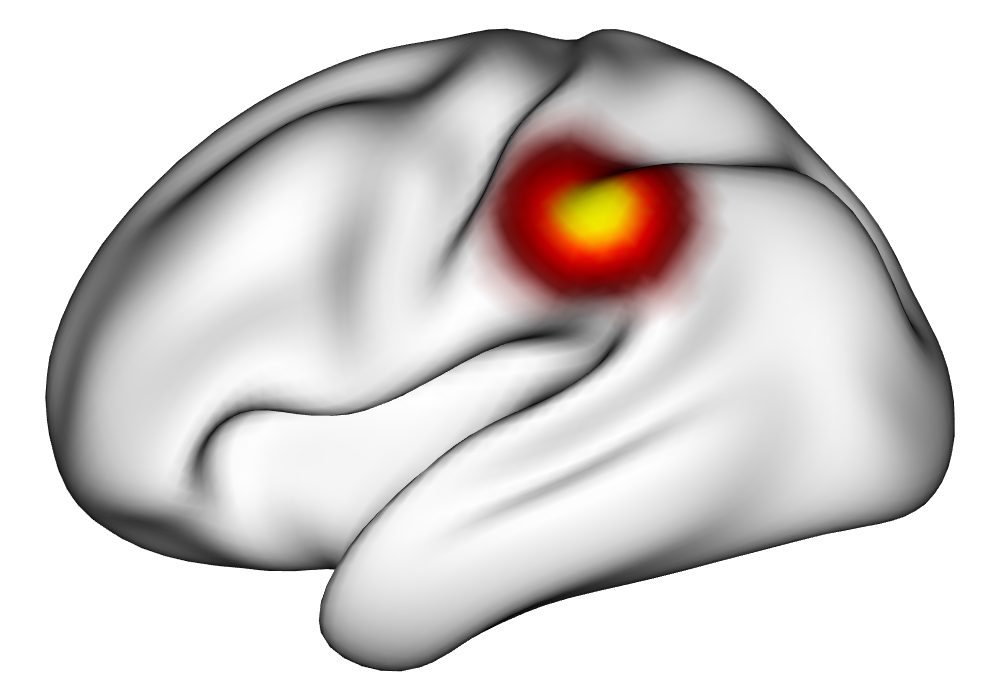
|
\addvbuffer[3pt 0pt]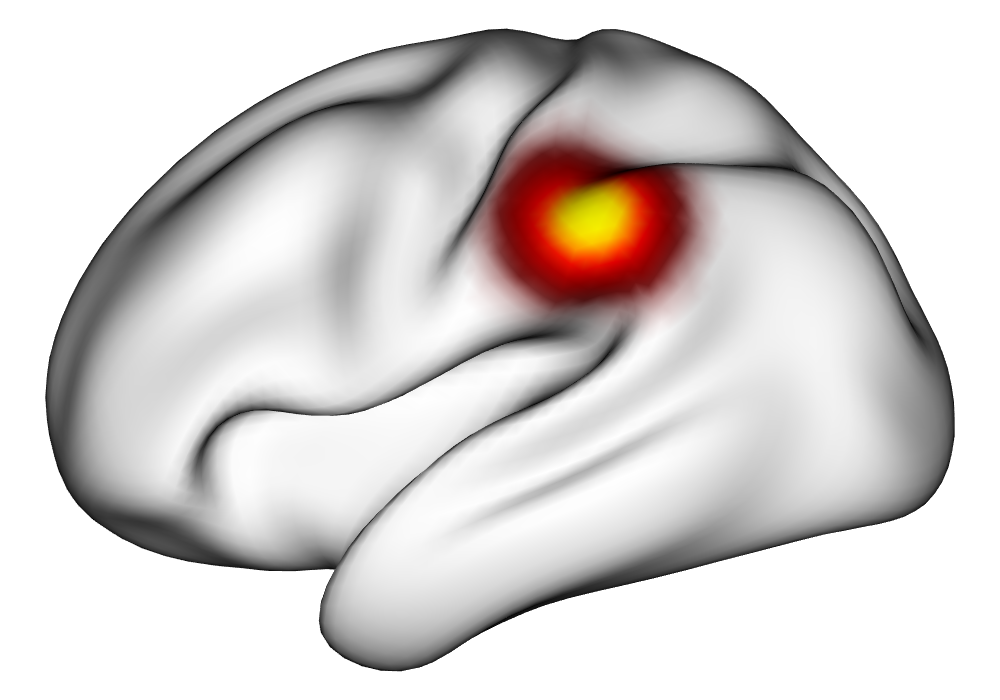
|
|
|
|
|
|
EM |
\addvbuffer[3pt 0pt]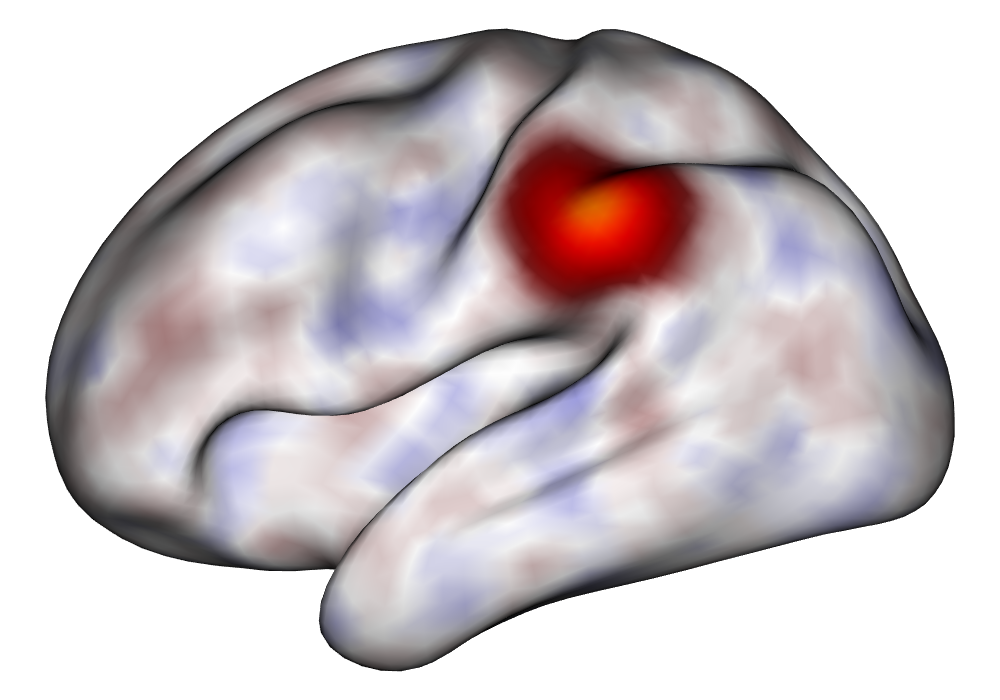
|
\addvbuffer[3pt 0pt]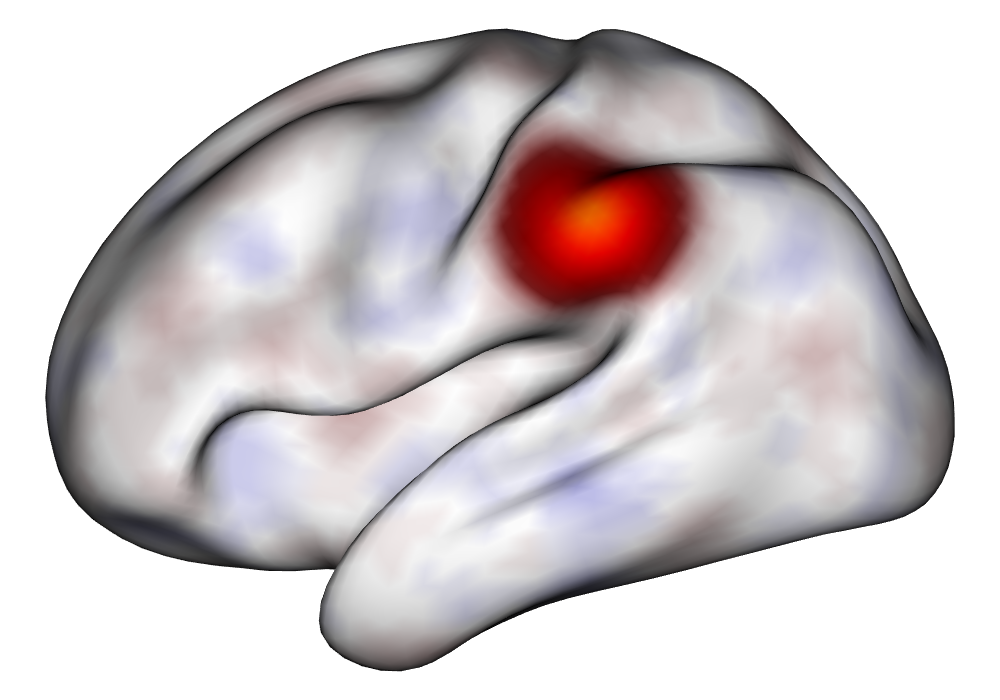
|
|
INLA |
\addvbuffer[3pt 0pt]
|
\addvbuffer[3pt 0pt]
|
|
Classical |
\addvbuffer[3pt 0pt]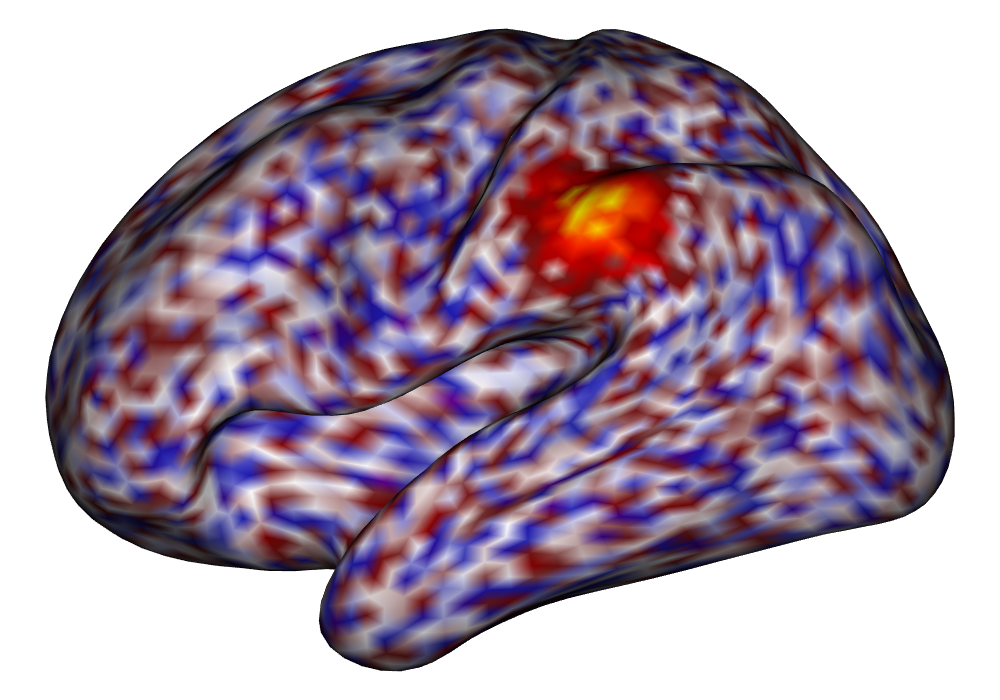
|
\addvbuffer[3pt 0pt]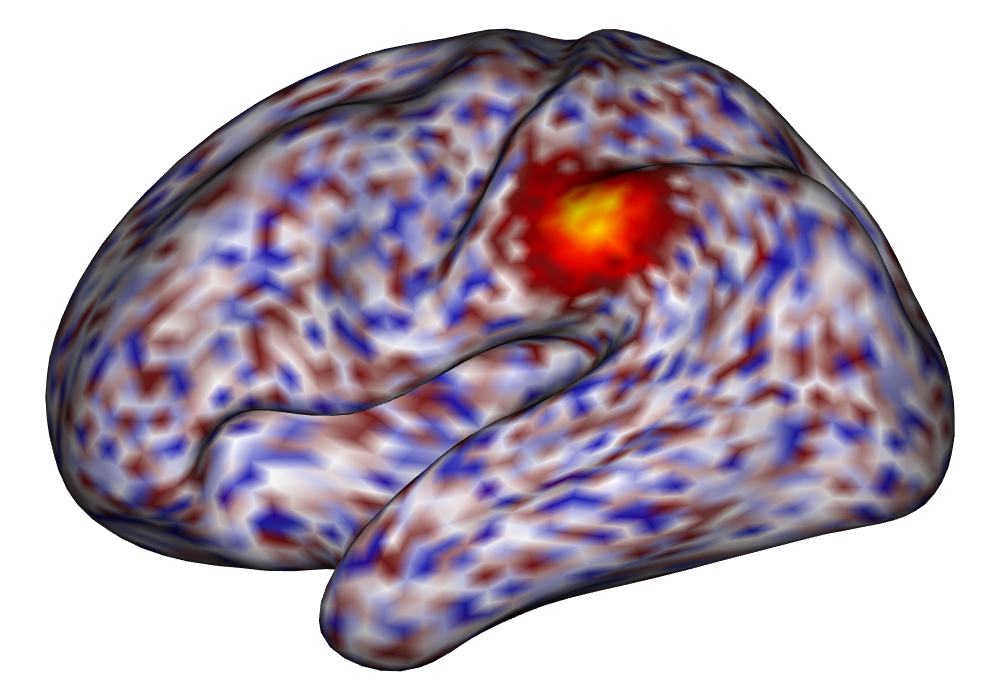
|
|
|
 |
|
| 1 Run | 2-Run Average | |
|
Truth |
\addvbuffer[3pt 0pt]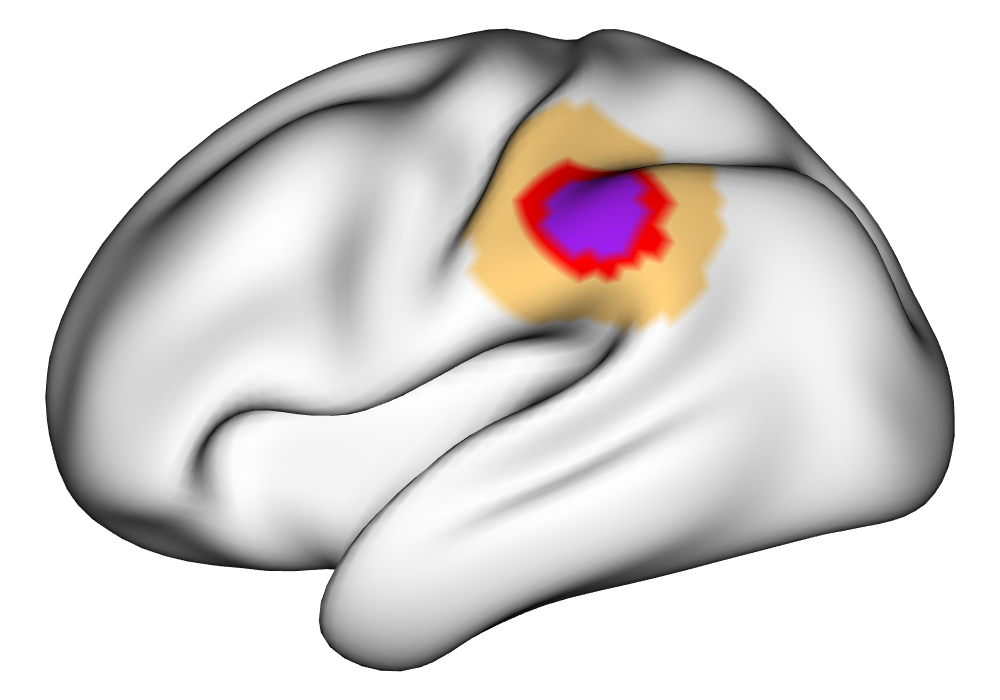
|
\addvbuffer[3pt 0pt]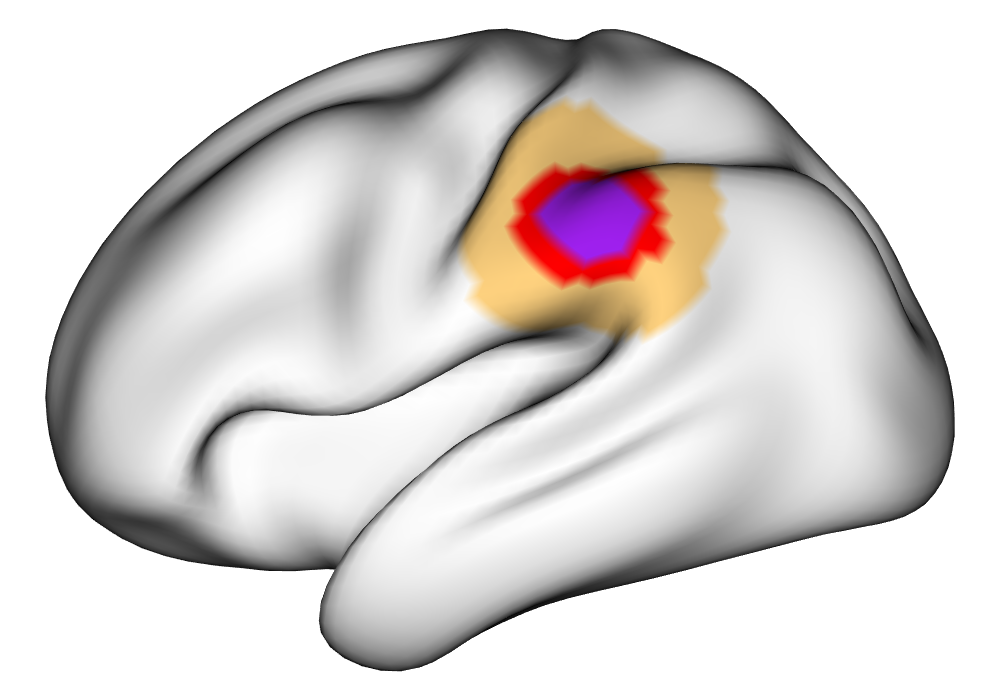
|
|
|
0% 0.5% 1% | |
|
EM |
\addvbuffer[3pt 0pt]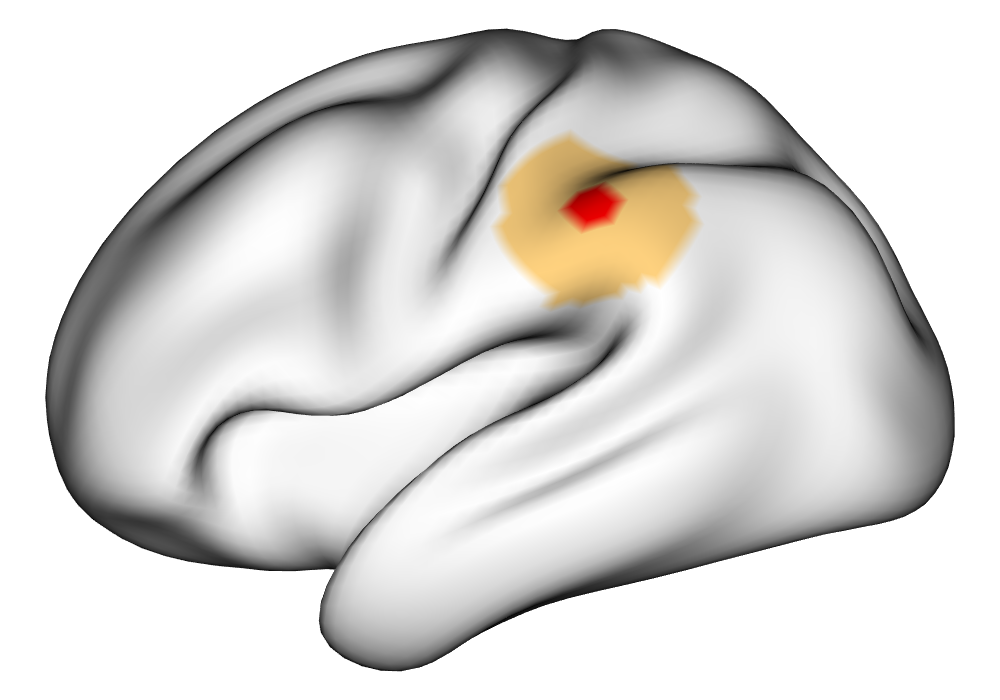
|
\addvbuffer[3pt 0pt]
|
|
INLA |
\addvbuffer[3pt 0pt]
|
\addvbuffer[3pt 0pt]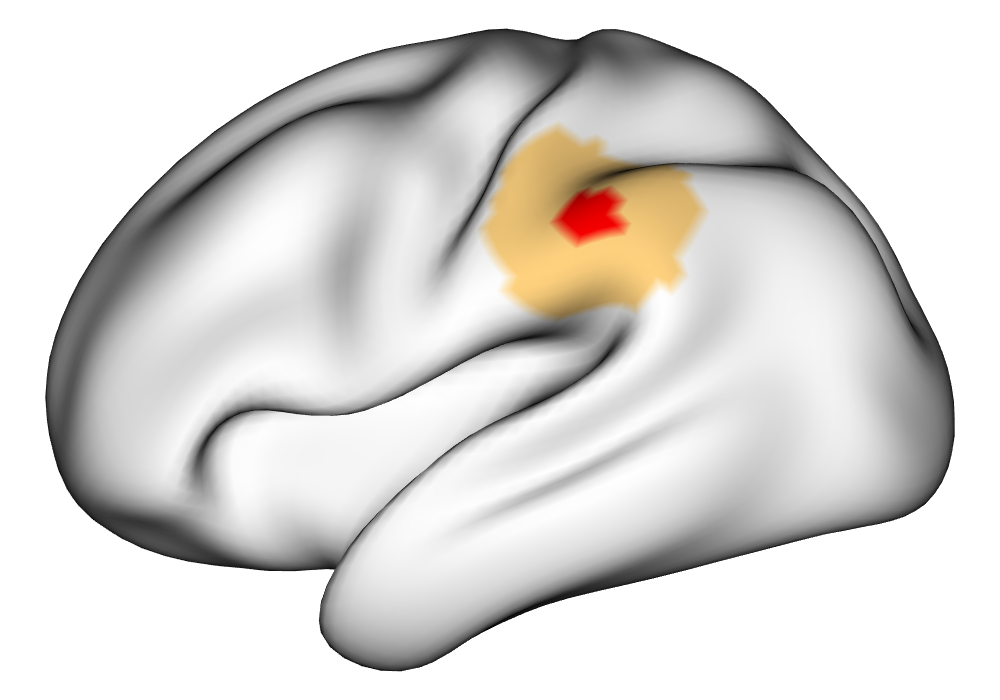
|
|
Classical |
\addvbuffer[3pt 0pt]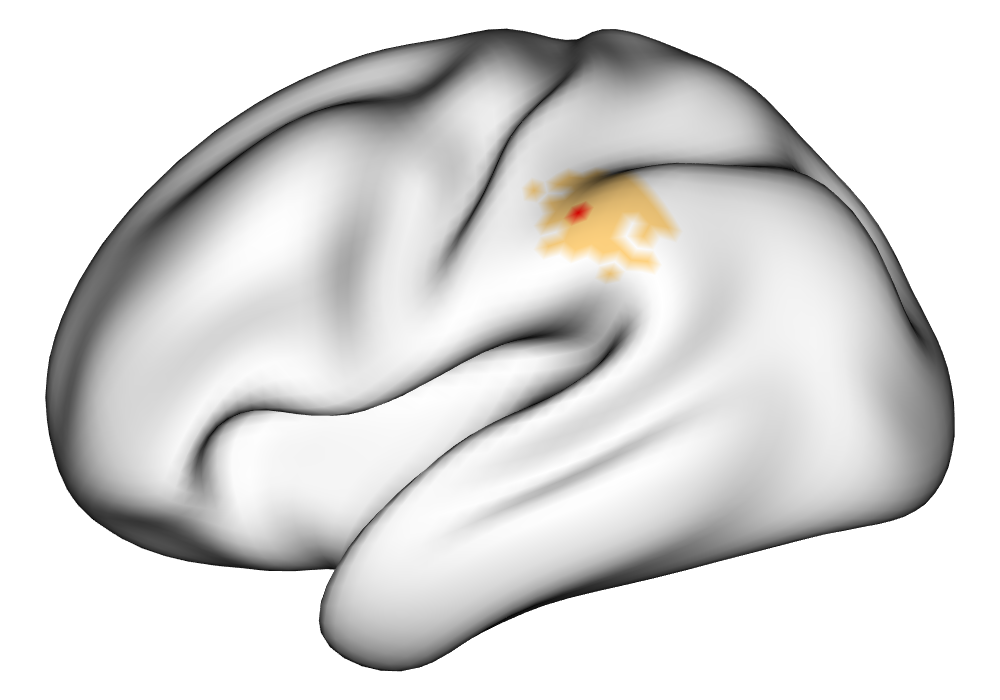
|
\addvbuffer[3pt 0pt]
|
|
|
0% 0.5% 1% | |
3.2 Multi-subject analysis
In order to compare the performance of the multi-subject analysis between the EM and INLA implementations of the SBSB GLM and the classical GLM, we generated a simulated population of 100 subjects with true amplitude maps with location translations from a population amplitude map by an average of 5mm. Each subject’s data were simulated at a resolution of about 5,000 vertices per hemisphere, with a TR of 1 second for a total length of 300 seconds. Two tasks were included in the simulation, each with a maximum true signal-to-noise ratio of 2 in the simulation before the BOLD response and design matrices were scaled. Each subject’s data was analyzed separately following the single subject analysis for the EM and INLA implementations of the SBSB GLM and the classical GLM as outlined in Section 2.1. Next, 100 different subsets of size 10 were drawn from the population, and the multi-subject analysis was performed using the single-subject analysis results from the subjects within the subset. For each multi-subject analysis, the square root of the mean squared error was found with respect to the true simulated population amplitudes. The Dice coefficient (Dice, 1945) is a measure of set overlap between sets and found as
where is the number of elements in set and is the intersection of sets and . The Dice coefficient can take values between 0 and 1, and higher values indicate more overlap between sets. We calculate the Dice coefficient between the set of locations with true positive activation amplitudes in the population and the set of locations determined to have amplitudes significantly greater than zero () in each subset for each modeling method, as outlined in Section 2.4.
Figure 3(a) shows the true value for the multi-subject activation amplitude for a single task, as well as the locations where the true amplitudes are greater than signal change in the analysis of a single 10-subject subset. The EM and INLA implementations of the SBSB GLM produce similar amplitude estimates and areas of activation, showing attenuation between the true values and the estimates. In contrast, the point estimates from the classical GLM show many values that are appreciably distant from zero in the true zero-valued region, while only finding one location that is significantly different from zero within the true nonzero-valued region. None of the modeling methods found any locations in which the amplitude was found to be significantly greater than 0.5% due to the attenuation expected in the Bayesian model and the low power of the classical GLM. For the Bayesian GLM implementations, the areas of activation are found using the excursions method, and are found as areas deemed jointly greater than threshold with probability 0.01. For the classical GLM, the areas of activation are found by hypothesis test after fixing the false discovery rate at 0.01.
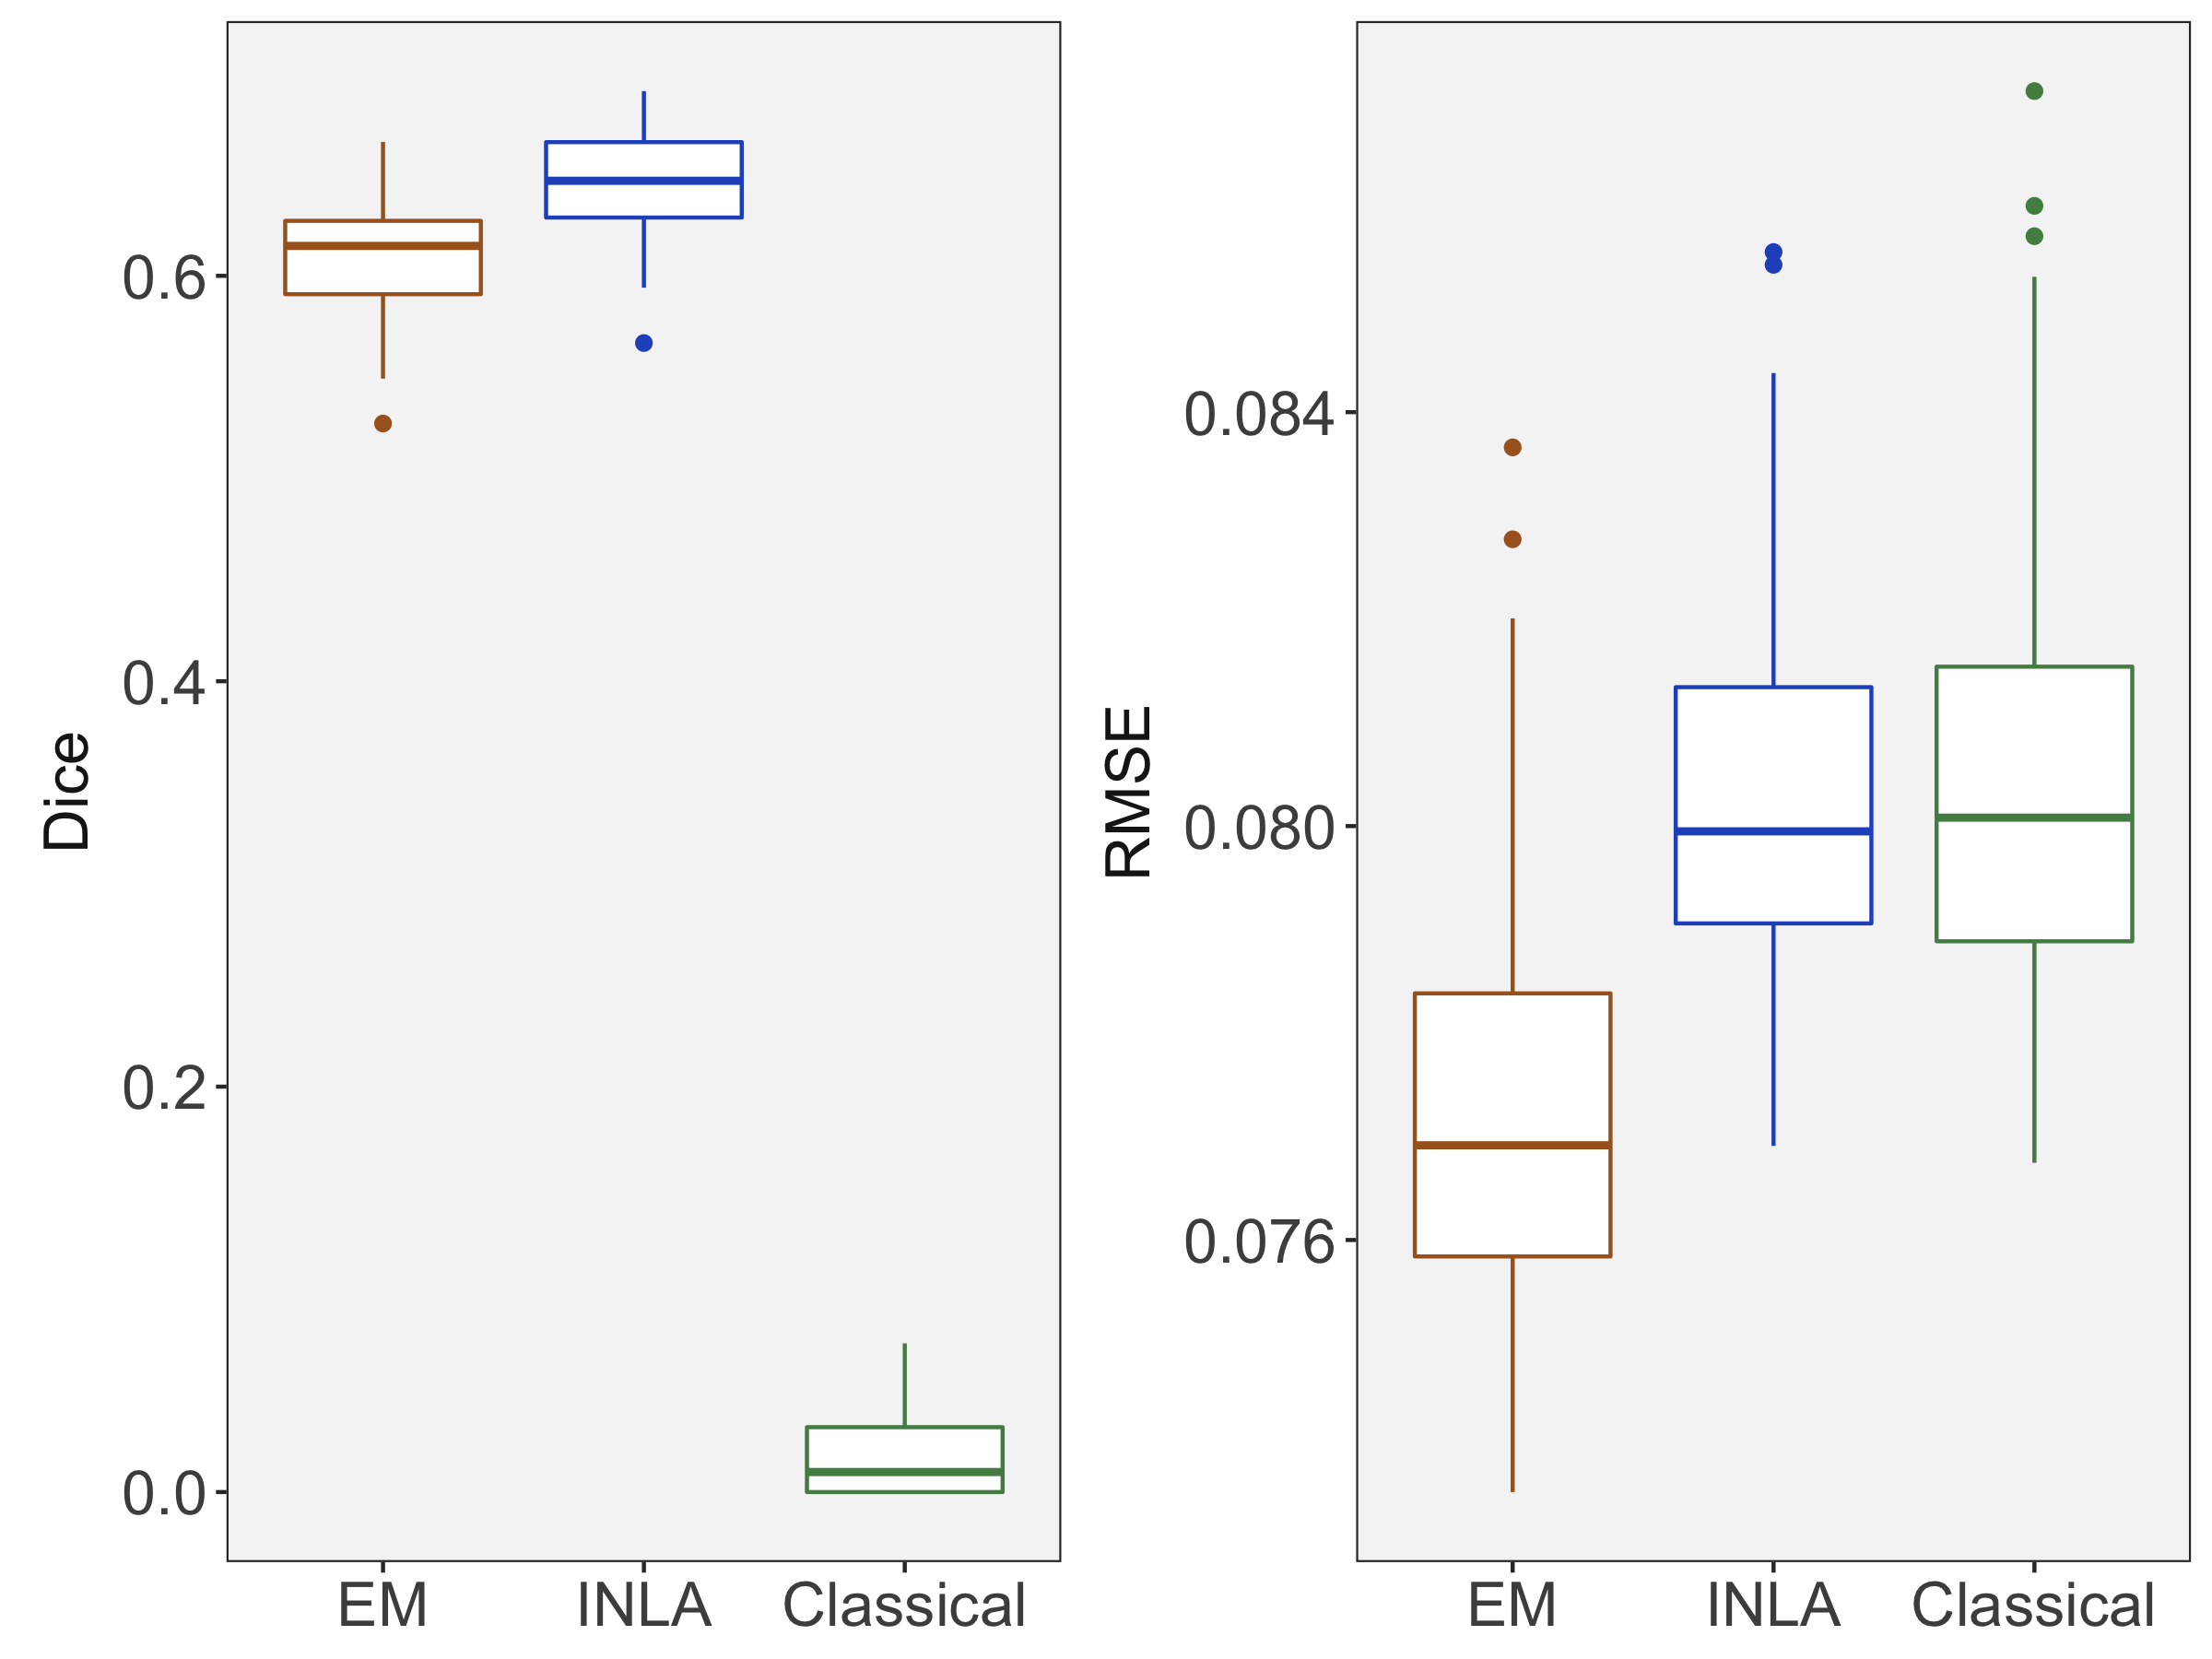
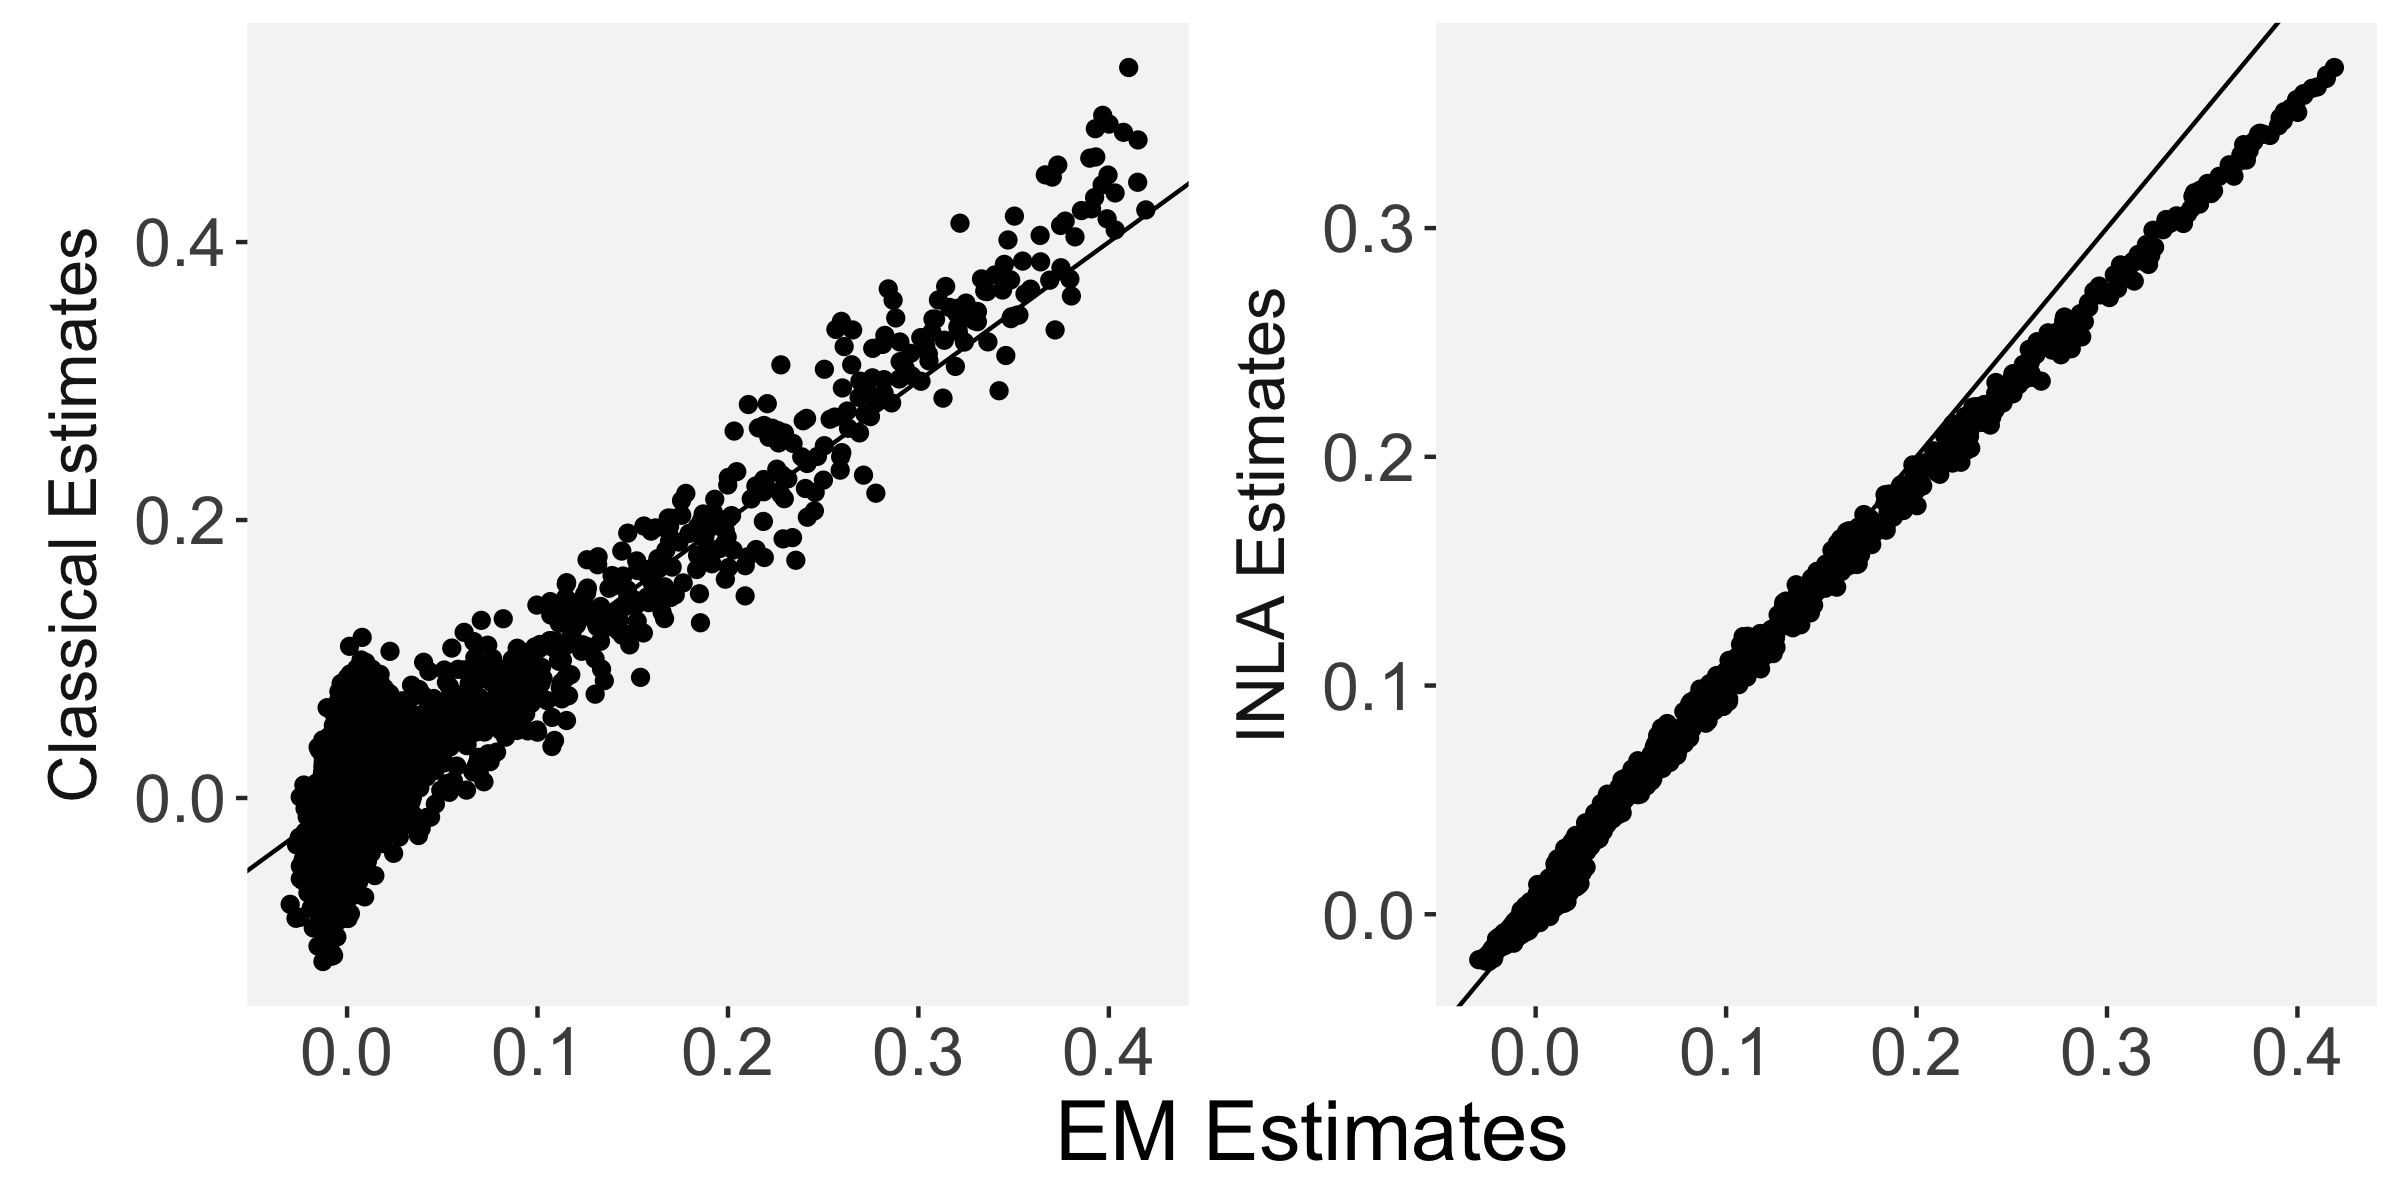
Figure 3(b) shows the calculated values for the square root of the mean squared error (RMSE) and the Dice coefficient for each of 100 subsets of ten subjects each in order to compare the accuracy between the different methods. The true amplitude values for the whole population of 100 simulated subjects was used to determine the values of the measures of accuracy, rather than the true values for each of the subsets, as population-level inference is the goal of the multi-subject analysis. The EM implementation of the SBSB GLM exhibits generally lower values for the RMSE than the INLA implementation and the classical GLM, while exhibiting only slightly lower values for the Dice coefficient. The EM estimates exhibit slightly less attenuation than in the INLA implementation (shown in Figure 9), which is expected because no prior distributions are assumed on the hyperparameters in the EM implementation. The classical GLM performs poorly in terms of the Dice coefficient compared to both implementations of the SBSB GLM. These analyses suggest that the multi-subject analysis using the EM implementation of the SBSB GLM is likely to deliver powerful results in the analysis of real cs-fMRI data.
| Truth | EM | INLA | Classical | |
|
Amplitude |
\addvbuffer[3pt 0pt]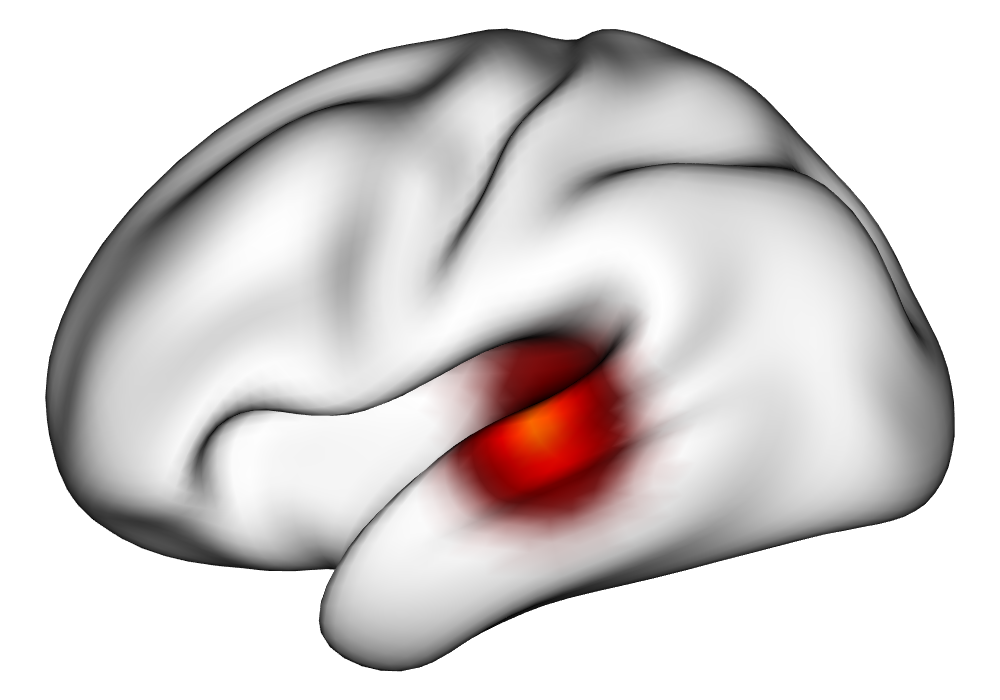
|
\addvbuffer[3pt 0pt]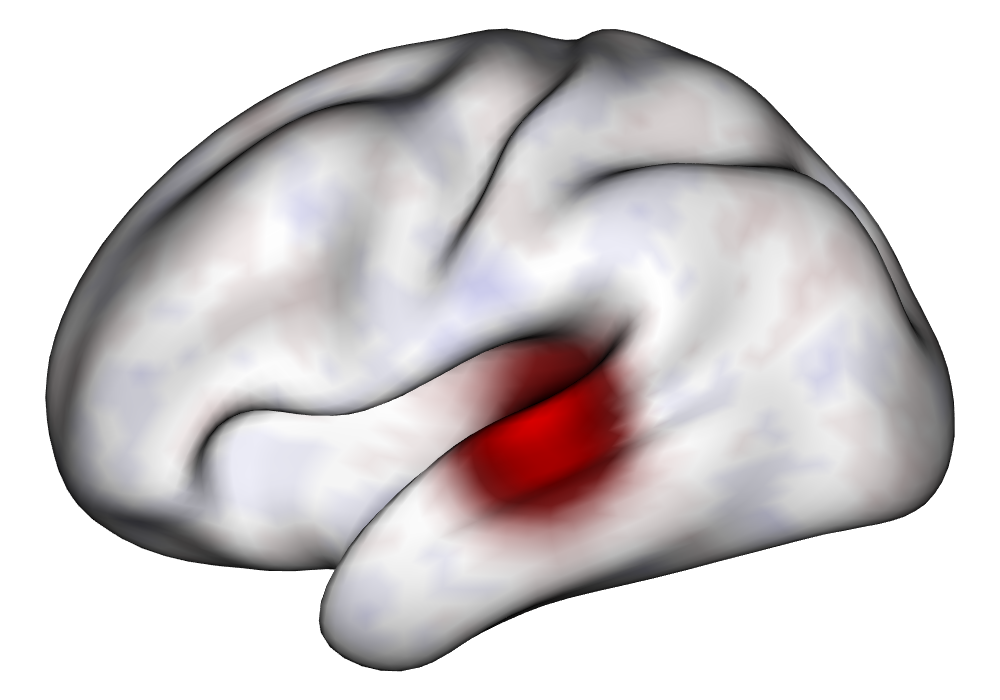
|
\addvbuffer[3pt 0pt]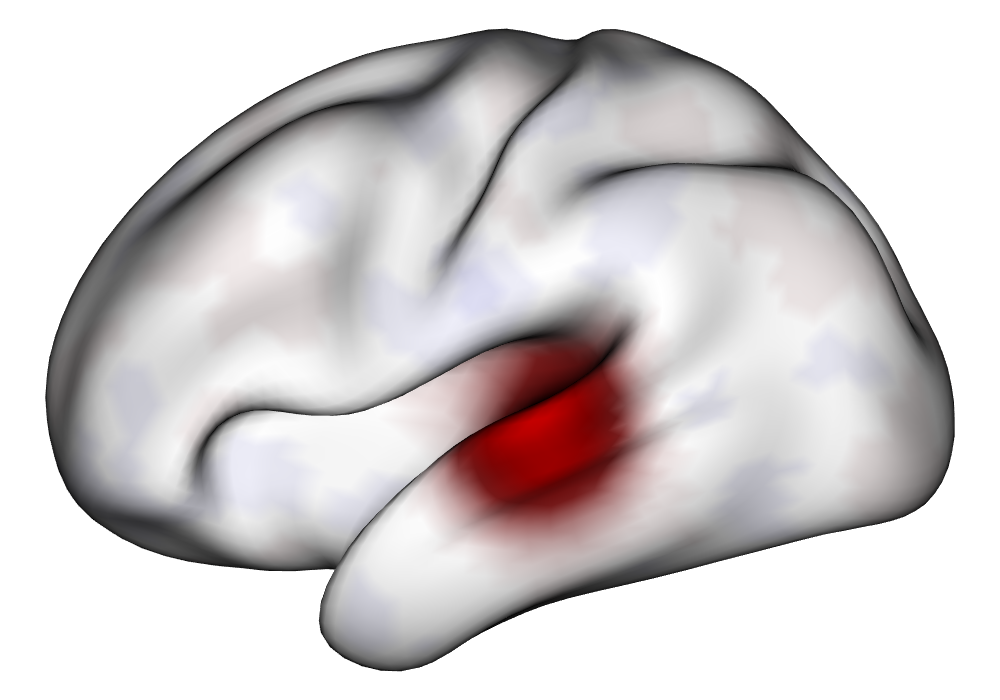
|
\addvbuffer[3pt 0pt]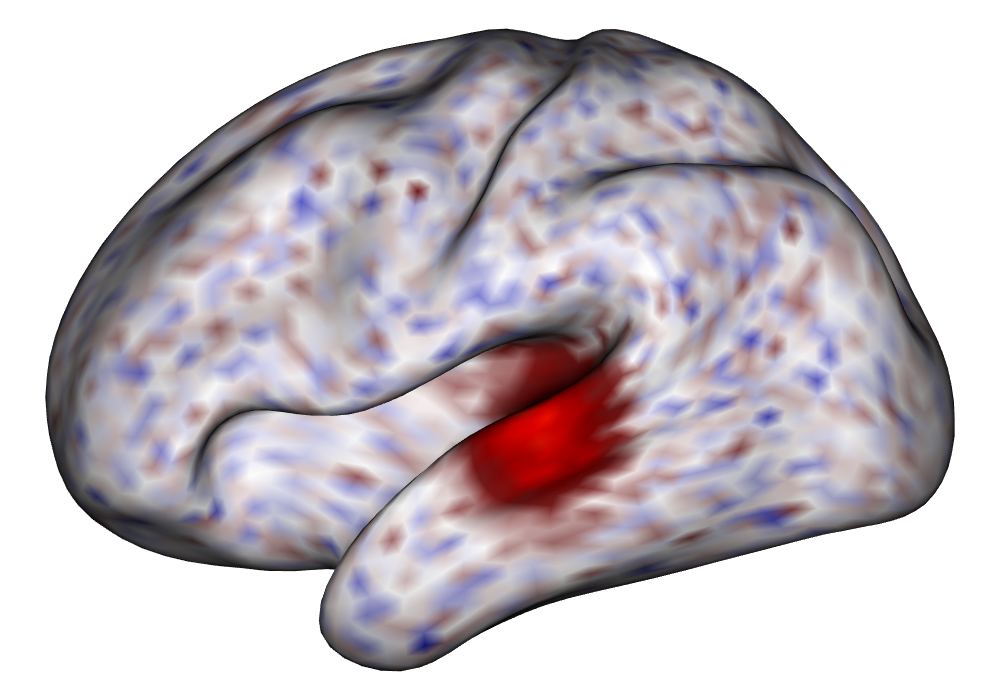
|
|
|
||||
|
Activations |
\addvbuffer[3pt 0pt]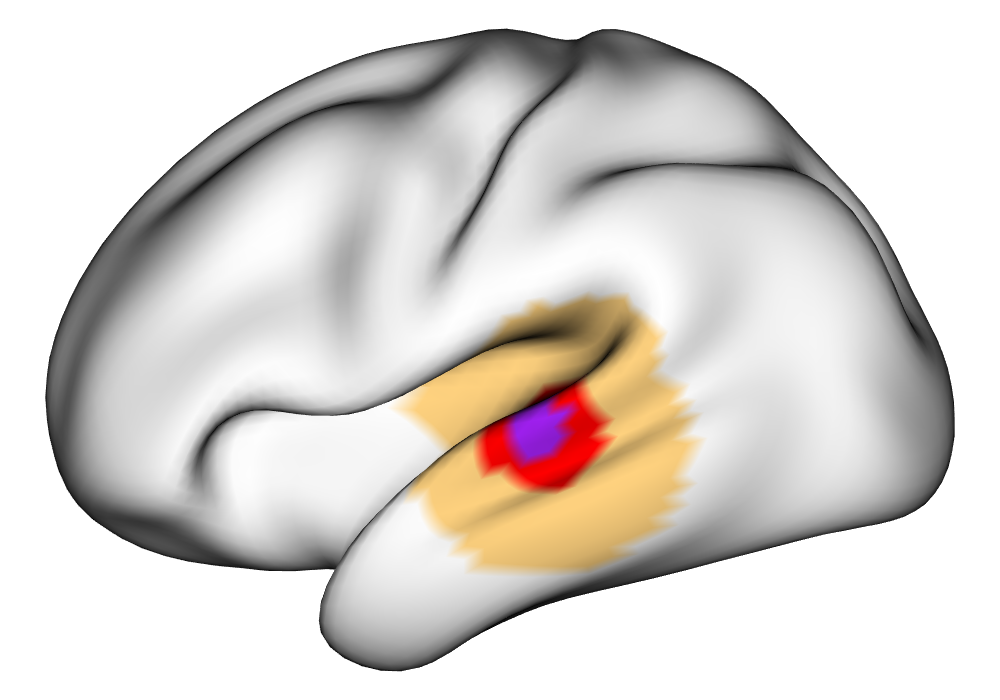
|
\addvbuffer[3pt 0pt]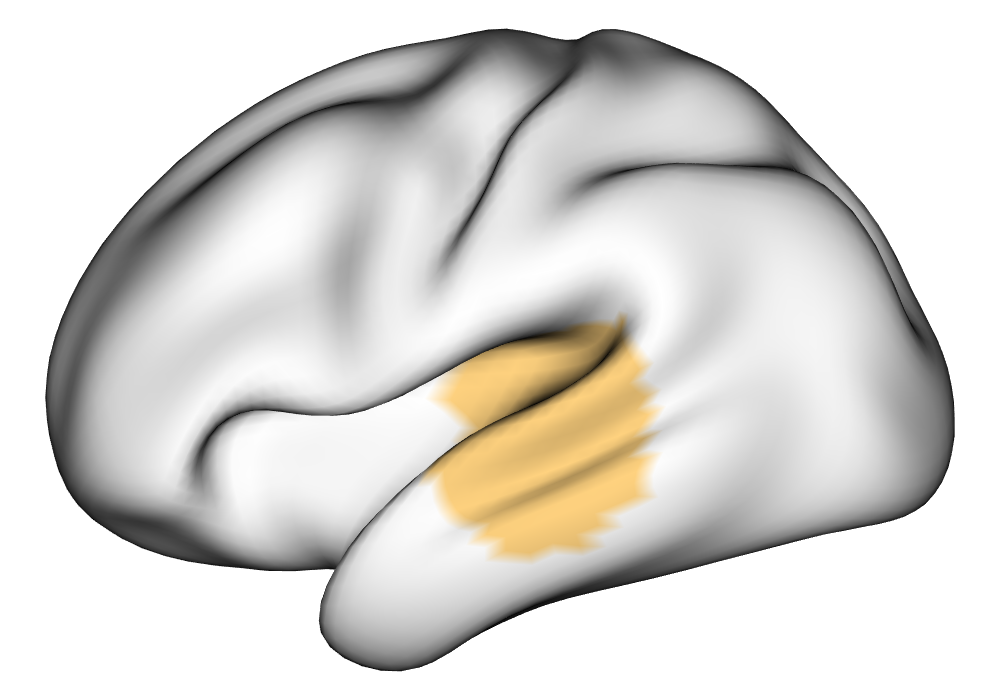
|
\addvbuffer[3pt 0pt]
|
\addvbuffer[3pt 0pt]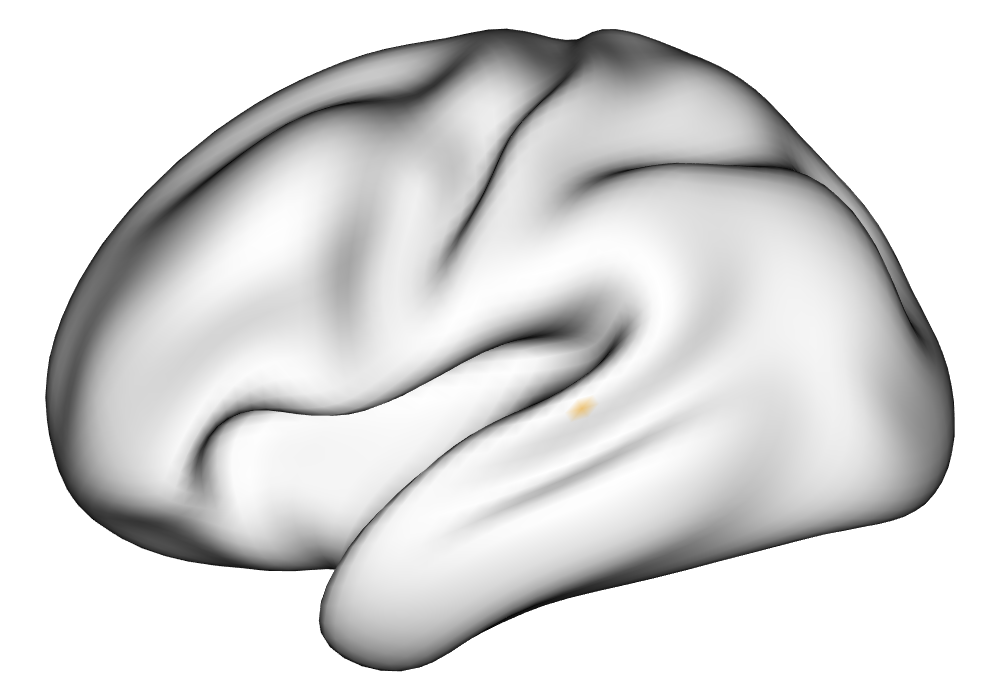
|
|
|
0% 0.5% 1% | |||
4 Analysis of HCP Data
We selected 10 subjects from the Human Connectome Project (HCP) (Barch et al., 2013) 1200-subject release in order to simulate small sample conditions common in many neuroimaging experiments as Spencer et al. (2022) shows the INLA implementation of the SBSB GLM to be powerful in such small studies. Motor task data were analyzed using the INLA and EM implementations of the SBSB GLM in order to compare the methods and their performance. These data were collected with two fMRI runs performed for each session, one with the phase acquisition from left-to-right, and the other from right-to-left. We analyze the average across these two runs because the acquisition-related effects are not of interest. The motor tasks in the experiment included tapping the fingers on the left and right hands, moving the toes on the left and right feet, and pressing the tongue to the inside of the cheek. A visual cue was used to indicate which task to perform.
These data were obtained from the HCP after being preprocessed with the minimal preprocessing pipeline (Van Essen et al., 2013; Barch et al., 2013). This pipeline includes the projection of the volumetric blood oxygen level-dependent (BOLD) values to the cerebral cortex and the subcortical regions and registering these surfaces to a common surface template. The preprocessing also creates high-resolution surface meshes with 164,000 vertices using structural T1-weighted and T2-weighted MRI scans, which are resampled to 32,000 vertices per hemisphere to match the resolution of the fMRI scans. In order to regularize the mapping process to the cortical surface, the fMRI timeseries were smoothed using a Gaussian smoothing kernel with a 2mm full-width half-maximum (FWHM).
After these steps from the HCP minimal preprocessing pipeline, additional preprocessing of the fMRI time series as outlined in A are applied in order to remove nuisance effects and temporal autocorrelation in the data, and make the parameter estimates of interpretable in terms of percent signal change, given the unitless nature of fMRI BOLD measures. The data are resampled to around 5,000 vertices per hemisphere using the HCP Workbench (Marcus et al., 2011) via the R package ciftiTools (Pham et al., 2022), as this resolution is shown to be computationally efficient without sacrificing effective inferential resolution, as discussed in Spencer et al. (2022). See Figure 10 for a comparison of cortical surfaces between different subjects and resolutions. The preprocessed data for both runs of the first scanning session was analyzed separately for each hemisphere and each subject using the INLA and EM implementations of the SBSB GLM.
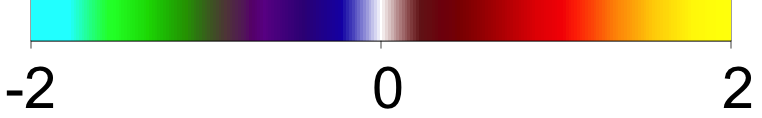
Figure 4 shows the estimates and areas of activation found in three different subjects for the tongue task. The tongue task is chosen for display due to the easily-visible pattern of activation in the sensorimotor cortex, which helps to highlight the individual subject differences found in the patterns of estimates and activations. It is clear here that the INLA and EM implementations perform very similarly in terms of the task coefficient estimates, and that the EM implementation shows slightly more activation, particularly at the lowest threshold, . This is likely due to the reduced estimate of posterior variance in the EM method due to its treatment of the hyperparameters as fixed.
| INLA | EM | |
|
Subject A |
\addvbuffer[3pt 0pt]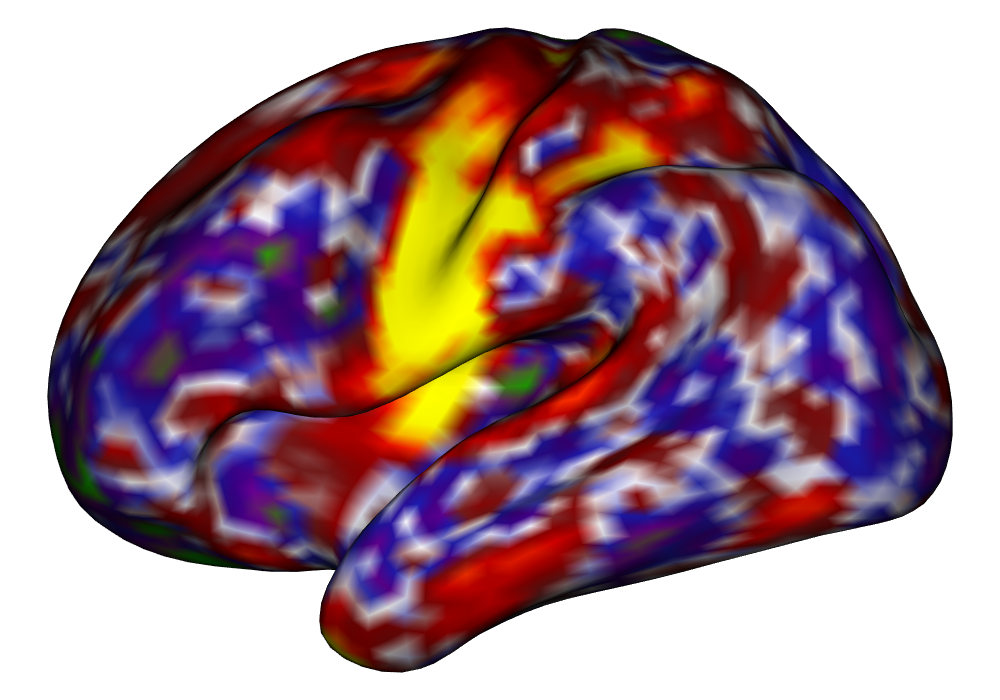
|
\addvbuffer[3pt 0pt]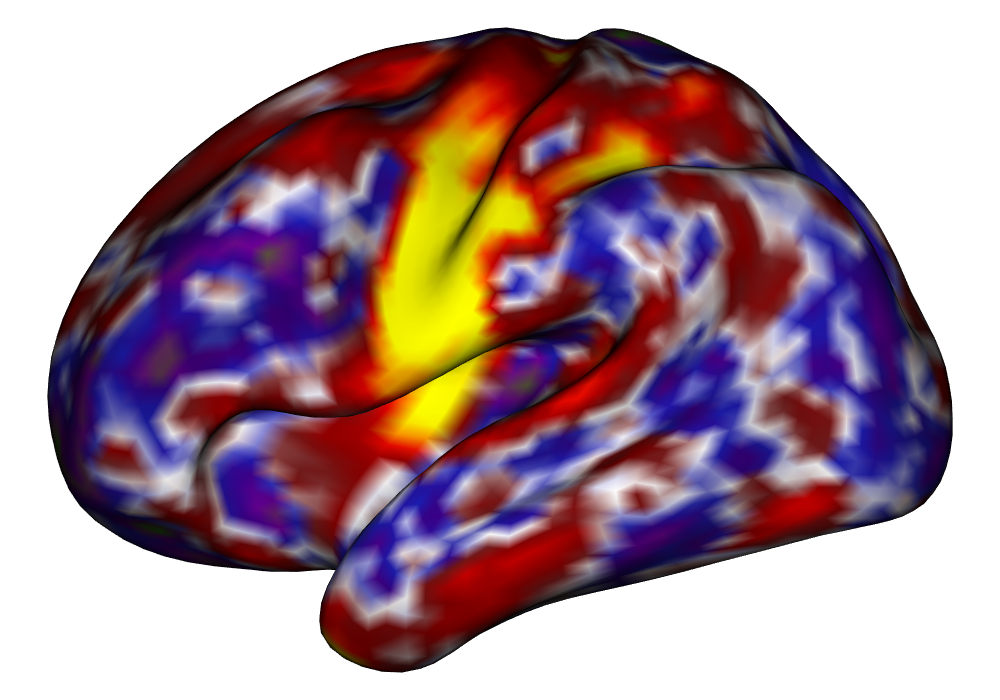
|
|
Subject B |
\addvbuffer[3pt 0pt]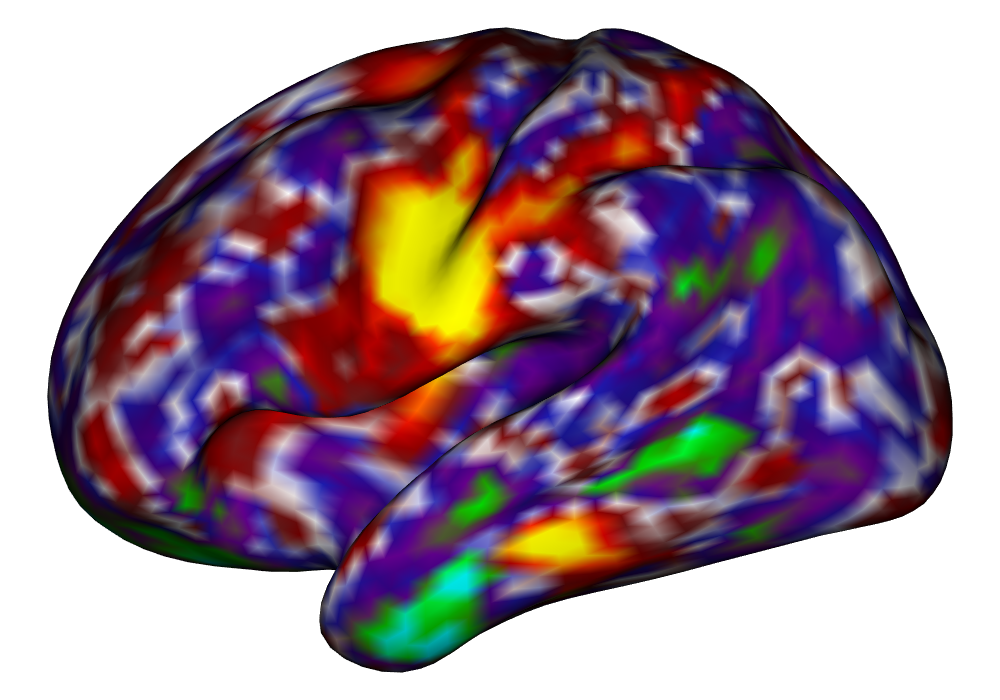
|
\addvbuffer[3pt 0pt]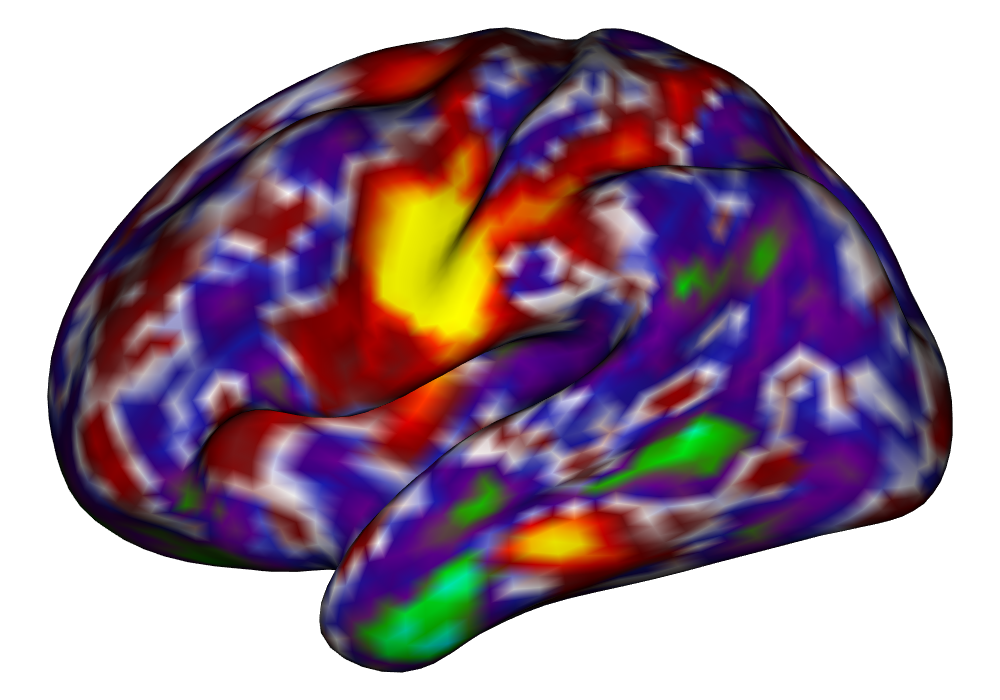
|
|
Subject C |
\addvbuffer[3pt 0pt]
|
\addvbuffer[3pt 0pt]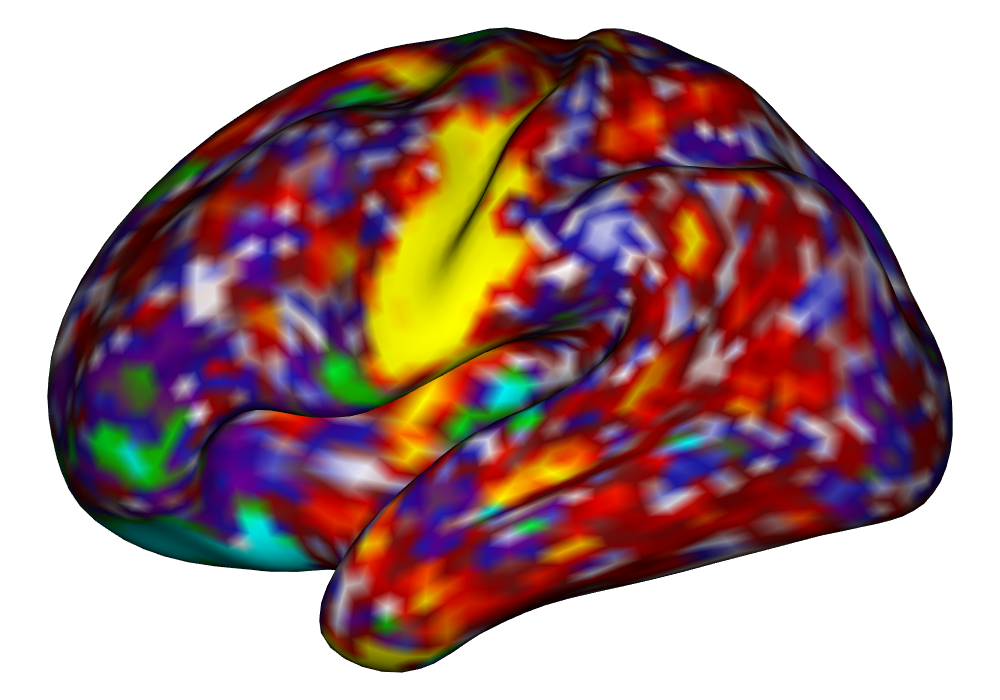
|
|
|
|
|
| INLA | EM | |
|
Subject A |
\addvbuffer[3pt 0pt]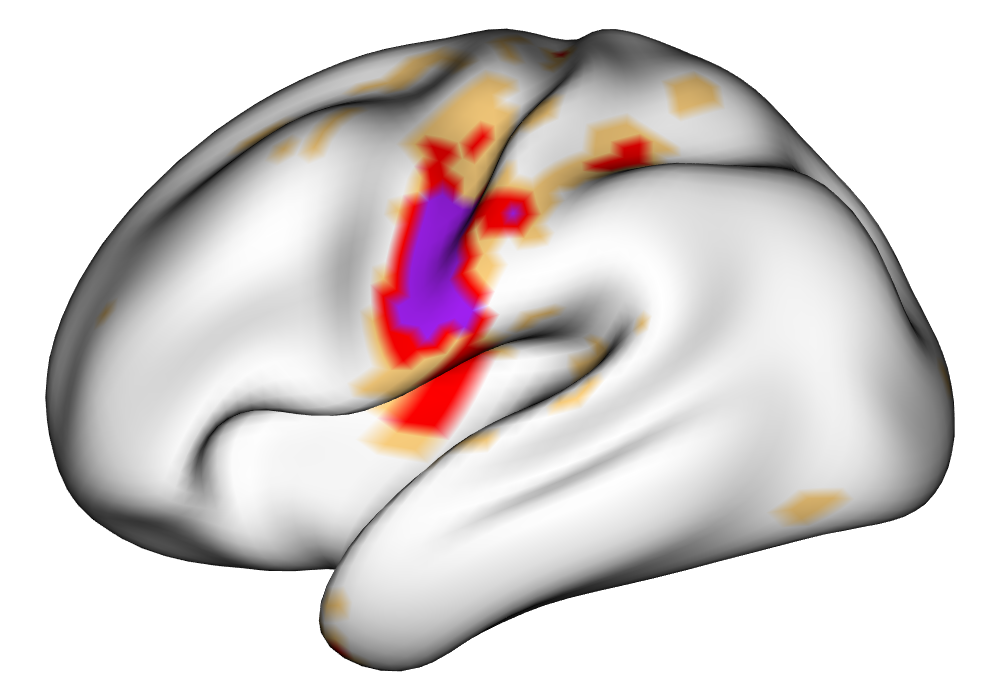
|
\addvbuffer[3pt 0pt]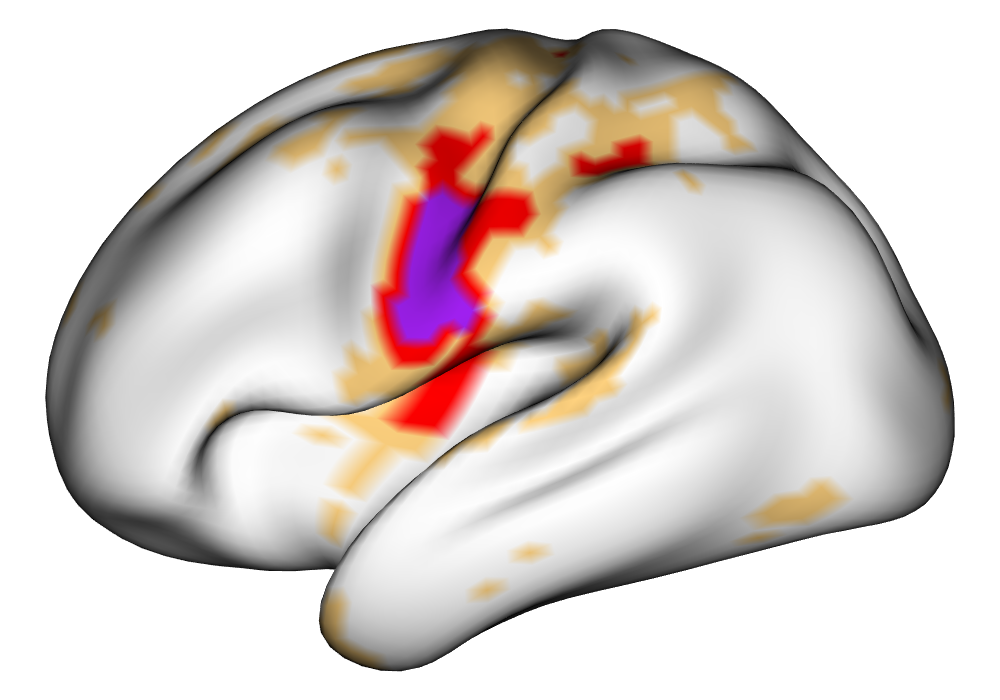
|
|
Subject B |
\addvbuffer[3pt 0pt]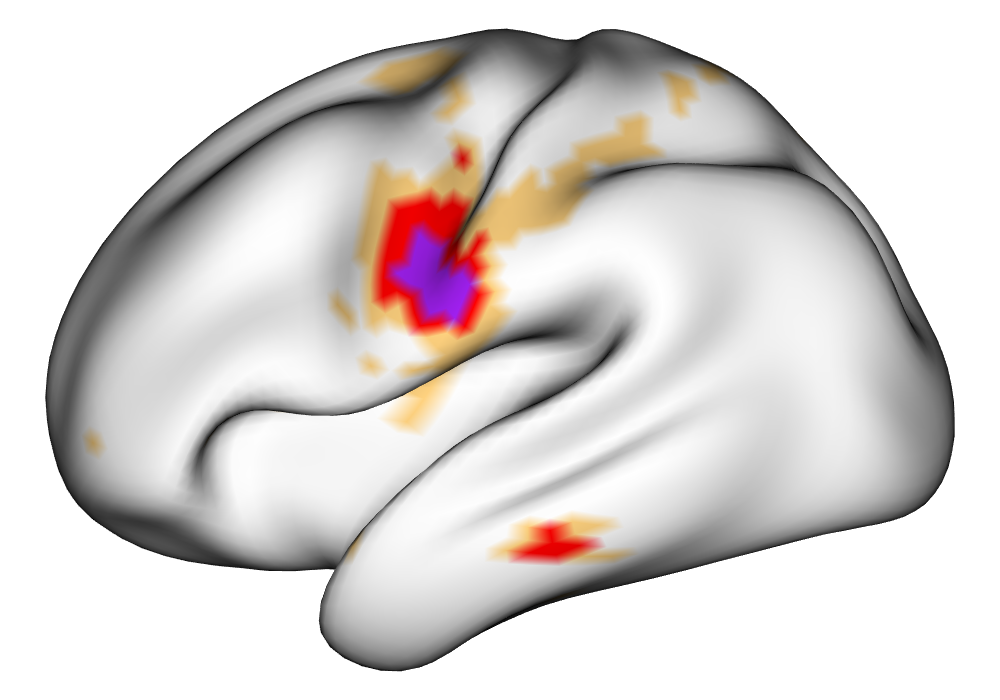
|
\addvbuffer[3pt 0pt]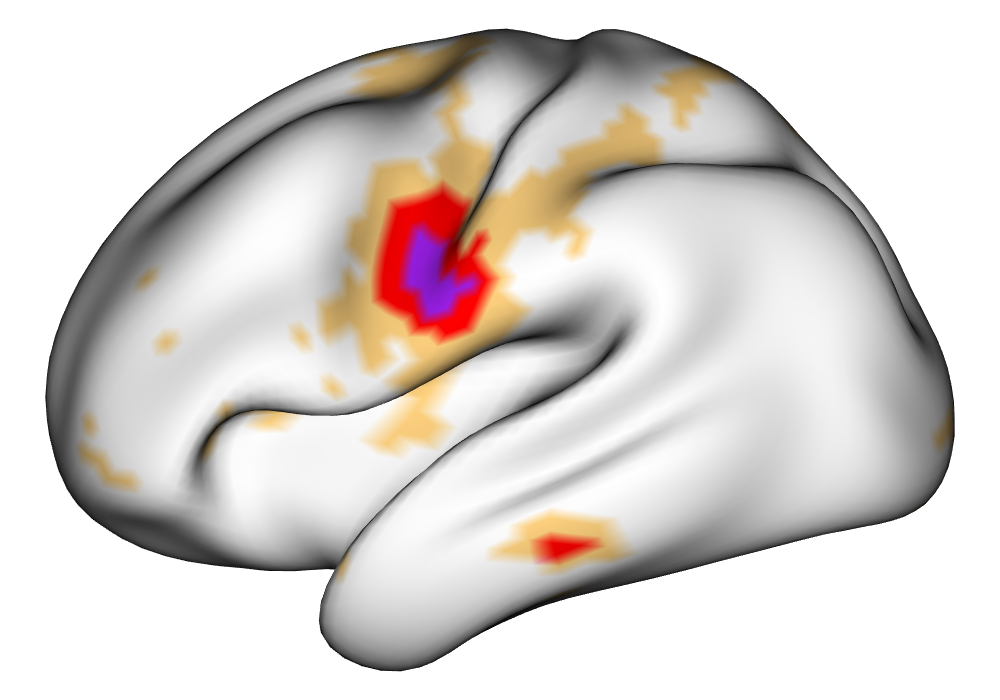
|
|
Subject C |
\addvbuffer[3pt 0pt]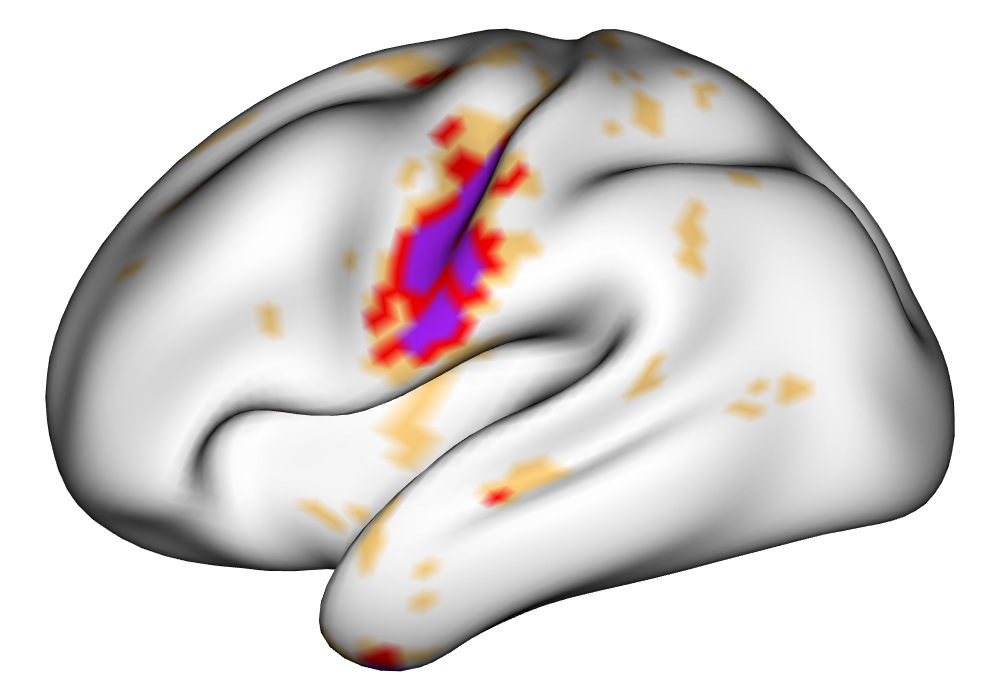
|
\addvbuffer[3pt 0pt]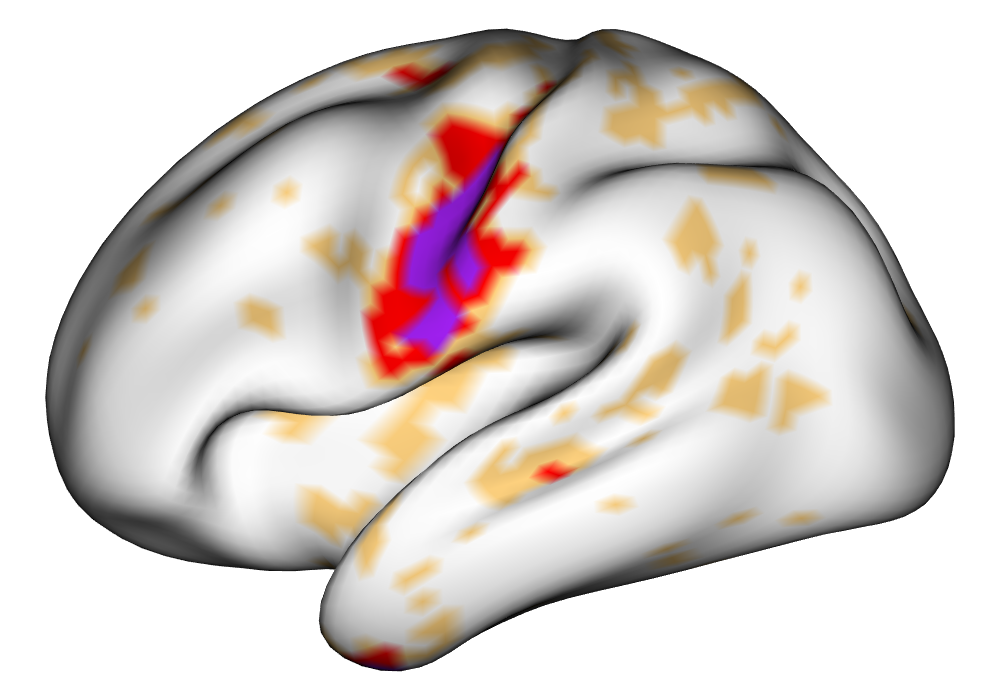
|
|
|
0% 0.5% 1% | |
Figure 5 shows the multi-subject estimates and areas of activation for the tongue task, based on all 10 subjects. The amplitude estimates from the EM implementation of the SBSB GLM are highly very similar to those found using the INLA implementation, and the areas of activation show that the EM algorithm detects more activations, especially at the threshold, again due to the underestimation of posterior variance. However, the activations found at the and thresholds are very similar, suggesting high levels of agreement at higher, more neurologically meaningful thresholds.
| INLA | EM | |
|
Estimates |
\addvbuffer[3pt 0pt]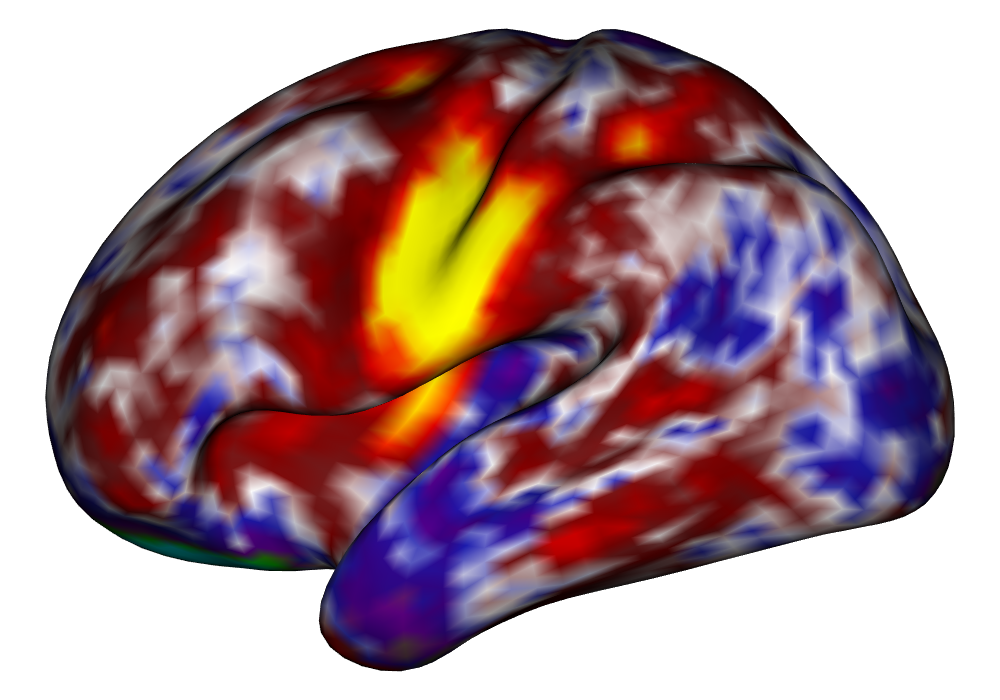
|
\addvbuffer[3pt 0pt]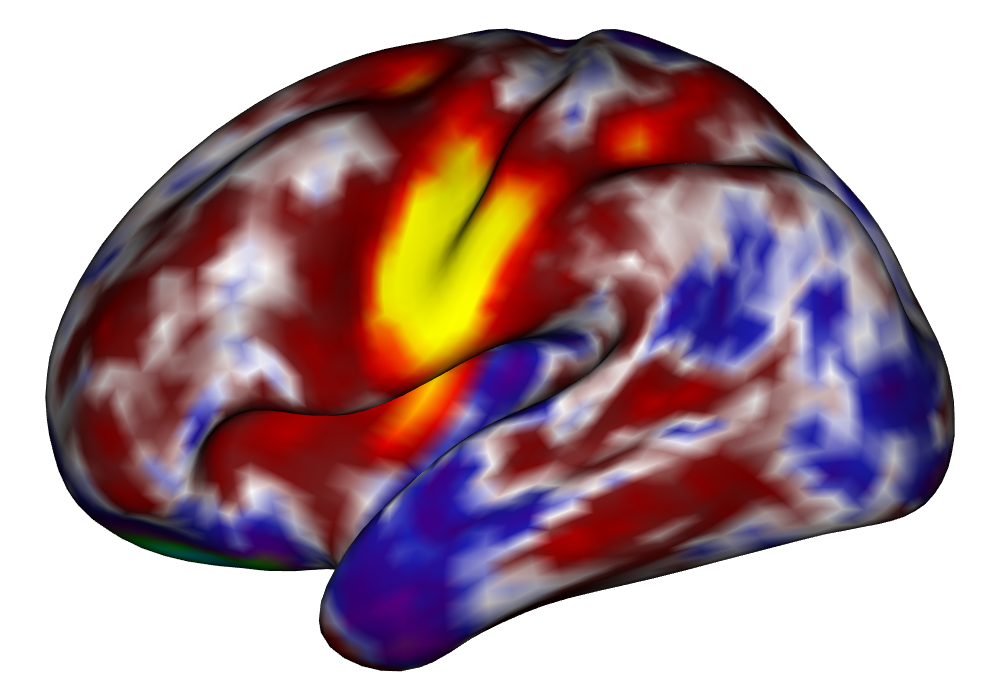
|
|
|
|
|
|
Activations |
\addvbuffer[3pt 0pt]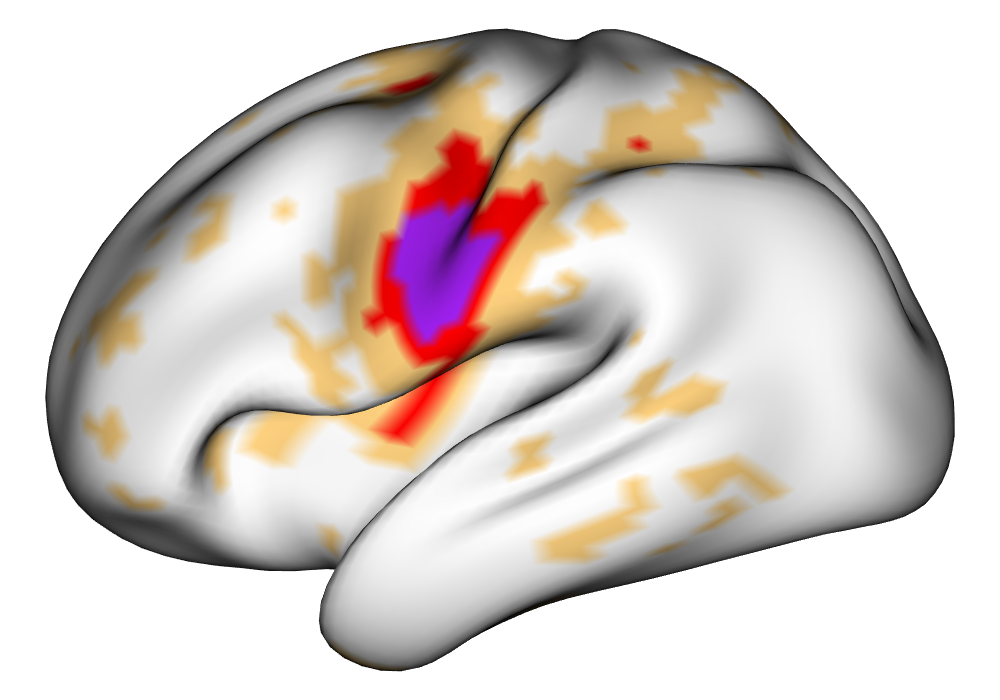
|
\addvbuffer[3pt 0pt]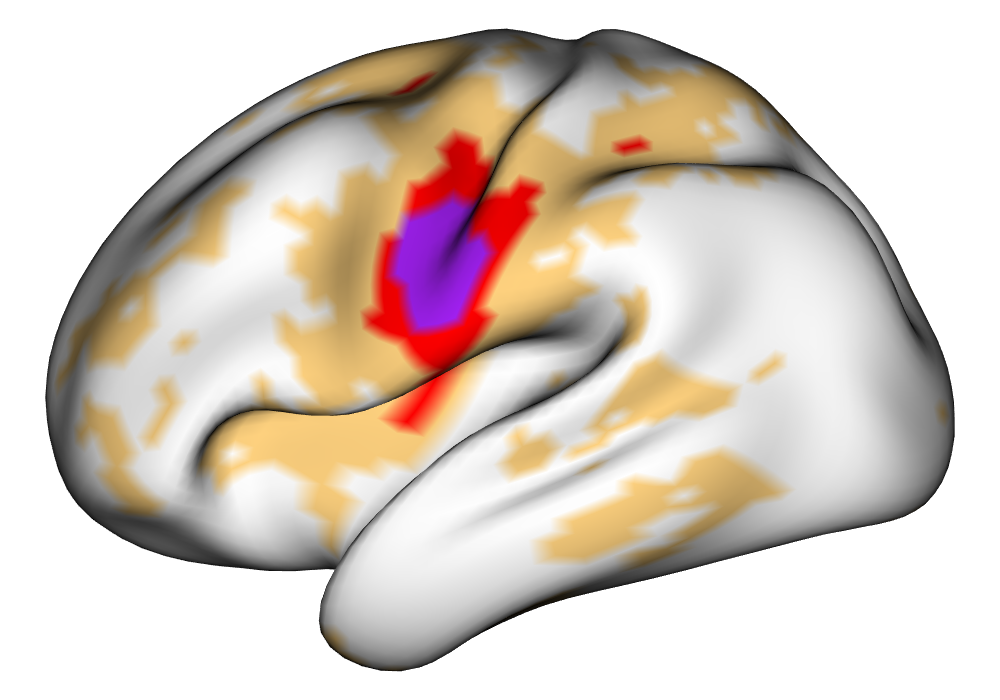
|
|
|
0% 0.5% 1% | |
5 Conclusions
We develop and implement an EM algorithm to fit the surface-based spatial Bayesian GLM on cortical surface task fMRI data. This provides an exact method to fit the Bayesian GLM, reduce the memory consumption required by the INLA implementation of the Bayesian GLM, and also to reduce the dependence on the INLA package. The INLA package, while powerful, is not available on the Comprehensive R Archive Network (CRAN), and may be difficult or impossible to install on various computer systems. The increased memory requirement for the INLA package also presents an impediment to using the SBSB GLM to researchers without significant computing resources at their disposal.
Through analysis of simulated data, we determine that the EM algorithm performs well compared to the INLA implementation, both of which strongly outperform the surface-based classical GLM in terms of accuracy. The group-level results for the INLA and EM implementations are highly consistent, both in terms of effect size estimation and activation detection.
Analysis of data from the Human Connectome Project motor task data confirms that the EM implementation performs similarly to the INLA implementation, as both methods are able to find sparse, spatially-contiguous nonzero estimates of activation amplitude that display subject-specific characteristics. As in the simulated data, the EM finds more activated locations than INLA at a threshold of , with similar numbers of activated locations found at higher thresholds.
Future work on this method includes improving computational efficiency through the use of parallelized linear algebra solvers and speed improvements through conjugate gradient methods. If such an optimized parallel solver were implemented, we expect the EM algorithm to take less time than INLA in all scenarios. Such speed improvements will likely make the spatial Bayesian GLM applicable to subcortical data, which have more dense neighborhood structures. Forthcoming work in a software paper for the BayesfMRI package in R will make the application of the functions used to perform these analyses accessible to anyone performing inference on relatively modest laptop computers.
6 Acknowledgements
Data were provided in part by the Human Connectome Project, WU- Minn Consortium (Principal Investigators: David Van Essen and Kamil Ugurbil; 1U54MH091657) funded by the 16 NIH Institutes and Centers that support the NIH Blueprint for Neuroscience Research; and by the McDonnell Center for Systems Neuroscience at Washington University.
The research of Daniel Spencer and Amanda Mejia is partially funded by the National Institute of Biomedical Imaging and Bioengineering (R01EB027119).
References
- Alappat et al. (2020) Christie Alappat, Achim Basermann, Alan R. Bishop, Holger Fehske, Georg Hager, Olaf Schenk, Jonas Thies, and Gerhard Wellein. A recursive algebraic coloring technique for hardware-efficient symmetric sparse matrix-vector multiplication. ACM Trans. Parallel Comput., 7(3), June 2020. ISSN 2329-4949. doi: 10.1145/3399732. URL https://doi.org/10.1145/3399732.
- Barch et al. (2013) Deanna M Barch, Gregory C Burgess, Michael P Harms, Steven E Petersen, Bradley L Schlaggar, Maurizio Corbetta, Matthew F Glasser, Sandra Curtiss, Sachin Dixit, Cindy Feldt, et al. Function in the human connectome: task-fMRI and individual differences in behavior. Neuroimage, 80:169–189, 2013.
- Bates and Eddelbuettel (2013) Douglas Bates and Dirk Eddelbuettel. Fast and elegant numerical linear algebra using the RcppEigen package. Journal of Statistical Software, 52(5):1–24, 2013. doi: 10.18637/jss.v052.i05.
- Bishop and Nasrabadi (2006) Christopher M Bishop and Nasser M Nasrabadi. Pattern recognition and machine learning, volume 4. Springer, 2006.
- Bolin and Lindgren (2013) David Bolin and Finn Lindgren. A comparison between Markov approximations and other methods for large spatial data sets. Computational Statistics & Data Analysis, 61:7–21, 2013.
- Bolin and Lindgren (2015) David Bolin and Finn Lindgren. Excursion and contour uncertainty regions for latent Gaussian models. Journal of the Royal Statistical Society, Series B (Statistical Methodology), 77(1):85–106, 2015.
- Bolin and Lindgren (2017) David Bolin and Finn Lindgren. Quantifying the uncertainty of contour maps. Journal of Computational and Graphical Statistics, 26(3):513–524, 2017.
- Bolin and Lindgren (2018) David Bolin and Finn Lindgren. Calculating probabilistic excursion sets and related quantities using excursions. Journal of Statistical Software, 86(5):1–20, 2018. doi: 10.18637/jss.v086.i05.
- Bollhöfer et al. (2019) Matthias Bollhöfer, Aryan Eftekhari, Simon Scheidegger, and Olaf Schenk. Large-scale sparse inverse covariance matrix estimation. SIAM Journal on Scientific Computing, 41(1):A380–A401, 2019. doi: 10.1137/17M1147615. URL https://doi.org/10.1137/17M1147615.
- Bollhöfer et al. (2020) Matthias Bollhöfer, Olaf Schenk, Radim Janalik, Steve Hamm, and Kiran Gullapalli. State-of-the-Art Sparse Direct Solvers. Springer International Publishing, Cham, 2020. ISBN 978-3-030-43736-7. doi: 10.1007/978-3-030-43736-7_1. URL https://doi.org/10.1007/978-3-030-43736-7_1.
- Chatfield and Collins (2018) Christopher Chatfield and Alexander J Collins. Introduction to multivariate analysis. Routledge, 2018.
- Dempster et al. (1977) Arthur P Dempster, Nan M Laird, and Donald B Rubin. Maximum likelihood from incomplete data via the EM algorithm. Journal of the Royal Statistical Society: Series B (Methodological), 39(1):1–22, 1977.
- Dice (1945) Lee R Dice. Measures of the amount of ecologic association between species. Ecology, 26(3):297–302, 1945.
- Eddelbuettel (2013) Dirk Eddelbuettel. Seamless R and C++ Integration with Rcpp. Springer, New York, 2013. doi: 10.1007/978-1-4614-6868-4. ISBN 978-1-4614-6867-7.
- Eddelbuettel and François (2011) Dirk Eddelbuettel and Romain François. Rcpp: Seamless R and C++ integration. Journal of Statistical Software, 40(8):1–18, 2011. doi: 10.18637/jss.v040.i08.
- Eklund et al. (2016) Anders Eklund, Thomas E Nichols, and Hans Knutsson. Cluster failure: Why fMRI inferences for spatial extent have inflated false-positive rates. Proceedings of the national academy of sciences, 113(28):7900–7905, 2016.
- Eklund et al. (2019) Anders Eklund, Hans Knutsson, and Thomas E Nichols. Cluster failure revisited: Impact of first level design and physiological noise on cluster false positive rates. Human brain mapping, 40(7):2017–2032, 2019.
- Elliott et al. (2020) Maxwell L Elliott, Annchen R Knodt, David Ireland, Meriwether L Morris, Richie Poulton, Sandhya Ramrakha, Maria L Sison, Terrie E Moffitt, Avshalom Caspi, and Ahmad R Hariri. What is the test-retest reliability of common task-functional MRI measures? New empirical evidence and a meta-analysis. Psychological Science, 31(7):792–806, 2020.
- Eshel (2003) Gidon Eshel. The Yule Walker equations for the AR coefficients. Internet resource, 2:68–73, 2003.
- Friston et al. (1994) Karl J Friston, Andrew P Holmes, Keith J Worsley, J-P Poline, Chris D Frith, and Richard SJ Frackowiak. Statistical parametric maps in functional imaging: a general linear approach. Human brain mapping, 2(4):189–210, 1994.
- Gelman et al. (2013) Andrew Gelman, John B Carlin, Hal S Stern, David B Dunson, Aki Vehtari, and Donald B Rubin. Bayesian data analysis. CRC press, 2013.
- Glasser et al. (2013) Matthew F Glasser, Stamatios N Sotiropoulos, J Anthony Wilson, Timothy S Coalson, Bruce Fischl, Jesper L Andersson, Junqian Xu, Saad Jbabdi, Matthew Webster, Jonathan R Polimeni, et al. The minimal preprocessing pipelines for the human connectome project. Neuroimage, 80:105–124, 2013.
- Guennebaud et al. (2010) Gaël Guennebaud, Benoît Jacob, et al. Eigen v3. http://eigen.tuxfamily.org, 2010.
- Guhaniyogi and Spencer (2021) Rajarshi Guhaniyogi and Daniel Spencer. Bayesian tensor response regression with an application to brain activation studies. Bayesian Analysis, 16(4):1221–1249, 2021.
- Hutchinson (1989) Michael F Hutchinson. A stochastic estimator of the trace of the influence matrix for Laplacian smoothing splines. Communications in Statistics-Simulation and Computation, 18(3):1059–1076, 1989.
- Lindgren et al. (2011) Finn Lindgren, Håvard Rue, and Johan Lindström. An explicit link between Gaussian fields and Gaussian Markov random fields: The stochastic partial differential equation approach (with discussion). Journal of the Royal Statistical Society B, 73(4):423–498, 2011.
- Lindquist (2008) Martin A Lindquist. The statistical analysis of fMRI data. Statistical science, 23(4):439–464, 2008.
- Marcus et al. (2011) Daniel S Marcus, John Harwell, Timothy Olsen, Michael Hodge, Matthew F Glasser, Fred Prior, Mark Jenkinson, Timothy Laumann, Sandra W Curtiss, and David C Van Essen. Informatics and data mining tools and strategies for the human connectome project. Frontiers in neuroinformatics, 5:4, 2011.
- Mejia et al. (2022) Amanda Mejia, Daniel A. Spencer, Damon Pham, David Bolin, Sarah Ryan, and Yu (Ryan) Yue. BayesfMRI, April 2022. URL https://github.com/mandymejia/BayesfMRI.
- Mejia et al. (2020) Amanda F Mejia, Yu Yue, David Bolin, Finn Lindgren, and Martin A Lindquist. A Bayesian general linear modeling approach to cortical surface fMRI data analysis. Journal of the American Statistical Association, 115(530):501–520, 2020.
- Opitz (2017) Thomas Opitz. Latent gaussian modeling and inla: A review with focus on space-time applications. Journal de la société française de statistique, 158(3):62–85, 2017.
- Parlak et al. (2022) Fatma Parlak, Damon Pham, Daniel Spencer, Robert Welsh, and Amanda Mejia. Sources of residual autocorrelation in multiband task fMRI and strategies for effective mitigation. arXiv preprint arXiv:2209.06783, 2022.
- Penny et al. (2005) William D Penny, Nelson J Trujillo-Barreto, and Karl J Friston. Bayesian fMRI time series analysis with spatial priors. NeuroImage, 24(2):350–362, 2005.
- Pham et al. (2022) Damon D Pham, John Muschelli, and Amanda F Mejia. ciftitools: A package for reading, writing, visualizing, and manipulating cifti files in r. NeuroImage, 250:118877, 2022.
- Poldrack et al. (2011) Russell A Poldrack, Jeanette A Mumford, and Thomas E Nichols. Handbook of functional MRI data analysis. Cambridge University Press, 2011.
- Poline and Mazoyer (1993) Jean-Baptiste Poline and Bernard M Mazoyer. Analysis of individual positron emission tomography activation maps by detection of high signal-to-noise-ratio pixel clusters. Journal of Cerebral Blood Flow & Metabolism, 13(3):425–437, 1993.
- Poline et al. (1997) Jean-Baptiste Poline, Keith J Worsley, Alan C Evans, and Karl J Friston. Combining spatial extent and peak intensity to test for activations in functional imaging. Neuroimage, 5(2):83–96, 1997.
- Rue et al. (2009) Håvard Rue, Sara Martino, and Nicholas Chopin. Approximate Bayesian inference for latent Gaussian models using integrated nested Laplace approximations (with discussion). Journal of the Royal Statistical Society B, 71:319–392, 2009.
- Sidén et al. (2017) Per Sidén, Anders Eklund, David Bolin, and Mattias Villani. Fast Bayesian whole-brain fMRI analysis with spatial 3D priors. NeuroImage, 146:211–225, 2017.
- Skorski (2021) Maciej Skorski. Modern analysis of Hutchinson’s trace estimator. In 2021 55th Annual Conference on Information Sciences and Systems (CISS), pages 1–5. IEEE, 2021.
- Smith and Nichols (2009) Stephen M Smith and Thomas E Nichols. Threshold-free cluster enhancement: addressing problems of smoothing, threshold dependence and localisation in cluster inference. Neuroimage, 44(1):83–98, 2009.
- Spencer et al. (2020) Daniel Spencer, Rajarshi Guhaniyogi, and Raquel Prado. Joint Bayesian estimation of voxel activation and inter-regional connectivity in fMRI experiments. Psychometrika, 85(4):845–869, 2020.
- Spencer et al. (2022) Daniel Spencer, Yu Ryan Yue, David Bolin, Sarah Ryan, and Amanda F Mejia. Spatial Bayesian GLM on the cortical surface produces reliable task activations in individuals and groups. NeuroImage, 249:118908, 2022.
- Stephens et al. (2022) Matthew Stephens, Peter Carbonetto, Jason Willwerscheid, Chaoxing Dai, et al. ashr: An R package for adaptive shrinkage. https://github.com/stephens999/ashr, 2022.
- Van Essen et al. (2013) David C Van Essen, Stephen M Smith, Deanna M Barch, Timothy EJ Behrens, Essa Yacoub, Kamil Ugurbil, Wu-Minn HCP Consortium, et al. The WU-Minn human connectome project: an overview. Neuroimage, 80:62–79, 2013.
- Varadhan and Roland (2004) Ravi Varadhan and Ch Roland. Squared extrapolation methods (SQUAREM): A new class of simple and efficient numerical schemes for accelerating the convergence of the EM algorithm. Johns Hopkins University, Dept. of Biostatistics Working Papers, 2004.
- Wang and Titterington (2005) Bo Wang and D Michael Titterington. Inadequacy of interval estimates corresponding to variational Bayesian approximations. In International Workshop on Artificial Intelligence and Statistics, pages 373–380. PMLR, 2005.
- Welvaert et al. (2011) Marijke Welvaert, Joke Durnez, Beatrijs Moerkerke, Geert Verdoolaege, and Yves Rosseel. neuRosim: An R package for generating fMRI data. Journal of Statistical Software, 44(10):1–18, 2011. URL http://www.jstatsoft.org/v44/i10/.
- Zhang et al. (2016) Linlin Zhang, Michele Guindani, Francesco Versace, Jeffrey M Engelmann, and Marina Vannucci. A spatiotemporal nonparametric Bayesian model of multi-subject fMRI data. The Annals of Applied Statistics, 10(2):638–666, 2016.
Appendix A Preprocessing steps
Consider cs-fMRI or subcortical fMRI data from a scan, represented as for times at locations. These data are gathered while a subject completes different tasks as part of an experimental design. Data representing this design are represented as , which may not be identical across all locations after preprocessing (see section A for details). The nuisance regressors, accounting for unwanted effects such as motion and scanner drift, are represented through the notation . Modeling brain activation for data in this form is done through the general linear model
| (12) |
where is the mean value, is the regression coefficient for task , is the nuisance regression coefficient for nuisance covariate , and is the error term. In our treatment of the model, the data are preprocessed to remove the mean effect . Please refer to section A for more details on data preprocessing. These data are then fitted to either the classical or Bayesian general linear model, with the main objective of performing inference about the parameters .
Data preprocessing is a common practice in the modeling of neuroimaging data, done with the intention of quickly removing variance stemming from known sources of error, such as movement and temporal autocorrelation. We preprocess the data using functions within the BayesfMRI R software package, following the steps outlined below.
The values from the design matrix are preprocessed to account for the delay in task stimulus and physiological response through convolution with a haemodynamic response function (HRF), ,
We use the canonical (double-gamma) HRF characterized as
| (13) |
with values set according to default values given in the neuRosim package in R [Welvaert et al., 2011], specifically , , , and . The values of the HRF-convolved design matrix are then scaled by dividing each column by its maximum value, then centering these values around 0. This is done to keep estimates of comparable across different tasks as measures of percent signal change.
In order to facilitate spatial modeling given current computing memory capacity, the first step in preprocessing the response data is to resample the data to a lower resolution, which is done for the HCP data using an interpolation method outlined in Glasser et al. [2013]. This resampling presents a tradeoff between computational efficiency and spatial resolution in the inference, and needs to be considered thoroughly. This is examined in detail within Spencer et al. [2022], showing that resampling to a resolution of around 5,000 vertices per hemisphere does not significantly alter inference on cortical surfaces. After resampling, the values from the response at each data location are centered and scaled using the function
| (14) |
where is the cs-fMRI time series at location , and is the average value at that data location across time. This transformation makes the fMRI time series interpretable as percent signal change, while also removing the need for mean value parameters, as in Equation (12).
Next, nuisance regression is performed to remove the effects of known confounding variables from the response data. This is done by regressing the centered and scaled response data against the nuisance variables, and then subtracting the estimated effects of the nuisance variables
where is as defined in Equation (14), is the value of the nuisance covariate across time, and is the regression estimate of the nuisance parameter found by regressing against .
In order to remove temporal autocorrelation within the data, prewhitening is performed next. This process first finds the residual values from a regression of the response () on the design matrix , and then fits an AR(6) autoregressive model on these values using the method of solving the Yule-Walker equations [Eshel, 2003]. The coefficients and the residual variance of the AR(6) model are then spatially smoothed using a Gaussian kernel with a full-width half-maximum (FWHM) of 6 mm. These are used to create a temporal covariance matrix () for the response at each location. The inverse of the square root of the covariance matrix () is found using singular value decomposition. Finally, both the response data and the design matrix are premultiplied by to produce the preprocessed response and task covariate data at each data location.
After all of these preprocessing steps are applied, the data can be fit via a general linear model of the form shown in Equation (1).
Appendix B Choice of stopping rule tolerance
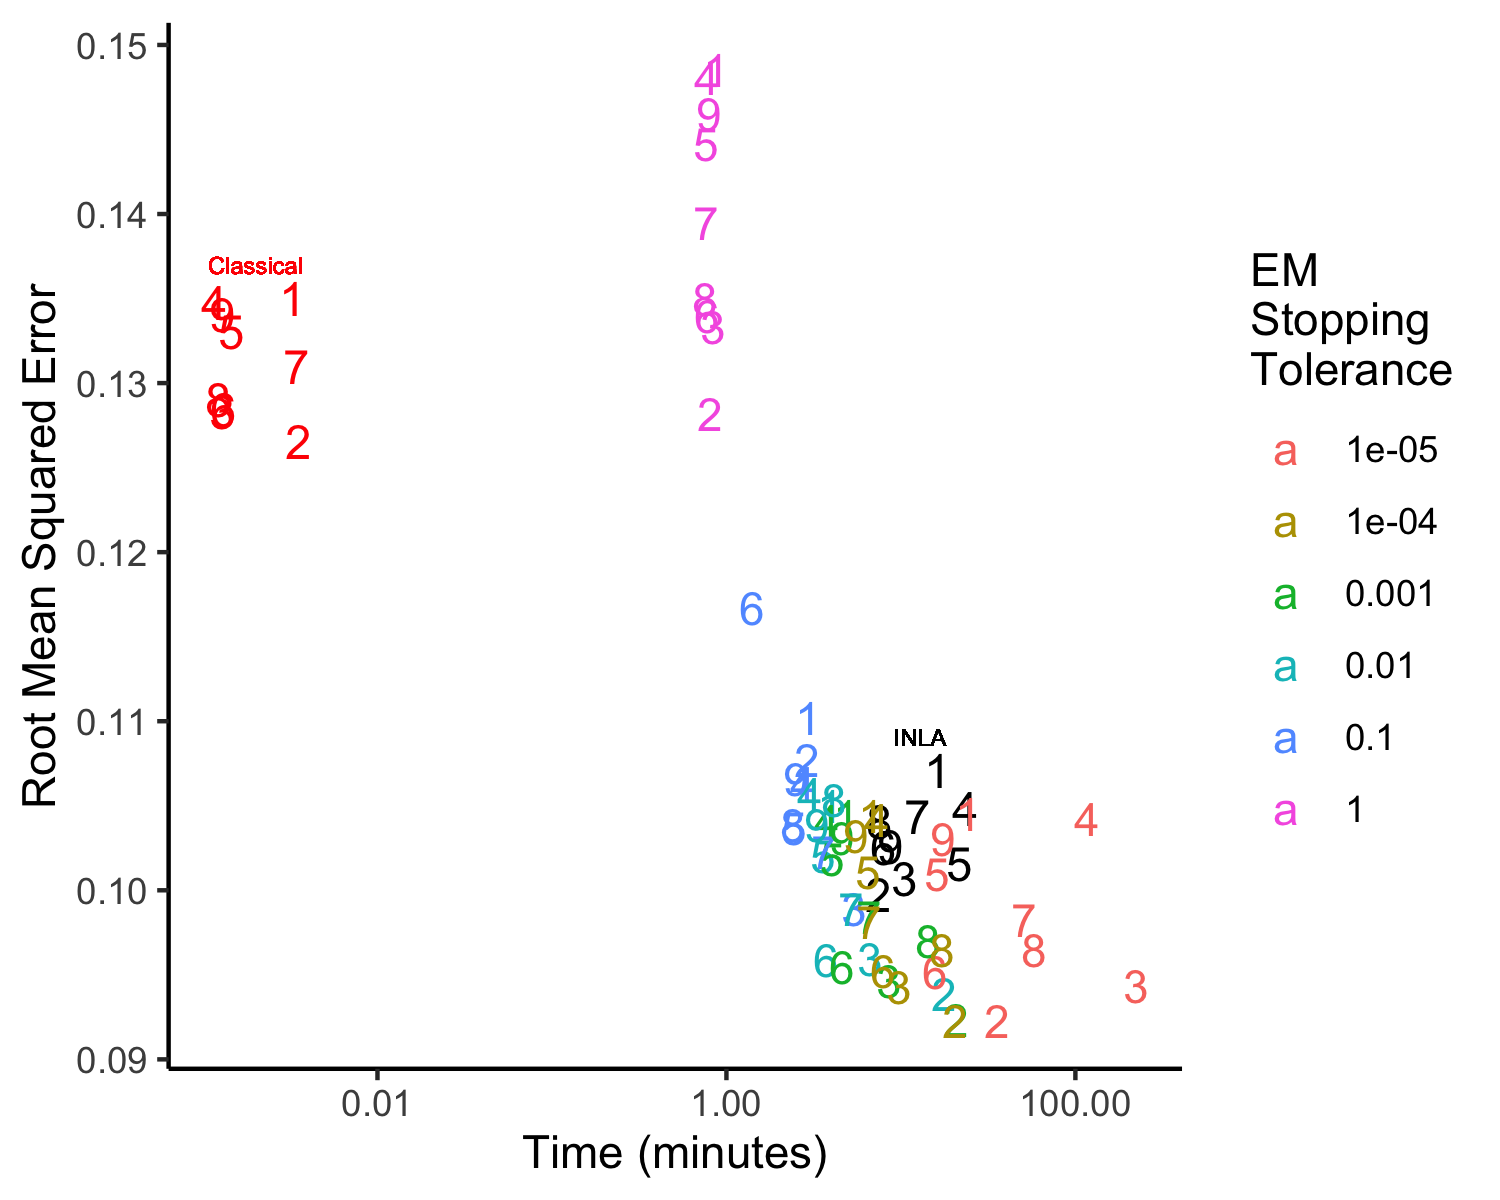
A simulation study was performed in which the stopping rule tolerance was allowed to vary from 1 down to 0.001 by powers of 10 to examine the effect of the choice of stopping rule on the speed and accuracy, measured through the square root of the mean squared error (RMSE), of the EM algorithm. In all cases, the model was fitted to simulated cortical surface data on the left hemisphere for four simulated tasks with a spatial resolution of 5,000 vertices per hemisphere. This data generation setting was used to generate 9 different datasets in order to give an idea of the variance in time and Figure 6 shows the differences in the accuracy and speed for the different tolerance levels. Based on this analysis, the stopping rule tolerance was set to for all of the analyses in this paper.
Appendix C Additional figures
| EM | INLA | |
|---|---|---|
|
Posterior SD |
\addvbuffer[3pt 0pt]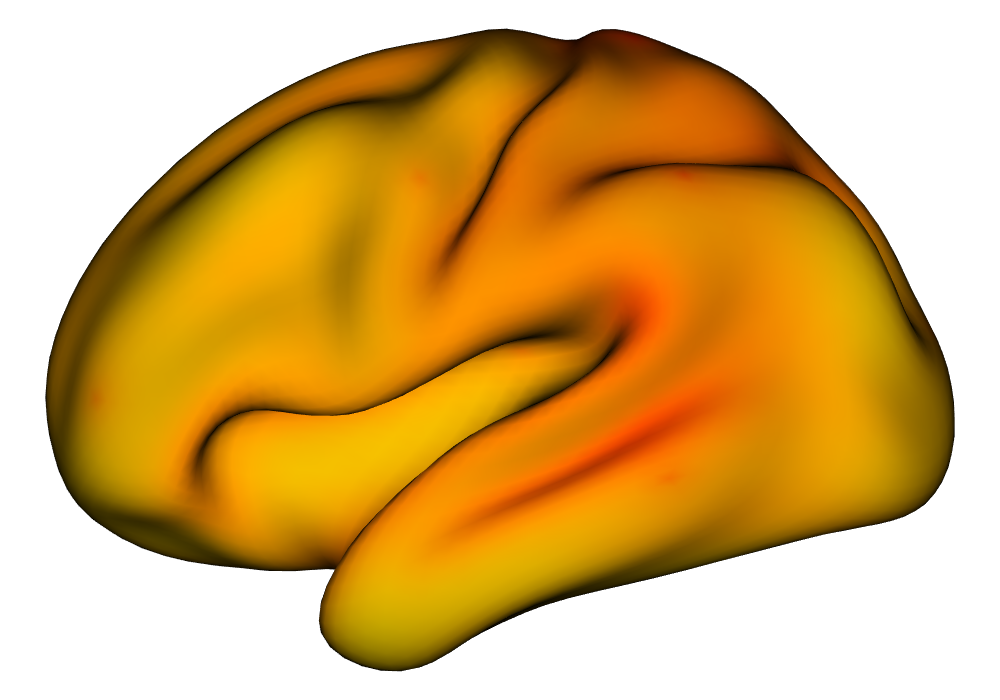
|
\addvbuffer[3pt 0pt]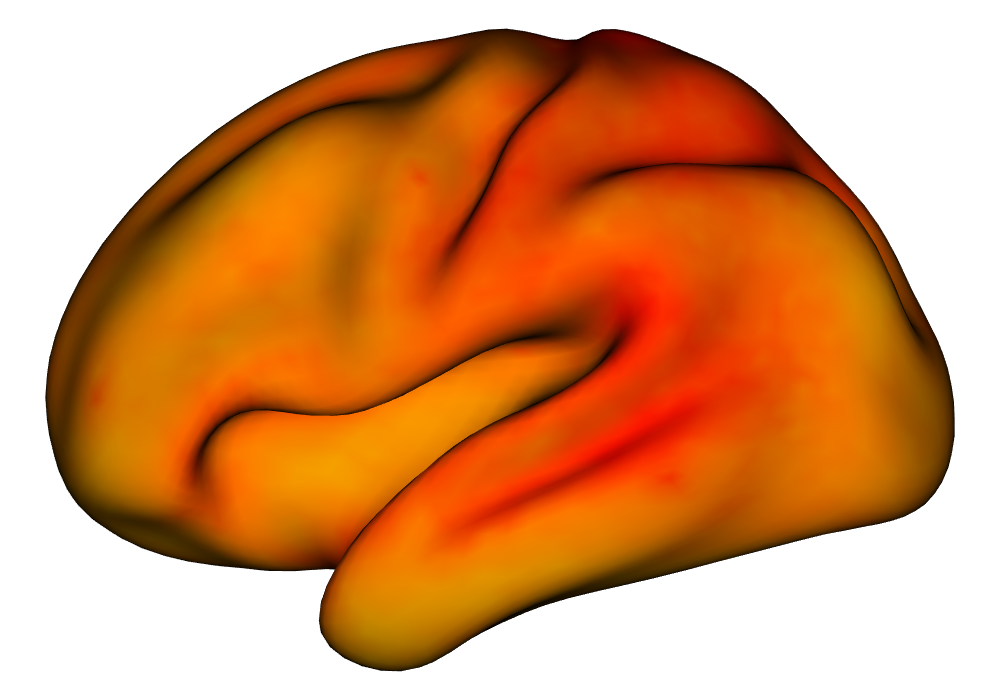
|
|
\addvbuffer[3pt 0pt] |
||
| 32k Vertices | 5k Vertices | |
|---|---|---|
|
Subject A |
\addvbuffer[3pt 0pt]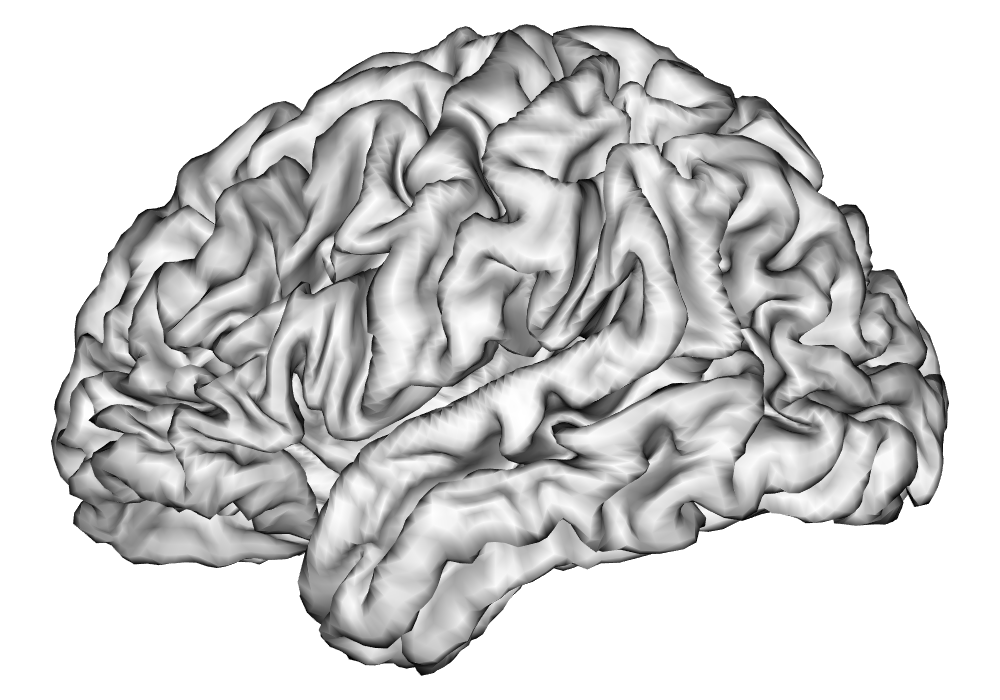
|
\addvbuffer[3pt 0pt]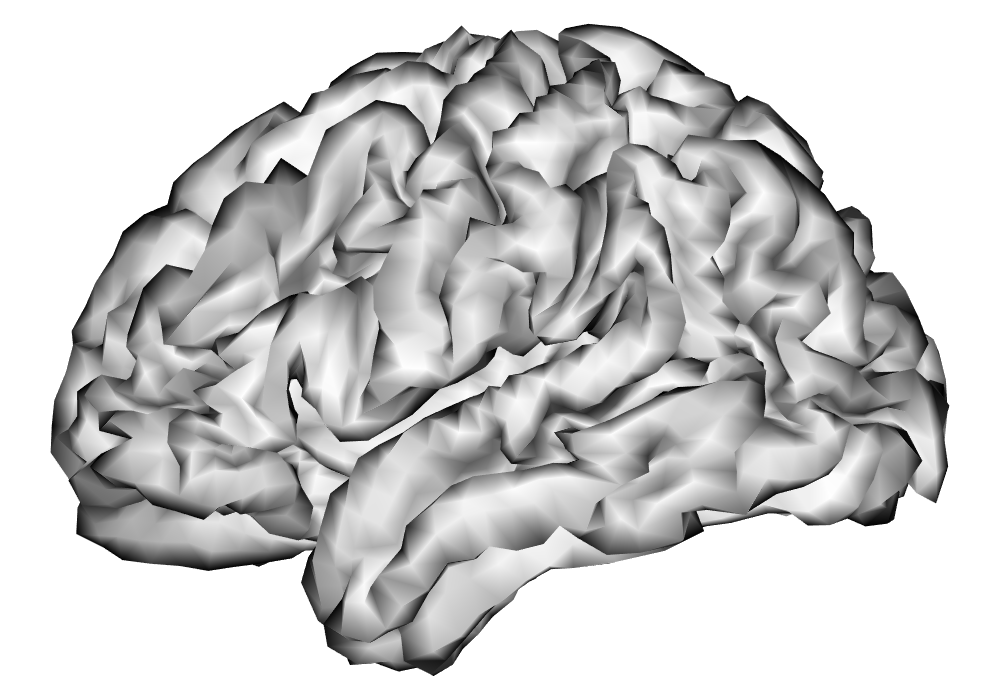
|
|
Subject B |
\addvbuffer[3pt 0pt]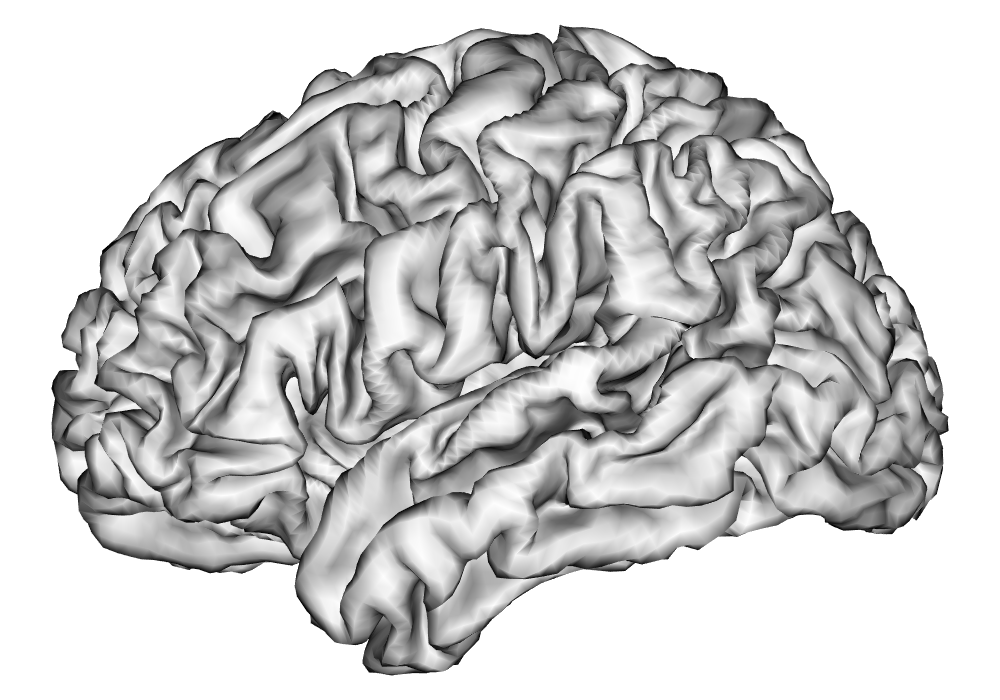
|
\addvbuffer[3pt 0pt]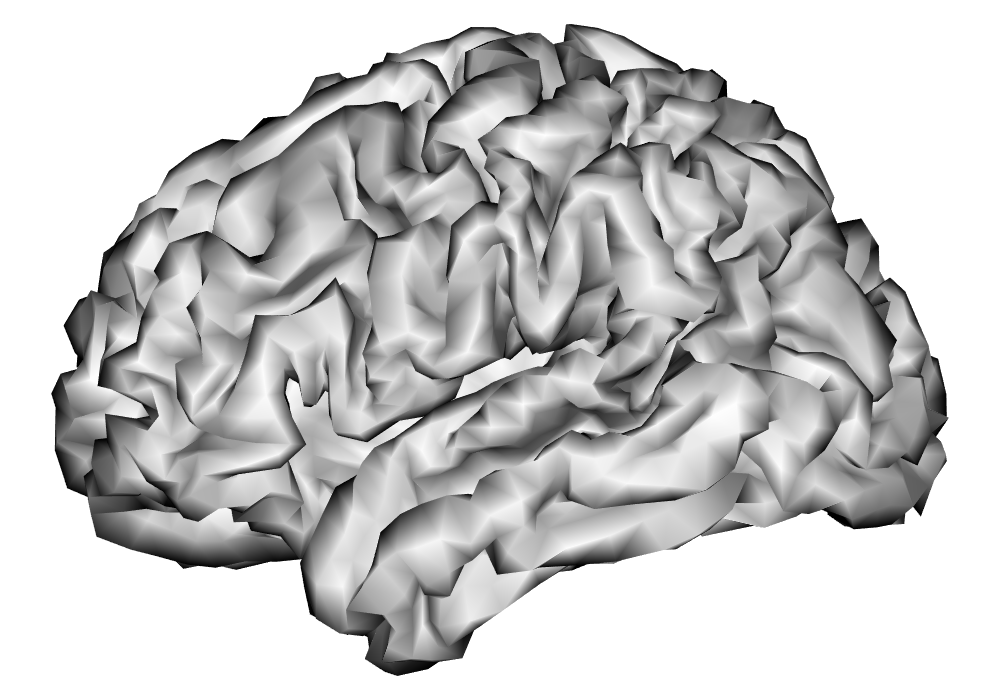
|