FAST search for circumstellar atomic hydrogen. II. Is BD+303639 an interacting planetary nebula?
Abstract
The young, compact, very high surface brightness but low excitation planetary nebula (PN) BD+30∘3639 is one of the very few PNe that have been reported to exhibit the 21 cm H I emission line. As part of a long-term programme to search for circumstellar atomic hydrogen, we observed the 21 cm feature toward BD+30∘3639 with the Five-hundred-meter Aperture Spherical radio Telescope (FAST). Assuming a direct association between the PN and the detected H I emission, these new observations show that this surrounding emission is significantly more spatially extended than indicated by previous interferometric observations, and can be resolved into two velocity components. The estimated H I mass is larger than 100 M☉, invalidating an origin from the host star itself or its ejecta for the emitting material. We discuss the possibility that the extended H I emission stems from the interstellar medium (ISM) swept out over time by the stellar wind. Moreover, we report tentative detections of H I absorption features lying near and blueward of the systemic velocity of this PN, which are probably from a stalled asterosphere at the outer boundary of the expanding ionized region. The mass of the gas producing the H I absorption is insufficient to solve the so-called ‘PN missing mass problem’. We demonstrate the capability of FAST to investigate the interaction process between a PN and the surrounding ISM.
1 Introduction
As the descendant of low- and intermediate-mass stars (0.8 to 8 ), planetary nebulae (PNe) are important tools for understanding the history of stellar winds and the life cycle of materials in a Galaxy (Kwitter & Henry, 2022). However, extensive PN observations show that the total mass of the ionized material and the central star is only up to 1.5 M☉ (e.g., Kimura et al., 2012), much lower than the theoretical upper limit. This is the so-called ‘PN missing mass problem’ (Kwok, 1994). CO and H2 observations indicate that PNe have molecular envelopes with a mass from to a few M☉ (Huggins et al., 1996; De Marco et al., 2022), while infrared observations suggest that PNe have low dust-to-gas mass ratios (, Phillips, 2007; Andriantsaralaza et al., 2020), suggesting that the missing mass of PNe is not in either molecules or dust grains. Furthermore, only a modest number of PNe have detected so-called ‘AGB’ haloes where at least some of this missing mass is located (see, e.g., Corradi et al., 2003), so the overall problem remains. Another potentially substantial nebular component is atomic hydrogen (H I), especially in ionization-bound PNe (see, e.g., Kwitter & Henry, 2022, for a review).
H I has been detected through the 21 cm emission in several circumstellar shells surrounding evolved stars (1 pc; Gérard & Le Bertre, 2006), demonstrating that the H I emission could serve as a tracer of the early history of PN mass loss. However, such observations are very challenging, in part because of strong contamination from interstellar H I emission. To our best knowledge, only five PNe have been reported as having a detection of the H I emission line (Taylor & Pottasch, 1987; Taylor et al., 1990; Rodríguez et al., 2000, 2002; Gérard & Le Bertre, 2006). Taking this into account, we launched a project to search for H I in PNe (Ouyang et al., 2022, Paper I hereafter) using the new Five-hundred-meter Aperture Spherical radio Telescope (FAST; Nan et al., 2011), which is the most sensitive telescope at L-band frequencies of relevance here (Jiang et al., 2020).
In Paper I we reported a FAST detection of H I absorption from the young PN IC 4997. This paper is devoted to investigate the dynamic interaction between PN and the interstellar medium (ISM) through the observation of H I emission toward another young (600-800 year kinematic age) PN BD+30°3639 (BD+30 hereafter). Further details and multi-wavelength imagery, including from the Hubble Space Telescope (HST) and near infrared and optical spectroscopy of BD+30 can be found in the Hong Kong/AAO/Strasbourg/H PNe database (HASH, Parker et al., 2016) as catalogue entry 512. It is known that interaction between PN ejecta and the surrounding ISM can distort the morphology of circumstellar envelopes and cause a very extensive spatial distribution of both PN ejecta and swept up materials (e.g., Villaver et al., 2003; Sabin et al., 2010). Therefore, such a study might help to understand the ‘PN missing mass problem’.
The PN-ISM interaction has been an intensively studied topic (e.g. Gurzadian, 1969). Based on a thin-shell approximation and snowplow model, Smith (1976) found that the central star of interacting PN have a certain displacement with respect to nebular center. The simple analysis of Borkowski et al. (1990) showed that the PN-ISM interaction could lead to an asymmetrical surface brightness of PN. Soker et al. (1991) suggested that the PN-ISM interaction could be summarized into three phrases as briefly outlined below. Initially, when nebular density is greater than that of the surrounding ISM, the PN is in a free-expanding phase, typically at velocities of – km s-1. With this nebular expansion and without further material injection, the PN density naturally decreases and eventually reaches a value comparable to that of the ambient, surrounding ISM. The upstream of the PN shell is compressed so that the surface brightness of the interacting region increases—examples include PNe like PFP1 (HASH ID 2522, Pierce et al., 2004). This happens for already very evolved PN and there are few clear examples in the literature. As the PN density further drops, the PN shell becomes significantly distorted and the central star of the PN (CSPN) appears to be located closer to the upstream edge. Subsequently, the CSPN would move out of the PN shell, while the PN shell itself eventually dissipates and is completely mixed with the ISM. One putative example of this is Sh 2-174 (HASH ID 643, Tweedy & Napiwotzki, 1994) but this object is now classified as ionised ISM in HASH. The 30-year old analysis of Soker et al. (1991) assumed that the PN shell formed before the PN-ISM interaction. However, observations show that an interaction may occur at various stages of PNe evolution (Rauch et al., 2000).
A more comprehensive hydrodynamic simulation of these types of interaction was performed by Wareing et al. (2007), taking into account a wide range of PN moving velocities, mass loss rates, and ISM density. This work shows that the PN-ISM interaction can be divided into four stages: (i) the PN expands freely; (ii) a bow shock is formed in the interacting region, and the density and surface brightness increase in the upstream of CSPN movement direction; (iii) PN geometric center moves downstream with respect to CSPN; (iv) the PN shell is completely stripped and the CSPN moves outside the PN shell. In truth there are very few examples available for study of PNe that have gone through stages (iii) and (iv).
BD+30 (, ) is one of the brightest young PNe in the solar neighborhood. It was used as one of four PN examples to demonstrate the value of the so-called distance mapping technique (DMT) based on an expansion parallax method (Gómez-Gordillo et al., 2020). They determined the distance to BD+30 of kpc, while the distance calculated from Gaia Data Release 3 (Chornay & Walton, 2021) parallax is kpc. The Surface-Brightness radius relation statistical technique (Frew et al., 2016), arguably the best such distance technique available for the general PN population in the absence of Gaia distances, provides a distance of kpc, in agreement with Gaia values within the errors. We adopt kpc in this paper.
The radial velocity of the PN with respect to the local standard of rest (LSR) is km s-1 (Schneider et al., 1983). BD+30 is a relatively nearby, very high surface brightness PNe saturated in IPHAS (INT Photometric H Survey of the Northern Galactic Plane), PanSTARRS, and (Wide-field Infrared Survey Explorer) imagery. There is clear detection of radio and extended X-ray emission (Leahy et al., 2000). It has a Wolf-Rayet CSPN [WC9] spectrum (Mendez et al., 1991) indicating close-in, fast winds. The optical morphology of BD+30 taken from the available HST imagery is as a boxy-ellipsoid. It is classified as morphological class Eamrs according to the ERBIAS-sparm classification scheme of HASH (refer to Parker, 2022, for details). The optical luminosity is dominated by the bright CSPN (Li et al., 2002).
H2 was detected in the outer layer of the optical ring, which has a diffuse and highly uneven spatial distribution (Shupe et al., 1998). CO is approximately symmetrically distributed at the north and south ends (Bachiller et al., 2000). We refer the reader to Freeman & Kastner (2016) for a 3D multi-wavelength reconstruction of BD+30. Taylor et al. (1990) reported the discovery of H I emission from BD+30 using the Westerbork Synthesis Radio Telescope (WSRT), which appears to be spatially unresolved and has a minor southeastward extension. Among the five PNe with detected H I emission, BD+30 can be reached by FAST at the most optimum zenith angle. BD+30 has a moderate Galactic disk elevation, which compromises between minimizing the contamination from the ISM H I emission and maximizing the ISM density for the occurrence of substantial PN-ISM interaction. Interferometric observations generally lack zero-spacing data, so emission sources above a certain angular size are resolved out and undetectable. This problem becomes more serious when considering issues such as the missing mass problem in the PN and the interaction between the PN and the ISM. By using a single-dish telescope with a large aperture, such as FAST, it is expected that radio emissions missed by conventional interferometry will be detected.
2 Observation and data reduction
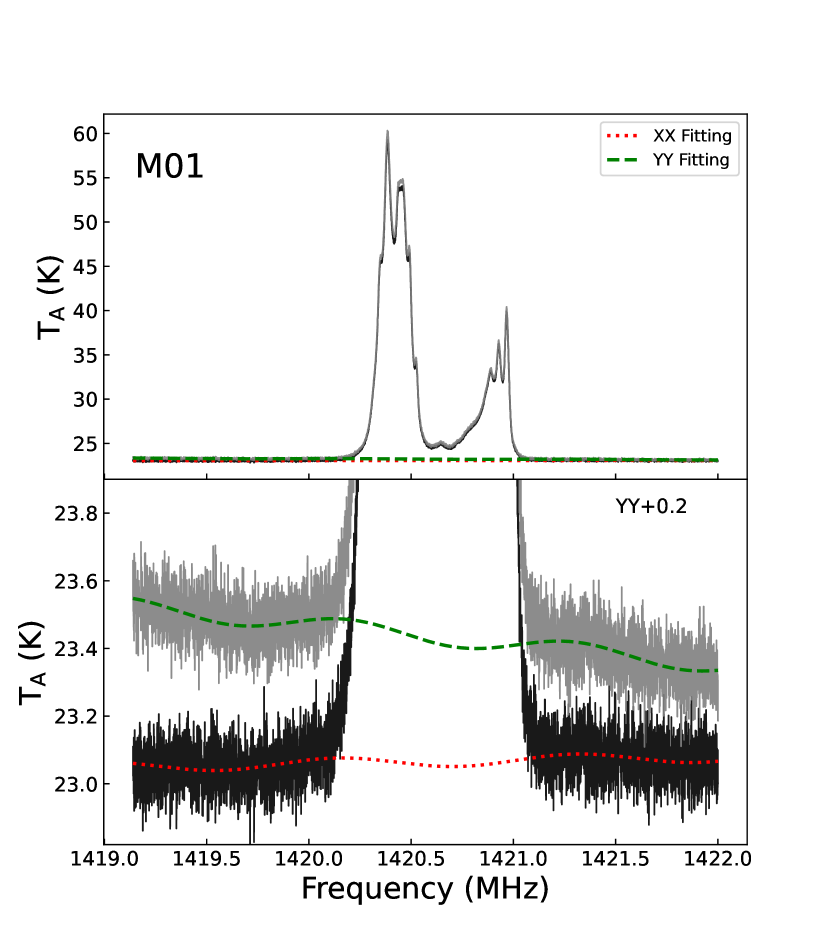
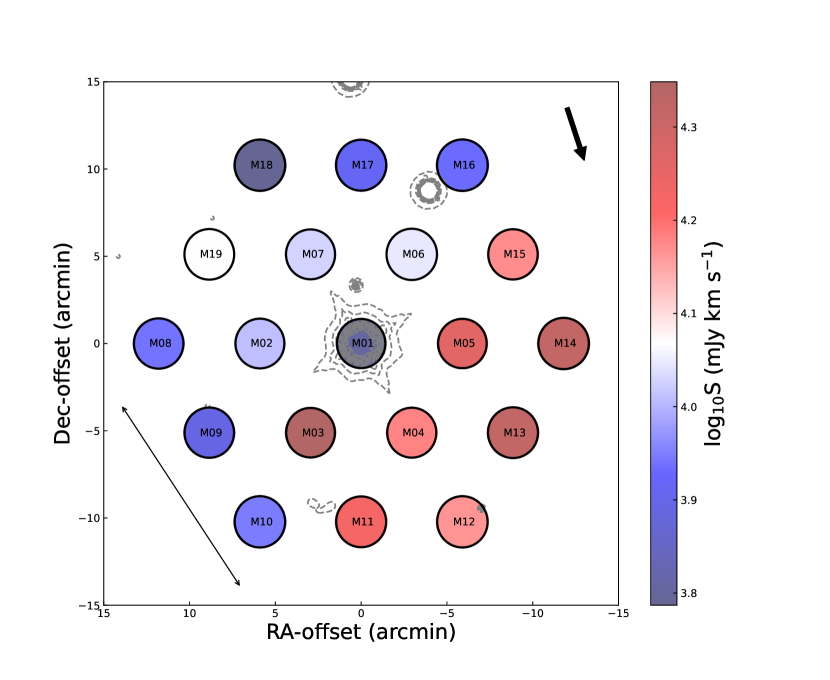
The observations were performed in the tracking mode of FAST with the 19-beam (M01–M19, see Jiang et al., 2020, for the arrangement of the beams) receiver on 2021 August 9. The integration time was 40.5 minutes. The central beam (M01), which has a half-power beamwidth (HPBW) of about 2.82 at 1420 MHz, was consistently oriented toward the target during the observation. The standard deviation of the pointing accuracy is 7.9. The 19-beam observation mode enables us to sample the sky over a region of around the target at 1.42 GHz. The L-band (1.05–1.45 GHz) spectra were recorded by a backend with 1048576 channels, resulting in a frequency resolution of 476.84 Hz and a velocity resolution of 0.01 km s-1. For the flux calibration, a high intensity noise of about 12 K is injected periodically. The antenna temperature was obtained by
| (1) |
where is the injected noise diode temperature, and are the power values when the diode is on and off, respectively. The antenna temperature was converted to flux density by , where is the gain given by K Jy-1. The aperture efficiency depends on the zenith angle at the time of the observation (see Jiang et al., 2020, for details). For our observations, the values of the 19 beams range from 13.3 to 15.9 K Jy-1. The linear polarization channels XX and YY were separately calibrated and a baseline was subtracted. Standing waves may be generated between the dish and the feed cabin, complicating the baseline (Jiang et al., 2020). Therefore, we used a sinusoidal function to fit the baseline. Nevertheless, the standing wave has a low amplitude (see Figure 1 for an example), and barely affects our results. The XX and YY spectra then were co-added to obtain the final spectra. Based on the line-free spectral regions, we obtained a root mean square noise of the final spectrum of 1.05 mJy.
3 Analysis and results
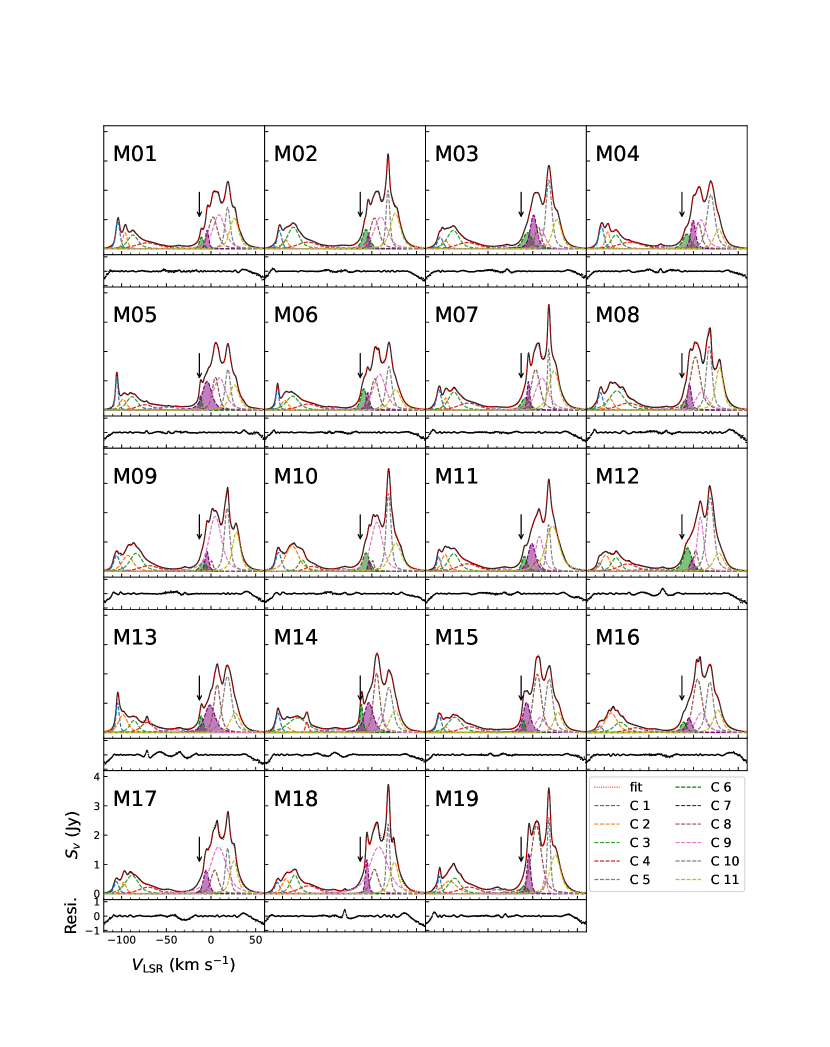
Figure 2 displays the spectra of the 19 beams. The overall spectral shapes are quite similar among the different beams, suggesting that the H I spectra are dominated by interstellar emission. The observed lines are clearly grouped into two main velocity ranges, to km s-1 and to km s-1. The first negative velocity group (in terms of LSR) has a sharp blue wing and a broad red tail down to low flux levels, while the latter is much stronger and does not exhibit a broad red tail. Both major velocity groups are composed of several sub-peaks with different relative intensities for different beams.
3.1 Tentative detection of H I absorption
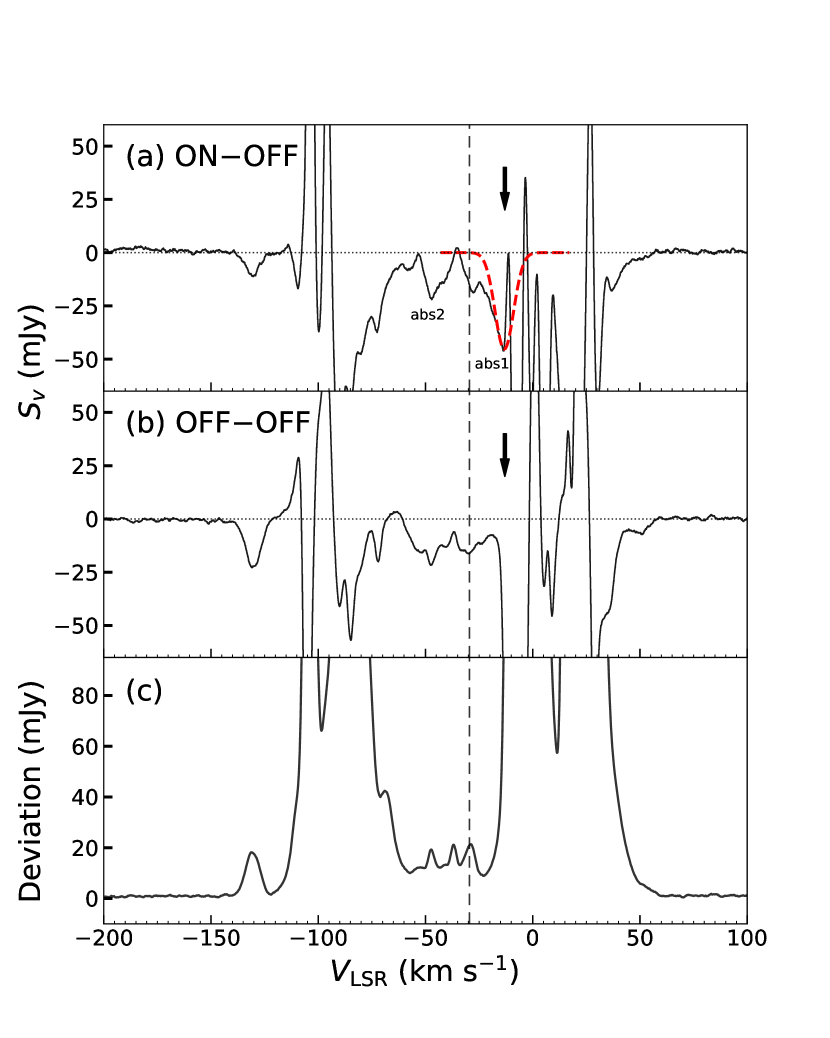
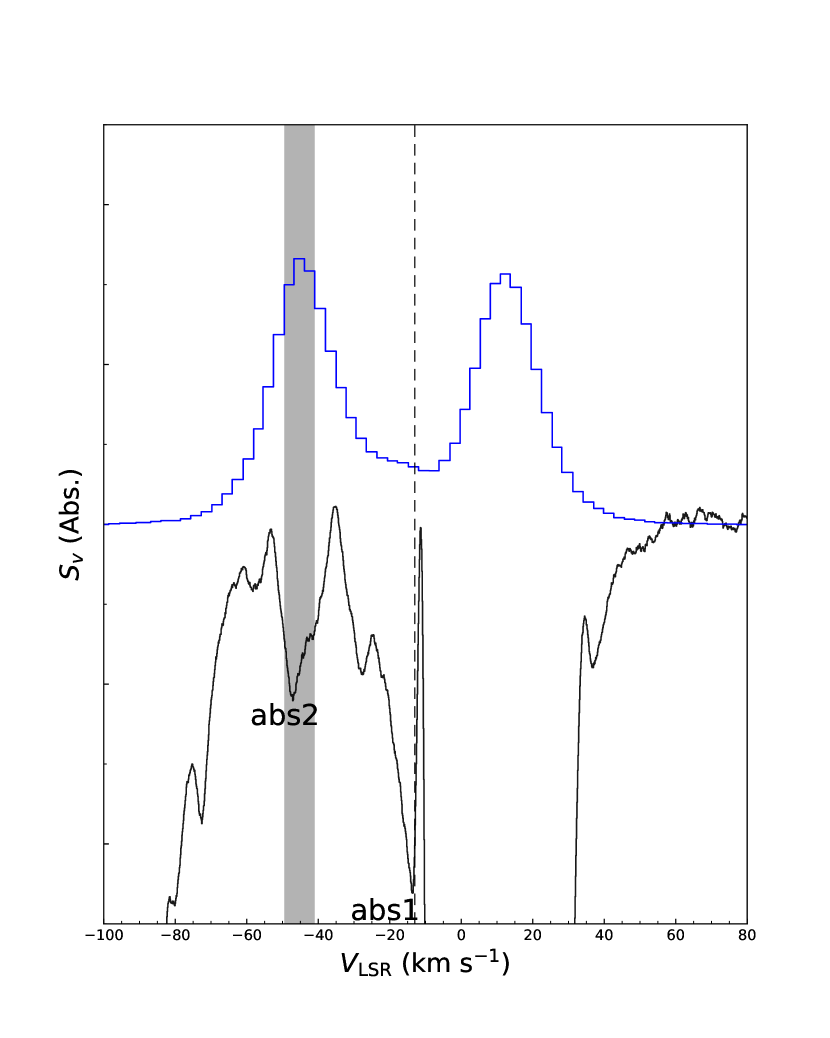
Following Paper I, we take the sky sampled by the beams surrounding M01 as the off-source comparison positions. Therefore, the off-source spectrum is obtained by averaging the M02–M07 spectra and is subtracted from the M01 spectrum to obtain the onoff spectrum, as shown in Figure 3a. For a null check, we obtain two off-position spectra by averaging the spectra observed by the west and east beams and that by the north and south beams. The offoff spectrum is shown in Figure 3b. Taylor et al. (1990) have reported a detection of H I absorption at km s-1. That feature is clearly shown in our onoff spectrum. Apart from that, the onoff spectrum exhibits a broad dip over the velocity range from to km s-1. However, as they are also seen in the offoff spectrum, we cannot exclude the possibility of spurious features caused by the subtraction of the off spectrum. The onoff spectrum exhibits another deeper dip at km s-1, near the systemic velocity of the PN, which is not seen in the offoff spectrum. In Paper I, we detected such a feature in the young PN IC 4997 and attributed it to H I absorption stemming from the front side of an expanding circumstellar shell. The H I absorption is against the free-free continuum of the relatively compact ionized region, and thus is well confined in the central beam only. In order to validate the detection of H I absorption in BD+30, we compute the deviation of the M02-M07 with respect to their average, as shown in Figure 3c. At the velocity of the dip, the deviation is much larger than the depth of the dip, indicating a large variation between different off-position spectra (relative to the circumstellar absorption). The subtraction of the background emission is the dominant uncertainty. Therefore, we cannot definitively rule out the possibility that the dip seen in Figure 3a is a spurious absorption. Nevertheless, we note that such a dip is also visible in the BD+30 spectrum shown in Taylor et al. (1990).
Based on these current data, we consider the detection of circumstellar H I absorption in BD+30 as tentative. Our convincing detection of H I absorption in Paper I for PN IC 4997 can be partly attributed to the considerable difference between the velocities of IC 4997 and interstellar H I lines. For BD+30 however, such discrimination is hindered due to the closer velocities between the PN and the observed interstellar H I lines.
A Gaussian fit is performed to derive the integration strength and width of the absorption feature near the systemic velocity of the PN. The absorption line shows a sharp red edge (Figure 3a), where a H I emission line, as detected by Taylor et al. (1990), contributes to the flux. To this end, we fix the velocity of the dip minimum as the central velocity ( km s-1) and consider the blue side only for the fitting. It results in a full width at half maximum (FWHM) of km s-1, a maximum absorption flux density of mJy, and an integrated flux density of mJy km s-1. Following Taylor et al. (1990) and assuming a continuum flux density at 21 cm of mJy, we obtain the integral of the optical depth () over velocity to be km s-1.
3.2 Extended H I emission
If the atomic shell is very extended, H I can be observed in emission against the Galactic synchrotron background. The H I emission line detected by Taylor et al. (1990) lies in the velocity range of to 2 km s-1 and peaks on the red side. The M01 spectrum clearly exhibits two peaks at the same velocity range, and the peak on the red side is stronger (see Figure 4). Because the spectral resolution of Taylor et al. (1990) is 4.12 km s-1, much poorer than ours, we can conclude that the emission feature discovered by them actually consists of two lines that are well resolved by the FAST observations.
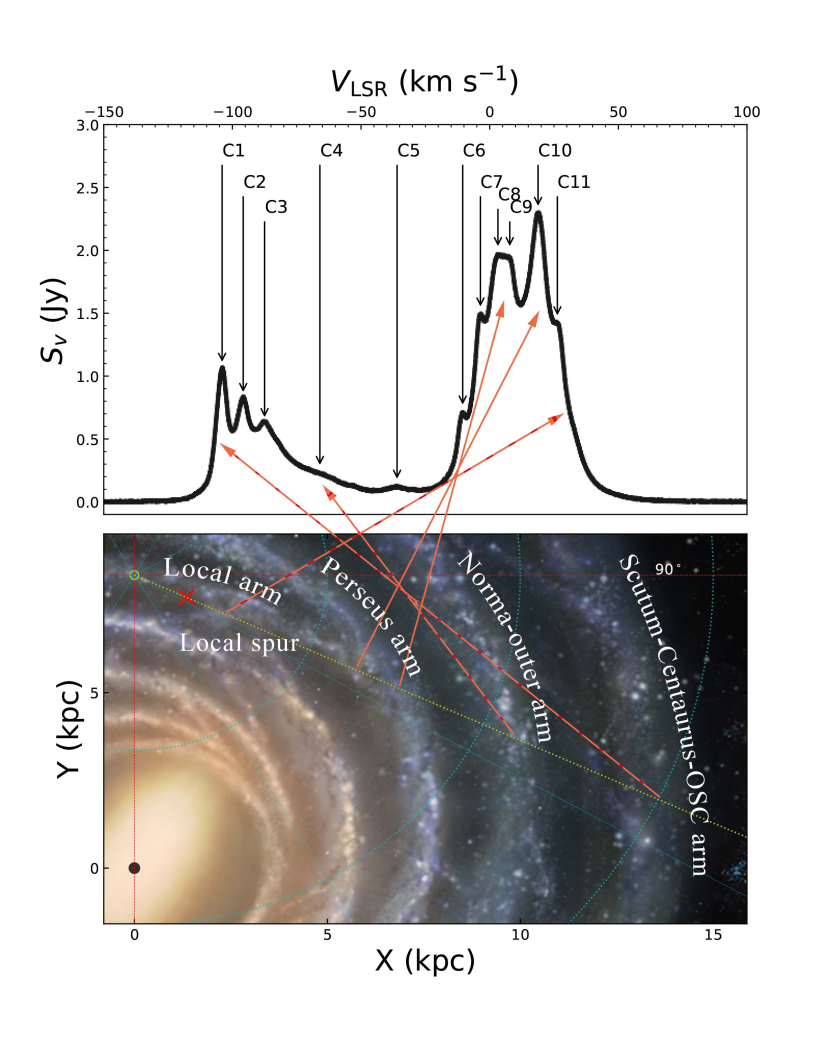
In order to derive the strengths and widths of the two emission lines that are potentially associated with BD+30, we perform a spectral decomposition. By carefully examining the M01–M19 spectra, we find that at least 11 components (C1–C11) are required to reproduce these spectra, as indicated in Figure 2 (also see Figure 4 for a zoom-in of the M01 spectrum). C6 and C7 correspond to the H I emission that is claimed to originate from BD+30 by Taylor et al. (1990). Based on the current Galactic rotation model (Reid et al., 2014, 2016), we can infer the Galactic positions emitting the interstellar spectral components, as illustrated in Figure 4. The negative-velocity group, C1–C5, stems from high-velocity halo gas (Matthews et al., 2015) or the spiral arms at a distance of about 8.7–20.5 kpc, which does not affect the extraction of C6 and C7. However, C9–C11 are badly blended with C6 and C7. The Galactic rotation model indicates that the distances to the regions emitting C11, C10, and C8–C9 are about 2.2, 4.9 and 6.6 kpc, respectively, corresponding to the Local spur (longitude range 50∘–78∘ and velocity range 4–49 km s-1, Reid et al. 2016), the tail of the Local arm (longitude range 55∘–282∘ and velocity range –25 km s-1, Xu et al. 2013), and the Perseus arm (longitude range 25∘–270∘ and velocity range –28 km s-1, Reid et al. 2016) along the line of sight to BD+30. C11 is the tangent-point emission.
The velocities of C6 and C7 do not coincide with those of spiral arms. The properties of individual H I lines are measured by a multiple Voigt profile fitting procedure, for which we use the Python LMFIT package (nonlinear least-square minimization and curve-fitting; Newville et al., 2021). The fitting results are shown in Figure 2, where C6 and C7 are highlighted. The residual errors of fitting for C6 and C7 are better than 14% of the peak brightness. Table 1 presents the integrated flux density over velocity (), the peak LSR velocities (), the FWHMs, and the peak flux densities () of C6 and C7 derived from the spectral decomposition. These values vary spatially, and as a result, the onoff spectrum generates two narrow spikes redward from the absorption in Figure 3a.
For the M01 spectrum, C7 lies on the red side of C6 and appears to have a larger , while the velocity of C6 ( km s-1) is closer to the systemic velocity of the BD+30 than that of C7 ( km s-1). This is entirely consistent with the lower spectral resolution observation of Taylor et al. (1990), where the H I emission line lies redward of the systemic velocity of the PN and has an enhanced red shoulder. On the other hand, the observation of Taylor et al. (1990) with a synthesized beam size of shows that the H I emission is spatially unresolved, and thus should be exclusively confined in the M01 beam. However, C6 and C7 are exhibited in all M01–M19 spectra (See Figure 2 and Table 1), suggesting that the H I emission has an extent of at least . It is clear that the extended structure has been filtered out in the interferometric observation due to the lack of antenna pairs with small separations, which can be well compensated by the FAST observations. C6 and C7 can be tentatively attributed to the front and back sides of a large expanding shell. We assume that their velocities are not symmetric with respect to because of an interaction between the PN and the ISM.
Under the optically thin assumption, the mass of H I can be determined by
| (2) |
Adding the integrated intensities detected in M01-19 spectra, we derive the total mass of H I in C6 and C7 to be 52.3 and 79.2 , respectively. Those are the lower limits of the mass of the postulated shell because of the existence of the unsampled regions between beams. The large mass allows us to rule out the possibility of C6 and C7 as ejected stellar materials. A natural conjecture is that C6 and C7 are the interstellar gas swept-up by the stellar wind emanating from BD+30. Nevertheless, the swept ISM mass is formidably large for a PN. In the models of Wareing et al. (2007), the swept-up shell stalls when the accumulated mass reaches about ten times the ejecta mass, a value smaller than that of C6 and C7. Therefore, we cannot completely exclude the possibility that C6 and C7 originate from clouds overlapping along the line of sight of BD+30 with coincidentally similar velocities. If this were the case, our observations could disprove the conclusion of Taylor et al. (1990), and BD+30 should be omitted from the list of PNe with detected circumstellar H I emission.
4 Discussion
Assuming that our tentative detection of the H I absorption (Fig. 3c) is real and using the same method described in Paper I, we can estimate the expansion velocity, mass, and column density of the neutral shell traced by the absorption at km s-1. The expansion velocity along the line of sight is derived from km s-1. An optical spectroscopic study has shown that the N+ and O++ ionized regions have an expansion velocity of 28 km s-1 and 35.5 km s-1, respectively (Bryce & Mellema, 1999). It is well known that BD+30 contains a central hot-bubble (e.g. Heller et al., 2018) also revealed as extended X-ray emission (Leahy et al., 2000). The ionization and shock heating may results in a radial pressure gradient, causing an acceleration of the ionized gas. Another potential cause for the low H I velocity is that the proposed interaction with the ISM has caused significant deceleration of a much more extended neutral shell, indicating the presence of a stalled astrosphere. Under a thin-shell assumption, the angular radius of the H I envelope is about equal to that of the ionized region (.93, Bojičić et al., 2021). The excitation temperature of H I in the PN is poorly known, but it is reasonable to assume an intermediate value of 100 K (see Altschuler et al., 1986, and Paper I for a discussion). From the absorption feature at km s-1, the column density and mass of the H I are thus determined to be N cm-2 and M M☉, respectively. From the continuum flux density we estimate the mass of ionized gas to be M☉. Consequently, the mass ratio of atomic to ionized gas is about 0.8, which is close to the value in another young PN IC 4997 (Paper I). It should be emphasized that the atomic/ionized gas mass ratio is independent of the distance and nebular size under the thin-shell assumption. The number of neutral hydrogen atoms in BD+30 is estimated as .
Figure 5 presents a comparison between our spectrum and the [N II] emission line observed by Bryce & Mellema (1999). The [N II] line traces the velocity of the outermost ionized gas, which can be accelerated by the pressure from the ionized gas. It exhibits two peaks arising from the front and back sides of the expanding ionized shell; the blue one has a velocity coinciding with the dip seen in our H I spectrum between and km s-1. This leads us to the speculation that this dip is associated a H I absorption tracing the outer boundary of the ionized nebula, although the identification is not certain because the velocity is unfortunately similar to that of the interstellar H I. A further support for this speculation comes from the wide-aperture observation of Neiner et al. (2000) who show that [O I] and [S II] emission lines have a similar width suggesting that the velocity remains similar across the ionization front. However, even if validated, the absorption over the velocity range from to km s-1 has an equivalent width comparable to that of the absorption at km s-1, suggesting the mass of the absorption gas to be M M☉, still far less than the missing PN mass.
According to Aller & Hyung (1995), BD+30 has a very low He/H abundance ratio (). Even correcting for helium abundance, the total gas mass is still fairly small compared to the upper theoretical limit of PN mass. Therefore, the observation of H I absorption as in BD+30 cannot solve the ‘PN missing mass problem’. The uncertainties of the mass estimation primarily stem from the assumed radius of the atomic shell. Nevertheless, the observations of Bachiller et al. (2000) demonstrate that the molecular and ionized regions of BD+30 have a similar size, which justifies the thin-shell assumption for the calculation of the H I mass.
Is the missing mass contained in extended nebulosity that has been stripped by the ram pressure of the ISM? To settle this question we need to investigate the interaction between BD+30 and the ISM. BD+30 has a proper motion of mas yr-1 and mas yr-1 in right ascension and declination, respectively (Gaia Collaboration et al., 2021). The values are in good agreement with those given by Kerber et al. (2008) but with lower uncertainties. This corresponds to a velocity of km s-1 eastward and km s-1 northward at an adopted distance of 1.5 kpc, and thus the position angle of the proper motion is 192∘.7 east of north. The heliocentric velocity of BD+30 is 31.4 km s-1 (Schneider et al., 1983). Assuming that the ISM follows the Galactic rotation with no peculiar motion, we can calculate the velocity of BD+30 relative to its ambient ISM (). Using the Oort constants of km s-1 kpc-1 and km s-1 kpc-1, we obtain the radial and tangential velocities of the local ISM with respect to the position of the sun to be km s-1 and km s-1, respectively. The ISM velocities can be converted to heliocentric values by adopting a solar motion with respect to the LSR of km s-1 (Reid et al., 2019), where the velocity components , , and are respectively defined along the radial, orbital, and vertical directions of the Galactic plane. We finally have a value of km s-1. The Galactic disk elevation of BD+30 is about 130 pc, where the ISM is largely composed of cold neutral gas (Heiles & Troland, 2003). The large motion velocity and the high ISM density provide favorable conditions for the interaction between stellar wind and ISM, even for such a young PN. However, there is scant evidence in the optical for any obvious ISM-PN interaction probably because of insufficient ultraviolet radiation to excite optical lines in extended regions.
The statistical study of Ali et al. (2012) shows that PNe lying close to the Galactic plane are most likely to interact with molecular and cold neutral clouds. Matthews et al. (2015) have demonstrated that a H I observation with a single-dish telescope is more sensitive to detect the diffuse low surface brightness emission surrounding the carbon-rich asymptotic giant branch (AGB) star IRC+10216 compared to the Very Large Array. A H I emission tail formed by the interaction with the ISM has been discovered in an AGB Mira variable (Matthews et al., 2008). It has been shown that the asymmetric distribution of H I emission, the increase of flux in the interaction region, and the formation of bow shock can be perceived as a sign of wind-ISM interaction (Tweedy & Kwitter, 1996; Dgani & Soker, 1998). In Figure 6 we examine the spatial distribution of the integrated intensity of C6 and C7. It is shown that the outer beams detect stronger H I emission than the central beam. The H I emission is obviously enhanced toward the southwest, which is roughly aligned with the direction of the proper motion. This is a typical characteristic of the interaction between a moving PN and the ISM that causes the accumulation of gas upstream of the direction of PN motion. Apart from that, the density gradient of the ISM could also affect the morphology of the circumstellar envelope, and possibly lead to an enhancement of H I emission toward the Galactic disk. This is not supported by our observations (see Figure 6) partly because the density scale height is much larger than the nebular size.
How much is the ISM gas that could be swept up by the motion and expansion of BD+30? Assuming that the stellar winds were launched during the AGB phase and lasted years and taking the expansion velocity to be a typical value km s-1, we find that these earlier stellar winds, prior to final PN envelope ejection, can reach up to a radius of 2 pc in the head-on direction, corresponding to an angular radius of . Considering the significant uncertainty of such a crude estimation, this value is not far from the observed extent of H I emission (Figure 6). If BD+30 crosses the ISM at a constant velocity of km s-1, its central star has travelled a length of about 5 pc since it joined the AGB phase. A runaway shell expanding at a constant velocity () would take on a raindrop-like shape. A simple geometric calculation shows that the volume of the plowed ISM gas is about 42 pc3. The cold neutral medium has a density of –100 cm3 (Wooden et al., 2004), and thus the mass of the swept ISM gas is estimated to be 10–100 . If the central star of BD+30 has been decelerated by dynamic friction (i.e. the initial velocity is larger than 50 km s-1), the mass of the swept ISM gas will be larger than the above estimated value. Therefore, the mass value estimated for the swept material is compatible with that derived from the intensities of the H I emission lines ( M☉). Despite the severe uncertainties in these estimates, there is a reasonable agreement that supports the swept-material interpretation. It should also be noted that the flow surrounding the PN-ISM interface could constrain the nebular expansion and cause a smaller mass of the swept ISM gas. A sophisticated modelling is required to obtain an accurate estimation, which is beyond the scope of this paper. According to Borkowski et al. (1990), the PN-ISM interaction is observable when the nebular density decreases to a critical density, , where is the isothermal sound speed. Assuming cm-3 and km s-1, we obtain cm-3. The density of the H I shell is presumably lower than , and thus could ensure the occurrence of the PN-ISM interaction.
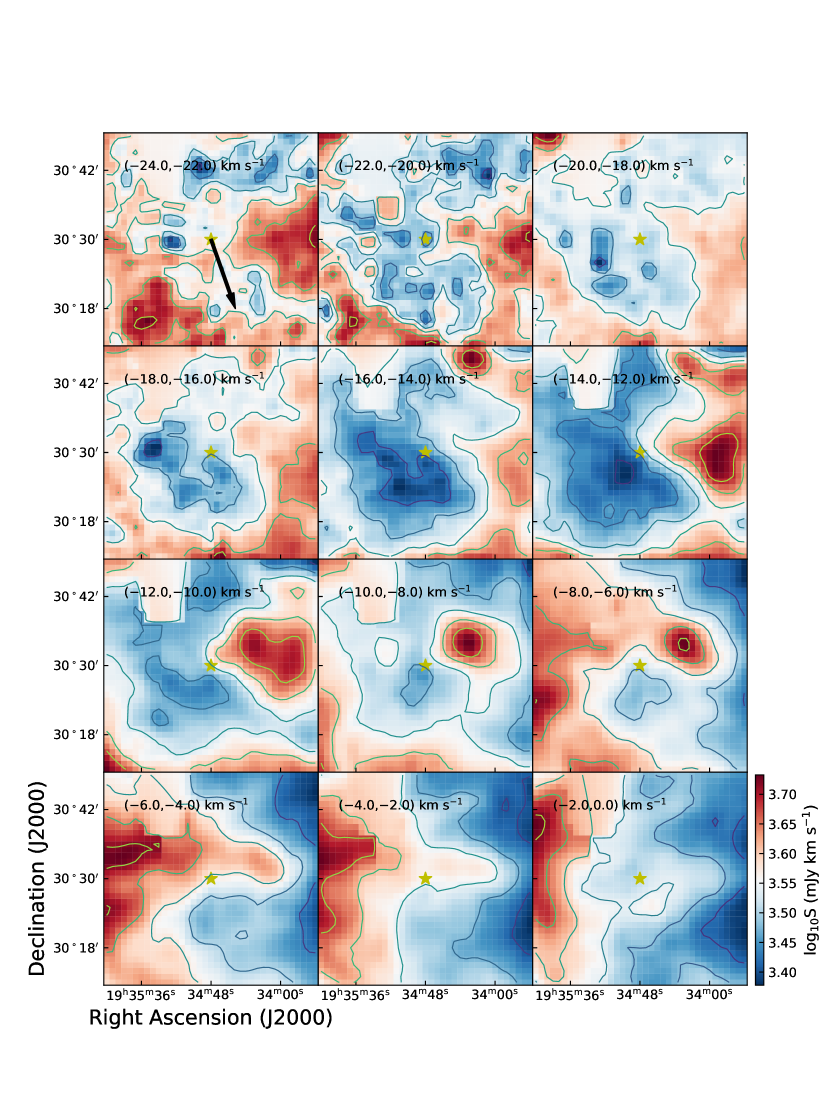
Also shown in Figure 6 is the contour map of the WISE W4 (22 m) band. This appears unresolved, as seen in the WISE images in HASH for convenience. It has been shown that thermal emission from cold dust in the mid-infrared is a good tracer for extended PN-ISM structures (e.g. Zhang et al., 2012; Ramos-Larios et al., 2018). However, we do not see any dust emission associated with the H I shell. To further validate our observations, we extracted the data of the Galactic Arecibo L-Band Feed Array H I (GALFA-H I) survey (Peek et al., 2011, 2018). Although the GALFA-H I data have a lower sensitivity than the FAST observations, they cover a contiguous sky area surrounding BD+30. The channel maps of the H I emission is shown in Figure 7. We can see that the maps in the velocity range of to km s-1 exhibit a cavity in the position of BD+30 and the emission appears to be stronger in the leading edge of the PN. This is consistent with our observations and may be considered as a possible trail that has be plowed by a moving expending shell in the ISM. Due to the large velocity shear at the PN-ISM interface, a Kelvin-Helmholtz instability is developed and induces turbulent mixing in the wake. If our interpretation is correct, it would mean that the H I shell of the PN has largely merged with the ISM and thus is the key to solve the puzzle of missing mass.
Despite the points mentioned above favoring the PN-ISM interaction, the possibility of the H I features resulting from contamination of a foreground cloud remains. The large swept ISM mass is extraordinary for a PN, but is typical for supernova remnants (SNRs) and Wolf-Rayet stars. We notice that indeed a SNR, G65.2+5.7 (, ), is coincident in position with BD+30. G65.2+5.7 has a diameter of and a distance of 800 pc (Xiao et al., 2009), and thus is likely to contribute to the H I absorption and emission. Additional support for this possibility comes from Vincent & Kang (2011) who discovered emission from an expanding H I shell around G65.2+5.7 within the velocity range of km s-1 to 10 km s-1. This is consistent with the components C6 and C7, and these could be part of the SNR shell. The H I emission found towards BD+30 by Taylor et al. (1990) also falls within this velocity range, but is likely associated with BD+30 as it is spatially unresolved and coincident with BD+30. The BD+30 emission measured by Taylor et al. (1990) may be related to the spatially extended component detected by FAST, supporting some association between the wide H I emission and the PN and the idea that the majority of the H I emission would be swept ISM material. The presence of large scale emission from the SNR complicates the interpretation for velocities redward of the systemic velocity of BD+30.
5 Conclusion
We have searched for atomic hydrogen surrounding the young PN BD+30 using the FAST 19-beam observations. The new high-quality spectra confirm the existence of H I emission toward this PN, as previously discovered by interferometry (Taylor et al., 1990). However, we find that the H I emission detected by Taylor et al. (1990) is in fact resolved into two individual velocity components and extends to an angular radius of rather than confined to a compact region. The mass of the H I shell is larger than 100 M☉, excluding the possibility that it is primarily composed of ejected stellar materials from the host star of BD+30. A reasonable conjecture is that the large H I shell stems from material swept up by the BD+30-ISM interaction processes at earlier stages of evolution although such a large swept ISM mass has never been reported for a PN. The H I emission is enhanced roughly along the leading edge of BD+30, providing further evidence supporting this conjecture.
We tentatively detect circumstellar H I absorption features. The H I absorption is expected at various velocities: systemic if it is located in a stalled asterosphere where it sweeps up interstellar gas or at the blueshifted velocities if just outside the ionized region. The H I gas producing the absorption is estimated to have a mass of M☉.
However, we cannot firmly rule out the possibility that the detected H I absorption and emission may originate from a SNR that overlaps along the line of sight and happens to have similar velocities to BD+30. If this was the case, the number of PNe with detected H I emission would be reduced from five to four. Nevertheless, this possibility is not particularly likely because it does not seem to fit the interferometric observations of Taylor et al. (1990).
Investigating PN-ISM interactions in cases like BD+30 is a promising avenue to solve the ‘PN missing mass problem’. The resultant circumstellar structures are prone to be revealed by the observations of H I emission. Unlike interferometric observations that are insensitive to structures larger than a certain extent, single-dish telescopes have noteworthy benefits in observing extended circumstellar materials. Although the results of this study are somewhat inconclusive, we demonstrate the feasibility of utilizing the H I observations of FAST to efficiently reveal the structures for future PN-ISM interaction studies.
References
- Ali et al. (2012) Ali, A., Sabin, L., Snaid, S., & Basurah, H. M. 2012, A&A, 541, A98
- Aller & Hyung (1995) Aller, L. H., & Hyung, S. 1995, MNRAS, 276, 1101
- Altschuler et al. (1986) Altschuler, D. R., Schneider, S. E., Giovanardi, C., & Silverglate, P. R. 1986, ApJ, 305, L85
- Andriantsaralaza et al. (2020) Andriantsaralaza, M., Zijlstra, A., & Avison, A. 2020, MNRAS, 491, 758
- Astropy Collaboration et al. (2013) Astropy Collaboration, Robitaille, T. P., Tollerud, E. J., et al. 2013, A&A, 558, A33
- Astropy Collaboration et al. (2018) Astropy Collaboration, Price-Whelan, A. M., Sipőcz, B. M., et al. 2018, AJ, 156, 123
- Bachiller et al. (2000) Bachiller, R., Forveille, T., Huggins, P. J., Cox, P., & Maillard, J. P. 2000, A&A, 353, L5
- Bojičić et al. (2021) Bojičić, I. S., Filipović, M. D., Urošević, D., Parker, Q. A., & Galvin, T. J. 2021, MNRAS, 503, 2887
- Borkowski et al. (1990) Borkowski, K. J., Sarazin, C. L., & Soker, N. 1990, ApJ, 360, 173
- Bryce & Mellema (1999) Bryce, M., & Mellema, G. 1999, MNRAS, 309, 731
- Chornay & Walton (2021) Chornay, N., & Walton, N. A. 2021, A&A, 656, A110
- Corradi et al. (2003) Corradi, R. L. M., Schönberner, D., Steffen, M., & Perinotto, M. 2003, MNRAS, 340, 417
- De Marco et al. (2022) De Marco, O., Akashi, M., Akras, S., et al. 2022, Nature Astronomy, 6, 1421
- Dgani & Soker (1998) Dgani, R., & Soker, N. 1998, ApJ, 495, 337
- Freeman & Kastner (2016) Freeman, M. J., & Kastner, J. H. 2016, ApJS, 226, 15
- Frew et al. (2016) Frew, D. J., Parker, Q. A., & Bojičić, I. S. 2016, MNRAS, 455, 1459
- Gaia Collaboration et al. (2021) Gaia Collaboration, Brown, A. G. A., Vallenari, A., et al. 2021, A&A, 649, A1
- Gérard & Le Bertre (2006) Gérard, E., & Le Bertre, T. 2006, AJ, 132, 2566
- Gómez-Gordillo et al. (2020) Gómez-Gordillo, S., Akras, S., Gonçalves, D. R., & Steffen, W. 2020, MNRAS, 492, 4097
- Gurzadian (1969) Gurzadian, G. A. 1969, Planetary Nebulae (New York, Gordon and Breach)
- Heiles & Troland (2003) Heiles, C., & Troland, T. H. 2003, ApJ, 586, 1067
- Heller et al. (2018) Heller, R., Jacob, R., Schönberner, D., & Steffen, M. 2018, A&A, 620, A98
- Huggins et al. (1996) Huggins, P. J., Bachiller, R., Cox, P., & Forveille, T. 1996, A&A, 315, 284
- Jiang et al. (2020) Jiang, P., Tang, N.-Y., Hou, L.-G., et al. 2020, Research in Astronomy and Astrophysics, 20, 064
- Kerber et al. (2008) Kerber, F., Mignani, R. P., Smart, R. L., & Wicenec, A. 2008, A&A, 479, 155
- Kimura et al. (2012) Kimura, R. K., Gruenwald, R., & Aleman, I. 2012, A&A, 541, A112
- Kwitter & Henry (2022) Kwitter, K. B., & Henry, R. B. C. 2022, PASP, 134, 022001
- Kwok (1994) Kwok, S. 1994, PASP, 106, 344
- Leahy et al. (2000) Leahy, D. A., Kwok, S., & Yin, D. 2000, ApJ, 540, 442
- Li et al. (2002) Li, J., Harrington, J. P., & Borkowski, K. J. 2002, AJ, 123, 2676
- Matthews et al. (2015) Matthews, L. D., Gérard, E., & Le Bertre, T. 2015, MNRAS, 449, 220
- Matthews et al. (2008) Matthews, L. D., Libert, Y., Gérard, E., Le Bertre, T., & Reid, M. J. 2008, ApJ, 684, 603
- Mendez et al. (1991) Mendez, R. H., Herrero, A., Manchado, A., & Kudritzki, R. P. 1991, A&A, 252, 265
- Nan et al. (2011) Nan, R., Li, D., Jin, C., et al. 2011, International Journal of Modern Physics D, 20, 989
- Neiner et al. (2000) Neiner, C., Acker, A., Gesicki, K., & Szczerba, R. 2000, A&A, 358, 321
- Newville et al. (2021) Newville, M., Otten, R., Nelson, A., et al. 2021, lmfit/lmfit-py: 1.0.3, Zenodo, v.1.0.3, Zenodo, doi:10.5281/zenodo.5570790
- Ouyang et al. (2022) Ouyang, X.-J., Zhang, Y., Zijlstra, A., et al. 2022, ApJ, 933, 4
- Parker (2022) Parker, Q. A. 2022, Frontiers in Astronomy and Space Sciences, 9, 895287
- Parker et al. (2016) Parker, Q. A., Bojičić, I. S., & Frew, D. J. 2016, in Journal of Physics Conference Series, Vol. 728, Journal of Physics Conference Series, 032008
- Peek et al. (2011) Peek, J. E. G., Heiles, C., Douglas, K. A., et al. 2011, ApJS, 194, 20
- Peek et al. (2018) Peek, J. E. G., Babler, B. L., Zheng, Y., et al. 2018, ApJS, 234, 2
- Phillips (2007) Phillips, J. P. 2007, MNRAS, 381, 117
- Pierce et al. (2004) Pierce, M. J., Frew, D. J., Parker, Q. A., & Köppen, J. 2004, PASA, 21, 334
- Ramos-Larios et al. (2018) Ramos-Larios, G., Guerrero, M. A., Nigoche-Netro, A., et al. 2018, MNRAS, 475, 932
- Rauch et al. (2000) Rauch, T., Furlan, E., Kerber, F., & Roth, M. 2000, in Astronomical Society of the Pacific Conference Series, Vol. 199, Asymmetrical Planetary Nebulae II: From Origins to Microstructures, ed. J. H. Kastner, N. Soker, & S. Rappaport, 341
- Reid et al. (2016) Reid, M. J., Dame, T. M., Menten, K. M., & Brunthaler, A. 2016, ApJ, 823, 77
- Reid et al. (2014) Reid, M. J., Menten, K. M., Brunthaler, A., et al. 2014, ApJ, 783, 130
- Reid et al. (2019) —. 2019, ApJ, 885, 131
- Rodríguez et al. (2000) Rodríguez, L. F., Gómez, Y., & López, J. A. 2000, Rev. Mexicana Astron. Astrofis., 36, 51
- Rodríguez et al. (2002) Rodríguez, L. F., Goss, W. M., & Williams, R. 2002, ApJ, 574, 179
- Sabin et al. (2010) Sabin, L., Zijlstra, A. A., Wareing, C., et al. 2010, PASA, 27, 166
- Schneider et al. (1983) Schneider, S. E., Terzian, Y., Purgathofer, A., & Perinotto, M. 1983, ApJS, 52, 399
- Shupe et al. (1998) Shupe, D. L., Larkin, J. E., Knop, R. A., et al. 1998, ApJ, 498, 267
- Smith (1976) Smith, H. 1976, MNRAS, 175, 419
- Soker et al. (1991) Soker, N., Borkowski, K. J., & Sarazin, C. L. 1991, AJ, 102, 1381
- Taylor et al. (1990) Taylor, A. R., Gussie, G. T., & Pottasch, S. R. 1990, ApJ, 351, 515
- Taylor & Pottasch (1987) Taylor, A. R., & Pottasch, S. R. 1987, A&A, 176, L5
- Tweedy & Kwitter (1996) Tweedy, R. W., & Kwitter, K. B. 1996, ApJS, 107, 255
- Tweedy & Napiwotzki (1994) Tweedy, R. W., & Napiwotzki, R. 1994, AJ, 108, 978
- Villaver et al. (2003) Villaver, E., García-Segura, G., & Manchado, A. 2003, ApJ, 585, L49
- Vincent & Kang (2011) Vincent, C., & Kang, J. 2011, in American Astronomical Society Meeting Abstracts, Vol. 217, American Astronomical Society Meeting Abstracts #217, 256.25
- Wareing et al. (2007) Wareing, C. J., Zijlstra, A. A., & O’Brien, T. J. 2007, MNRAS, 382, 1233
- Wooden et al. (2004) Wooden, D. H., Charnley, S. B., & Ehrenfreund, P. 2004, in Comets II, ed. M. C. Festou, H. U. Keller, & H. A. Weaver (Tucson: University of Arizona Press), 33
- Xiao et al. (2009) Xiao, L., Reich, W., Fürst, E., & Han, J. L. 2009, A&A, 503, 827
- Xu et al. (2013) Xu, Y., Li, J. J., Reid, M. J., et al. 2013, ApJ, 769, 15
- Zhang et al. (2012) Zhang, Y., Hsia, C.-H., & Kwok, S. 2012, ApJ, 755, 53
| Beam | C6 | C7 | ||||||
|---|---|---|---|---|---|---|---|---|
| FWHM | FWHM | |||||||
| (mJy km s-1) | (km s-1) | (km s-1) | (mJy) | (mJy km s-1) | (km s-1) | (km s-1) | (mJy) | |
| M01 | 283963 | 10.630.02 | 5.340.05 | 4007 | 3514151 | 4.330.01 | 4.160.05 | 63522 |
| M02 | 8059786 | 6.500.25 | 9.180.19 | 66054 | 2152213 | 4.070.02 | 3.370.08 | 47939 |
| M03 | 8803686 | 5.870.27 | 11.970.17 | 55337 | 135082109 | 1.000.43 | 8.820.30 | 1151149 |
| M04 | 7145249 | 7.490.08 | 10.630.10 | 50514 | 8015271 | 0.490.03 | 6.220.05 | 96929 |
| M05 | 214341 | 11.660.01 | 3.290.03 | 4897 | 16076620 | 4.410.09 | 12.370.11 | 97731 |
| M06 | 7529213 | 9.060.06 | 7.810.07 | 72516 | 3597136 | 4.550.03 | 4.550.05 | 59318 |
| M07 | 6015459 | 8.090.27 | 10.730.22 | 42126 | 4631146 | 4.820.01 | 3.570.03 | 97425 |
| M08 | 2599277 | 9.820.14 | 6.200.20 | 31526 | 6119377 | 4.630.04 | 5.150.08 | 89346 |
| M09 | 3678473 | 8.650.27 | 7.910.27 | 35036 | 4140255 | 4.520.05 | 4.610.08 | 67534 |
| M10 | 7418394 | 6.520.13 | 8.930.13 | 62527 | 1456128 | 3.040.03 | 3.050.08 | 35925 |
| M11 | 4678289 | 9.200.08 | 6.900.10 | 51026 | 120732808 | 1.000.48 | 9.570.51 | 948182 |
| M12 | 11705379 | 6.800.13 | 11.030.10 | 79821 | 28961013 | 1.600.33 | 5.640.36 | 386116 |
| M13 | 3756179 | 10.850.03 | 4.980.08 | 56721 | 169581332 | 1.220.27 | 13.610.42 | 93752 |
| M14 | 470663 | 11.590.01 | 3.690.02 | 9579 | 16024520 | 3.480.09 | 11.810.15 | 102024 |
| M15 | 200081 | 10.070.02 | 3.690.05 | 40713 | 12822186 | 6.800.04 | 9.410.04 | 102512 |
| M16 | 3616349 | 11.160.20 | 7.560.19 | 35928 | 4935623 | 5.120.11 | 7.510.29 | 49448 |
| M17 | 68477 | 13.070.13 | 4.910.26 | 1058 | 7502234 | 5.460.03 | 7.030.07 | 80221 |
| M18 | 25368 | 11.270.19 | 3.090.41 | 6212 | 5870100 | 5.510.01 | 3.820.03 | 115515 |
| M19 | 3195151 | 9.500.14 | 8.880.17 | 2709 | 8497142 | 4.340.01 | 4.640.02 | 137518 |