Feature Selection using e-values
Abstract
In the context of supervised parametric models, we introduce the concept of e-values. An e-value is a scalar quantity that represents the proximity of the sampling distribution of parameter estimates in a model trained on a subset of features to that of the model trained on all features (i.e. the full model). Under general conditions, a rank ordering of e-values separates models that contain all essential features from those that do not.
The e-values are applicable to a wide range of parametric models. We use data depths and a fast resampling-based algorithm to implement a feature selection procedure using e-values, providing consistency results. For a -dimensional feature space, this procedure requires fitting only the full model and evaluating models, as opposed to the traditional requirement of fitting and evaluating models. Through experiments across several model settings and synthetic and real datasets, we establish that the e-values method as a promising general alternative to existing model-specific methods of feature selection.
1 Introduction
In the era of big data, feature selection in supervised statistical and machine learning (ML) models helps cut through the noise of superfluous features, provides storage and computational benefits, and gives model intepretability. Model-based feature selection can be divided into two categories (Guyon & Elisseeff, 2003): wrapper methods that evaluate models trained on multiple feature sets (Schwarz, 1978; Shao, 1996), and embedded methods that combine feature selection and training, often through sparse regularization (Tibshirani, 1996; Zou, 2006; Zou & Hastie, 2005). Both categories are extremely well-studied for independent data models, but have their own challenges. Navigating an exponentially growing feature space using wrapper methods is NP-hard (Natarajan, 1995), and case-specific search strategies like -greedy, branch-and-bound, simulated annealing are needed. Sparse penalized embedded methods can tackle high-dimensional data, but have inferential and algorithmic issues, such as biased Lasso estimates (Zhang & Zhang, 2014) and the use of convex relaxations to compute approximate local solutions (Wang et al., 2013; Zou & Li, 2008).
Feature selection in dependent data models has received comparatively lesser attention. Existing implementations of wrapper and embedded methods have been adapted for dependent data scenarios, such as mixed effect models (Meza & Lahiri, 2005; Nguyen & Jiang, 2014; Peng & Lu, 2012) and spatial models (Huang et al., 2010; Lee & Ghosh, 2009). However these suffer from the same issues as their independent data counterparts. If anything, the higher computational overhead for model training makes implementation of wrapper methods even harder in this situation!
In this paper, we propose the framework of e-values as a common principle to perform best subset feature selection in a range of parametric models covering independent and dependent data settings. In essence ours is a wrapper method, although it is able to determine important features affecting the response by training a single model: the one with all features, or the full model. We achieve this by utilizing the information encoded in the distribution of model parameter estimates. Notwithstanding recent efforts (Lai et al., 2015; Singh et al., 2007), parameter distributions that are fully data-driven have generally been underutilized in data science. In our work, e-values score a candidate model to quantify the similarity between sampling distributions of parameters in that model and the full model. Sampling distribution is the distribution of a parameter estimate, based on the random data samples the estimate is calculated from. We access sampling distributions using the efficient Generalized Bootstrap technique (Chatterjee & Bose, 2005), and utilize them using data depths, which are essentially point-to-distribution inverse distance functions (Tukey, 1975; Zuo, 2003; Zuo & Serfling, 2000), to compute e-values.
How e-values perform feature selection
Data depth functions quantify the inlyingness of a point in multivariate space with respect to a probability distribution or a multivariate point cloud, and have seen diverse applications in the literature (Jornsten, 2004; Narisetty & Nair, 2016; Rousseeuw & Hubert, 1998). As an example, consider the Mahalanobis depth, defined as
for and a -dimensional probability distribution withg mean and covariance matrix . When is close to , takes a high value close to 1. On the other hand, as , the depth at approaches 0. Thus, quantifies the proximity of to . Points with high depth are situated ’deep inside’ the probability distribution , while low depth points sit at the periphery of .
Given a depth function we define e-value as the mean depth of the finite-sample estimate of a parameter for a candidate model , with respect to the sampling distribution of the full model estimate :
where is the estimate of assuming model , is the sampling distribution of , and denotes expectation. For large sample size , the index set obtained by Algorithm 1 below elicits all non-zero features in the true parameter. We use bootstrap to obtain multiple copies of and for calculating the e-values in steps 1 and 5.
-
1:
Obtain full model e-value: .
-
2:
Set .
-
3:
For in
-
4:
Replace index of by 0, name it .
-
5:
Obtain .
-
6:
If
-
7:
Set .
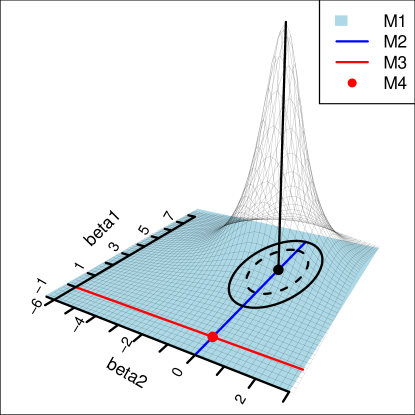
As an example, consider a linear regression with two features, Gaussian errors , and the following candidate models (Figure 1.1). We denote by the domain of parameters considered in model .
| ; | |
| ; | |
| ; | |
| ; |
Let be the true parameter. The full model sampling distribution, , is more concentrated around for higher sample sizes. Thus the depths at points along the (red) line , and the origin (red point), become smaller, and mean depths approach 0 for and . On the other hand, since depth functions are affine invariant (Zuo & Serfling, 2000), mean depths calculated over parameter spaces for (blue line) and (blue surface) remain the same, and do not vanish as . Thus, e-values of the ‘good’ models —models the parameter spaces of which contain —separate from those of the ‘bad’ models more and more as grows. Algorithm 1 is the result of this separation, and a rank ordering of the ‘good’ models based on how parsimonious they are (Theorem 5.1).
2 Related work
Feature selection is a widely studied area in statistics and ML. The vast amount of literature on this topic includes classics like the Bayesian Information Criterion (Schwarz, 1978, BIC) or Lasso (Tibshirani, 1996), and recent advances such as Mixed Integer Optimization (Bertsimas et al., 2016, MIO). To deal with the increasing scale and complexity of data in recent applications, newer streams of work have also materialized—such as nonlinear and model-independent methods (Song et al., 2012), model averaging (Fragoso et al., 2018), and dimension reduction techniques (Ma & Zhu, 2013). We refer the reader to Guyon & Elisseeff (2003) and the literature review in Bertsimas et al. (2016) for a broader overview of feature selection methods, and focus on the three lines of work most related to our formulation.
Shao (1996) first proposed using bootstrap for feature selection, with the squared residual averaged over a large number of resampled parameter estimates from a -out-of- bootstrap as selection criterion. Leave-One-Covariate-Out (Lei et al., 2018, LOCO) is based on the idea of sample-splitting. The full model and leave-one-covariate-out models are trained using one part of the data, and the rest of the data are used to calculate the importance of a feature as median difference in predictive performance between the full model and a LOCO model. Finally, Barber & Candes (2015) introduced the powerful idea of Knockoff filters, where a ‘knockoff’ version of the original input dataset imitating its correlation structure is constructed. This method is explicitly able to control False Discovery Rate.
Our framework of e-values has some similarities with the above methods, such as the use of bootstrap (similar to Shao (1996)), feature-specific statistics (similar to LOCO and Knockoffs), and evaluation at models (similar to LOCO). However, e-values are also significantly different. They do not suffer from the high computational burden of model refitting over multiple bootstrap samples (unlike Shao (1996)), are not conditional on data splitting (unlike LOCO), and have a very general theoretical formulation (unlike Knockoffs). Most importantly, unlike all the three methods discussed above, e-values require fitting only a single model, and work for dependent data models.
Previously, VanderWeele & Ding (2017) have used the term ’E-Value’ in the context of sensitivity analysis. However, our and their definition of e-values are quite different. We see our e-values as a means to evaluate a feature with reference to a model. There are some parallels to the well known -values used for hypothesis testing, but we see the e-value as a more general quantity that covers dependent data situations, as well as general estimation and hypothesis testing problems. While the current paper is an application of e-values for feature selection, we plan to build up on the framework introduced here on other applications, including group feature selection, hypothesis testing, and multiple testing problems.
3 Preliminaries
For a positive integer , Let be an observable array of random variables that are not necessarily independent. We parametrize using a parameter vector , and energy functions . We assume that there is a true unknown vector of parameters , which is the unique minimizer of .
Models and their characterization
Let be the common non-zero support of all estimable parameters (denoted by ). In this setup, we associate a model with two quantities (a) The set of indices with unknown and estimable parameter values, and (b) an ordered vector of known constants at indices not in . Thus a generic parameter vector for the model , denoted by , consists of unknown indices and known constants
| (3.3) |
Given the above formulation, we characterize a model.
Definition 3.1.
A model is called adequate if . A model that is not adequate, is called an inadequate model.
By definition the full model is always adequate, as is the model corresponding to the singleton set containing the true parameter. Thus the set of adequate models is non-empty by construction.
Another important notion is the one of nested models.
Definition 3.2.
We consider a model to be nested in , notationally , if and is a subvector of .
If a model is adequate, then any model it is nested in is also adequate. In the context of feature selection this obtains a rank ordering: the most parsimonious adequate model, with and , is nested in all other adequate models. All models nested within it are inadequate.
Estimators
The estimator of is obtained as a minimizer of the sample analog of :
| (3.4) |
Under standard regularity conditions on the energy functions, converges to a -dimensional Gaussian distribution as , where is a sequence of positive real numbers (Appendix A).
Remark 3.3.
For generic estimation methods based on likelihood and estimating equations, the above holds with , resulting in the standard ‘root-’ asymptotics.
The estimator in (3.4) corresponds to the full model , i.e. the model where all indices in are estimated. For any other model , we simply augment entries of at indices in with elements of elsewhere to obtain a model-specific coefficient estimate :
| (3.7) |
The logic behind this plug-in estimate is simple: for a candidate model , a joint distribution of its estimated parameters, i.e. , can actually be obtained from by taking its marginals at indices .
Depth functions
Data depth functions (Zuo & Serfling, 2000) quantify the closeness of a point in multivariate space to a probability distribution or data cloud. Formally, let denote the set of non-degenerate probability measures on . We consider to be a data depth function if it satisfies the following properties:
-
(B1)
Affine invariance: For any non-singular matrix , and and random variable having distribution , .
-
(B2)
Lipschitz continuity: For any , there exists and , possibly depending on such that whenever , we have .
-
(B3)
Consider random variables such that . Then converges uniformly to . So that, if , then .
-
(B4)
For any , .
-
(B5)
For any with a point of symmetry , is maximum at :
Depth decreases along any ray between to , i.e. for ,
Conditions (B1), (B4) and (B5) are integral to the formal definition of data depth (Zuo & Serfling, 2000), while (B2) and (B3) implicitly arise for several depth functions (Mosler, 2013). We require only a subset of (B1)-(B5) for the theory in this paper, but use data depths throughout for simplicity.
4 The e-values framework
The e-value of model is the mean depth of with respect to : .
4.1 Resampling approximation of e-values
Typically, the distributions of either of the random quantities and , are unknown, and have to be elicited from the data. Because of the plugin method in (3.7), only needs to be approximated. We do this using Generalized Bootstrap (Chatterjee & Bose, 2005, GBS). For an exchangeable array of non-negative random variables independent of the data as resampling weights: , the GBS estimator is the minimizer of
| (4.1) |
We assume the following conditions on the resampling weights and their interactions as :
| (4.2) |
Many resampling schemes can be described as GBS, such as the -out-of- bootstrap (Bickel & Sakov, 2008) and scale-enhanced wild bootstrap (Chatterjee, 2019). Under fairly weak regularity conditions on the first two derivatives and of , and converge to the same weak limit in probability (See Appendix A).
Instead of repeatedly solving (4.1), we use model quantities computed while calculating to obtain a first-order approximation of .
| (4.3) |
where , and . Thus only Monte Carlo sampling is required to obtain the resamples. Being an embarrassingly parallel procedure, this results in significant computational speed gains.
To estimate we obtain two independent sets of weights and for large integers . We use the first set of resamples to obtain the distribution to approximate , and the second set of resamples to get the plugin estimate :
| (4.6) |
Finally, the resampling estimate of a model e-value is: , where is expectation, conditional on the data, computed using the resampling .
4.2 Fast algorithm for best subset selection
For best subset selection, we restrict to the model class that only allows zero constant terms. In this setup our fast selection algorithm consists of only three stages: (a) fit the full model and estimate its e-value, (b) replace each covariate by 0 and compute e-value of all such reduced models, and (c) collect covariates dropping which causes the e-value to go down.
To fit the full model, we need to determine the estimable index set . When , the choice is simple: . When , we need to ensure that , so that (properly centered and scaled) has a unique asymptotic distribution. Similar to past works on feature selection (Lai et al., 2015), we use a feature screening step before model fitting to achieve this (Section 5).
After obtaining and , for each of the models under consideration: the full model and all drop-1-feature models, we follow the recipe in Section 4.1 to get bootstrap e-values. This gives us all the components for a sample version of Algorithm 1, which we present as Algorithm 2.
1. Fix resampling standard deviation .
2. Obtain GBS samples: , and using (4.1).
3. Calculate .
4. Set .
5. for in
6. for in
7. Replace index of by 0 to get .
8. Calculate .
9. if
10. Set .
Choice of
The intermediate rate of divergence for the bootstrap standard deviation : , is a necessary and sufficient condition for the consistency of GBS (Chatterjee & Bose, 2005), and that of the bootstrap approximation of population e-values (Theorem 5.4). We select using the following quantity, which we call Generalized Bootstrap Information Criterion (GBIC):
| (4.7) |
where is the refitted parameter vector using the index set selected by running Algorithm 2 with . We repeat this for a range of values, and choose the index set corresponding to the that gives the smallest . For our synthetic data experiments we take and use GBIC, while for one real data example, we use validation on a test set to select the optimal , both with favorable results.
Detection threshold for finite samples
In practice—especially for smaller sample sizes—due to sampling uncertainty it may be difficult to ensure that the full model e-value exactly separates the null and non-null e-values, and small amounts of false positives or negatives may occur in the selected feature set . One way to tackle this is by shifting the detection threshold in Algorithm 2 by a small :
To prioritize true positives or true negatives, can be set to be positive or negative respectively. In one of our experiments (Section 6.3), setting results in a small amount of false positives due to a few non-null features having e-values close to the full model e-value. Setting to small positive values gradually eliminates these false positives.
5 Theoretical results
We now investigate theoretical properties of e-values. Our first result separates inadequate models from adequate models at the population level, and gives a rank ordering of adequate models using their population e-values.
Theorem 5.1.
Under conditions B1-B5, for a finite sequence of adequate models and any inadequate models , we have for large
As , with having an elliptic distribution if , else .
We define the data generating model as with estimable indices and constants . Then we have the following.
Corollary 5.2.
Thus, when only the models with known parameters set at 0 (the model set ) are considered, e-value indeed maximizes at the true model at the population level. However there are still possible models. This is where the advantage of using e-values—their one-step nature—comes through.
Corollary 5.3.
Assume the conditions of Corollary 5.2. Consider the models with for . Then covariate is a necessary component of , i.e. is an inadequate model, if and only if for large we have .
Dropping an essential feature from the full model makes the model inadequate, which has very small e-value for large enough , whereas dropping a non-essential feature increases the e-value (Theorem 5.1). Thus, simply collecting features dropping which cause a decrease in the e-value suffices for feature selection.
Following the above results, we establish model selection consistency of Algorithm 2 at the sample level. This means that the probability that the one-step procedure is able to select the true model feature set goes to 1, when the procedure is repeated for a large number of randomly drawn datasets from the data-generating distribution.
Theorem 5.4.
Consider two sets of generalized bootstrap estimates of : and . Obtain sample e-values as:
| (5.1) |
where is the empirical distribution of the corresponding bootstrap samples, and are obtained as in Section 4.1. Consider the feature set . Then as , , with as probability conditional on data and bootstrap samples.
Theorem 5.4 is contingent on the fact that the the true model is a member of , that is . This is ensured trivially when . If , is the set of all possible models on the feature set selected by an appropriate screening procedure. In high-dimensional linear models, we use Sure Independent Screening (Fan & Lv, 2008, SIS) for this purpose. Given that is selected using SIS, Fan & Lv (2008) proved that, for constants and that depend on the minimum signal in ,
| (5.2) |
For more complex models, model-free filter methods (Koller & Sahami, 1996; Zhu et al., 2011) can be used to obtain . For example, under mild conditions on the design matrix, the method of Zhu et al. (2011) is consistent:
| (5.3) |
with positive integers and : being a good practical choice (Zhu et al., 2011, Theorem 3). Combining (5.2) or (5.3) with Corollary 5.4 as needed establishes asymptotically accurate recovery of through Algorithm 2.
6 Numerical experiments
We implement e-values using a GBS with scaled resample weights , and resample sizes . We use Mahalanobis depth for all depth calculations. Mahalanobis depth is much less computation-intensive than other depth functions (Dyckerhoff & Mozharovskyi, 2016; Liu & Zuo, 2014), but is not usually preferred in applications due to its non-robustness. However, we do not use any robustness properties of data depth, so are able to use it without any concern. For each replication for each data setting and method, we compute performance metrics on test datasets of the same dimensions as the respective training dataset. All our results are based on 1000 such replications.
6.1 Feature selection in linear regression
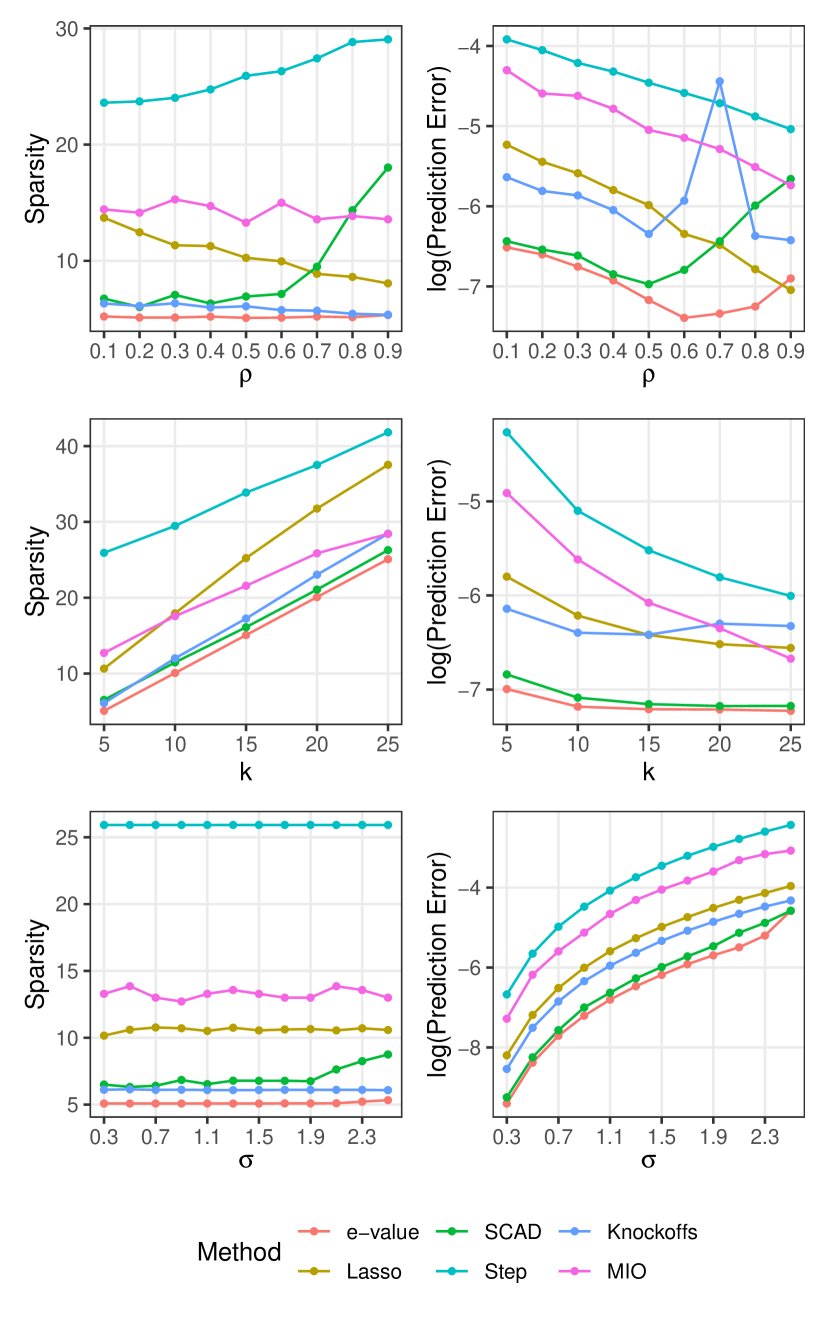
Given a true coefficient vector , we use the model , with , and and . We generate the rows of independently from , where follows an equicorrelation structure having correlation coefficient : . Under this basic setup, we consider the following settings to evaluate the effect of different magnitudes of feature correlation in , sparsity level in and error variance .
-
•
Setting 1 (effect of feature correlation): We repeat the above setup for , fixing , ;
-
•
Setting 2 (effect of sparsity level): We consider , with varying degrees of the sparsity level . We fix ;
-
•
Setting 3 (effect of noise level): We consider different values of noise level (equivalent to having different signal-to-noise ratios) by testing for , fixing .
To implement e-values, we repeat Algorithm 2 for , and select the model having the lowest GBIC.
Figure 6.1 summarizes the comparison results. Across all three settings, our method consistently produces the most predictive model, i.e. the model with the lowest prediction error. It also produces the sparsest model almost always. Among the competitors, SCAD performs the closest to e-values in setting 2 for both the metrics. However, SCAD seems to be more severely affected by high noise level (i.e. high ) or high feature correlation (i.e. high ). Lasso and Step tend to select models with many null variables, and have higher prediction errors. Performance of the other two methods (MIO, knockoffs) is middling.
| Method | e-value | Lasso | SCAD | Step | Knockoff | MIO |
|---|---|---|---|---|---|---|
| Time | 6.3 | 0.4 | 0.9 | 20.1 | 1.9 | 127.2 |
We present computation times for Setting 1 averaged across all values of in Table 6.1. All computations were performed on a Windows desktop with an 8-core Intel Core-i7 6700K 4GHz CPU and 16GB RAM. For e-values, using a smaller number of bootstrap samples or running computations over bootstrap samples in parallel greatly reduces computation time with little to no loss of performance. However, we report its computation time over a single core similar to other methods. Sparse methods like Lasso and SCAD are much faster as expected. Our method has lower computation time than Step and MIO, and much better performance.
6.2 High-dimensional linear regression ()
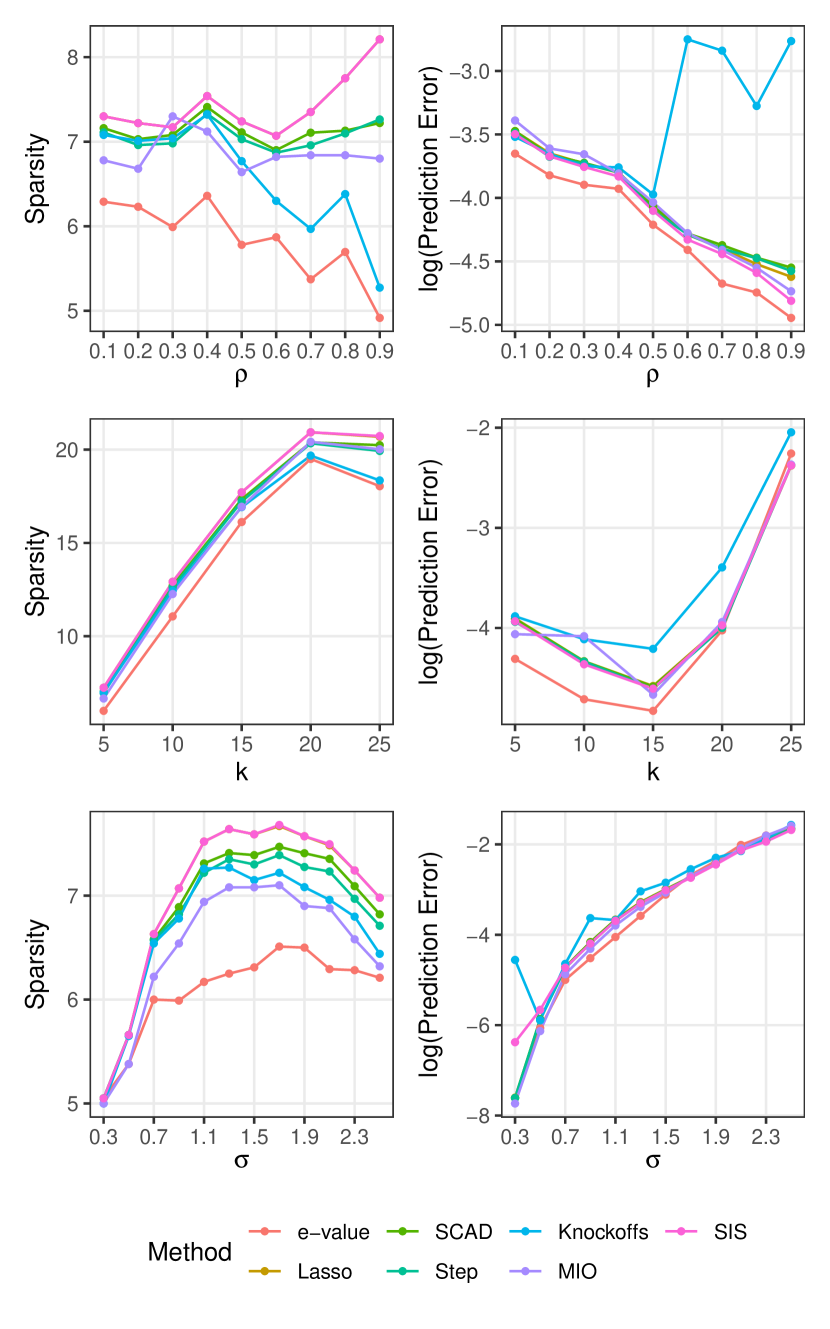
We generate data from the same setup as Section 6.1, but with . We perform an initial screening of features using SIS, then apply the e-values and other methods on this SIS-selected predictor set. Figure 6.2 summarizes the results. In addition to competing methods, we report metrics corresponding to the original SIS-selected predictor set as a baseline. Sparsity-wise, e-values produce the most improvement over the SIS baseline among all methods, and tracks the true sparsity level closely. Both e-values and Knockoffs produce sparser estimates as grows higher (Setting 1). However, unlike the Knockoffs our method maintains good prediction performance even at high feature correlation. In general e-values maintain good prediction performance, although this difference is less obvious than the low-dimensional case. Note that for in setting 2, SIS screening produces overly sparse feature sets, affecting prediction errors for all methods.
6.3 Mixed effect model
| Method | Setting 1: | Setting 2: | |||||||
| FPR | FNR | Acc | MS | FPR | FNR | Acc | MS | ||
| 9.4 | 0.0 | 76 | 2.33 | 0.0 | 0.0 | 100 | 2.00 | ||
| 6.7 | 0.0 | 82 | 2.22 | 0.0 | 0.0 | 100 | 2.00 | ||
| e-value | 1.0 | 0.0 | 97 | 2.03 | 0.0 | 0.0 | 100 | 2.00 | |
| 0.3 | 0.0 | 99 | 2.01 | 0.0 | 0.0 | 100 | 2.00 | ||
| 0.0 | 0.0 | 100 | 2.00 | 0.0 | 0.0 | 100 | 2.00 | ||
| BIC | 21.5 | 9.9 | 49 | 2.26 | 1.5 | 1.9 | 86 | 2.10 | |
| AIC | 17 | 11.0 | 46 | 2.43 | 1.5 | 3.3 | 77 | 2.20 | |
| SCAD (Peng & Lu, 2012) | GCV | 20.5 | 6 | 49 | 2.30 | 1.5 | 3 | 79 | 2.18 |
| 21 | 15.6 | 33 | 2.67 | 1.5 | 4.1 | 72 | 2.26 | ||
| M-ALASSO (Bondell et al., 2010) | - | - | 73 | - | - | - | 83 | - | |
| SCAD-P (Fan & Li, 2012) | - | - | 90 | - | - | - | 100 | - | |
| rPQL (Hui et al., 2017) | - | - | 98 | - | - | - | 99 | - | |
We use the simulation setup from Peng & Lu (2012): , where the data consists of independent groups of observations with multiple () dependent observations in each group, being the within-group random effects design matrix. We consider 9 fixed effects and 4 random effects, with the true fixed effect coefficient and random effect coefficient drawn from . The random effect covariance matrix has elements , , , , , , and the error variance of is set at . The goal here is to select covariates of the fixed effect. We use two scenarios for our study: Setting 1, where the number of groups () considered is , and the number of observations in the group, , is , and Setting 2, where . Finally, we generate 100 independent datasets for each setting. To implement e-values by minimizing GBIC, we consider . To tackle small sample issues in Setting 1 (Section 4.2), we repeat the model selection procedure using the shifted e-values for .
Without shifted thresholds, e-values perform commendably in both settings. For Setting 2, it reaches the best possible performance across all metrics. However, we observed that in a few replications of setting 1, a small number of null input features had e-values only slightly lower than the full model e-value, resulting in increased FPR and model size. We experimented with lowered detection thresholds to mitigate this. As seen in Table 6.2, increasing gradually eliminates the null features, and e-values reach perfect performance across all metrics for .
7 Real data examples
Indian monsoon data
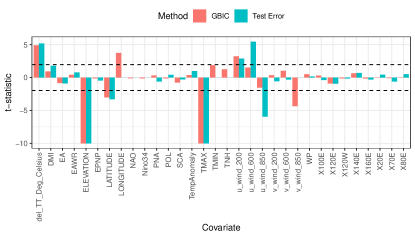

To identify the driving factors behind precipitation during the Indian monsoon season using e-values, we obtain data on 35 potential covariates (see Appendix D) from National Climatic Data Center (NCDC) and National Oceanic and Atmospheric Administration (NOAA) repositories for 1978–2012. We consider annual medians of covariates as fixed effects, log yearly rainfall at a weather station as output feature, and include year-specific random intercepts. To implement e-values, we use projection depth (Zuo, 2003) and GBS resample sizes . We train our model on data from the years 1978-2002, run e-values best subset selection for tuning parameters . We consider two methods to select the best refitted model: (a) minimizing GBIC, and (b) minimizing forecasting errors on samples from 2003–2012.
Figure 7.1a plots the t-statistics for features from the best refitted models obtained by the above two methods. Minimizing for GBIC and test error selects 32 and 26 covariates, respectively. The largest contributors are maximum temperature and elevation, which are related to precipitation based on the Clausius-Clapeyron relation (Li et al., 2017; Singleton & Toumi, 2012). All other selected covariates have documented effects on Indian monsoon (Krishnamurthy & Kinter III, 2003; Moon et al., 2013). Reduced model forecasts obtained from a rolling validation scheme (i.e. i.e. use data from 1978–2002 for 2003, 1979-2003 for 2004 and so on) have less bias across testing years (Fig. 7.1b).
Spatio-temporal dependence analysis in fMRI data
This dataset is due to Wakeman & Henson (2015), where each of the 19 subjects go through 9 runs of consecutive visual tasks. Blood oxygen level readings are recorded across time as 3D images made of (total 135,168) voxels. Here we use the data from a single run and task on subject 1, and aim to estimate dependence patterns of readings across 210 time points and areas of the brain.
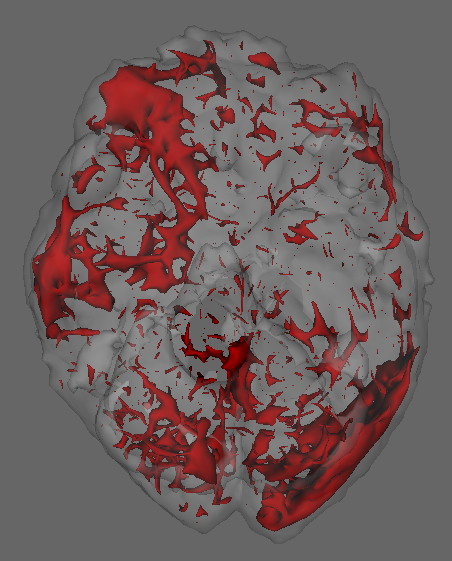
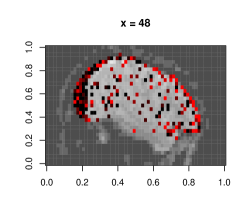
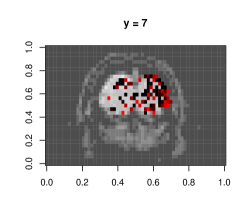
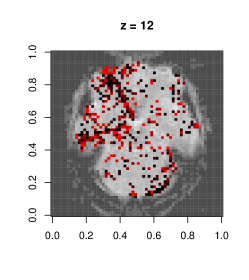
We fit separate regressions at each voxel (Appendix E), with second order autoregressive terms, neighboring voxel readings and one-hot encoded visual task categories in the design matrix. After applying the e-value feature selection, we compute the F-statistic at each voxel using selected coefficients only, and obtain their p-values. Fig. 7.1c highlights voxels with p-values . Left and right visual cortex areas show high spatial dependence, with more dependence on the left side. Signals from the right visual field obtained by both eyes are processed by the left visual cortex. The lop-sided dependence pattern suggests that visual signals from the right side led to a higher degree of processing in our subject’s brain. We also see activity in the cerebellum, the role of which in visual perception is well-known (Calhoun et al., 2010; Kirschen et al., 2010).
8 Conclusion
In this work, we introduced a new paradigm of feature selection through e-values. The e-values can be particularly helpful in situations where model training is costly and potentially distributed across multiple servers (i.e. federated learning), so that a brute force parallelized approach of training and evaluating multiple models is not practical or even possible.
There are three immediate extensions of the framework presented in this paper. Firstly, grouped e-values are of interest to leverage prior structural information on the predictor set. There are no conceptual difficulties in evaluating overlapping and non-overlapping groups of predictors using e-values in place of individual predictors. However technical conditions may be required to ensure a rigorous implementation. Secondly, our current formulation of e-values essentially relies upon the number of samples being more than the effective number of predictors for a unique covariance matrix of the parameter estimate to asymptotically exist. When , using a sure screening method to filter out unnecessary variables works well empirically. However this needs theoretical validation. Thirdly, instead of using mean depth, other functionals of the (empirical) depth distribution—such as quantiles—can be used as e-values. Similar to stability selection (Meinshausen & Buhlmann, 2010), it may be possible to use the intersection of predictor sets obtained by using a number of such functionals in Algorithm 2 as the final selected set of important predictors.
An effective implementation of e-values hinges on the choice of bootstrap method and tuning parameter . To this end, we see opportunity for enriching the research on empirical process methods in complex overparametrized models, such as Deep Neural Nets (DNN), which the e-values framework can build up on. Given the current push for interpretability and trustworthiness of DNN-based decision making systems, there is potential for tools to be developed within the general framework of e-values that provide local and global explanations of large-scale deployed model outputs in an efficient manner.
Acknowledgements
This work is part of the first author (SM)’s PhD thesis (Majumdar, 2017). He acknowledges the support of the University of Minnesota Interdisciplinary Doctoral Fellowship during his PhD. The research of SC is partially supported by the US National Science Foundation grants 1737918, 1939916 and 1939956 and a grant from Cisco Systems.
Reproducibility
Code and data for the experiments in this paper are available at https://github.com/shubhobm/e-values.
References
- Barber & Candes (2015) Barber, R. F. and Candes, E. J. Controlling the false discovery rate via knockoffs. Ann. Statist., 43:2055–2085, 2015.
- Bertsimas et al. (2016) Bertsimas, D., King, A., and Mazumder, R. Best Subset Selection via a Modern Optimization Lens. Ann. Statist., 44(2):813–852, 2016.
- Bickel & Sakov (2008) Bickel, P. and Sakov, A. On the Choice of in the Out of Bootstrap and its Application to Confidence Bounds for Extrema. Stat. Sinica, 18:967–985, 2008.
- Bondell et al. (2010) Bondell, H. D., Krishna, A., and Ghosh, S. K. Joint variable selection for fixed and random effects in linear mixed-effects models. Biometrics, 66(4):1069–1077, 2010.
- Calhoun et al. (2010) Calhoun, V. D., Adali, T., and Mcginty, V. B. fMRI activation in a visual-perception task: network of areas detected using the general linear model and independent components analysis. Neuroimage, 14:1080–1088, 2010.
- Chatterjee (2019) Chatterjee, S. The scale enhanced wild bootstrap method for evaluating climate models using wavelets. Statist. Prob. Lett., 144:69–73, 2019.
- Chatterjee & Bose (2005) Chatterjee, S. and Bose, A. Generalized bootstrap for estimating equations. Ann. Statist., 33(1):414–436, 2005.
- Dietz & Chatterjee (2014) Dietz, L. R. and Chatterjee, S. Logit-normal mixed model for Indian monsoon precipitation. Nonlin. Processes Geophys., 21:939–953, sep 2014.
- Dietz & Chatterjee (2015) Dietz, L. R. and Chatterjee, S. Investigation of Precipitation Thresholds in the Indian Monsoon Using Logit-Normal Mixed Models. In Lakshmanan, V., Gilleland, E., McGovern, A., and Tingley, M. (eds.), Machine Learning and Data Mining Approaches to Climate Science, pp. 239–246. Springer, 2015.
- Dyckerhoff & Mozharovskyi (2016) Dyckerhoff, R. and Mozharovskyi, P. Exact computation of the halfspace depth. Comput. Stat. Data Anal., 98:19–30, 2016.
- Fan & Lv (2008) Fan, J. and Lv, J. Sure Independence Screening for Ultrahigh Dimensional Feature Space. J. R. Statist. Soc. B, 70:849–911, 2008.
- Fan & Li (2012) Fan, Y. and Li, R. Variable selection in linear mixed effects models. Ann. Statist., 40(4):2043–2068, 2012.
- Fang et al. (1990) Fang, K. T., Kotz, S., and Ng, K. W. Symmetric multivariate and related distributions. Monographs on Statistics and Applied Probability, volume 36. Chapman and Hall Ltd., London, 1990.
- Fragoso et al. (2018) Fragoso, T. M., Bertoli, W., and Louzada, F. Bayesian model averaging: A systematic review and conceptual classification. International Statistical Review, 86(1):1–28, 2018.
- Ghosh et al. (2016) Ghosh, S., Vittal, H., Sharma, T., et al. Indian Summer Monsoon Rainfall: Implications of Contrasting Trends in the Spatial Variability of Means and Extremes. PLoS ONE, 11:e0158670, 2016.
- Gosswami (2005) Gosswami, B. N. The Global Monsoon System: Research and Forecast, chapter The Asian Monsoon: Interdecadal Variability. World Scientific, 2005.
- Guyon & Elisseeff (2003) Guyon, I. and Elisseeff, A. An Introduction to Variable and Feature Selection. J. Mach. Learn. Res., 3:1157–1182, 2003.
- Huang et al. (2010) Huang, H.-C., Hsu, N.-J., Theobald, D. M., and Breidt, F. J. Spatial Lasso With Applications to GIS Model Selection. J. Comput. Graph. Stat., 19:963–983, 2010.
- Hui et al. (2017) Hui, F. K. C., Muller, S., and Welsh, A. H. Joint Selection in Mixed Models using Regularized PQL. J. Amer. Statist. Assoc., 112:1323–1333, 2017.
- Jornsten (2004) Jornsten, R. Clustering and classification based on the data depth. J. Mult. Anal., 90:67–89, 2004.
- Kirschen et al. (2010) Kirschen, M. P., Chen, S. H., and Desmond, J. E. Modality specific cerebro-cerebellar activations in verbal working memory: an fMRI study. Behav. Neurol., 23:51–63, 2010.
- Knutti et al. (2010) Knutti, R., Furrer, R., Tebaldi, C., et al. Challenges in Combining Projections from Multiple Climate Models. J. Clim., 23:2739–2758, 2010.
- Koller & Sahami (1996) Koller, D. and Sahami, M. Toward optimal feature selection. In 13th International Conference on Machine Learning, pp. 284–292, 1996.
- Krishnamurthy et al. (2009) Krishnamurthy, C. K. B., Lall, U., and Kwon, H.-H. Changing Frequency and Intensity of Rainfall Extremes over India from 1951 to 2003. J. Clim., 22:4737–4746, 2009.
- Krishnamurthy & Kinter III (2003) Krishnamurthy, V. and Kinter III, J. L. The Indian monsoon and its relation to global climate variability. In Rodo, X. and Comin, F. A. (eds.), Global Climate: Current Research and Uncertainties in the Climate System, pp. 186–236. Springer, 2003.
- Lahiri (1992) Lahiri, S. N. Bootstrapping M-estimators of a multiple linear regression parameter. Ann. Statist., 20(‘):1548–1570, 1992.
- Lai et al. (2015) Lai, R. C. S., Hannig, J., and Lee, T. C. M. Generalized Fiducial Inference for Ultrahigh-Dimensional Regression. J. Amer. Statist. Assoc., 110(510):760–772, 2015.
- Lee & Ghosh (2009) Lee, H. and Ghosh, S. Performance of Information Criteria for Spatial Models. J. Stat. Comput. Simul., 79:93–106, 2009.
- Lei et al. (2018) Lei, J. et al. Distribution-Free Predictive Inference for Regression. J. Amer. Statist. Assoc., 113:1094–1111, 2018.
- Li et al. (2017) Li, X., Wang, L., Guo, X., and Chen, D. Does summer precipitation trend over and around the Tibetan Plateau depend on elevation? Int. J. Climatol., 37:1278–1284, 2017.
- Liu & Zuo (2014) Liu, X. and Zuo, Y. Computing halfspace depth and regression depth. Commun. Stat. Simul. Comput., 43(5):969–985, 2014.
- Ma & Zhu (2013) Ma, Y. and Zhu, L. A review on dimension reduction. International Statistical Review, 81(1):134–150, 2013.
- Majumdar (2017) Majumdar, S. An Inferential Perspective on Data Depth. PhD thesis, University of Minnesota, 2017.
- Meinshausen & Buhlmann (2010) Meinshausen, N. and Buhlmann, P. Stability selection. J. R. Stat. Soc. B, 72:417–473, 2010.
- Meza & Lahiri (2005) Meza, J. and Lahiri, P. A note on the statistic under the nested error regression model. Surv. Methodol., 31:105–109, 2005.
- Moon et al. (2013) Moon, J.-Y., Wang, B., Ha, K.-J., and Lee, J.-Y. Teleconnections associated with Northern Hemisphere summer monsoon intraseasonal oscillation. Clim. Dyn., 40(11-12):2761–2774, 2013.
- Mosler (2013) Mosler, K. Depth statistics. In Becker, C., Fried, R., and Kuhnt, S. (eds.), Robustness and Complex Data Structures, pp. 17–34. Springer Berlin Heidelberg, 2013. ISBN 978-3-642-35493-9.
- Narisetty & Nair (2016) Narisetty, N. N. and Nair, V. N. Extremal Depth for Functional Data and Applications. J. Amer. Statist. Assoc., 111:1705–1714, 2016.
- Natarajan (1995) Natarajan, B. K. Sparse Approximate Solutions to Linear Systems. Siam. J. Comput., 24:227–234, 1995.
- Nguyen & Jiang (2014) Nguyen, T. and Jiang, J. Restricted fence method for covariate selection in longitudinal data analysis. Biostatistics, 13(2):303–314, 2014.
- Peng & Lu (2012) Peng, H. and Lu, Y. Model selection in linear mixed effect models. J. Multivar. Anal., 109:109–129, 2012.
- Rousseeuw & Hubert (1998) Rousseeuw, P. J. and Hubert, M. Regression Depth. J. Amer. Statist. Assoc., 94:388–402, 1998.
- Schwarz (1978) Schwarz, G. Estimating the dimension of a model. Ann. Statist., 6(2):461–464, 1978.
- Shao (1996) Shao, J. Bootstrap model selection. J. Amer. Statist. Assoc., 91(434):655–665, 1996.
- Singh et al. (2007) Singh, K., Xie, M., and Strawderman, W. E. Confidence distribution (CD) – distribution estimator of a parameter. In Complex Datasets and Inverse Problems: Tomography, Networks and Beyond, volume 54 of Lecture Notes-Monograph Series, pp. 132–150. IMS, 2007.
- Singleton & Toumi (2012) Singleton, A. and Toumi, R. Super-Clausius-Clapeyron scaling of rainfall in a model squall line. Quat. J. R. Met. Soc., 139(671):334–339, 2012.
- Song et al. (2012) Song, L., Smola, A., Gretton, A., Bedo, J., and Borgwardt, K. Feature selection via dependence maximization. Journal of Machine Learning Research, 13(47):1393–1434, 2012.
- Tibshirani (1996) Tibshirani, R. Regression shrinkage and selection via the lasso. J. R. Statist. Soc. B, 58(267–288), 1996.
- Trenberth (2011) Trenberth, K. E. Changes in precipitation with climate change. Clim. Res., 47:123–138, 2011.
- Trenberth et al. (2003) Trenberth, K. E., Dai, A., Rasmussen, R. M., and Parsons, D. B. The changing character of precipitation. Bull. Am. Meteorol. Soc.,, 84:1205–1217, 2003.
- Tukey (1975) Tukey, J. W. Mathematics and picturing data. In James, R. (ed.), Proceedings of the International Congress on Mathematics, volume 2, pp. 523–531, 1975.
- VanderWeele & Ding (2017) VanderWeele, T. and Ding, P. Sensitivity Analysis in Observational Research: Introducing the E-Value. Ann Intern Med., 167(4):268–274, 2017.
- Wakeman & Henson (2015) Wakeman, D. G. and Henson, R. N. A multi-subject, multi-modal human neuroimaging dataset. Scientif. Data, 2:article 15001, 2015.
- Wang et al. (2005) Wang, B., Ding, Q., Fu, X., et al. Fundamental challenge in simulation and prediction of summermonsoon rainfall. Geophys. Res. Lett., 32:L15711, 2005.
- Wang et al. (2013) Wang, L., Kim, Y., and Li, R. Calibrating Nonconvex Penalized Regression in Ultra-high Dimension. Ann. Statist., 41:2505–2536, 2013.
- Zhang & Zhang (2014) Zhang, C.-H. and Zhang, S. S. Confidence intervals for low dimensional parameters in high dimensional linear models. J. R. Statist. Soc. B, 76(1):217–242, 2014.
- Zhu et al. (2011) Zhu, L.-P., Li, L., Li, R., and Zhu, L.-X. Model-Free Feature Screening for Ultrahigh-Dimensional Data. J. Amer. Statist. Assoc., 106(496):1464–1475, 2011.
- Zou (2006) Zou, H. The Adaptive Lasso and Its Oracle Properties. J. Amer. Statist. Assoc., 101:1418–1429, 2006.
- Zou & Hastie (2005) Zou, H. and Hastie, T. Regularization and variable selection via the elastic net. Journal of the Royal Statistical Society: Series B (Statistical Methodology), 67(2):301–320, 2005.
- Zou & Li (2008) Zou, H. and Li, R. One-step sparse estimates in nonconcave penalized likelihood models. Ann. Statist., 36:1509–1533, 2008.
- Zuo (2003) Zuo, Y. Projection-based depth functions and associated medians. Ann. Statist., 31:1460–1490, 2003.
- Zuo & Serfling (2000) Zuo, Y. and Serfling, R. General notions of statistical depth function. Ann. Statist., 28(2):461–482, 2000.
Appendix
Appendix A Consistency of Generalized Bootstrap
We first state a number of conditions on the energy functions , under which we state and prove two results to ensure consistency of the estimation and bootstrap approximation procedures. In the context of the main paper, the conditions and results here ensure that the full model parameter estimate follows a Gaussian sampling distribution, and Generalized Bootstrap (GBS) can be used to approximate this sampling distribution.
A.1 Technical conditions
Note that several sets of alternative conditions can be developed (Chatterjee & Bose, 2005; Lahiri, 1992), many of which are amenable to our results. However, for the sake of brevity and clarity, we only address the case where the energy function is smooth in the first argument. This case covers a vast number of models routinely considered in statistics and machine learning.
We often drop the second argument from energy function, thus for example , and use the notation for , for . Also, for any function evaluated at the true parameter value , we use the notation . When and are square matrices of identical dimensions, the notation implies that the matrix is positive definite.
In a neighborhood of , we assume the functions are thrice continuously differentiable in the first argument, with the successive derivatives denoted by , . That is, there exists a such that for any satisfying we have
and for the -th element of , denoted by , we have
for , and some possibly depending on . We assume that for each , there is a sequence of -fields such that is a martingale.
The spectral decomposition of is given by , where is an orthogonal matrix whose columns contain the eigenvectors, and is a diagonal matrix containing the eigenvalues of . We assume that is positive definite, that is, all the diagonal entries of are positive numbers. We assume that there is a constant such that for sufficiently large .
Let be the matrix whose -th row is ; we assume this expectation exists. Define . We assume that is nonsingular for each . The singular value decomposition of is given by , where are orthogonal matrices, and is a diagonal matrix. We assume that the diagonal entries of are all positive, which implies that in the population, at the true value of the parameter the energy functional actually achieves a minimal value. We define for various real numbers as diagonal matrices where the -th diagonal entry of is raised to the power , for . Correspondingly, we define . We assume that there is a constant such that for all sufficiently large . Define the matrix . We assume the following conditions:
-
(C1)
The minimum eigenvalue of tends to infinity. That is, there is a sequence as such that
(C.1) -
(C2)
There exists a sequence of positive reals that is bounded away from zero, such that
(C.2) -
(C3)
(C.3) where denotes the Frobenius norm of matrix .
-
(C4)
For the symmetric matrix and for some , there exists a symmetric matrix such that
satisfying
(C.4) -
(C5)
For any vector with , we define the random variable for . We assume that
(C.5) -
(C6)
Assume that
(C.6)
The technical conditions (C1)-(C5) are extremely broad, and allow for different rates of convergence of different parameter estimators. The additional condition (C6) is a natural condition that, coupled with (C1), ensures identical rate of convergence for all the parameter estimators in a model.
Standard regularity conditions on likelihood and estimating functions that have been routinely assumed in the literature are special cases of the framework above. In such cases, (C1)-(C6) hold with , resulting in the standard “root-” asymptotics.
A.2 Results
We first present the consistency and asymptotic normality of the estimation process in Theorem A.1 below.
Theorem A.1.
Assume conditions (C1)-(C5). Then is a consistent estimator of , and converges weakly to the -dimensional standard Gaussian distribution. Under the additional condition (C6), we have that converges weakly to a Gaussian distribution in -dimension.
Proof of Theorem A.1.
We consider a generic point . From the Taylor series expansion, we have
for , and for some .
Recall our convention that for any function evaluated at the true parameter value , we use the notation . Also define the -dimensional vector whose -th element is given by
Thus we have
Define
We next show that for any , for all sufficiently large , we have
| (A.8) |
This follows from (C.3) and (C.4). Note that
Thus,
We consider each of these terms separately.
For any matrix , we have
Using and (C.3), we get one part of the result.
For the other term, we similarly have
Note that
Now
Based on this, we have
Since we have defined
we have
Hence
The last step above utilizes facts like . Consequently, defining , we have
for all sufficiently large , using (A.7) and (A.8). This implies that with a probability greater than there is a root of the equations in the ball , for some and all sufficiently large . Defining , we obtain the desired result. Issues like dependence on and other technical details are handled using standard arguments, see Chatterjee & Bose (2005) for related arguments.
Since we have , and lies in the set , define . Consequently
Thus,
We now have a parallel result on consistency of the GBS resampling scheme. The essence of this theorem is that under the same set of conditions, several resampling schemes are consistent resampling procedures to implement the e-values framework.
Theorem A.2.
Assume conditions (C1)-(C5). Additionally, assume that the resampling weights are exchangeable random variables satisfying the conditions (4.2). Define , where and are sample equivalents of and , respectively. Conditional on the data, converges weakly to the -dimensional standard Gaussian distribution in probability.
Under the additional condition (C6), defining , the distributions of and converge to the same weak limit in probability.
Appendix B Theoretical proofs
The results in Section 5 hold under more general conditions than in the main paper–specifically, when the asymptotic distribution of comes from a general class of elliptic distributions, rather than simply being multivariate Gaussian.
Following Fang et al. (1990), the density function of an elliptically distributed random variable takes the form: where , is positive semi-definite, and is a density function that is non-negative, scalar-valued, continuous and strictly increasing. For the asymptotic distribution of , we assume the following conditions:
-
(A1)
There exist a sequence of positive reals , positive-definite (PD) matrix and density such that converges to in distribution, denoted by ;
-
(A2)
For almost every dataset , There exist PD matrices such that .
These conditions are naturally satisfied for a Gaussian limiting distribution.
B.1 Proofs of main results
Proof of Theorem 5.1.
We divide the proof into four parts:
-
1.
ordering of adequate model e-values,
-
2.
convergence of all adequate model e-values to a common limit,
-
3.
convergence of inadequate model e-values to 0,
-
4.
comparison of adequate and inadequate model e-values,
Proof of part 1.
Since we are dealing with a finite sequence of nested models, it is enough to prove that for large enough , when both and are adequate models and .
Suppose . Affine invariance implies invariant to rotational transformations, and since the evaluation functions we consider decrease along any ray from the origin because of (B5), is a monotonocally decreasing function of for any . Now consider the models that have 0 in all indices outside and , respectively. Take some , which is the parameter space corresponding to , and replace its (zero) entries at indices by some non-zero . Denote it by . Then we shall have
where denotes the expectation taken over the marginal of the distributional argument at indices . Notice now that by construction , the parameter space corresponding to , and since the above holds for all possible , we can take expectation over indices in both sides to obtain , with denoting a general element in .
Combining (A1) and (A2) we get . Denote , and choose a positive . Then, for large enough we shall have
following condition (B4). Similarly we have for the same for which the above holds. This implies .
Now apply the affine transformation to both arguments of the depth function above. This will keep the depths constant following affine invariance, i.e. and . Since this transformation maps to , the parameter space corresonding to , we get , i.e. .
Proof of part 2.
For the full model , by (A1). It follows now from a direct application of condition (B3) that where .
For any other adequate model , we use (B1) property of :
| (B.1) |
and decompose the first argument
| (B.2) |
We now have
where is non-degenerate at the indices , and . For the first summand of the right-hand side in (B.2) we then have
| (B.3) |
where , and equals in indices and elsewhere. Since is adequate, . Thus, substituting the right-hand side in (B.2) we get
| (B.4) |
from Lipschitz continuity of given in (B2). Part 2 now follows.
Proof of Part 3.
Since the depth function is invariant under location and scale transformations, we have
| (B.5) |
Decomposing the first argument,
| (B.6) |
Since is inadequate, , i.e. and are not equal in at least one (fixed) index. Consequently as , , thus by condition (B4).
Proof of part 4.
For any inadequate model , suppose is the integer such that for all . Part 3 above ensures that such an integer exists for every inadequate model. Now define . Thus is larger than e-values of all inadequate models for . ∎
Proof of Corollary 5.2.
By construction, is nested in all other adequate models in . Hence Theorem 4.1 implies for any adequate model and inadequate model in and large enough . ∎
Proof of Corollary 5.3.
Consider . Then , hence is inadequate. By choice of from Corollary 4.1, -values of all inadequate models are less than that of , hence .
On the other hand, suppose there exists a such that but . Now means that is an adequate model. Since is nested within for any , and the full model is always adequate, we have by Theorem 4.1: leading to a contradiction and thus completing the proof. ∎
Proof of Theorem 5.4.
Corollary 4.2 implies that
Now define . We also use an approximation result.
Lemma B.1.
For any adequate model , the following holds for fixed and an exchangeable array of GB resamples as in the main paper:
| (B.7) |
Using Lemma B.1 for and we now have
such that and for all . Hence as , being probability conditional on the data. Similarly one can prove that the probability conditional on the bootstrap samples that holds goes to 1 as , completing the proof. ∎
B.2 Proofs of auxiliary results
Appendix C Details of experiments
Among the competing methods, for stepwise regression there is no tuning. MIO requires specification of a range of desired sparsity levels and a time limit for the MIO solver to run for each sparsity level in the beginning. We specify the sparsity range to be in all settings to cover the sparsity levels across different simulation settings, and the time limit to be 10 seconds. We select the optimal MIO sparsity level as the one for which the resulting estimate gives the lowest BIC. We use BIC to select the optimal regularization parameter for Lasso and SCAD as well. The Knockoff filters come in two flavors: Knockoff and Knockoff+. We found that Knockoff+ hardly selects any features in our settings, so use the Knockoffs for evaluation, setting its false discovery rate threshold at the default value of 0.1. We shall include these details in the appendix.
Appendix D Details of Indian Monsoon data
Various studies indicate that our knowledge about the physical drivers of precipitation in India is incomplete; this is in addition to the known difficulties in modeling precipitation itself (Knutti et al., 2010; Trenberth et al., 2003; Trenberth, 2011; Wang et al., 2005). For example, (Gosswami, 2005) discovered an upward trend in frequency and magnitude of extreme rain events, using daily central Indian rainfall data on a grid, but a similar study on a gridded data by (Ghosh et al., 2016) suggested that there are both increasing and decreasing trends of extreme rainfall events, depending on the location. Additionally, (Krishnamurthy et al., 2009) reported increasing trends in exceedances of the 99th percentile of daily rainfall; however, there is also a decreasing trend for exceedances of the 90th percentile data in many parts of India. Significant spatial and temporal variabilities at various scales have also been discovered for Indian Monsoon (Dietz & Chatterjee, 2014, 2015).
We attempt to identify the driving factors behind precipitation during the Indian monsoon season using our e-value based feature selection technique. Data is obtained from the repositories of the National Climatic Data Center (NCDC) and National Oceanic and Atmospheric Administration (NOAA), for the years 1978-2012. We obtained data 35 potential predictors of the Indian summer precipitation:
(A) Station-specific: (from 36 weather stations across India) Latitude, longitude, elevation, maximum and minimum temperature, tropospheric temperature difference (), Indian Dipole Mode Index (DMI), Niño 3.4 anomaly;
(B) Global:
-
•
-wind and -wind at 200, 600 and 850 mb;
-
•
Ten indices of Madden-Julian Oscillations: 20E, 70E, 80E, 100E, 120E, 140E, 160E, 120W, 40W, 10W;
-
•
Teleconnections: North Atlantic Oscillation (NAO), East Atlantic (EA), West Pacific (WP), East Pacific/North Pacific (EPNP), Pacific/North American (PNA), East Atlantic/Western Russia (EAWR), Scandinavia (SCA), Tropical/Northern Hemisphere (TNH), Polar/Eurasia (POL);
-
•
Solar Flux;
-
•
Land-Ocean Temperature Anomaly (TA).
These covariates are all based on existing knowledge and conjectures from the actual Physics driving Indian summer precipitations. The references provided earlier in this section, and multiple references contained therein may be used for background knowledge on the physical processes related to Indian monsoon rainfall, which after decades of study remains one of the most challenging problems in climate science.
Appendix E Details of fMRI data implementation
Typically, the brain is divided by a grid into three-dimensional array elements called voxels, and activity is measured at each voxel. More specifically, a series of three-dimensional images are obtained by measuring Blood Oxygen Level Dependent (BOLD) signals for a time interval as the subject performs several tasks at specific time points. A single fMRI image typically consists of voxels in the order of , which makes even fitting the simplest of statistical models computationally intensive when it is repeated for all voxels to generate inference, e.g. investigating the differential activation of brain region in response to a task.
The dataset we work with comes from a recent study involving 19 test subjects and two types of visual tasks (Wakeman & Henson, 2015). Each subject went through 9 runs, in which they were showed faces or scrambled faces at specific time points. In each run 210 images were recorded in 2 second intervals, and each 3D image was of the dimension of , which means there were 135,168 voxels. Here we use the data from a single run on subject 1, and perform a voxelwise analysis to find out the effect of time lags and BOLD responses at neighboring voxels on the BOLD response at a voxel. Formally we consider separate models at voxel , with observations across time points .
Clubbing together the stimuli, drift, neighbor and autoregressive terms into a combined design matrix and coefficient vector , we can write . We estimate the set of non-zero coefficients in using the e-value method. Suppose this set is , and its subsets containing coefficient corresponding to neighbor and non-neighbor (i.e. stimuli and drift) terms are and , respectively. To quantify the effect of neighbors we now calculate the corresponding -statistic:
and obtain its -value, i.e. .
Figure E.1 shows plots of the voxels with a significant -value from the above -test, with a darker color associated with lower p-value, as opposed to the smoothed surface in the main paper. Most of the significant terms were due to the coefficients corresponding to neighboring terms. A very small proportion of voxels had any autoregressive effects selected (less than 1%), and most of them were in regions of the image that were outside the brain, indicating noise.
In future work, we aim to expand on the encouraging findings and repeat the procedure on other individuals in the study. An interesting direction here is to include subject-specific random effects and correlate their clinical outcomes (if any) to observed spatial dependency patterns in their brain.