Fermi and Swift observations of the bright short GRB 090510
Abstract
The bright short-hard GRB 090510 was observed by both Swift and Fermi telescopes. The study of the prompt emission by Fermi revealed an additional high-energy spectral component, the largest lower limit ever on the bulk Lorentz factor in a short GRB jet, and brought the most stringent constraint ever on linear Lorentz invariance violation models. The fast repoint and follow-up by both telescopes allowed the first multiwavelength study of a GRB afterglow from optical range to several GeV. This long-lived emission has been studied in the framework of the internal shock and external shock models.
I OBSERVATIONS
On May 10th, 2009 at 00:23:00.48 UT, the Burst Alert Telescope (BAT) onboard the Swift observatory detected a bright Gamma-Ray Burst (GRB) GCN9331 , and autonomously repointed towards it within 100 s, allowing for over 2 days of follow-up observation by the Ultra-Violet and Optical Telescope (UVOT) and the X-Ray Telescope (XRT). An afterglow was detected in ultra-violet and X-ray, which analysis provided a location RA = 333.55227, Dec = -26.5827, with an error of 1.4 arcsec (90% statistical) GCN9339 . VLT afterglow observations provided a spectroscopic redshift z = 0.903 0.003 GCN9353 .
On the same day at 00:22:59.97 UT, the Gamma-ray Burst Monitor (GBM) onboard Fermi detected a bright GRB GCN9336 . A small and short spike at trigger time was followed 0.5 s later by 0.5 s-long emission made of 7 pulses. This GRB also triggered the Fermi Large Area Telescope (LAT) onboard algorithm GCN9334 which located it at RA = 333.4∘, Dec = -26.767∘, with an error of 7 arcmin (statistical), consistent with the GBM and Swift detection. The spacecraft autonomously repointed towards the source for 5 hours of follow-up observation. The prompt emission was coincident with the GBM main emission. More than 150 photons above 100 MeV were observed, and more than 20 events above 1 GeV in the first minute after trigger (see fig. 1) GCN9350 . The follow-up observation allowed the detection of a significant GeV emission up to 200 s after trigger.
Also AGILE GCN9343 , Integral-SPI and Suzaku-WAM GCN9355 detected GRB 090510 prompt emission. According to all observations GRB 090510 was a very bright short GRB (table 1).
In the following we focus on the prompt emission seen by Fermi (section II) and the multiwavelength afterglow study based on Swift and Fermi data (section III). Convention : spectral and temporal indices are defined according to to the fluence evolution description :
| Instrument | ||
|---|---|---|
| GBM/NaI 3,6,7 | 2.1 | 0.2 |
| Swift/BAT | 4.0 | 0.7 |
| Integral-SPI | 2.5 | 0.1 |
| Suzaku-WAM | 5.8 | 0.5 |
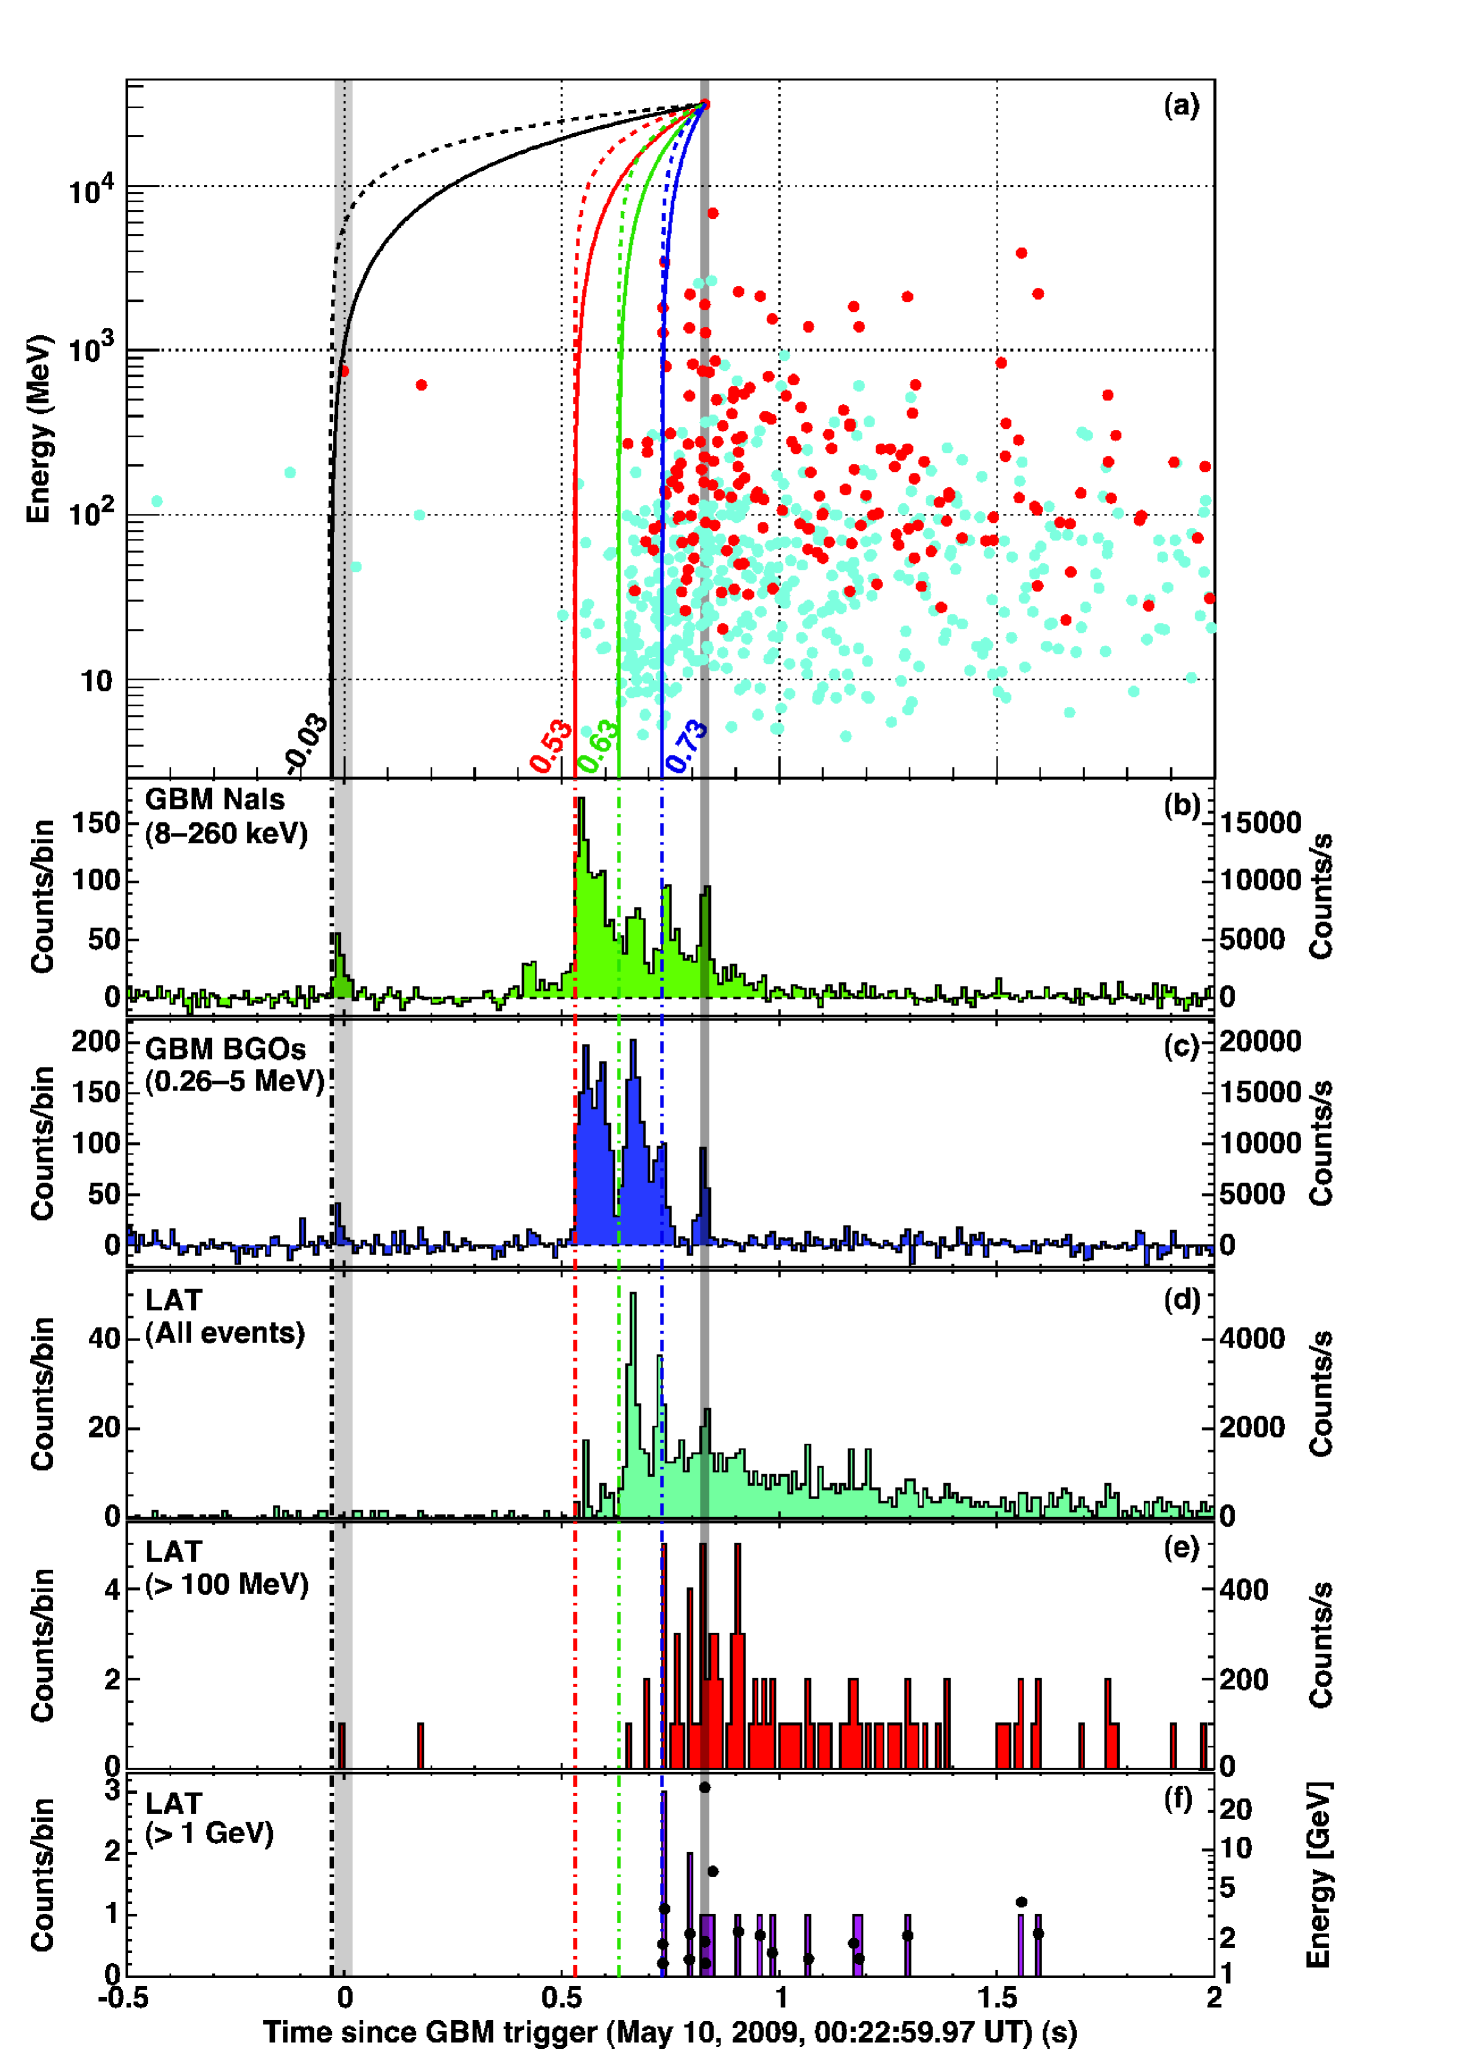
Panel (a) : LAT events passing the onboard (blue) or on-ground (red) photon selections. The lines show the arrival time dependence on photon energy for the events associated to the 31 GeV photon, according to linear (solid lines) or quadratic (dashed lines) energy dependence in the LIV model (see section II.4). Different parts of the lower-energy emission are considered : full GBM emission (black), bulk GBM emission (red), bulk LAT emission (green), coicident GBM peak (blue).
Panels (b – f) : multi-instrument lightcurve. Curves (b – d) are background-subtracted. Curve (d) shows all LAT events passing the onboard photon selection. Curves (e – f) show on-ground selected photons inside the region of interest, used for the spectral analysis. Panel (f) also shows event energies.
II THE -RAY PROMPT EMISSION
II.1 Spectroscopy
The spectral analysis of the prompt emission was performed with RMfit, combining GBM and LAT data (fig. 2).
The time-integrated spectrum shows a significant additional high-energy power-law component (, ), which carries 37% of the total -ray fluence.
The time-resolved spectroscopy shows the late arrival of the LAT emission and of the additional component. In bin ’a’ (0.5s – 0.6s after Fermi trigger), a Band function with steep 4 is fitted. In bin ’b’ (0.6s – 0.8s), a significant additional power-law component is found (). In bin ’c’ (0.8s – 0.9s) this high-energy component can be fitted but not significantly. In bin ’d’ (0.9s – 1.0s) the LAT data only are fitted by a power-law ().
II.2 Limits on the jet’s initial bulk Lorentz factor
The observation of high-energy events allows to constrain the jet’s initial bulk Lorentz factor . Low- and high-energy photons emitted in the same physical region of the jet can interact to produce pairs. The opacity to pair-production is strongly reduced if the emission region moves towards the observer with a high bulk Lorentz factor. The optical depth to -pair production at a given photon energy depends on the -ray emission spectral shape and variability time scale , the GRB redshift and the jet’s bulk Lorentz factor. The condition , where is the maximal observed photon energy, yields a lower limit on .
For different epochs of the LAT emission, estimates of and spectral models lead to several possible lower limits, all of order (see table 2). This is the highest lower limit ever set on a GRB, and the most rapid ejection ever observed from a short GRB.
| Time bin | Spectral model | (ms) | (GeV) | |
|---|---|---|---|---|
| b | Band + PL | 14 2 | 3.43 | 951 38 |
| d | Band | 12 2 | 30.5 | 1324 50 |
| d | Band + PL | 12 2 | 30.5 | 1218 61 |
II.3 Interpretation of the high-energy spectrum
The physical interpretation of the high-energy prompt spectrum of GRB 090510 is described in detail in ApJ090510 . The lower-energy part of the prompt emission spectrum ( 10 MeV) can be explained by non-thermal synchrotron processes, as well as photospheric thermal emission.
In a non-thermal leptonic model framework, Synchrotron Self-Compton (SSC) emission is expected at GeV-TeV energies and can result in the observed additional power-law component. Detailed simulations of SSC emission have been performed, using the observed Band component as the seed population, taking into account internal opacity, self-absorption, radiative escapes, and considering either Thomson or Klein-Nishina scattering regimes. A low magnetic field () favors Compton scattering and can explain the observed bright and hard high-energy component. It would also slow down the cascade formation which could explain the late onset of the high-energy emission. The interpretation of the high-energy emission as forward shock emission from an early afterglow was also considered to explain the delayed onset of the high-energy emission. However, this scenario assumes a very rapid ejection ( 2000 – 4000), and implies a high-energy component spectral index of . This spectrum is consistent with the long-lived spectrum, but not with the additional component found in bin ’b’ (). In both cases, the hard spectral index of the soft photons () is not explained by the standard synchrotron mechanism.
In hadronic models, secondary pairs come from the decay of pions formed through photohadronic processes and by the attenuation of synchrotron photons radiated by protons and ions. Synchrotron radiation or inverse Compton scattering from these pairs can produce the observed high-energy -ray emission. In the case of photohadronic models, a stronger magnetic field makes secondary pion production more efficient through more rapid hadronic acceleration, but results in a high-energy component spectral index , significantly softer than observed. On the other hand, inverse Compton scattering of secondary pairs can produce a high-energy component as hard as the one observed, but this scenario requires a very high isotropic-equivalent power . Proton synchrotron models also require a high isotropic equivalent energy, and a high magnetic field. However, the apparent problem can be solved if the jet is strongly collimated or if the true Lorentz factor is a factor 2 less than the minimum values estimated through the opacity constraint. If , then a proton synchrotron model is strongly disfavored, though note that GRBs with a very high isotropic energy have been observed.
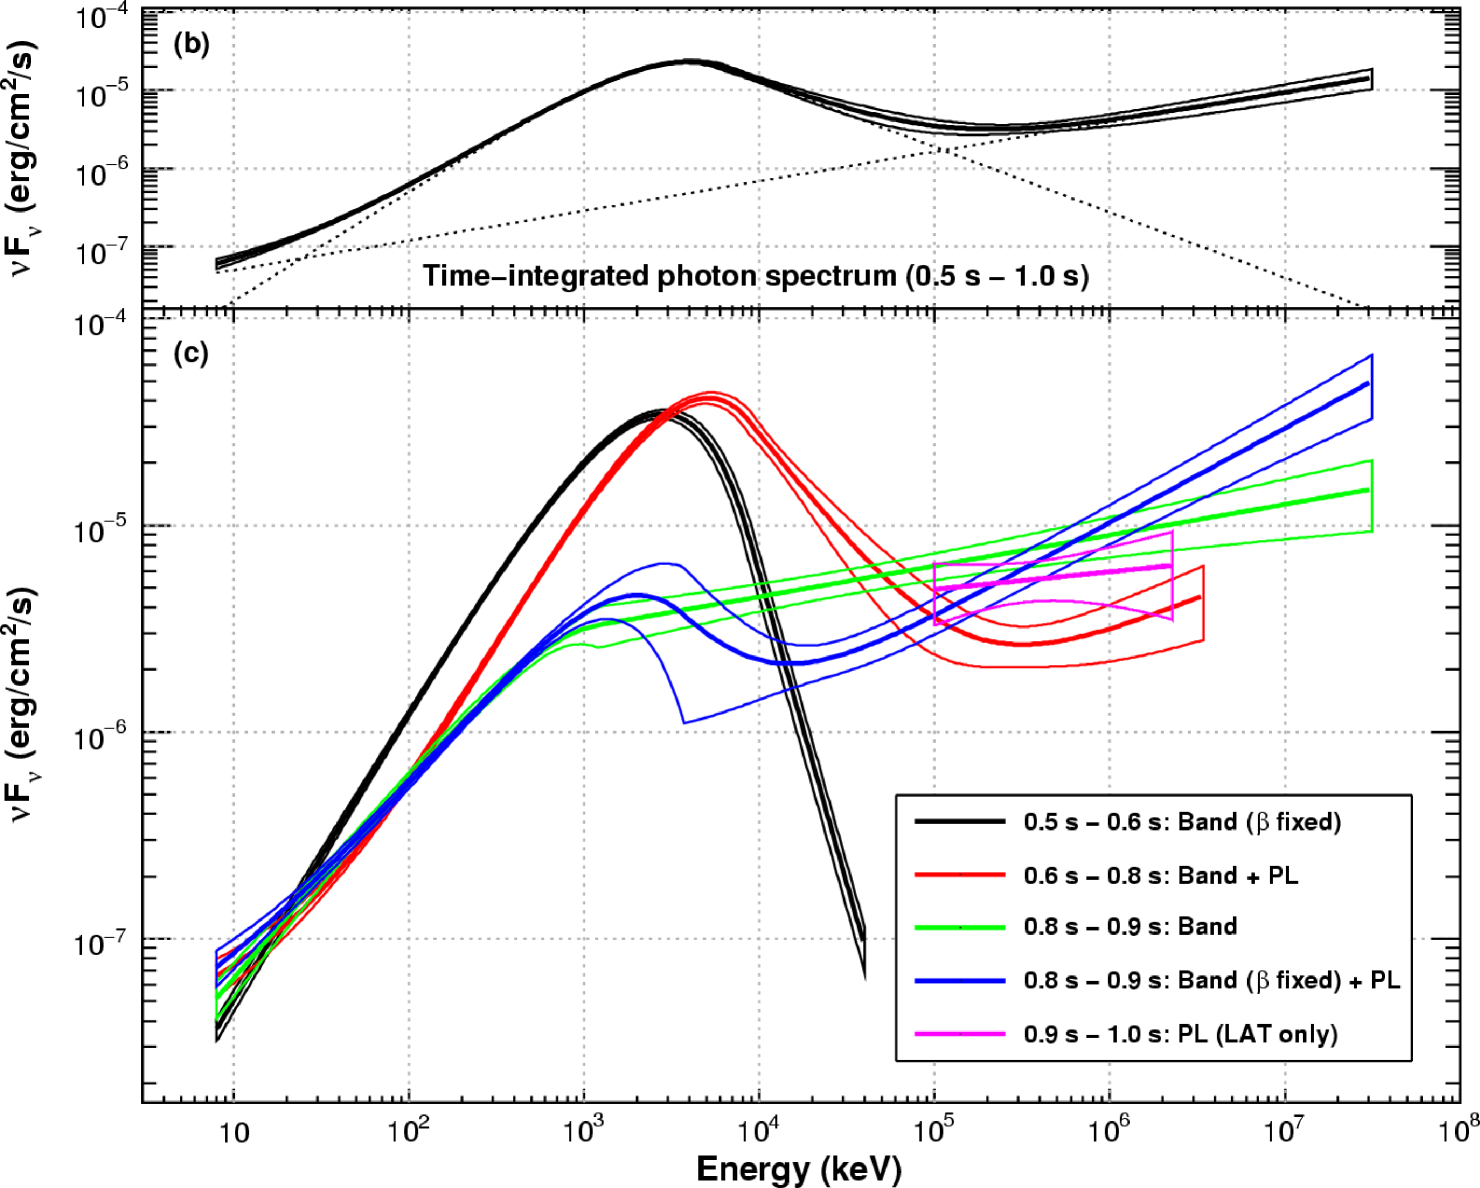
Panel (b) : time-integrated Spectral Energy Distribution (SED). The Band function and power-law components are shown. Their sum is drawn in thick line with 68% confidence level contours. Panel (c) : time-resolved SED with 68% confidence level contours. In bin ’a’ no signal is detected in the LAT. Bins ’b’ and ’c’ show an additional power-law component. No signal is detected in the GBM after 0.9 s (bin ’d’).
II.4 Limits on Lorentz Invariance Violation (LIV)
Some quantum gravity models allow for a dependence of the photons speed on their energy, i.e. their arrival time can be written as a development in their energy. In this framework, a low-energy () and a high-energy () photons emitted together would arrive at different times, with the dominant LIV delay term :
where is the GRB redshift, and n = 1 or 2. A standard cosmology has been assumed for the computations. The difference in arrival times can be of any sign , depending on the models. The observation of high-energy photons from distant sources allows to put constraints on the energy scales that appear in the development.
GRB 090510 has a redshift of , and its emission in the LAT energy range includes a photon of energy GeV detected 0.829 s after the GBM trigger. This event’s topology makes it a very good photon candidate. The expected background rate and this event’s direction proximity to GRB 090510 location allowed us to associate this event to the burst with high confidence (4.4 to 5.6 depending on the selections used).
The observed lightcurve allows different measurements of the temporal delay for this event, depending on which part of the lower energy emission it is associated to. As described in detail in Nat090510 , several lower limits on the linear term’s energy scale could be derived (see table 3). All require , which is a strong constraint on linear LIV models.
Lower limits on were also derived, but they are much less constraining. For more details on LIV limits derivation, see Vlasios .
| or | Method | ||
|---|---|---|---|
| 30 ms/GeV | 1.22 | 1 | LAT lag analysis |
| 859 ms | 1.19 | 1 | not emitted |
| before GBM onset | |||
| 10 ms | 102 | 1 | GBM pulse width |
III AFTERGLOW MULTI-WAVELENGTH STUDY
III.1 eV to GeV observations
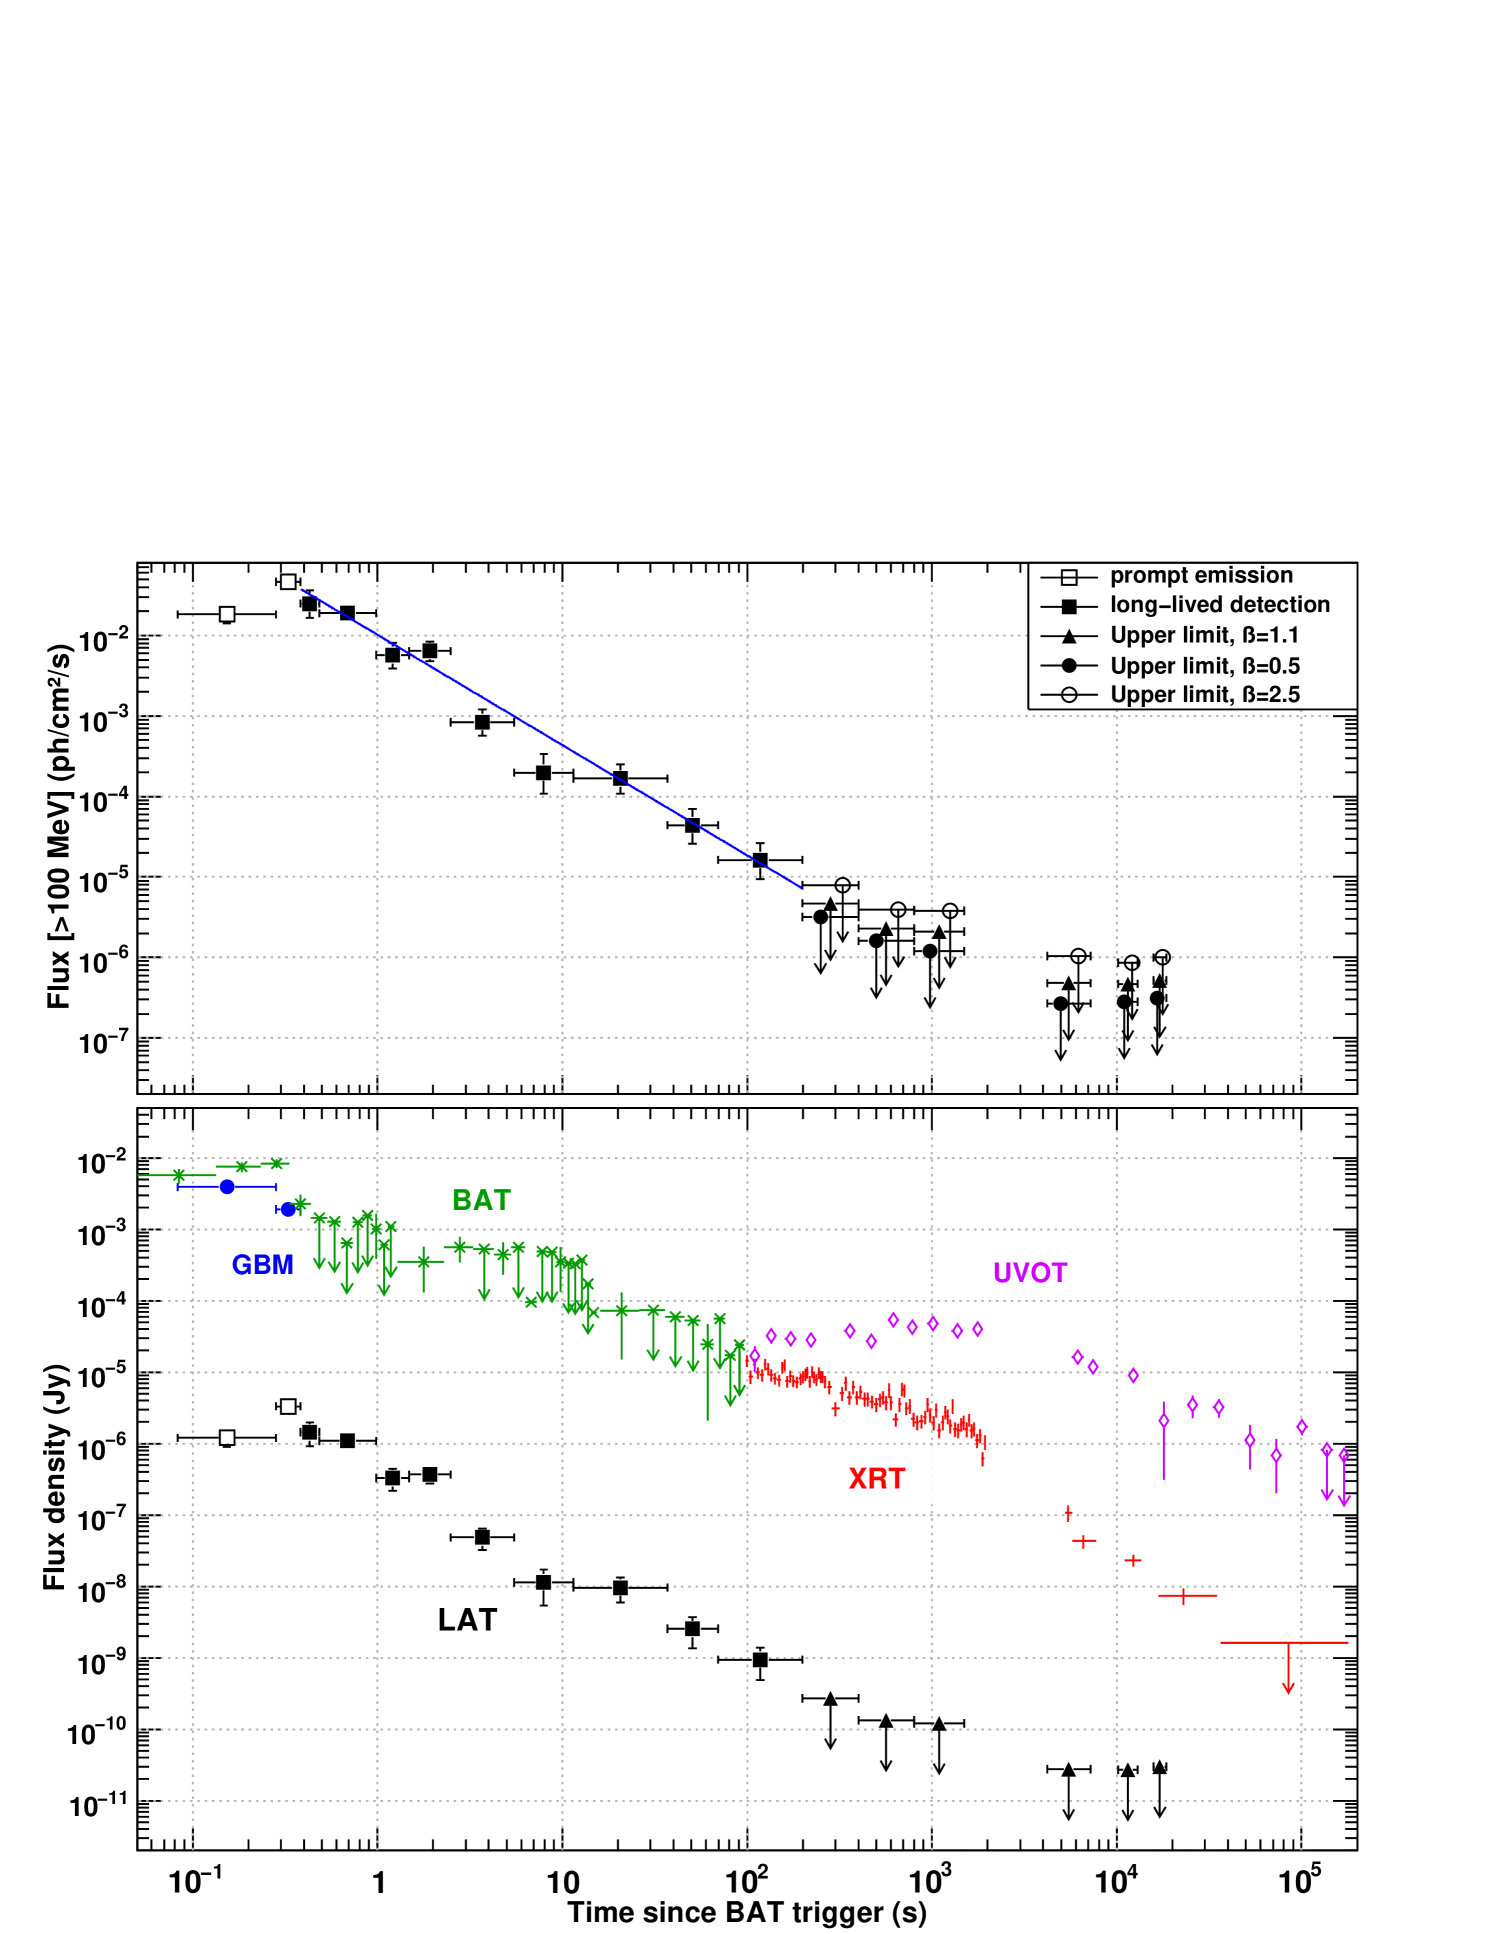
Top panel : LAT flux above 100 MeV and best fit to the flux decay (line). Bottom panel : energy flux densities averaged in the observed energy bands: BAT (15 keV - 350 keV, stars); XRT (0.2 keV - 10 keV, crosses); UVOT renormalised to white (diamonds); LAT (100 MeV - 4 GeV, filled squares; the average spectral index was used to convert from photon to energy flux) with upper limits for = 1.1 (triangles). The prompt emission is shown for comparison: GBM (8 keV - 1 MeV, circles), LAT (100 MeV 4 GeV, empty squares). XRT lightcurve is obtained as in Evans07 ; Evans09 . All other data are shown with 68% error bars or 95% confidence level upper limits.
The fast repoint by Swift and the ARR performed by Fermi provided a long-lasting observation of GRB 090510 afterglow, from the optical range to several GeV, interrupted by Earth occultation of the GRB to both observatories. The fluxes observed by all instruments are reported in fig. 3.
UVOT and XRT observations of the afterglow started 100 s after the prompt emission trigger, and lasted over 2 days. The optical and UV lightcurve is best fit by a smoothly broken power-law with an initial rise : . The smooth break at ks is followed by a shallow decay . The X-ray lightcurve is best fit by a broken power-law, with an initial shallow decay , a break at ks and a steep late decay .
The beginning of the temporally-extended emission in the LAT has been chosen as the end of the prompt emission seen by the GBM (0.9 s after GBM trigger, i.e. 0.38 s after BAT trigger). A significant emission was detected up to 200s after trigger and up to 4 GeV. This observation was divided in time bins, in all of them an unbinned likelihood spectral analysis was performed using diffuse class events ApJ080825C . The flux decay is best fit by a simple power-law of index , with no significant feature or break. The power-law spectrum shows no significant evolution over time and has an average index .
III.2 Discussion on the afterglow origin
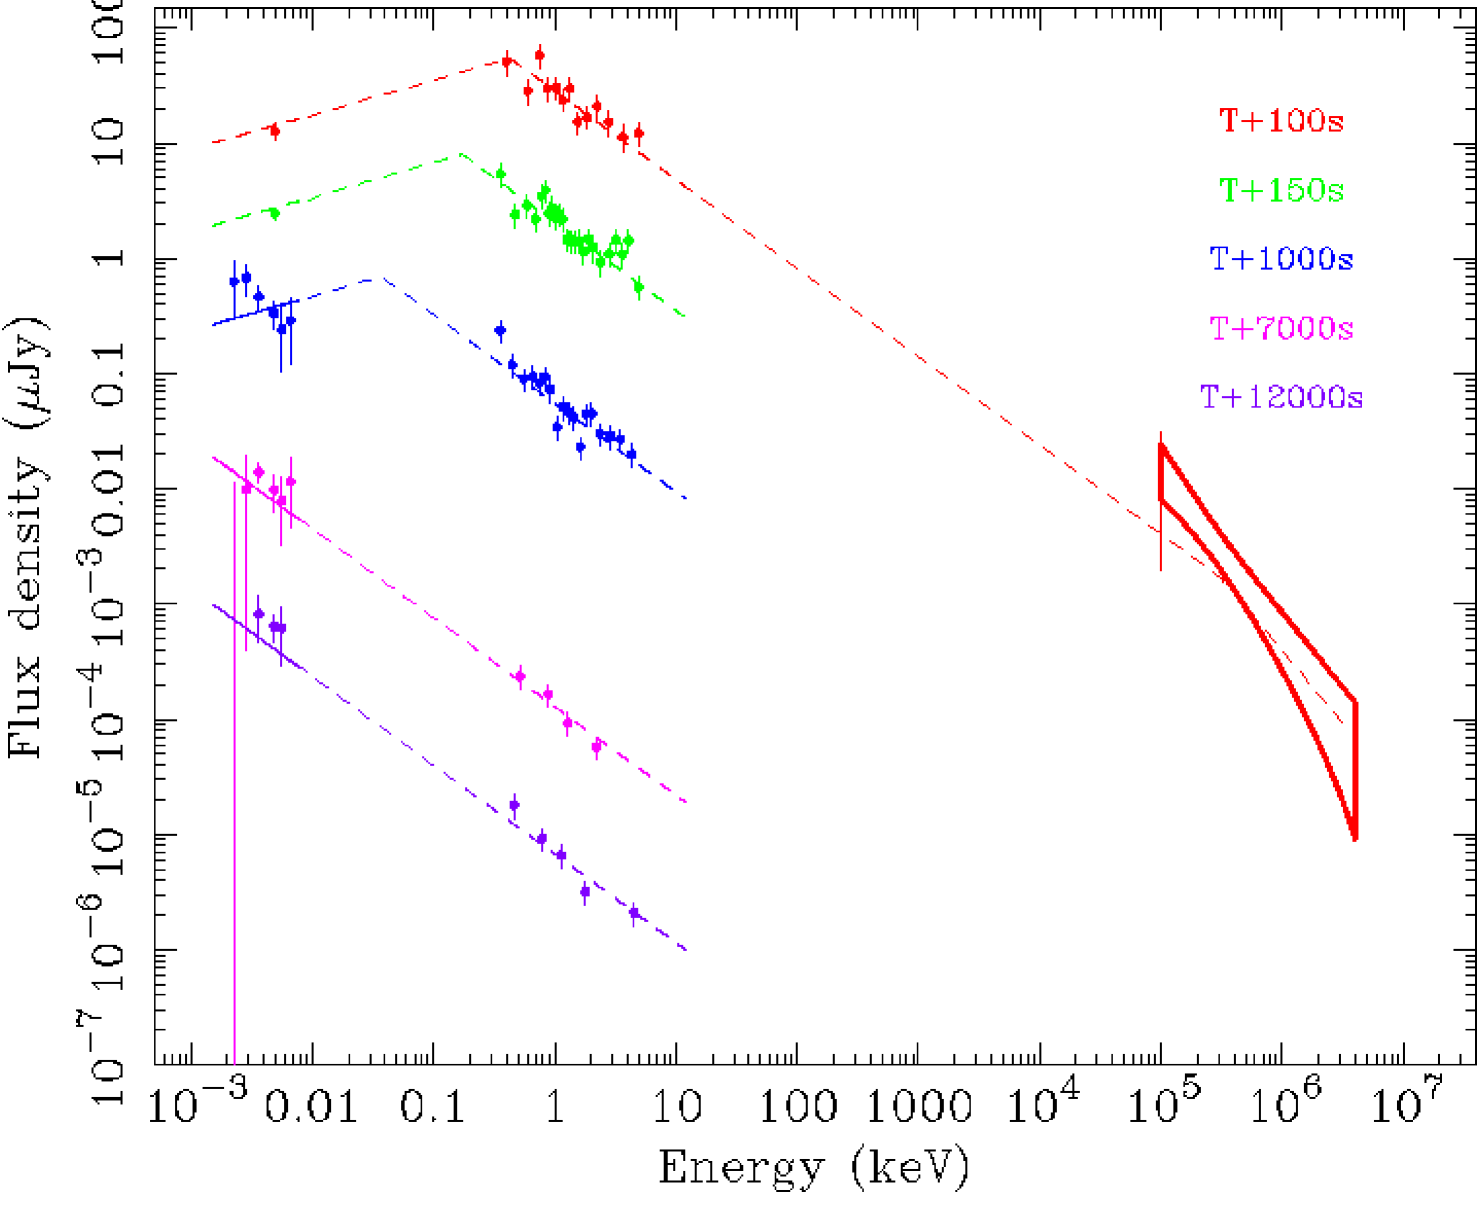
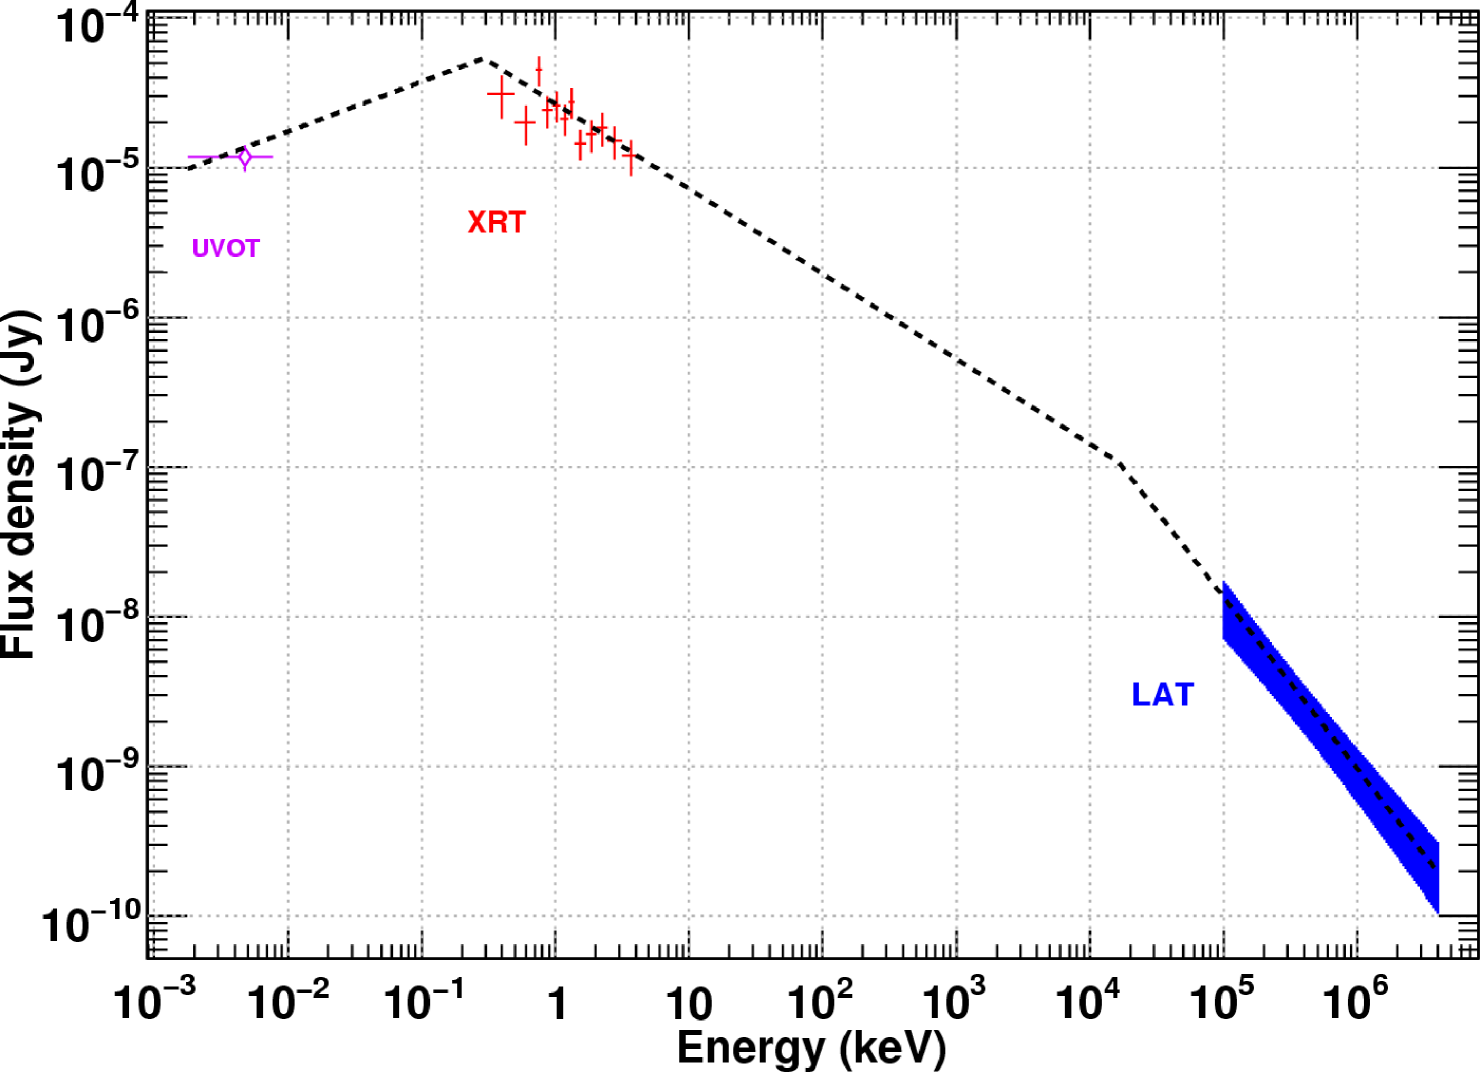
Top : SEDs at different epochs, with the best fit shown ( and constrained, see text). The butterfly at 100s indicates the 68% confidence level region for the LAT flux, obtained from an unbinned likelihood analysis (95% error bar at 100 MeV is shown). Successive SEDs in time order are rescaled by 1:1, 1:10, 1:100, 1:1000, 1:10000. Bottom : SED at 100s, with the best fit shown. The - constraint is relaxed. 68% error bars are shown for UVOT and XRT data. A 68% confidence level region is drawn in the LAT energy range.
The interpretation of the long-lasting multi-waveband emission fron GRB 090510 is discussed in detail in MW090510 . Two scenarios are considered in the fireball model frame.
In the first scenario, X-ray and -ray emissions are due to internal shocks, and the optical and UV emission to the forward shock. The fluxes measured at 100 s after trigger in the X-ray and -ray ranges are consistent with an internal shock origin, with some fine tuning required. For instance this scenario assumes that the initial rise of the optical emission is due to the forward shock onset, and therefore is steeper than what was observed. But the observation may have caught the end of the steep rise phase. This interpretation also requires a very low ambient density , which is low, even for short GRBs. The assumed initial bulk Lorentz factor is consistent with the prompt emission analysis (see section II.2).
Another possibility is that the full long-lasting emission comes from the forward shock region. This model predicts a broad spectrum with a doubly-broken power-law shape and constraints on the indices : , . Five successive Spectral Energy Distributions (SED) have been built for 5 different observation dates (100 s, 150 s, 700 s, 1000 s, 1400 s after trigger), including X-ray and UV data, as well as LAT data for the SED at 150 s (see fig. 4). A fit of these data yields a good agreement with the aforementioned model, with . The low-energy break decreases with time, from 0.43 keV to 0.01 keV. The high-energy break is poorly constrained ( MeV) but is confirmed by a fit of the 100 s SED alone () where the constraint on and is relaxed but still holds within error bars. As a result, the afterglow emission spectrum is well described by the forward shock model over 9 energy decades. The lightcurves observed before 1 ks after trigger are also consistent with this model. However, the early onset of the forward shock emission requires a very high bulk Lorentz factor , and some temporal emission properties are not well explained, e.g. is too shallow and . Theoretical extensions of the model can alleviate these problems. E.g., a phase of energy injection or an evolution of the microphysical parameters of the blast wave may cause an early shallow decay of the X-ray flux ; also the difference between X-ray and optical late decay slopes could be explained by dynamical effects.
IV CONCLUSION
GRB 090510 observation was remarkable for several reasons. First, it was the first short GRB of known redshift () observed at GeV energies. It yielded the highest energy photon ever observed from a short GRB (30.5 GeV). The observation of high-energy photons from this GRB allowed to put strong and robust constraints on linear LIV models ( required) and on the jet’s velocity ().
This GRB also yielded the first clear evidence of an additional high-energy spectral component ( on the time-integrated prompt spectrum), which was to be observed in several other bursts SGuiriec ; ApJ090902B . This high-energy spectral component is a hint for SSC radiation or a possible UHECRs production in GRBs.
Finally, this energetic short GRB showed a bright optical and X-ray afterglow, as well as a long-lived GeV emission, which could be observed thanks to Swift and Fermi fast repoint abilities. The temporal and spectral properties of this long-lasting emission could be studied over 9 energy decades and can be explained in at least two ways : a combination of internal shock and forward shock emission reproduces well the fluxes observed although some fine tuning is required, and a forward-shock only origin can reproduce the observed spectra although it requires some theoretical extensions. Such joint Swift-Fermi observations are very promising for understanding GRB afterglow physics.
References
- (1) E.A. Hoversten, et al., GCN Circular 9331
- (2) M.R. Goad, et al., GCN Circular 9339
- (3) A. Rau, et al., GCN Circular 9353
- (4) S. Guiriec, et al., GCN Circular 9336
- (5) M. Ohno, et al., GCN Circular 9334
- (6) N. Omodei, et al., GCN Circular 9350
- (7) F. Longo, et al., GCN Cicular 9343
- (8) N. Ohmori, et al., GCN Circular 9355
- (9) A.A. Abdo, et al., “A limit on the variation of the speed of light arising from quantum gravity effects”, Nature, 462, 331 (2009)
- (10) A.A. Abdo, et al. “Fermi Observations of GRB 090510: a short hard Gamma-Ray Burst with power-law emission from 10 keV to GeV energies”, ApJ, submitted (2010)
- (11) M. De Pasquale, P. Schady, N.P.M. Kuin, M.J. Page, P.A. Curran, S. Zane, S.R. Oates, S.T. Holland, A. A. Breeveld, E.A. Hoversten, G. Chincarini, D.Grupe ; A.A. Abdo et al. “Swift and Fermi observations of the early afterglow of the short Gamma-Ray Burst 090510”, ApJL, 709, 146 (2009)
- (12) V. Vasileiou, “Constraining Lorentz Invariance Violation with Fermi”, these proceedings
- (13) A.A. Abdo, et al., “Fermi observations of high-energy gamma-ray emission from GRB 080825C”, ApJ, 707, 580 (2009)
- (14) Evans, P.A., Beardmore, A.P., Page, K.L. et al., “An online repository of Swift/XRT light curves of -ray bursts” A&A, 469, 379-385 (2007)
- (15) Evans P.A., Beardmore, A.P., Page K.L., et al., “Methods and results of an automatic analysis of a complete sample of Swift-XRT observations of GRBs”, MNRAS submitted, (2009) (arXiv:08123662)
- (16) S. Guiriec, “Fermi GBM observations of three intense short GRBs”, these proceedings
- (17) A.A. Abdo, et al., “Fermi observations of GRB 090902B: a distinct spectral component in the prompt and delayed emission”, ApJL, 706, 138 (2009)