Fermi LAT Observations of the Supernova Remnant W28 (G6.40.1)
Abstract
We present detailed analysis of the two gamma-ray sources, 1FGL J1801.32322c and 1FGL J1800.52359c, that have been found toward the supernova remnant (SNR) W28 with the Large Area Telescope (LAT) on board the Fermi Gamma-ray Space Telescope. 1FGL J1801.32322c is found to be an extended source within the boundary of SNR W28, and to extensively overlap with the TeV gamma-ray source HESS J1801233, which is associated with a dense molecular cloud interacting with the supernova remnant. The gamma-ray spectrum measured with LAT from 0.2–100 GeV can be described by a broken power-law function with a break of 1 GeV, and photon indices of 2.09 0.08 (stat) 0.28 (sys) below the break and 2.74 0.06 (stat) 0.09 (sys) above the break. Given the clear association between HESS J1801233 and the shocked molecular cloud and a smoothly connected spectrum in the GeV–TeV band, we consider the origin of the gamma-ray emission in both GeV and TeV ranges to be the interaction between particles accelerated in the SNR and the molecular cloud. The decay of neutral pions produced in interactions between accelerated hadrons and dense molecular gas provide a reasonable explanation for the broadband gamma-ray spectrum. 1FGL J1800.52359c located outside the southern boundary of SNR W28, cannot be resolved. An upper limit on the size of the gamma-ray emission was estimated to be 16′ using events above 2 GeV under the assumption of a circular shape with uniform surface brightness. It appears to coincide with the TeV source HESS J1800240B, which is considered to be associated with a dense molecular cloud that contains the ultra compact H II region W28A2 (G5.890.39). We found no significant gamma-ray emission in the LAT energy band at the positions of TeV sources HESS J1800230A and HESS J1800230C. The LAT data for HESS J1800230A combined with the TeV data points indicate a spectral break between 10 GeV and 100 GeV.
1 Introduction
Diffusive shock acceleration operating at supernova shock waves can distribute particles to very high energies with a power-law form having number index about 2 (e.g., Blandford & Eichler, 1987). It is generally expected that if a dense molecular cloud is overtaken by a supernova blast wave, the shocked molecular cloud can be illuminated by relativistic particles accelerated at supernova shocks (Aharonian et al., 1994). If the accelerated particles are comprised mostly of protons, say times more abundant than electrons like the observed Galactic cosmic rays, decays of neutral pions produced in inelastic collisions of the accelerated protons with dense gas are expected to be a dominant radiation component in the gamma-ray spectrum of the cosmic-ray-illuminated molecular cloud. Although an earlier attempt to detect TeV gamma-ray emission from supernova remnants (SNRs) that have evidence for molecular cloud interactions with the Whipple telescope failed (Buckley et al., 1998), two archetypical SNRs interacting with molecular clouds, IC 443 (Albert et al., 2007; Acciari et al., 2009) and W28 (Aharonian et al., 2008), have been detected with the current generation of imaging atmospheric Cherenkov telescopes. However, the identities of the particles responsible for the TeV sources remains elusive.
The advent of the Large Area Telescope (LAT) onboard the Fermi Gamma-ray Space Telescope has brought a new opportunity to study the gamma-ray emission from SNRs at GeV energies. LAT observations of middle-aged SNRs interacting with molecular clouds, W51C (Abdo et al., 2009), W44 (Abdo et al., 2010a), and IC 443 (Abdo et al., 2010b), have revealed bright extended gamma-ray sources coincident with the SNRs. The gamma-ray luminosity reaches , which immediately rules out an inverse-Compton origin of the GeV gamma rays since it requires total electron energy comparable to or larger than the typical kinetic energy released by a supernova explosion, erg. The gamma-ray spectra of the three remnants exhibit remarkable spectral breaks at an energy of several GeV, making these SNRs much less luminous at TeV energies. This characteristic demonstrates the importance of observations at GeV energies.
W28 is a mixed-morphology SNR, characterized by center-filled thermal X-ray emission and shell-like radio morphology. In addition X-ray observations show limb-brightened shells in the northeast and southwest (Rho & Borkowski, 2002). The shell-like radio emission is prominent in the northeastern region with slightly fainter emission at the northern boundaries (Dubner et al., 2000). Interactions of the SNR with molecular clouds (Wootten, 1981) along its northern and northeastern boundaries are traced by the high concentration of 1720 MHz OH masers (Frail et al., 1994; Claussen et al., 1997, 1999), and high density ( cm-3) shocked gas (Arikawa et al., 1999; Reach et al., 2005). The overall shape of W28 is elliptical with a size of . W28 is located within a complex, star-forming region along the Galactic plane toward the large H II regions (M8 and M20) and young clusters (e.g., NGC 6530) (Goudis, 1976). The observations of molecular lines place SNR W28 at a distance of kpc (Velzquez et al., 2002). Estimates for its age vary between and yrs (Kaspi et al., 1993). W28 is considered to be an evolved remnant in the radiative stage of SNR evolution (Lozinskaya, 1992), which is supported by optical observations (Lozinskaya, 1974). Measurements with Energetic Gamma-Ray Experiment Telescope (EGRET) onboard the Compton Gamma-ray Observatory found a gamma-ray source, 3EG J1800-2338 (Hartman et al., 1999) in the W28 field. However, its association to SNR W28 remained unclear mainly due to large source location uncertainties from EGRET. A gamma-ray source is listed in the W28 field in the AGILE (Astro-rivelatore Gamma a Immagini LEggero) one year catalog (Pittori et al., 2009). However, detailed analysis of this field is not published by AGILE yet.
H.E.S.S. observations of the W28 field have revealed four TeV gamma-ray sources positionally coincident with molecular clouds (Aharonian et al., 2008): HESS J1801233, located along the northeastern boundary of W28, and a complex of sources, HESS J1800240A, B and C, located south of SNR W28. HESS J1801233 coincides with a molecular cloud interacting with SNR W28, providing one of the best examples of a cosmic-ray-illuminated cloud. Understanding the origins of TeV emission in HESS J1800240ABC is of particular interest; they may be due to cosmic rays that have diffused from W28.
In this paper, we report Fermi LAT observations of gamma-ray sources in the W28 field in the GeV domain. First, we give a brief description of the observation and gamma-ray selection in Section 2. The analysis procedures and results are explained in Section 3, where the spatial extension and spectra of the LAT sources in the W28 field are described. Discussion is given in Section 4, followed by conclusions in Section 5.
2 OBSERVATION AND DATA REDUCTION
The LAT is the main instrument on Fermi sensitive to gamma rays. The energy range spans from 20 MeV to 300 GeV, although as noted below in the present analysis we use only events with energies 200 MeV. It is an electron-positron pair production telescope, built with tungsten foils and silicon microstrip detectors to measure the arrival directions of incoming gamma rays, and a hodoscopic cesium iodide calorimeter to determine the gamma-ray energies. They are surrounded by 89 segmented plastic scintillators that serve as an anticoincidence detector to reject charged particle events. Details of the LAT instrument and pre-launch expectations of the performance can be found in Atwood et al. (2009). Relative to earlier gamma-ray missions, the LAT has a large 2.4 sr field of view, a large effective area ( 8000 cm2 for 1 GeV if on-axis) and improved angular resolution or point-spread function (PSF, better than 1∘ for 68% containment at 1 GeV).
Routine science operations of the LAT began on August 4, 2008, after the conclusion of a commissioning period. We have analyzed events in the W28 field, collected from August 4, 2008, to July 4, 2009, with a total exposure of 2.8 1010 cm2 s (at 1 GeV). During this time interval, the LAT was operated in sky survey mode nearly all of the time. In this observing mode the LAT scans the sky, obtaining complete sky coverage every 2 orbits ( 3 hr) and relatively uniform exposures over time.
We used the standard LAT analysis software, ScienceTools version v9r15, which is available from the Fermi Science Support Center (FSSC)111Software and documentation of the Fermi ScienceTools are distributed by Fermi Science Support Center at http://fermi.gsfc.nasa.gov/ssc, and applied the following event selection criteria: a) events have the highest probability of being gamma rays, i.e., they should be classified as so-called Pass 6 diffuse class (Atwood et al., 2009), b) the reconstructed zenith angles of the arrival direction of gamma rays should be less than 105∘, to minimize contamination from Earth albedo gamma rays, c) the center of the LAT field of view should be within 39∘ from the zenith in order to exclude data from the short time intervals when the field of view can be partly occulted by the earth. There are no gamma-ray bursts detected by the LAT within 15∘ of the W28 field, thus we did not need to apply any additional time cut. The energy range analyzed here is restricted to 200 MeV to avoid possible large systematic uncertainties due to the strong Galactic diffuse emission near the Galactic center, smaller effective area, and much broader PSF at lower energies.
3 ANALYSIS AND RESULTS
3.1 Source position and Spatial Extension
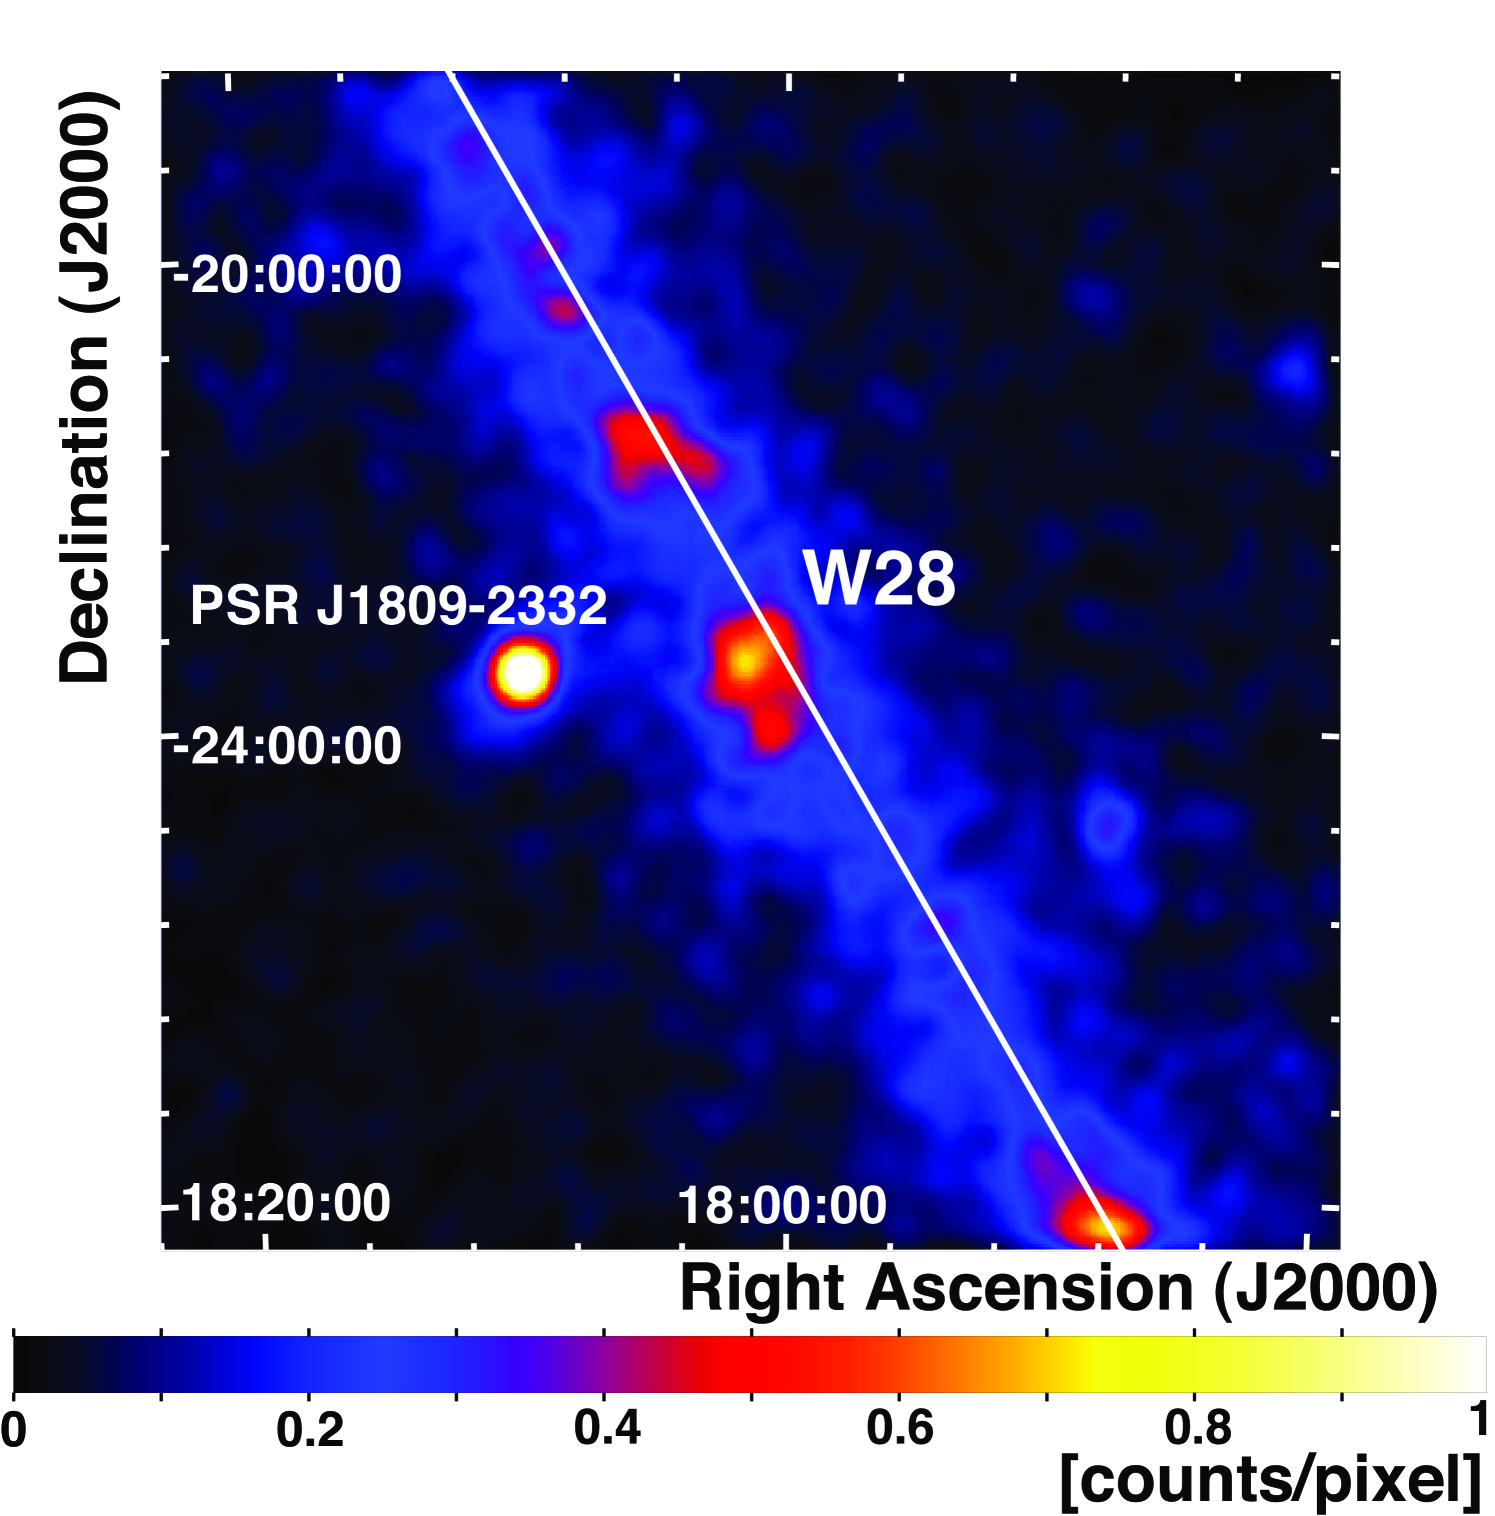
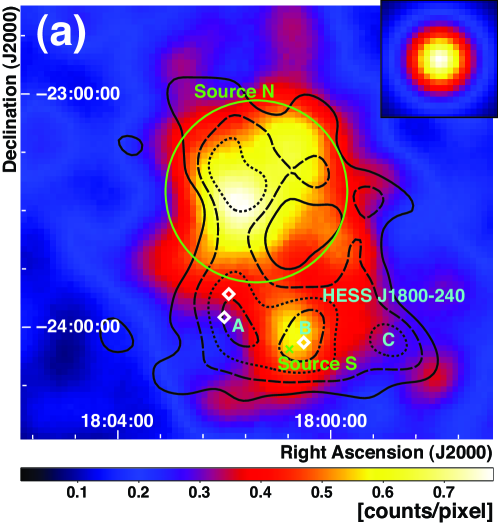
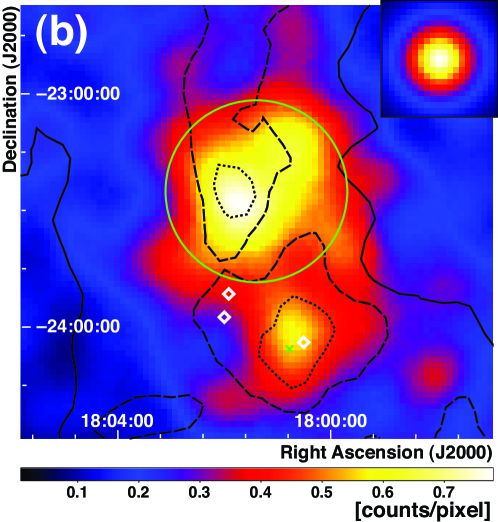
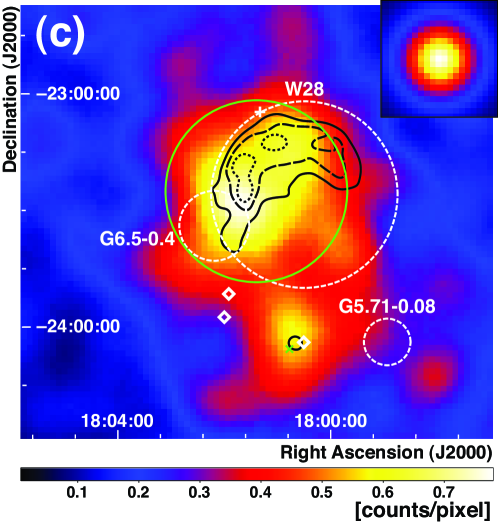
Figure 1 shows a smoothed count map in the 2–10 GeV energy band in a 10 10∘ region around W28. Figure 2 gives comparisons with images of other wavebands in close-up view. Black contours indicate the H.E.S.S. significance map in (a), CO (J=1-0) line intensity taken by NANTEN for the velocity range from 0 km s-1 to 20 km s -1 (corresponding to kinematic distances of approximately 0 to 4 kpc) in (b), and a VLA image in (c). Correlations between GeV gamma rays observed by LAT and some of the H.E.S.S. sources are evident. Gamma rays are also bright in the brightest spots in the CO contours, and bright regions in the gamma-ray image extensively overlap with bright regions in the VLA contours. There are two LAT sources in the vicinity of W28 in the 1FGL catalog (Abdo et al., 2010d): 1FGL J1801.32322c, and 1FGL J1800.52359c. No obvious pulsations of gamma rays are found in these sources. Hereafter we refer to 1FGL J1801.32322c as Source N, and to 1FGL J1800.52359c as Source S.
In order to quantitatively evaluate the extension and location of these two sources, we apply the maximum likelihood tool, gtlike, which is publicly available as part of Fermi ScienceTools. The likelihood is the product of the probability of observing the gamma-ray counts of each spatial and energy bin given the emission model, and the best parameter values are estimated by maximizing the likelihood of the data given the model (Mattox et al., 1996). The probability density function for the likelihood analysis included a) individual sources detected in the preliminary LAT 1-year catalog, b) the Galactic diffuse emission resulting from cosmic-ray interactions with the interstellar medium and radiation based on the LAT standard diffuse background model gll_iem_v02 available from FSSC222The model can be downloaded from http://fermi.gsfc.nasa.gov/ssc/data/access/lat/BackgroundModels.html., and c) the isotropic component to represent extragalactic and residual cosmic-ray backgrounds using the isotropic spectral template isotropic_iem_v02 from FSSC. Note that we make energy dependent corrections of the the Galactic diffuse model by multiplying a power law function with the spectral index free to vary in the fit. This correction gives better spectral fits by taking account of local systematic discrepancies between the data and the Galactic diffuse model. The region of interest for the binned maximum likelihood analysis was a square region of 20∘20∘ centered on W28 with a pixel size of 0.∘1. The instrument response functions (IRFs) used in our work were the “Pass 6 v3” (P6_V3) IRFs, which were developed following launch to address gamma-ray detection inefficiencies that are correlated with background rates.
Using the tools described above, we investigated spatial extensions of the two LAT W28 sources. Here we used only events above 2.15 GeV to take advantage of narrower PSF in the higher energy band. Before investigating the detailed extension, we first determined the flux and spectral index for all components except for Source N and Source S. In this process, the normalization of the Galactic diffuse emission and the flux and spectral index of power-law model for the sources within 5 degrees of Source N were set free to account for the effects of sources around W28 on the background flux in the fit. The flux and spectral index except for those of Source N and Source S are fixed hereafter. We used a radially symmetric uniform disk to evaluate the extension. We varied the radius and location of the disk while holding the position of Source S fixed at the catalog position, and evaluated the resulting maximum likelihood value () with respect to the maximum likelihood for no source hypothesis () and the point source hypothesis (). A two-source hypothesis () is also evaluated by scanning positions of two point sources.
The best likelihood ratio is obtained for Source N with a disk radius of , which rejects a point source hypothesis at more than 8 . Note that we validated this procedure by applying this method on a nearby gamma-ray pulsar, PSR J18092332 (Abdo et al., 2010c) ( 2∘ away from W28), where we find the extension to be consistent with a point source. In addition, the best likelihood ratio for the disk shape is substantially better than that for two point sources, , where the positions of the two sources were free in the optimization. Therefore we use the best-fit disk model for further analysis of Source N. The best location of the disk model is found at (R.A., Dec.) (18h01m21s, 23∘26′26′′) with an error radius of at 68 % confidence level.
The extension of Source S is also investigated using the same procedure as above. We did not find significant extension. An upper limit on the size of the gamma-ray emission was obtained by investigating the decrease of the likelihood with increasing source size. Under the assumption of a disk shape, the upper limit amounts to 16′ at the 68% confidence level. We treat Source S as a point source hereafter. The best-fit location of Source S was estimated to be (R.A., Dec.) (18h00m59s, 24∘11′31′′) using gamma rays above 2.15 GeV. This location is 13′ away from the location of 1FGL J1800.52359c using gamma rays above 0.1 GeV and assuming 1FGL J1801.32322c is a point source. In order to investigate the origin of the position difference, we performed localization with the same energy cut as the catalog analysis assuming a point source hypothesis and the extended source hypothesis. We found that the localization with a point source hypothesis is consistent with the catalog position while the extended source hypothesis yields the location consistent with our localization with GeV cut. From this comparison, we conclude that the localization difference is mostly due to the extension of Source N. We use the average of two localizations, (R.A., Dec.) (18h00m47s, 24∘05′45′′), for the following analyses, with a systematic uncertainty of half of the positional difference, 6′.
We find no strong gamma-ray emission in the LAT energy band at the locations of HESS J1800240 A and C. We evaluated the likelihood of point sources at these locations and found likelihood ratios (corresponding to a 3 ) for HESS J1800240A and (corresponding to a 3 ) for HESS J1800240C, which confirms no significant emission at these locations.
3.2 Energy Spectrum
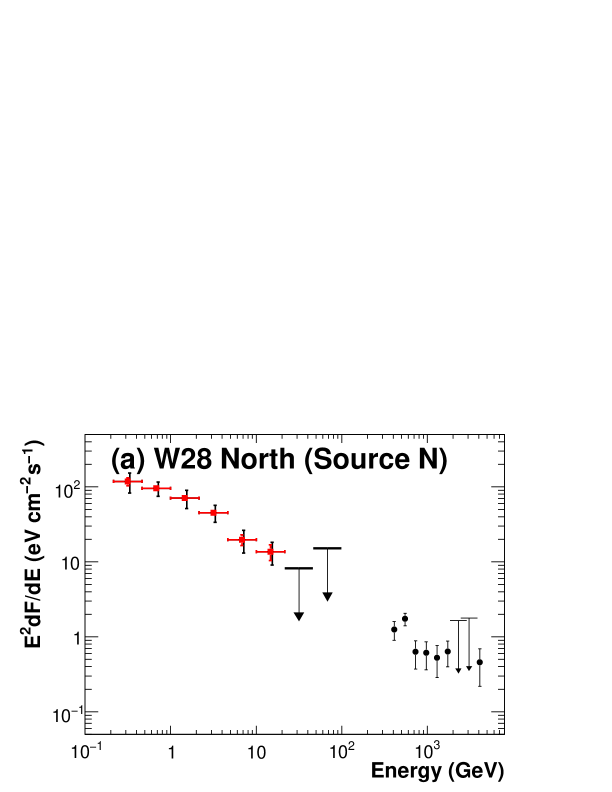
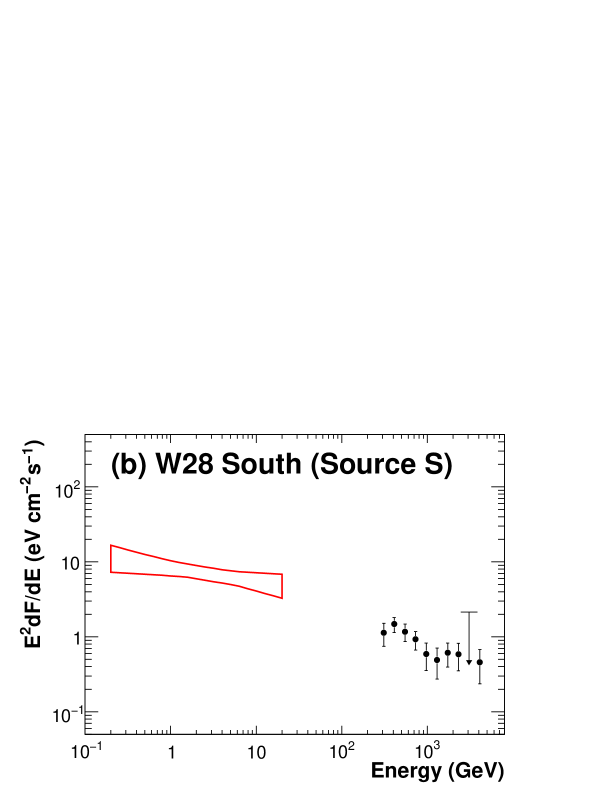
We used the maximum likelihood fit tool, gtlike, for the spectral analysis of LAT sources in this region. Flux points were obtained by performing the maximum likelihood analysis in each energy bin. We used eight logarithmically spaced energy bins from 215 MeV to 100 GeV for Source N. We did not divide the energy range from 0.2 GeV–100 GeV into bins for Source S due to poor statistics. Fig. 3 shows resulting SEDs for (a) Source N and (b) Source S. The 68% confidence region is illustrated for Source S up to 20 GeV. We do not have sufficient number of events above 20 GeV to constrain the spectrum. Upper limits at 90% confidence level are calculated assuming a photon index of 2 if the detection is not significant in an energy bin, i.e., the likelihood ratio with respect to no source is less than 9. Note that the value of the spectral index has negligible effect on the upper limits. We take into account systematic errors due to uncertainties of the extension, the Galactic diffuse model, the LAT effective area, and the effect of the nearby gamma-ray pulsar PSR J18092332. Systematic errors associated with the extension are estimated by varying the source size by . We also evaluated the effect of the shape by comparing the disk shape used in this paper and a circular two-dimensional Gaussian. Systematic errors due to the Galactic diffuse model are estimated by using the residual gamma-ray data with respect to the best fit model in the region where no LAT source is present, specifically, and . The observed residual is energy dependent and can be modeled as (116 (/1 GeV)) % of the total Galactic diffuse flux. The normalization of the Galactic diffuse model is adjusted according to the above equation to estimate the systematic error on the source flux. We evaluated the position dependence of this residual and found a dispersion of 5%, which is not a large effect. Uncertainties of the Galactic diffuse model make a dominant contribution to systematic errors in all the energy bins. Uncertainties of the LAT effective area is 10% at 100 MeV, decreasing to 5% at 500 MeV, and increasing to 20% at 10 GeV and above (Rando et al., 2009). The effect of the nearby gamma-ray pulsar was estimated by varying the flux by 1 .
We evaluated a possibility of a spectral break in the LAT energy band by comparing the likelihood of the spectral fit for the LAT data between a simple power law and a broken power law as a spectral model of Source N and Source S. The fits yield the likelihood ratio for Source N, where and are the likelihoods for the simple power-law model and the broken power-law model, respectively. The likelihood ratio slightly decreases to at least (corresponding to 6.6 with two degrees of freedom) in the worst case accounting for systematic uncertainties. Thus we conclude that Source N has a spectral break at 1.0 0.2 GeV, where the error is dominated by statistics. Photon indices are 2.09 0.08 (stat) 0.28 (sys) below the break and 2.74 0.06 (stat) 0.09 (sys) above the break. Note that the photon index above the break is consistent with the H.E.S.S. measurement of (Aharonian et al., 2008). On the other hand, we do not find any evidence of a spectral break for Source S. The photon index is found to be 2.19 0.14 (stat) 0.41 (sys).
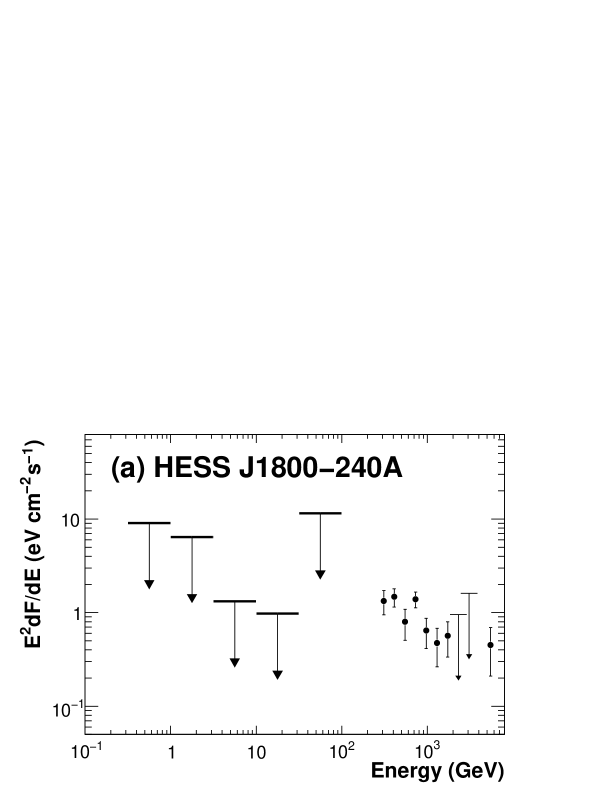
We placed upper limits on the gamma-ray flux in the LAT band at the positions of HESS J1800240A and HESS J1800240C. The upper limits are compared with the H.E.S.S. spectra in Fig. 4 (a) and (b). The gamma-ray upper limits in the GeV band at the location of HESS J1800240A appear to be inconsistent if the source spectrum is a simple power law. We evaluated the possibility of a break between the LAT and H.E.S.S. energy band by comparing the likelihood of the spectral fit for the LAT data between a broken power law and a simple power law as a spectral model of this source. We fixed the spectral index and the flux values using the H.E.S.S. measurements for the simple power-law model while we fixed the spectral index above the break and the flux at the same value as the simple power law and varied the break energy and the spectral index below the break for the broken power-law model. We used the parameter values at away from the best fit values from H.E.S.S. in the direction where we expect less flux in the LAT energy band, i.e. harder spectral index and lower flux than the best fit values. The fits yield the likelihood ratio (corresponding to a significance with two degrees of freedom) for a break energy between 10 GeV and 100 GeV. The likelihood ratio decreases to corresponding to a significance if we use parameter values away from the best-fit values from H.E.S.S. We conclude that HESS J1800240A is likely to have a spectral break between 10 GeV and 100 GeV.
4 DISCUSSION
4.1 1FGL J1801.32322c (Source N)
1FGL J1801.32322c (Source N) is found to be extended and positionally coincident with HESS J1801233. Given the clear spatial match between the TeV source and the molecular cloud interacting with SNR W28 and a smoothly connected spectrum in the GeV–TeV band, we assume that the bulk of GeV and TeV gamma-ray emission comes from the molecular cloud illuminated by particles accelerated in supernova shocks. Below, we adopt the simplest assumption, that GeV and TeV gamma rays are emitted by a population of accelerated protons and electrons distributed in the same region characterized by constant density and magnetic field strength. It should be noted that the imaging resolution of the LAT is not good enough to differentiate the GeV emission region from the TeV region. We assume the injected electrons have the same momentum distribution as the protons. This assumption implies a break in the particle momentum spectrum because the spectral index of the radio data, corresponding to lower particle momenta, is much harder than that for the gamma-rays, which correspond to higher particle momenta. Therefore, we use a broken power-law to describe the particle momentum distribution in the region. Electrons suffer energy losses due to ionization (or Coulomb scattering), bremsstrahlung, synchrotron processes, and inverse Compton scattering. The modification of the electron spectral distribution due to such losses was calculated according to Atoyan et al. (1995), where electrons are assumed to be injected at from an impulsive source. Since diffusive shock acceleration theory generally predicts particle accelerations in the Sedov phase with a typical duration – yrs, the assumption of an impulsive source would be a good approximation for SNRs with the age of – yrs. We adopt yrs for the age of W28 in this modeling. Note that here we consider the minimum momenta of protons and electrons to be 100 MeV since the details of the proton/electron injection process are poorly known. The gamma-ray spectrum from decay produced by the interaction of protons with ambient hydrogen is scaled by a factor of 1.84 to account for helium and heavy nuclei in target material and cosmic-ray composition (Mori, 2009).
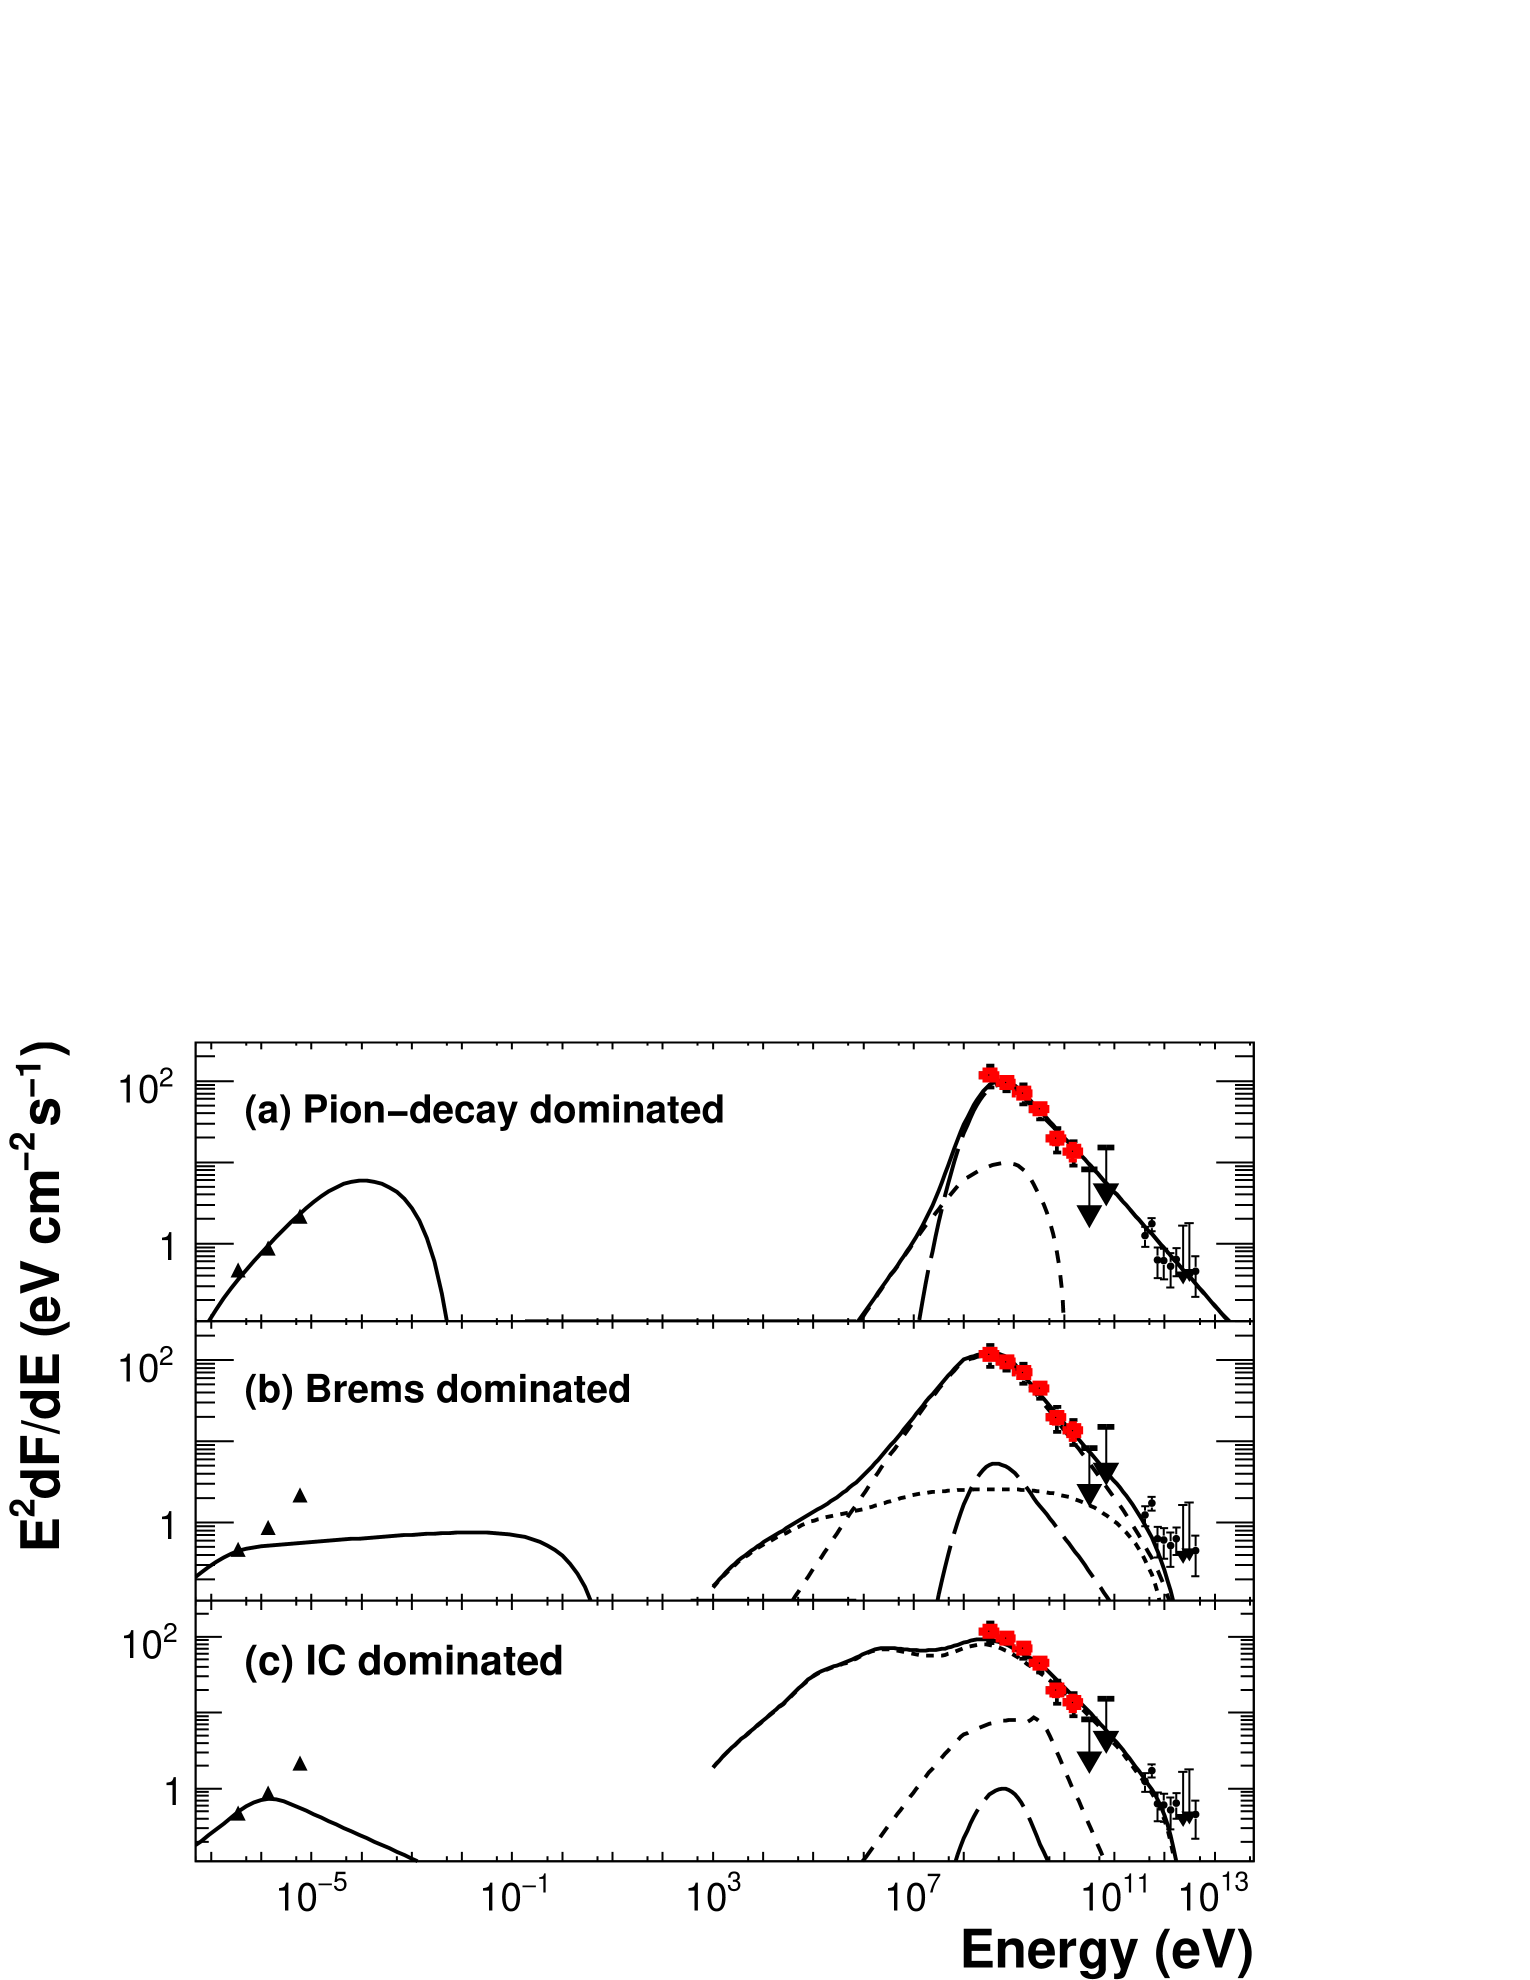
First, we consider a -decay model to account for the broadband gamma-ray spectrum. Indeed, the hadronic scenario gives the most satisfactory explanation for the GeV gamma rays observed in other SNRs interacting with molecular gas such as W51C (Abdo et al., 2009) and W44 (Abdo et al., 2010a). The number index of protons in the high-energy regime is constrained to be from the gamma-ray spectral slope. The observed gamma-ray luminosity requires the gas density to be much larger than averaged over the entire SNR shell in order not to exceed the typical kinetic energy of a supernova explosion (). The resulting total proton energy, erg, is less than 10% of the typical kinetic energy of supernova explosions and quite reasonable. Note that is not the total energy of accelerated protons but that of the in-situ protons in the molecular clouds. Using the parameters summarized in Table 1, we calculated radiation model curves as shown in Figure 5 (a). As described above, the spectral index of the proton momentum below the break is determined to be by modeling the radio spectrum as synchrotron radiation by relativistic electrons because we assume that protons and electrons have identical injection spectra. It is difficult to derive the break point of the proton momentum spectrum from the break of the gamma-ray spectrum since it lies in the region where we expect a gamma-ray spectral curvature due to kinematics of production and decays. Because of this, the gamma-ray spectrum gives an upper bound for the momentum break at 5 GeV . The momentum break cannot be lower than 2 GeV to avoid conflict with the radio data. Here we adopt 2 GeV . The magnetic field strength is constrained to be G, for an electron-to-proton ratio of , which is the ratio found in the local cosmic-ray abundance. Here the ratio is defined at a particle momentum of 1 GeV . This choice of results in minor contribution from the electron bremsstrahlung emission in the gamma-ray band.
On the other hand, it is difficult to model the GeV–TeV spectrum by the electron bremsstrahlung component alone because the break in the electron spectrum corresponding to the gamma-ray spectrum will appear in the radio data as shown in Fig. 5 (b) although it might be contaminated by a thermal component (Dubner et al., 2000). Moreover, the magnetic field strength is constrained to be less than G for the age of yrs since no apparent synchrotron cooling is observed at TeV energies. The low magnetic field requires the gas density to be smaller than from the flux ratio of the synchrotron component in the radio band and the bremsstrahlung in the gamma-ray band. These low values for the magnetic field and the gas density are in disagreement with our assumption that the gamma-ray emission comes from the dense molecular cloud.
The gamma-ray spectrum is formally reproduced by inverse Compton (IC) emission from accelerated electrons in Fig.5 (c). The interstellar radiation field for the IC scattering (see Table 1) is comprised of infrared, optical and the cosmic microwave background (CMB). The infrared and optical components are taken from the interstellar radiation field at the location of W28 in the GALPROP code (Porter et al., 2008). Since the spectral shape of the non-CMB component is very complex, it is approximated by two infrared and two optical blackbody components. The flux ratio between the IC and the synchrotron components constrains the magnetic field to be less than G. The total energy in electrons is calculated to be erg for an energy density of 1.8 eV cm-3 for the interstellar radiation field. This model requires a rather low gas density of to suppress the electron bremsstrahlung, which is in contradiction with our assumption.
Observations with Fermi have demonstrated that bright, extended gamma-ray sources coincident with middle-aged SNRs interacting with molecular clouds, such as W44 (Abdo et al., 2010a), W51C (Abdo et al., 2009), and IC 443 (Abdo et al., 2010b), exhibit spectral breaks from 9 GeV to a few tens of GeV in the proton momentum spectrum. Our observations of 1FGL J1801.32322c in the vicinity of W28 combined with the radio data constrain the proton momentum break to be in the range, 2–5 GeV . The observed energy distribution of relativistic particles (most likely protons) could be influenced greatly by diffusive transport of particles. If so, the relationship between the observed particle spectrum and the acceleration spectrum should be rather complicated. The steep particle spectrum, , deduced for 1FGL J1801.32322c does not necessarily represent the acceleration index. Gabici & Aharonian (2007) discussed the time evolution of non-thermal emission from molecular clouds illuminated by cosmic rays from a nearby SNR and predicted a steep gamma-ray spectrum for an old SNR due to energy-dependent diffusion of cosmic rays. More detailed studies of the properties of interactions between SNRs and molecular clouds are required for a comprehensive description of the differences in the break momenta and photon indices above the break among the above SNRs.
4.2 1FGL J1800.52359c (Source S)
1FGL J1800.52359c (Source S) was found to have no significant extension and spatially coincides with the TeV source HESS J1800240B, which is associated with molecular clouds that contain the ultra-compact H II region W28A2 (G5.890.39). The observed GeV–TeV spectrum for Source S can be formally described by dominated, bremsstrahlung dominated, and IC dominated models in a similar manners to Source N, as shown in Fig. 6. Free-free emission (Gmez et al., 1991) is responsible for the radio spectrum of W28A2, which provides only upper limits in the SED. Thus values of and are less constrained by pion and bremsstrahlung models. We adopt cm-3 (Aharonian et al., 2008) for both models. From the positional coincidence, W28A2 can be invoked as a possible source of high-energy particles responsible for the gamma-ray emission. W28A2 exhibits very energetic bipolar molecular outflows (Harvey & Forceille, 1988; Acord et al., 1997; Sollins et al., 2004) which would arise from the accretion of matter by a stellar progenitor. Klaassen et al. (2006) estimated the total kinetic energy of the outflow of W28A2 to be erg, which requires very high matter density to account for the observed gamma-ray flux in both pion and bremsstrahlung models. If the matter density is as high as 107 cm-3 as suggested by Klaassen et al. (2006), the resulting total energy would be less than a few percent of the total kinematic energy of the outflow of W28A2.
Cosmic rays that escaped from the SNR W28 in earlier epochs would be another possible explanation given the energetics. Note that Source S would lie at a projected distance of pc from the southern circular boundary of W28. If we assume that cosmic rays are uniformly radiated by the SNR, the cosmic-ray flux bombarding the molecular cloud from the SNR can be scaled by the fraction of the solid angle of the molecular cloud, . Using this scaling factor, the total energies in the whole SNR W28 could be calculated from the total energy observed in this source to be erg for protons in the model. This is a reasonable value for an SNR. The energy density of such cosmic rays is enhanced to be at least 2 eV cm-3 at the molecular clouds under the assumption that all of the associated clouds ( at 2 kpc) are interacting with energetic particles. The molecular clouds can accumulate those cosmic rays in the past since the diffusion coefficient is expected to be low in dense environments (Aharonian & Atoyan, 1996).
While we detected LAT sources spatially coincident with HESS J1801233 and HESS J1800230B, no strong LAT counterpart can be found at the positions of HESS J1800230A and HESS J1800230C. We found evidence of a spectral break between 10 GeV and 100 GeV for HESS J1800230A. The velocity with respect to the local standard of rest of the molecular emission positionally coincident with this source peaks at 16 km s-1, corresponding to a distance of 4 kpc (Aharonian et al., 2008). However, the velocity difference between this cloud and the one associated with HESS J1800230B is only km s-1 and can be attributed to the proper motion of the cloud complex that contains both clouds. If the distance to the cloud associated with HESS J1800230A is 4 kpc, then it is unlikely that this source is associated with W28 since the distance to W28 is 2 kpc. H II regions, G6.10.6 and/or G6.2250.569 could be a source of accelerated particles. If the cloud associated with HESS J1800230A is part of the cloud complex that includes the cloud associated with HESS J1800230B, then the distance would be 2 kpc, which is very similar to the clouds associated with W28. In this case, particles escaped from W28 may be responsible for the gamma-ray emissions at both HESS J1800230A and B and further studies of the origin of the difference in the spectral shapes in these sources may provide good constraints on the particle diffusion process.
5 CONCLUSIONS
We have investigated two LAT sources in the W28 field. Source N (1FGL J1801.32322c) which is located at the northeast boundary of the SNR W28 is positionally coincident with shocked molecular clouds, and is spatially extended. The spectrum has a break around 1.0 GeV and smoothly connects to the TeV spectrum, suggesting a physical relationship. Decay of s produced by the interaction of an SNR with molecular clouds naturally explains the gamma rays from Source N based on the spatial correlation between GeV gamma rays and molecular clouds and the energetics of cosmic rays. Electron bremsstrahlung can not be ruled out completely although it requires a low density and low magnetic field in contradiction with the association with the molecular clouds. W28 is the most plausible energy source due to the observational evidence of interaction with the molecular clouds. The soft spectrum of the gamma rays may be explained by the time evolution of non-thermal emission from molecular clouds illuminated by cosmic rays from a nearby SNR due to energy-dependent diffusion of cosmic rays.
The Source S (1FGL J1800.52359c) was found to have no significant extension and spatially coincides with the TeV source HESS J1800240B, molecular clouds, and the ultracompact H II region W28A2 (G5.890.39). The compact H II region W28A2 and the SNR W28 are possible energy sources, but the W28A2 hypothesis requires extremely dense gas.
While no significant LAT counterpart is found at the positions of HESS J1800230A and HESS J1800230C, the LAT upper limits for HESS J1800230A coupled with the H.E.S.S. data points imply a spectral break between 10 GeV and 100 GeV.
References
- Abdo et al. (2009) Abdo, A. A., et al. (The Fermi LAT Collaboration) 2009, ApJ, 706, L1
- Abdo et al. (2010a) Abdo, A. A., et al. (The Fermi LAT Collaboration) 2010a, Science in press
- Abdo et al. (2010b) Abdo, A. A., et al. (The Fermi LAT Collaboration) 2010b, to appear in ApJ, arXiv:1002.2198
- Abdo et al. (2010c) Abdo, A. A., et al. (The Fermi LAT Collaboration) 2010c, to appear in ApJS, arXiv:0910.1608
- Abdo et al. (2010d) Abdo, A. A., et al. (The Fermi LAT Collaboration) 2010d, submitted to Ap&SS, arXiv:1002.2280
- Acciari et al. (2009) Acciari, V. A., et al. 2009, ApJ, 698, L133
- Acord et al. (1997) Acord, J. M., Walmsley, C. M., & Churchwell, E. 1997, ApJ, 475, 693
- Aharonian & Atoyan (1996) Aharonian, F. A., Atoyan, A. M. 1996, A&A, 309, 917
- Aharonian et al. (1994) Aharonian, F. A., Drury, L. O., & Vlk, H. J. 1994, A&A, 285, 645
- Aharonian et al. (2008) Aharonian, F., et al. 2008, A&A, 481, 401
- Albert et al. (2007) Albert J., et al. (The MAGIC Collaboration) 2007, ApJ, 664, L87
- Arikawa et al. (1999) Arikawa, Y., Tatematsu, K., Sekimoto, Y., & Takahashi, T. 1999, PASJ, 51, L7
- Atoyan et al. (1995) Atoyan A. M., Aharonian A. F., & Vlk, H. J. 1995, Phys. Rev. D, 52, 3265
- Atwood et al. (2009) Atwood, W. B., et al. (The Fermi LAT Collaboration) 2009, ApJ, 697, 1071
- Blandford & Eichler (1987) Blandford, R. D. & Eichler, D. 1987, Phys. Rep., 154, 1
- Brogan (2006) Brogan C. L., Gelfand, J. D., Gaensler, B. M., Kassim, N. E., & Lazio, T. J. W. 2006, ApJ, 639, L25
- Buckley et al. (1998) Buckley, J. H., et al. 1998, A&A, 329, 639
- Claussen et al. (1997) Claussen, M. J., Frail, D. A., Goss, W. M., & Gaume, R. A. 1997, ApJ, 489, 143
- Claussen et al. (1999) Claussen, M. J., Goss, W. M., Frail, D. A., & Desai, K. 1999, ApJ, 522, 349
- Dubner et al. (2000) Dubner, G. M., Velzquez, P. F., & Goss, W. M., 2000, ApJ, 120, 1933
- Frail et al. (1994) Frail, D. A., Goss, W. M., & Slysh, V. I. 1994, ApJ, 424, L111
- Gabici & Aharonian (2007) Gabici, S., & Aharonian, F. A. 2007, ApJ, 665, L131
- Gmez et al. (1991) Gmez, Y. , Rodrguez, L. F., Garay, G., & Moran, J. M. 1991, ApJ, 377, 519
- Goudis (1976) Goudis, C. 1976, Ap&SS, 40, 91
- Handa et al. (1987) Handa, T., Sofue, Y., Nakai, N., Hirabayashi, H., & Inoue, M. 1987, PASJ, 39, 709
- Hartman et al. (1999) Hartman, R. C., et al. 1999, ApJS, 123, 79
- Harvey & Forceille (1988) Harvey, P. M., & Forveille, T. 1988, A&A, 197, L19
- Lozinskaya (1974) Lozinskaya, T. A. 1974, Soviet Astronomy, 17, 603
- Lozinskaya (1992) Lozinskaya, T. A., Supernovae and Stellar Wind in the Interstellar Medium (New York: AIP)
- Mattox et al. (1996) Mattox, J. R., et al. , 1996, ApJ, 461, 396
- Mizuno & Fukui (2004) Mizuno, A., & Fukui, Y. 2004, Milky Way Surveys: The Structure and Evolution of our Galaxy, 317, 59
- Mori (2009) Mori, M., 2009, Astropart. Phys., 31, 341
- Kaspi et al. (1993) Kaspi, V. M., Lyne, A. G., Manchester, R. N., Johnston, S., D’Amico, N., & Shemar, S. L. 1993, ApJ, 409, L57
- Klaassen et al. (2006) Klaassen, P. D., Plume, R., Ouyed, R., von Benda-Beckmann, A. M., & Di Francesco, J. 2006, ApJ, 648, L1079
- Kovalenko et al. (1994) Kovalenko, A. V., Pynzar’, A. V., & Udal’Tsov, V. A. 1994, Astronomy Reports, 38, 95
- Kuchar & Clark (1997) Kuchar, T. A., & Clark, F. O. 1997, ApJ, 488, 224
- Lockman (1989) Lockman, F. J. 1989, ApJS, 71, 469
- Pittori et al. (2009) Pittori, C., et al. 2009, A&A, 506, 1563
- Porter et al. (2008) Porter, T., et al. 2008, ApJ, 682, 400
- Rando et al. (2009) Rando, R. et al., arXiv:0907.0626
- Reach et al. (2005) Reach, W. T., Rho, J., & Jarrett, T. H. 2005, ApJ, 618, 297
- Rho & Borkowski (2002) Rho, J., & Borkowski, K. J. 2002, ApJ, 575, 201
- Sollins et al. (2004) Sollins, P. K., et al. 2004, ApJ, 616, L35
- Takeuchi et al. (2010) Takeuchi, T. et al. 2010, PASJ, in press
- Velzquez et al. (2002) Velzquez, P. F., Dubner, G. M., Goss, W. M., & Green, A. J. 2002, AJ, 124, 2145
- Wootten (1981) Wootten, A. 1981, ApJ, 245, 105


| Model | aaThe ratio of electron and proton distribution functions at 1 GeV . | bb A momentum distribution of particles is assumed to be a broken power-law, where the indices and the break momentum are identical for both accelerated protons and electrons. The is a photon index below the momentum break. | ccThe is a momentum break for particle distribution. | ddThe photon index for broken power-law functions above the momentum break. | eeAverage hydrogen number density of ambient medium. | ffThe distance is assumed to be 2 kpc. The total energy is calculated for particles 100 MeV . | ffThe distance is assumed to be 2 kpc. The total energy is calculated for particles 100 MeV . | ||
| (GeV ) | (G) | (cm-3) | ( erg) | ( erg) | |||||
| Source N | |||||||||
| (a) Pion | 0.01 | 1.7 | 2 | 2.7 | 160 | 100 | 1.3 | 1.9 | |
| (b) Bremsstrahlung | 1 | 1.7 | 1 | 2.7 | 4 | 5 | 1.9 | 4.9 | |
| (c) Inverse ComptonggSeed photons for inverse Compton scattering of electrons include the CMB, two infrared ( K, eV cm-3, respectively), and two optical components ( K, eV cm-3, respectively) in the vicinity of W28, assuming a distance of 2 kpc. | 1 | 1.7 | 5 | 3.6 | 0.6 | 0.02 | 54 | 90 | |
| Source S | |||||||||
| (a) Pion | 0.01 | 1.7 | 2 | 2.4 | 1.2 | 1.5 | 6.5 | ||
| (b) Bremsstrahlung | 1 | 1.7 | 1 | 2.4 | 4 | 1.1 | 2.1 | ||
| (c) Inverse ComptonggSeed photons for inverse Compton scattering of electrons include the CMB, two infrared ( K, eV cm-3, respectively), and two optical components ( K, eV cm-3, respectively) in the vicinity of W28, assuming a distance of 2 kpc. | 1 | 1.7 | 15 | 3.2 | 2 | 0.05 | 1.7 | 2.3 |