Floquet engineering in the presence of optically excited carriers
Abstract
Floquet engineering provides an optical means to manipulate electronic bandstructures, however, carriers excited by the pump field can lead to an effective heating, and can obscure measurement of the band changes. A recent demonstration of the effects of Floquet engineering on a coherent ensemble of excitons in monolayer WS2 proved particularly sensitive to non-adiabatic effects, while still being able to accurately resolve bandstructure changes. Here, we drive an AC-Stark effect in monolayer WS2 using pulses with constant fluence but varying pulse duration (from 25-235 fs). With shorter pump pulses, the corresponding increase in peak intensity introduces additional carriers via two-photon absorption, leading to additional decoherence and peak broadening (which makes it difficult to resolve the AC-Stark shift). We use multidimensional coherent spectroscopy to create a coherent ensemble of excitons in monolayer WS2 and measure the evolution of the coherence throughout the duration of the Floquet pump pulse. Changes to the amplitude of the macroscopic coherence quantifies the additional broadening. At the same time, the evolution of the average phase allows the instantaneous changes to the bandstructure to be quantified, and is not impacted by the additional broadening. This approach to measuring the evolution of Floquet-Bloch states demonstrates a means to quantify effective heating and non-adiabaticity caused by excited carriers, while at the same time resolving the coherent evolution of the bandstructure.
I Introduction
Floquet theory [1] describes the modification of state energies, and in condensed matter the bandstructure, by a periodic perturbation. Coherent light-matter interactions, for example, lead to the formation of photon-dressed band replicas (Floquet-Bloch bands) [2, 3], and can enable transient control of bandgap energies via an AC-Stark effect [4, 5] or produce exotic non-equilibrium electronic states [6, 7]. For example, interacting Floquet-Bloch states have been demonstrated to facilitate a topological phase transition in graphene [8]. Similar effects have been predicted to arise in monolayer transition metal dichalcogenides (TMDCs) [5, 9], however, observations of a topological phase transition in these systems remain elusive. This is partially due to the challenges associated with disentangling light-induced bandstructure changes from photo-excited population effects. Furthermore, understanding the role of excited carriers and the resultant heating in the Floquet bandstructure is a key challenge to realising practical applications of Floquet engineering [10, 11, 12].
There have been numerous reports of monolayer TMDCs driven by a red-detuned Floquet pump pulse that use transient absorption measurements to show changes to the bandgap induced by the AC-Stark effect [4, 5, 14, 15, 16, 17, 18, 19, 6, 20]. Recently, the effects of Floquet engineering on a coherent ensemble of excitons was investigated in monolayer tungsten disulphide (WS2) using multidimensional coherent spectroscopy (MDCS) [13]. The coherent ensemble proved particularly sensitive to non-adiabatic effects, revealing an effective power broadening phenomenon at high pump fluences. This broadening occurred only during the pump pulse, and was attributed to interactions between the virtual excitations created by the below resonance Floquet driving field and the excitons in the coherent ensemble. Despite these interactions and resultant broadening, the heterodyne detected signal phase smoothly followed the dynamics of the pump envelope, suggesting the average signal phase measured is not impacted by losses in the macroscopic coherence of the ensemble. This picture is consistent with previous theoretical work demonstrating that Floquet effects are present despite dissipation [21], which suitably described a Floquet-topological phase transition in graphene [8]. Here we demonstrate that MDCS can reliably separate changes to the bandstructure from broadening caused by excited carriers; an important demonstration in the pursuit of realizing a Floquet-topological phase transition in monolayer TMDCs.
Here we perform MDCS measurements with an additional red-detuned pump pulse to drive an AC-Stark shift, but vary the pump duration, while keeping the total fluence the same. We find that as the duration of the pump pulses is decreased the corresponding increase in the peak intensity introduces additional carriers via two-photon absorption. In this regime, Floquet engineering effects are convolved with incoherent carrier injection which acts to obscure signatures of the bandstructure changes. In particular, these additional carriers lead to increased scattering and decoherence, which we are able to quantify. However, despite these losses in macroscopic coherence, we find that the evolution of the phase of the MDCS signal, which follows the average phase of the excitonic coherent superposition, is not impacted. From this phase evolution we are able to extract changes to the bandstructure, even in the presence of substantial photo-excited populations.
II Experimental Methods
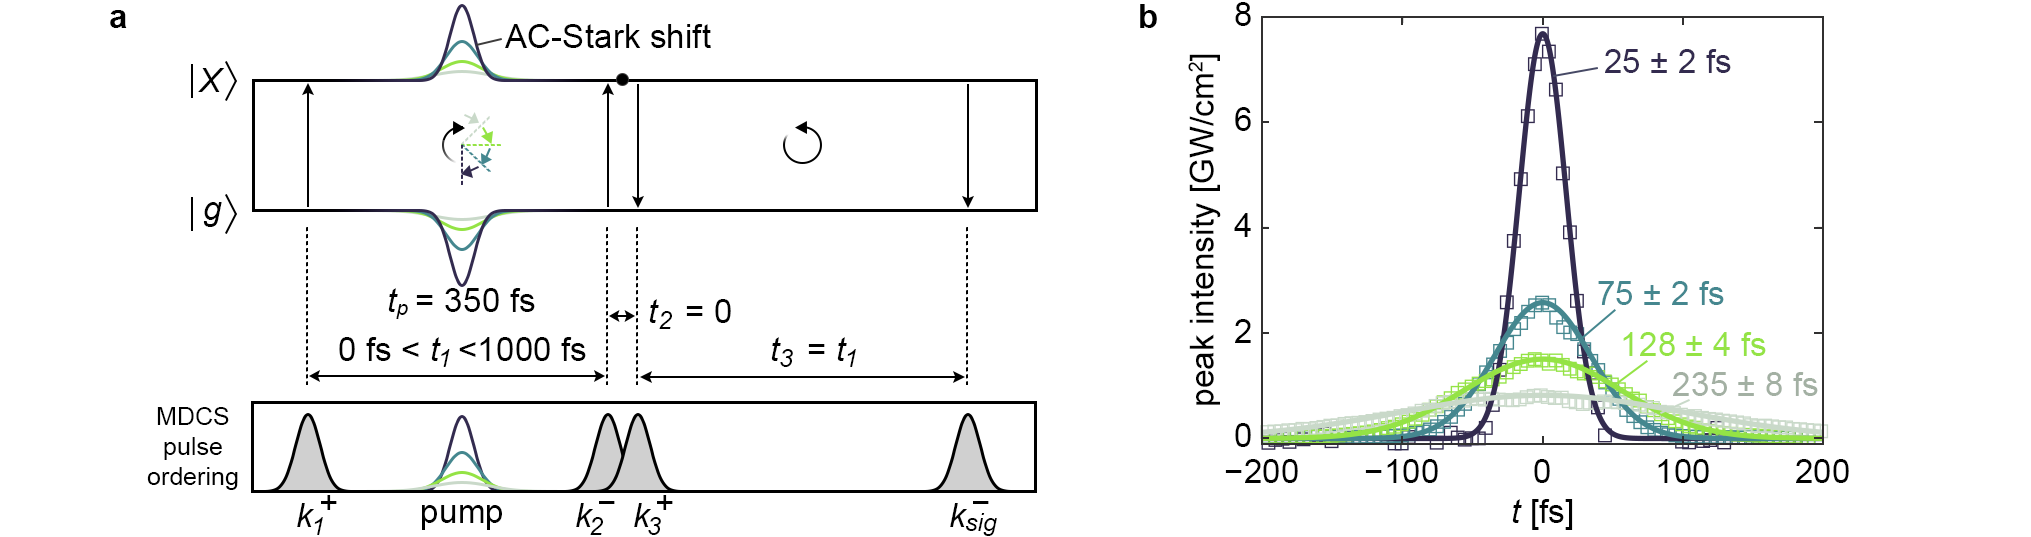
In our MDCS measurements, three light-matter interactions trigger a third-order sample response, which is measured as a function of the inter-pulse delays [22]. In one-quantum MDCS measurements (1Q-MDCS), the arrival of the first excitation pulse (with wavevector and the ‘+’ indicating circular polarization) creates a coherent superposition between the ground state and the exciton state, . This 1Q coherence evolves during the first inter-pulse delay, , where the evolution of is proportional to exp, and is measured by scanning the arrival time of . The simultaneous arrival of the final two excitation pulses, with wavevectors and and circular polarization and , respectively, generates a third-order polarization () which radiates as the four-wave mixing signal in the direction given by . The four-wave mixing signal is overlapped with a reference pulse () for heterodyne detection, and spectrally resolved to give the amplitude and phase of the signal as a function of the emission energy, . A schematic representation of the MDCS pulse ordering in our measurements is depicted in Fig. 1(a). The MDCS excitation pulses were 30 1 fs in duration, with a fluence of 1.2 0.2 J/cm2, and focused to a 36 5 m spot at the sample surface (see Supplementary Material for the spectrum of the MDCS pulses).
To measure an AC-Stark effect in monolayer WS2, we employed the same technique outlined in Ref. [13]. The polarized pump was red-detuned by 260 meV from the low temperature A-exciton energy of 2.087 eV, and set to arrive 350 fs before and . To control the pump duration, we utilized a pulse shaper based around a spatial-light modulator [23], which enabled control of the spectral phase and amplitude of our pulses. The pulse shaper was first used to ensure a flat spectral phase across the pump pulse using the multiphoton intra-pulse interference phase scan technique [24]. This yielded a 25 2 fs duration for the full spectral bandwidth of the pump pulse output from a non-colinear optical parametric amplifier (see Supplementary Material for pump spectrum). To increase the pulse duration, the spectral bandwidth was reduced by the pulse shaper, while maintaining a flat spectral phase. This has the consequence of reducing the pump fluence, so to ensure the total integrated energy of the pump pulse was constant, a variable neutral density filter was used to control the intensity. The measurements for all pulse durations were conducted with pump fluence of 205 10 J/cm2 with a pump spot size of 67 5 m at the sample surface. Figure 1(b) shows the temporal profile for each of the pump pulses utilized in this work, measured by deconvolving the cross-correlation of the pump and the excitation beam.
III Results and Discussion
III.1 Quantifying loss of macroscopic coherence due to two-photon absorption
Figure 2(a) shows the 1Q signal amplitude as a function of and , in the absence of the pump. Two peaks at and eV are evident and attributed to the A-exciton and trion peak, respectively [13, 25]. The exciton and trion energies are blue-shifted by 15 meV from the equivalent peaks in Ref. [13], which arises from the difference in samples. In Ref. [13], the WS2 monolayer was fully encapsulated in hexagonal-Boron Nitride (hBN), while the sample used in this work has only a bottom hBN layer (see Supplementary Material for sample characterization). The unpumped signal amplitude decays as a function of due to decoherence of , with a decoherence time of fs, consistent with previous MDCS measurements of excitons in monolayer TMDCs [13, 25, 26, 27].
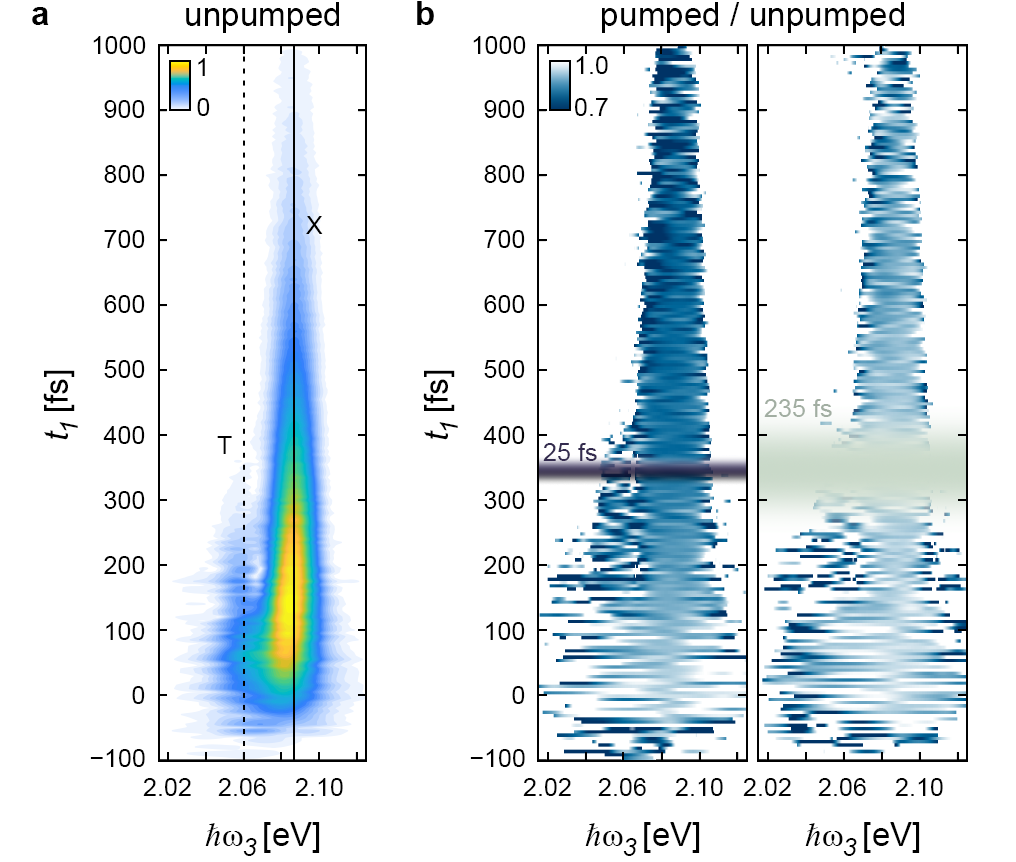
Figure 2(b) shows the ratio of the signal amplitude with the pump on and off, for a 25 2 fs and a 235 8 fs pump pulse arriving 350 fs before and (shaded regions in Fig. 2(b)). These plots show a decrease in the signal amplitude with the introduction of the polarized pump, due to additional decoherence of . The decrease in amplitude and loss in macroscopic coherence becomes more significant for the shorter pump pulse with higher peak intensity.
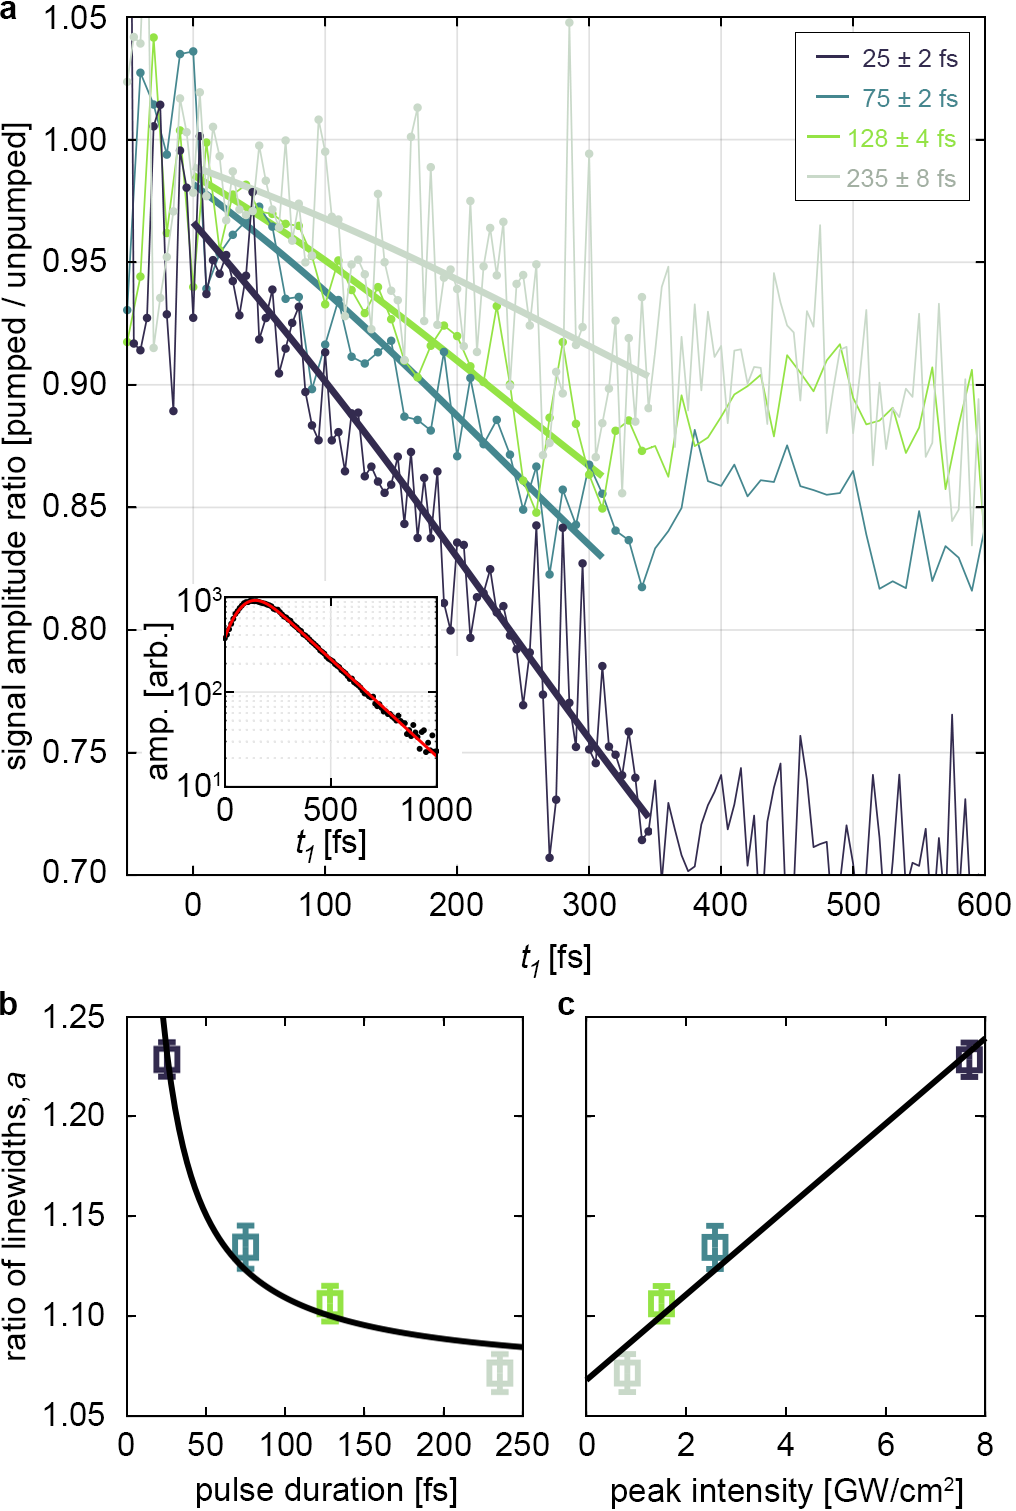
To more clearly see the dynamics of the decay and additional decoherence induced by the pump pulse, we integrate the ratio of the pumped and unpumped signal amplitudes around the exciton emission energy ( eV), as shown in Fig. 3(a). A ratio of 1 indicates the amplitude of the pumped and unpumped signal are the same, whilst ratios below 1 indicate the pump is inducing additional decoherence and decay of the signal amplitude. For fs, the pump arrives before and during this period the ratio of signal amplitudes is decreasing. For fs the ratio remains roughly constant, indicating no further additional decoherence is present. This behaviour is consistent with extra carriers being created by the pump pulse: For fs the coherence evolves in the presence of the extra carriers created by the pump, leading to additional scattering and decoherence. For fs, arrives before the pump and the coherence is not affected by the extra carriers until the pump arrives, 350 fs before and . In this case, the period when there is additional scattering and decoherence is fixed, and so the ratio of pumped to unpumped signal amplitude does not change.
To quantify the additional coherence we need to take into account that the signal decay is not exponential over this time period, due to a combination of photon echo and free-induction decay. In this case the signal amplitude integrated as a function of is given by [28, 29]:
| (1) |
where is the unpumped homogeneous linewidth, is the inhomogeneous linewidth, and erfc is the complementary error function. Inset into Fig. 3(a) is the unpumped data (black points), which was fit by Eq. 1 (red line) to determine the values for meV and meV.
To quantify the additional decoherence when the pump was introduced, we assumed that the decoherence rate for fs was increased and constant for a given pulse duration. The ratio of pumped and unpumped data is then given by:
| (2) |
where is the ratio of the homogeneous linewidths for the pump on and off. With being the only fit parameter, Eq. 2 fit very well to the data shown in Fig. 3(a) to determine the increase in homogeneous linewidth, or equivalently, decoherence rate. The values for are plotted as a function of pulse duration and peak intensity in Fig. 3(b) and (c), respectively. Additional decoherence due to scattering from photoexcited carriers would be expected to vary linearly with the density of carriers and thus linearly with the total fluence [22]. With constant fluence, the linear increase is indicative of a process that varies quadratically with intensity, such as two-photon absorption. Briefly, this can be understood as follows: The total number of two-photon events is proportional to , where is the intensity profile of the pump pulse given by , with the pulse duration given by the full width at half maximum, , and the peak intensity by . Rearranging this integral gives . With constant pump fluence (i.e. is constant), the number of two-photon events is then linearly proportional to the peak intensity (or the inverse of the pulse duration).
The additional decoherence when the pump is on is therefore attributed to scattering with carriers excited by two-photon absorption. With the pump redshifted from the exciton transition by 260 meV, and centered at 1.82 eV, the precise identification of states available beyond 3.6 eV is challenging as it includes a multitude of high energy conduction bands in monolayer WS2, and transitions beyond the points in the Brillouin zone. As a rigorous treatment is outside the scope of this work, we consider the two-photon absorption of the red-detuned pump capable of accessing continuum states which enables the creation of free carriers.
The two-photon absorption and accelerated decoherence for observed here was not evident in the previous measurements of Ref. [13]. In comparison, the highest pump peak intensity used here was GW/cm2 for the 25 fs pump pulse duration, which is similar to the highest peak intensity reached in Ref. [13], GW/cm2, where two-photon absorption was not evident. The reason is not entirely understood, however, it is possible that the differences come from the different encapsulation environments of the samples used. The impact of top-layer hBN encapsulation on two-photon absorption in monolayer TMDCs has not been studied previously. Additionally, different degrees of aging and defects [30, 31, 32] may influence two-photon processes. These questions are left for future work.
III.2 Identifying bandstructure changes using the signal phase
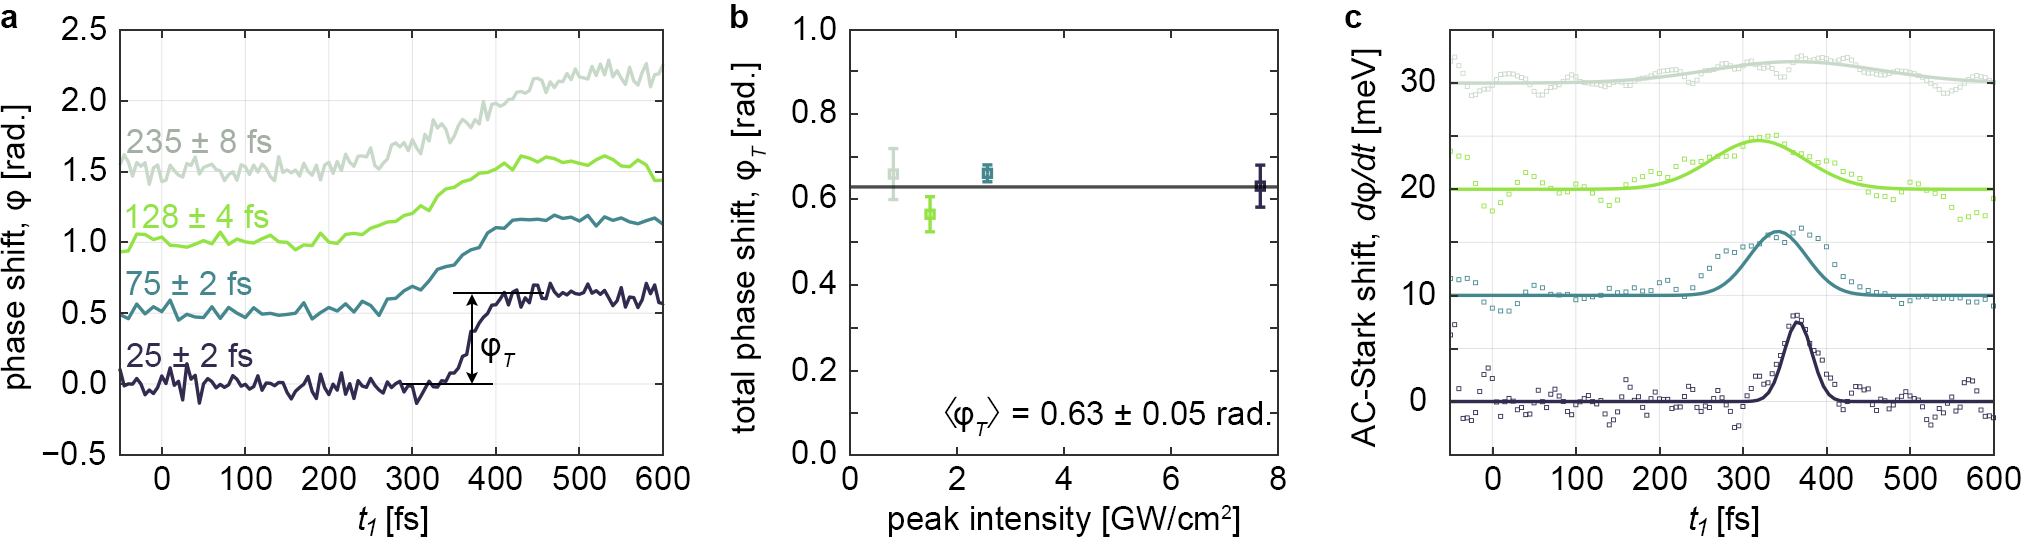
Figure 4(a) shows the evolution of the difference (pumped minus unpumped) of the measured signal phase as a function of , averaged over the exciton energy ( eV). For the first 200 fs there is no phase shift, until begins to overlap with the pump pulse. The pump, through the AC-Stark effect, blue-shifts the exciton, which causes the phase of the coherence (and hence the signal) to evolve faster. The rate at which the phase shift evolves is determined by the magnitude of the blue shift, which is linearly proportional to the instantaneous pump intensity [13]. Taking the derivative of the phase shift with respect to gives the instantaneous blue-shift, as shown in Fig. 4(c). A Gaussian fit of these data show that the measured blue-shift closely follows the cross-correlation of the pulse and the pump pulse, even for the shortest pump pulse. From these plots we obtain a peak AC-Stark shift ranging between 2.0 and 7.5 meV for the longest and shortest pump pulse durations, respectively.
While the peak AC-Stark shift is controlled by the peak intensity, the total accumulated phase shift is determined by integrating the blue-shift over the duration of the pump pulse. It is apparent then, that the total accumulated phase should be proportional to the pump fluence [5, 4, 14, 15, 18, 19]. In the present measurements, where the fluence was kept constant, the accumulated phase shift should therefore be constant regardless of the pulse duration. By comparing the phase shift before and after the pump pulse ( in Fig. 4(a)), we obtain an averaged total phase shift of rad. which remained constant as the pulse duration (peak intensity) was changed, as shown in Fig. 4(b). The magnitude of this shift is consistent with the fluence dependent phase shifts acquired in Ref. [13].
This phase response is representative of the idealised Floquet formalism, and is resolved despite the magnitude of the macroscopic coherence being reduced by more than 30% as a result of carrier induced scattering. In fact, from the phase dynamics observed here, there is no evidence of the two-photon absorption, nor any non-adiabaticity or inconsistency with Floquet theory. Additionally, our phase response is consistent with the phase response in Ref. [13], where no two-photon absorption was evident.
IV Conclusions
The results presented here demonstrate the ability of MDCS to quantify changes to the bandstructure of monolayer WS2 induced by Floquet engineering, even in the presence of significant broadening. This was achieved by following the evolution of the average phase of the macroscopic coherence excited by the MDCS pulses. Furthermore, we were able to quantify the decoherence caused by carriers excited by two-photon absorption of the Floquet pump pulses, through the evolution of the signal amplitude. Being able to follow the evolution of the bandstructure, while at the same time quantifying the effect of excess carriers is an important step towards understanding the role of excited carriers in heating and driving nonadiabatic effects in Floquet engineering of solid state systems. Previous work has shown that scattering can prevent the formation of Floquet-Bloch bands when the scattering time is faster than the period of the driving field [12]. Even with the excess carriers, we are far from this regime, with driving period of 2.3 fs and scattering time in the hundreds of fs. Further, based on measurements of the exciton-exciton interaction strength in monolayer TMDCs [26], we expect that even with carrier densities beyond cm-2 the scattering time will remain longer than the drive period, which enhances the prospect that these excess carriers can be used to help shape the new potential energy environment and resultant band structures [10, 11]. Finally, these measurements indicate that is should be possible to measure the effects of a Floquet-topological phase transition in monolayer TMDCs, even though a high density of carriers, excited by the above bandgap drive, are inevitable.
V Acknowledgements
This work was funded by the Australian Research Council Centre of Excellence in Future Low-Energy Electronics Technologies (CE170100039). T.H.Y.V., M.S.F., and M.T.E. acknowledge funding support from DP200101345. This work was performed in part at the Melbourne Centre for Nanofabrication (MCN), the Victorian Node of the Australian National Fabrication Facility (ANFF). K.W. and T.T. acknowledge support from JSPS KAKENHI (Grant Numbers 21H05233 and 23H02052) and World Premier International Research Center Initiative (WPI), MEXT, Japan.
References
- Shirley [1965] J. H. Shirley, Solution of the Schrödinger equation with a Hamiltonian periodic in time, Phys. Rev. 138, B979 (1965).
- Wang et al. [2013] Y. Wang, H. Steinberg, P. Jarillo-Herrero, and N. Gedik, Observation of Floquet-Bloch states on the surface of a topological insulator, Science 342, 453 (2013).
- Zhou et al. [2023] S. Zhou, C. Bao, B. Fan, F. Wang, H. Zhong, H. Zhang, P. Tang, W. Duan, and S. Zhou, Floquet engineering of black phosphorus upon below-gap pumping, Phys. Rev. Lett. 131, 116401 (2023).
- Kim et al. [2014] J. Kim, X. Hong, C. Jin, S.-F. Shi, C.-Y. S. Chang, M.-H. Chiu, L.-J. Li, and F. Wang, Ultrafast generation of pseudo-magnetic field for valley excitons in WSe2 monolayers, Science 346, 1205 (2014).
- Sie et al. [2015] E. J. Sie, J. W. McIver, Y.-H. Lee, L. Fu, J. Kong, and N. Gedik, Valley-selective optical Stark effect in monolayer WS2, Nat. Mater. 14, 290 (2015).
- Kobayashi et al. [2023] Y. Kobayashi, C. Heide, A. C. Johnson, V. Tiwari, F. Liu, D. A. Reis, T. F. Heinz, and S. Ghimire, Floquet engineering of strongly driven excitons in monolayer tungsten disulfide, Nat. Phys. 19, 171 (2023).
- Lindner et al. [2011] N. H. Lindner, G. Refael, and G. Victor, Floquet topological insulator in semiconductor quantum wells, Nat. Phys. 7, 490 (2011).
- McIver et al. [2020] J. W. McIver, B. Schulte, F.-U. Stein, T. Matsuyama, G. Jotzu, G. Meier, and A. Cavalleri, Light-induced anomalous Hall effect in graphene, Nat. Phys. 16, 38 (2020).
- Claassen et al. [2016] M. Claassen, C. Jia, B. Moritz, and T. P. Devereaux, All-optical materials design of chiral edge modes in transition-metal dichalcogenides, Nat. Commun. 7, 1 (2016).
- Seetharam et al. [2015] K. I. Seetharam, C.-E. Bardyn, N. H. Lindner, M. S. Rudner, and G. Refael, Controlled population of Floquet-Bloch states via coupling to Bose and Fermi baths, Phys. Rev. X 5, 041050 (2015).
- Rudner and Lindner [2020] M. S. Rudner and N. H. Lindner, Band structure engineering and non-equilibrium dynamics in Floquet topological insulators, Nat. Rev. Phys. 2, 229 (2020).
- Aeschlimann et al. [2021] S. Aeschlimann, S. A. Sato, R. Krause, M. Chávez-Cervantes, U. De Giovannini, H. Hübener, S. Forti, C. Coletti, K. Hanff, K. Rossnagel, et al., Survival of Floquet-Bloch states in the presence of scattering, Nano Lett. 21, 5028 (2021).
- Conway et al. [2023] M. A. Conway, S. K. Earl, J. B. Muir, T.-H.-Y. Vu, J. O. Tollerud, K. Watanabe, T. Taniguchi, M. S. Fuhrer, M. T. Edmonds, and J. A. Davis, Effects of Floquet engineering on the coherent exciton dynamics in monolayer WS2, ACS Nano 17, 14545 (2023).
- Sie et al. [2017] E. J. Sie, C. H. Lui, Y.-H. Lee, L. Fu, J. Kong, and N. Gedik, Large, valley-exclusive Bloch-Siegert shift in monolayer WS2, Science 355, 1066 (2017).
- Ye et al. [2017] Z. Ye, D. Sun, and T. F. Heinz, Optical manipulation of valley pseudospin, Nat. Phys. 13, 26 (2017).
- LaMountain et al. [2018] T. LaMountain, H. Bergeron, I. Balla, T. K. Stanev, M. C. Hersam, and N. P. Stern, Valley-selective optical Stark effect probed by Kerr rotation, Phys. Rev. B 97, 045307 (2018).
- Yong et al. [2018] C.-K. Yong, J. Horng, Y. Shen, H. Cai, A. Wang, C.-S. Yang, C.-K. Lin, S. Zhao, K. Watanabe, T. Taniguchi, et al., Biexcitonic optical Stark effects in monolayer molybdenum diselenide, Nat. Phys. 14, 1092 (2018).
- Cunningham et al. [2019] P. D. Cunningham, A. T. Hanbicki, T. L. Reinecke, K. M. McCreary, and B. T. Jonker, Resonant optical Stark effect in monolayer WS2, Nat. Commun. 10, 1 (2019).
- Morrow et al. [2020] D. J. Morrow, D. D. Kohler, Y. Zhao, J. M. Scheeler, S. Jin, and J. C. Wright, Quantum interference between the optical Stark effect and resonant harmonic generation in WS2, Phys. Rev. B 102, 161401 (2020).
- Earl et al. [2021] S. K. Earl, M. A. Conway, J. B. Muir, M. Wurdack, E. A. Ostrovskaya, J. O. Tollerud, and J. A. Davis, Coherent dynamics of Floquet-Bloch states in monolayerWS2 reveals fast adiabatic switching, Phys. Rev. B 104, L060303 (2021).
- Sato et al. [2019] S. Sato, J. McIver, M. Nuske, P. Tang, G. Jotzu, B. Schulte, H. Hübener, U. De Giovannini, L. Mathey, M. Sentef, et al., Microscopic theory for the light-induced anomalous Hall effect in graphene, Phys. Rev. B 99, 214302 (2019).
- Tollerud and Davis [2017] J. O. Tollerud and J. A. Davis, Coherent multi-dimensional spectroscopy: Experimental considerations, direct comparisons and new capabilities, Prog. Quantum Electron. 55, 1 (2017).
- Vaughan et al. [2005] J. C. Vaughan, T. Hornung, T. Feurer, and K. A. Nelson, Diffraction-based femtosecond pulse shaping with a two-dimensional spatial light modulator, Opt. Lett. 30, 323 (2005).
- Xu et al. [2006] B. Xu, J. M. Gunn, J. M. D. Cruz, V. V. Lozovoy, and M. Dantus, Quantitative investigation of the multiphoton intrapulse interference phase scan method for simultaneous phase measurement and compensation of femtosecond laser pulses, J. Opt. Soc. Am. B 23, 750 (2006).
- Muir et al. [2022] J. B. Muir, J. Levinsen, S. K. Earl, M. A. Conway, J. H. Cole, M. Wurdack, R. Mishra, J. David, E. Estrecho, Y. Lu, et al., Interactions between Fermi polarons in monolayer WS2, Nat. Commun. 13, 1 (2022).
- Moody et al. [2015] G. Moody, C. Kavir Dass, K. Hao, C.-H. Chen, L.-J. Li, A. Singh, K. Tran, G. Clark, X. Xu, G. Berghäuser, et al., Intrinsic homogeneous linewidth and broadening mechanisms of excitons in monolayer transition metal dichalcogenides, Nat. Commun. 6, 1 (2015).
- Hao et al. [2016] K. Hao, L. Xu, P. Nagler, A. Singh, K. Tran, C. K. Dass, C. Schüller, T. Korn, X. Li, and G. Moody, Coherent and incoherent coupling dynamics between neutral and charged excitons in monolayer MoSe2, Nano Lett. 16, 5109 (2016).
- Siemens et al. [2010] M. E. Siemens, G. Moody, H. Li, A. D. Bristow, and S. T. Cundiff, Resonance lineshapes in two-dimensional Fourier transform spectroscopy, Opt. Express 18, 17699 (2010).
- Bell et al. [2015] J. D. Bell, R. Conrad, and M. E. Siemens, Analytical calculation of two-dimensional spectra, Opt. Lett. 40, 1157 (2015).
- Gao et al. [2016] J. Gao, B. Li, J. Tan, P. Chow, T.-M. Lu, and N. Koratkar, Aging of transition metal dichalcogenide monolayers, ACS nano 10, 2628 (2016).
- Kotsakidis et al. [2019] J. C. Kotsakidis, Q. Zhang, A. L. Vazquez de Parga, M. Currie, K. Helmerson, D. K. Gaskill, and M. S. Fuhrer, Oxidation of monolayer WS2 in ambient is a photoinduced process, Nano Lett. 19, 5205 (2019).
- Kolesnichenko et al. [2020] P. V. Kolesnichenko, Q. Zhang, T. Yun, C. Zheng, M. S. Fuhrer, and J. A. Davis, Disentangling the effects of doping, strain and disorder in monolayer WS2 by optical spectroscopy, 2D Mater. 7, 025008 (2020).