Flow rate of transport network controls uniform metabolite supply to tissue
Abstract
Life and functioning of higher organisms depends on the continuous supply of metabolites to tissues and organs. What are the requirements on the transport network pervading a tissue to provide a uniform supply of nutrients, minerals, or hormones? To theoretically answer this question, we present an analytical scaling argument and numerical simulations on how flow dynamics and network architecture control active spread and uniform supply of metabolites by studying the example of xylem vessels in plants. We identify the fluid inflow rate as the key factor for uniform supply. While at low inflow rates metabolites are already exhausted close to flow inlets, too high inflow flushes metabolites through the network and deprives tissue close to inlets of supply. In between these two regimes, there exists an optimal inflow rate that yields a uniform supply of metabolites. We determine this optimal inflow analytically in quantitative agreement with numerical results. Optimizing network architecture by reducing the supply variance over all network tubes, we identify patterns of tube dilation or contraction that compensate sub-optimal supply for the case of too low or too high inflow rate.
Transport processes organized in networks structures are ubiquitous in our life, from road traffic sen_small-world_2003 and power networks rohden_self-organized_2012 to river estuaries rodriguez-iturbe_fractal_1997 and vascular systems of extended organisms netti_macro-_1997 ; kapellos_chapter_2015 . Especially fluid flow driven transport through networks is underlying many technological applications like fuel cells MA2005418 , micro-fluidic devices santini_controlled-release_1999 or filtration systems tufenkji_correlation_2004 and their medical applications levey_new_2009 . Most significantly, all higher forms of life rely on a fluid flow based transport networks to provide their tissue with metabolites like nutrients or minerals, as there are the circulatory system of animals isogai_vascular_2001 , the plant xylem vascular system PlantsinAction:chap3 , and the hyphae networks of fungi boddy_saprotrophic_2009 ; tero_rules_2010 ; heaton_advection_2012 . Within a tissue, each cell needs to be provided with the same minimal amount of metabolites. How does a transport network need to be set up to make sure that metabolites arrive uniformly at each cell within a tissue? Here, we theoretically investigate the requirements on flow and network architecture for uniform supply.
On the level of inter-vascular tissue, models for minimal supply due to metabolites uptake and metabolite diffusion within the tissue date back one hundred years to Krogh’s model krogh_number_1919 . Yet, Krogh assumes that metabolites are provided by the vasculature at a constant rate at all vessel walls Rubenstein:2012 . This strong simplification neglects that vascular network architecture and resulting asymmetries in flow based transport give rise to large variations in metabolite availability within the network. On the level of the vascular network itself, studies mapping out variations in metabolite availability are scarce fang_oxygen_2008 ; schneider_tissue_2012 ; marbach_pruning_2016 . Insight, what controls uniform metabolite supply at the vasculature level is missing. Instead research focused on network flow and not transport properties identifying scaling relationships regarding the network’s fluid dynamics sack_leaf_2013 ; sack_hydraulic_2004 ; coomes_scaling_2008 ; price_scaling_2012 ; jensen_physical_2013 ; labarbera_principles_1990 ; west_general_1999 ; murray_physiological_1926 . Another branch of theoretical models for vascular systems investigated optimal network topologies with minimal transport cost in the form of dissipation durand_architecture_2006 ; west_general_1999 ; bohn_structure_2007 . Including robustness to damage or flow fluctuations katifori_damage_2010 ; corson_fluctuations_2010 or vessel growth ronellenfitsch_global_2016 in these studies resulted in network topologies in closer resemblance to observable vascular networks. However, despite the efforts to find minimal dissipation networks to understand transport networks in nature, it is not obvious that the efficiency of a transport network is what organisms optimize for. Instead measurements on Zebrafish vasculature suggest that biological transport networks care for uniform partitioning of blood cells and thus uniform oxygen supply chang_optimal_2015 and are not optimized for minimal dissipation. The vasculature architecture might, as established for tissue, be build for the uniform supply of metabolites like oxygen, nutrient compounds or biochemical signals. A further indication is that networks adapt to reinforce supply to tissues and organs Chan2002257 .
The spread of metabolites through fluid flow is well-described in hydrodynamics. Here, the transport of particles in a single long slender tube is efficiently captured by Taylor Dispersion taylor_dispersion_1953 ; Aris:1956 ; bruus_theoretical_2009 . The important contributions of particle transport are advection by fluid flow and molecular diffusion, resulting in a decoupling of flow dynamics and particle concentration dynamics. Transport of particles that in addition get absorbed along the tube wall is well-studied in the setting of heat conduction e._m._lungu_effect_1982 ; graetz_ueber_1882 ; HeatAbsoChem ; hemida_theoretical_2002 . Yet, the concentration patterns of particles within a transport network is fundamentally more complicated due to the particle concentration being coupled in a global manner by the network spanning flow. Thus, further theoretical development is required as presented here.
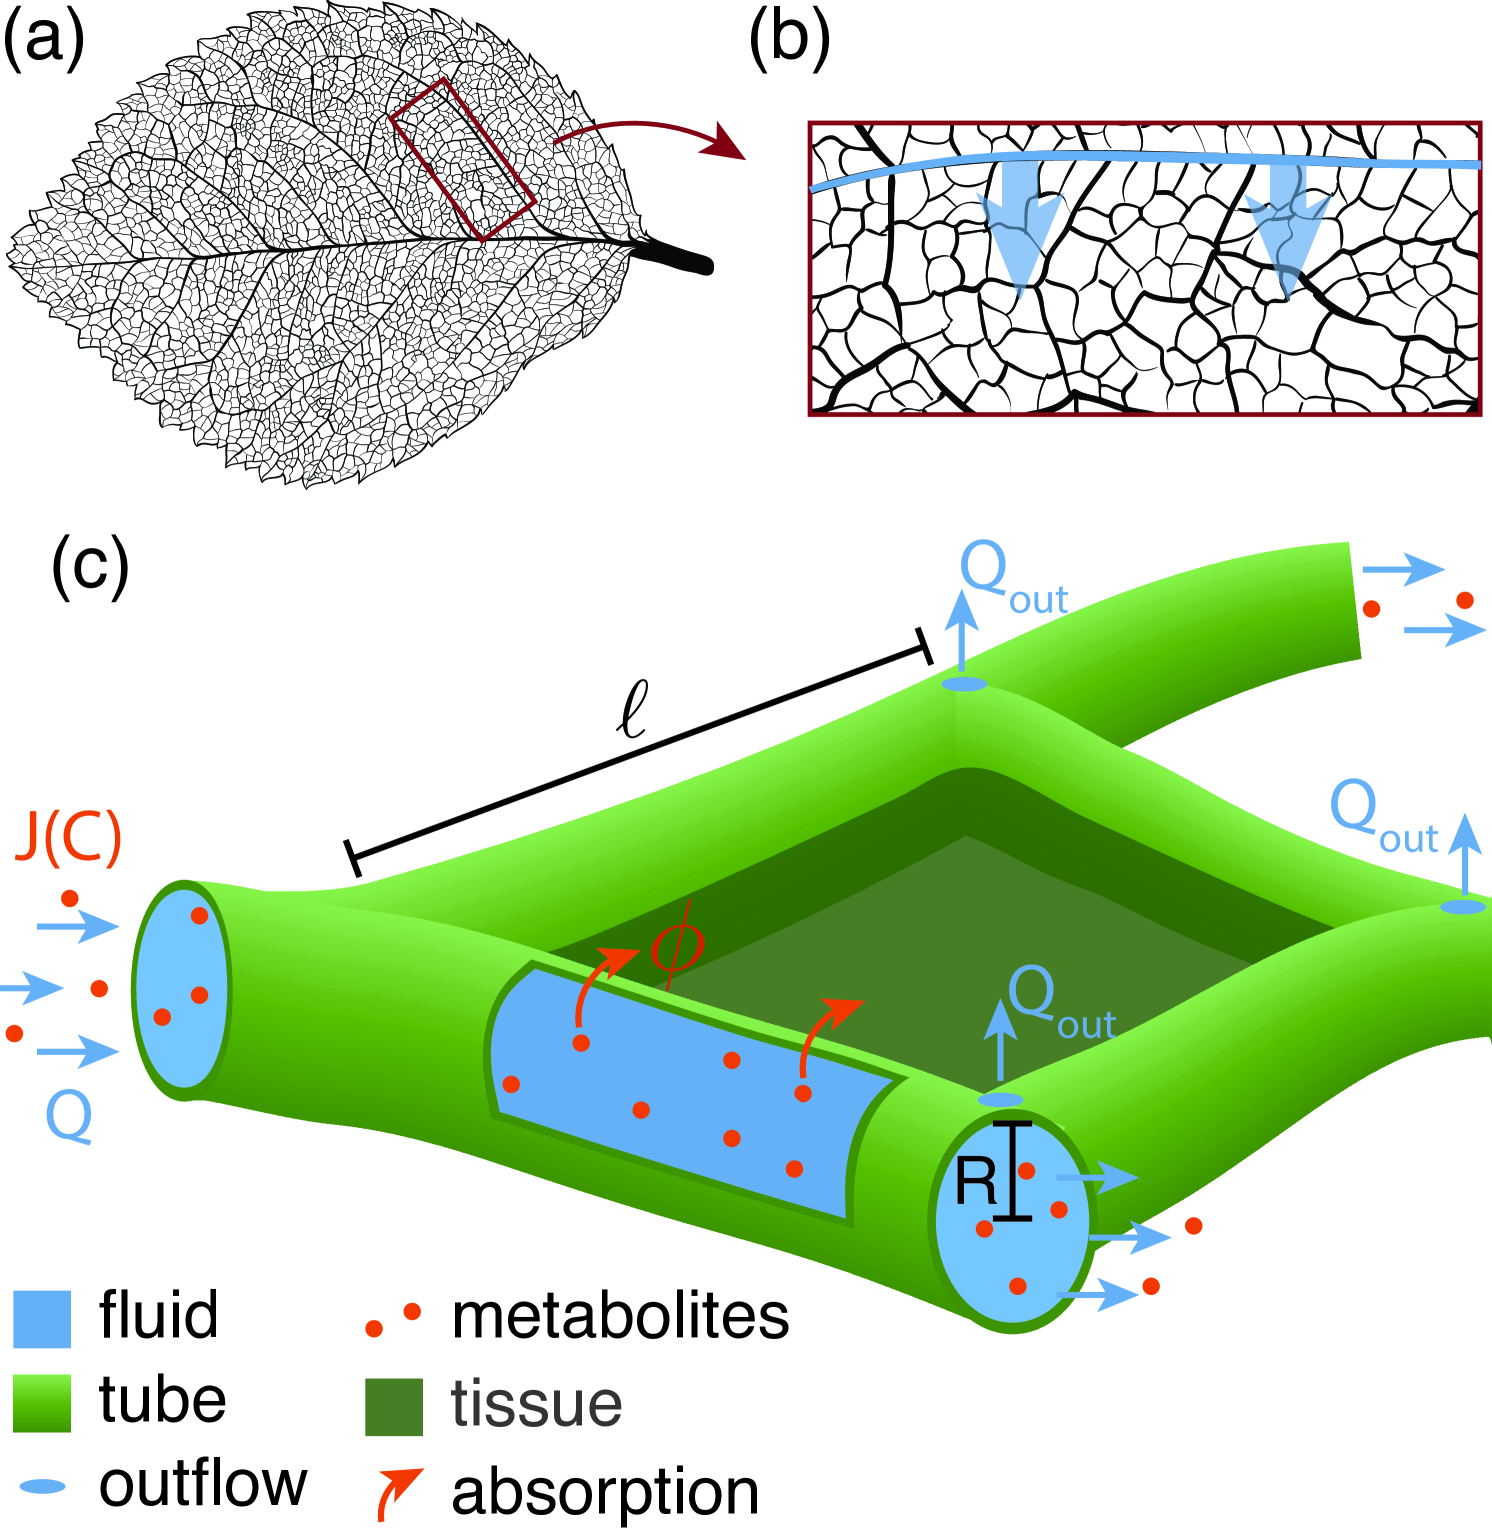
While a hydrodynamic perspective provides a general picture with a minimum of assumptions and hence a broad applicability, the specifics of metabolite flow differs between biological systems. In the light of network optimization approaches katifori_damage_2010 ; corson_fluctuations_2010 ; ronellenfitsch_global_2016 , we apply the general hydrodynamic perspective to the tissue specifics of plant leaf xylem vessels in dicotyledons. In plants, the transport of water and metabolites, especially soil bound nutrients and minerals like nitrate or potassium PlantsinAction:chap3 , from the plant roots to the leaf tissue is routed in highly pitted and rigidly lignified xylem veins zwieniecki_hydraulic_2002 . Xylem veins should not to be confused with the oppositely routed phloem veins predominantly transporting sugar away from the leaf tissue roth-nebelsick_evolution_2001 ; jensen_osmotically_2009 . We consider the spread of the scarce metabolites in xylem fluid as limiting for maintaining the function of leaf cells and thus focus on the xylem network neglecting the detailed spreading dynamics of metabolites within the tissue itself. Metabolites enter leaf cells dominantly at the level of inter-webbed higher order veins, while primary and secondary order veins distribute metabolites over the large scale of the leaf holbrook_vascular_2011 . Here we focus on a leaf tissue excerpt pervaded by higher order veins. A secondary vein is the source of metabolite enriched fluid flowing through higher order vessels pervading the leaf tissue, see Fig. 1 (a), (b). Fluid flow is regulated through evaporation control across the entire leaf blade fricker_stomata_2012 . Evaporation is commonly modeled by a constant outflow of fluid at every node within the vascular network katifori_damage_2010 ; corson_fluctuations_2010 , for details see supplementary material S1. Metabolites are absorbed continuously along the walls of the tubular vessels into the tissue supplying the cells there.
In this paper, we develop a theoretical framework to optimize flow dynamics and architecture of transport networks for uniform supply of metabolites to surrounding tissue focusing exemplarily on plant xylem networks. We derive analytical expressions for the absorption of metabolites within a single tube and use these results to simulate supply patterns in the inter-webbed transport networks. We find that the inflow rate is the dominant factor controlling supply patterns for all network architectures. For low inflow rate, average fluid velocities are small and metabolites are mainly absorbed next to the flow inlets. For high inflow rates, average velocities are fast and metabolites are mainly absorbed at the far end opposing the inlets. In between, we identify an optimal inflow rate, that yields uniform absorption and thus supply levels. We present a one-dimensional network analogue that allows us to derive an analytical expression for the optimal flow rate as a function of system parameters such as network size and average tube radius in agreement with simulations. Further optimizing the network architecture for low, optimal, or high inflow rate, we find that localized adaptation in tube radius is capable to compensate for the non-uniform supply patterns at low and high inflow rate, yet cannot outcompete the optimal inflow rate.
Results
Metabolite absorption across a fluid filled tube
| tube radius | |
| tube length | |
| network length | |
| number of tubes in the network | |
| fluid flow rate | |
| fluid flow velocity | |
| metabolite concentration | |
| metabolite flux | |
| molecular diffusivity of metabolite | |
| absorption rate of metabolite | |
| absorption parameter; | |
| overall absorption along a tube | |
| overall absorption capacity along a tube | |
| Pe | Péclet number, ratio of diffusive and advective time scale |
| ratio of the time scales for absorption | |
| concentration decay constant |
Consider a cylindrical tube filled with fluid flowing at flow velocity along the tube. Metabolites are advected with the flow and in addition disperse due to molecular diffusion with diffusivity . Considering the small scales of xylem vessels and xylem flow, we are in the regime of low Reynolds number, where flow is best described by laminar Poiseuille flow. Thus, we describe the flow along the longitudinal axis varying in radial direction in the circular tube with a radius and length as, . Here, denotes the cross-sectionally averaged longitudinal velocity. The spread of metabolites of concentration is thus fully described by
| (1) |
Metabolites are absorbed into the surrounding tissue along the tube wall, given by the boundary condition
| (2) |
analogous to heat absorption or surface reactions. Here, the parameter denotes the metabolite absorption rate at the tube wall. Dividing by the molecular diffusivity we define the absorption parameter , where we consider as a constant tissue property. According to e._m._lungu_effect_1982 the advection-diffusion equation, Eq. (1), can be re-formulated employing both the boundary condition Eq. (2) and the Poiseuille profile as a single absorption-advection-diffusion equation in cylindrical coordinates.
In analogy to the derivation of Taylor Dispersion by G.I. Taylor taylor_dispersion_1953 , a simpler, though approximated, expression is possible where the concentration dynamics only depend on the longitudinal coordinate . To this end the metabolite concentration is separated into the sum of a cross-sectional average concentration and the radial variation , . The multidimensional diffusion-advection for can be simplified to an equation for the cross-sectionally averaged concentration if the cross-sectional variations of the concentration are much smaller than the averaged concentration itself taylor_dispersion_1953 ; Cha_inprep , resulting in
| (3) |
This approach employs three approximations. First, the time-scale of diffusion across the tube’s cross-section has to be much smaller than the time-scale of advection, . This sets an upper bond for the later choice of the fluid inflow rate. The second assumption states that the cross-sectional variations of the concentration have to be small . Since a high absorption parameter implies a large concentration gradient across the cross-section, the second assumption implies . Third, the variation of has to be much greater in radial direction than in flow direction . The last assumption implies the tube radius to be smaller than its length . This is fulfilled by long slender tubes.
Employing these assumptions, the cross-sectional average metabolite concentration along a tube in steady state is given by an exponential decay from initial concentration ,
| (4) | ||||
Here, we introduced two dimensionless variables Pe and . is the well known Peclet number describing the relation between diffusive and advective time scale. is the ratio of the time scale for absorption, given by the product of dimensionless absorption parameter and time to diffuse across the tube’s cross-section, and the time to be advected out of the tube, resulting in .
Considering a constant influx by advection and diffusion of metabolites at the tube’s start, we find that the initial concentration is given by
| (5) |
The overall absorption along a tube is given by the integrated flux of metabolites across the tube wall , , where is integrating over the length of the tube. As in the derivation of the effective diffusion-advection-absorption equation Eq. (3), we use to arrive at
| (6) |
where is an abbreviation . We identify two factors that control the absorption in a tube. The first is the total influx of metabolites over the cross-sectional area of the tube . The total influx of metabolites is the upper limit for absorption in the tube. The second factor is the tube’s capacity to absorb metabolites as with . This absorption capacity is independent of the concentration of metabolites and only depends on the parameters of the tube and the flow velocity within the tube.
For the derivation of the optimal inflow rate, it is essential to approximate the absorption capacity as resulting from Eq. (6) above. We initially approximate the inverse of the absorption capacity by taking a finite and using to find . Resubstituting the system’s parameters for we find for the absorption capacity of a tube
| (7) |
Note the simple dependence of the absorption capacity on the cross-sectionally average flow velocity in the tube. The approximation of the absorption capacity has been verified numerically to hold over the parameter space considered here, see supplemental information S4. Note, that this simplified expression is only used for the analytical derivation of the optimal inflow rate. For simulations the full expression Eq. 6 is used. From now on, we drop the brackets and only refer to cross-sectional averaged observables.
Absorption patterns in fluid flow driven transport networks
In a transport network, individual tubes are connected at nodes. Here, we aim to model the geometry of higher order xylem veins branching from a second order vein in dicotyledons, as shown in Fig. 1 b). We choose a planar transport network representing a rectangular excerpt of the leaf tissue. For the tissue excerpt we choose a general vascularisation using a slightly randomized tessellation of space, where the network is build with small triangles, known to bear least artifacts katifori_damage_2010 . A small Gaussian noise of a twentieth tube length is added to the positions of the tessellation nodes to avoid pattern artifacts arising from the underlying topology otherwise, see supplementary material S2. The tube length varies accordingly in a normal distribution around the mean tube length . In agreement with observations of diminishing hierarchy in the higher interwebbed xylem vessel radii ronellenfitsch_topological_2015 ; sack_leaf_2013 , we set the same radius for all tubes. Fluid and metabolites are flowing into the network at network nodes along one side of the rectangular region, representing the supply from secondary veins into the tissue. Xylem vessels are organized in vascular bundles in lower order veins that branch out into the interwebbed higher order xylem network thorne_structure_2006 presumingly supplying the same flow at every inflow node. Therefore, we approximate inflow rates to be equal at all inflow nodes. To represent the effect of fluid evaporation at stomata, fluid, but not metabolite, is flowing out at every node in the network , see Fig. 1 c). Metabolites are absorbed across each tube wall. The absorption rate is constant throughout the network. Yet, as we have learned by studying a single tube in the previous section, the amount of metabolite absorbed depends on how much metabolite available in the fluid, and how much time the metabolite has to travel to the tube wall to get absorbed. Therefore, absorption despite a constant absorption rate varies largely within a network.
The flow of the metabolites is determined by the fluid flow in accordance with Eq. 1. The fluid flow throughout a network is fully defined by the network’s architecture, the inflow and outflow rates and Kirchhoff’s circuit law. The cross-sectionally averaged fluid flow velocity in a tube follows subsequently from pressure drops along the tube. Each tube is considered as straight cylinder with hydraulic conductance of , where denotes the dynamic fluid viscosity. The pressure at every node is calculated by multiplying the inverse of the network conductivity matrix with the inflow or outflow rates at every node. The pressure drop along the tube is the difference between the pressure values at start and end node. The fluid flow is solved consistently through the whole network and takes network geometry and viscous and friction forces via the hydraulic resistance into account. Considering steady state solutions, the flow does not fluctuate over time.
The absorption of metabolite across a tube’s wall within the network depends on the metabolite available and the tube’s absorption capacity. The absorption capacity of tube follows directly from each tubes physical parameters and the fluid flow velocity within the tube. Next, we need to calculate the influx of metabolites in every tube which we solve for iteratively throughout the network starting with the influx nodes, see supplementary material S3A. As simplification we focus on stationary, steady state absorption patterns. We employ that metabolite flux is conserved at every network node. All metabolites flowing into an node are redistributed into tubes originating from this node. Redistribution is proportional to diffusion and flux into each tube. The metabolite outflux at the end of a tube is then given by the difference of metabolite influx and total absorption along the tube. Finally, at the lower end of the considered network excerpt, opposite the inflow nodes, remaining metabolites are flowing out of the network. Since the outflowing metabolites would lead to an accumulation of metabolites, we state the amount of metabolites not absorbed for every considered network excerpt.
Taking our initial motivation from plant leaves, we choose an average tube length and tube radius in accordance with xylem vessels sack_leaf_2013 ; sack_hydraulic_2004 ; sack_developmentally_2012 . Note that there is a difference between leaf vein and xylem vessel radius, as leaf veins bundle both phloem and xylem vessels. We thus consider xylem vessels to be less than half the radius of leaf veins in our parameter choice. The order of magnitude of the total inflow rate is chosen to yield velocities observable in lower order xylem vessels . We vary the fluid inflow rate between to . The choice of the inflow is consistent with a average water evaporation of approximately vico_effects_2011 ; zwieniecki_hydraulic_2002 and an average stomata density of woodward_influence_1995 . For the molecular diffusivity, we consider small molecules with . For the network size, we choose a triangulation with tubes. Since xylem vessels consist of highly pitted dead lignified tissue, no active absorption by chemical reactions but passive absorption by membrane permeation is expected. Values for membrane permeation are typically in the range of phillips_physical_2013 and depend on both membrane and metabolite properties. Alternatively an estimation for the absorption parameter can be derived from concentration profiles in xylem veins vanBel:1979 . Translating the measured exponential decay for higher order veins, we find Horwitz:1958 ; vanBel:1979 . This estimate for is in accordance with estimates using the membrane permeation. Thus, for the numerical calculations an absorption parameter of is chosen. Revisiting the three assumption made in Eq. 3 we verify that these assumptions hold for the chosen network topologies, see supplementary material S4.
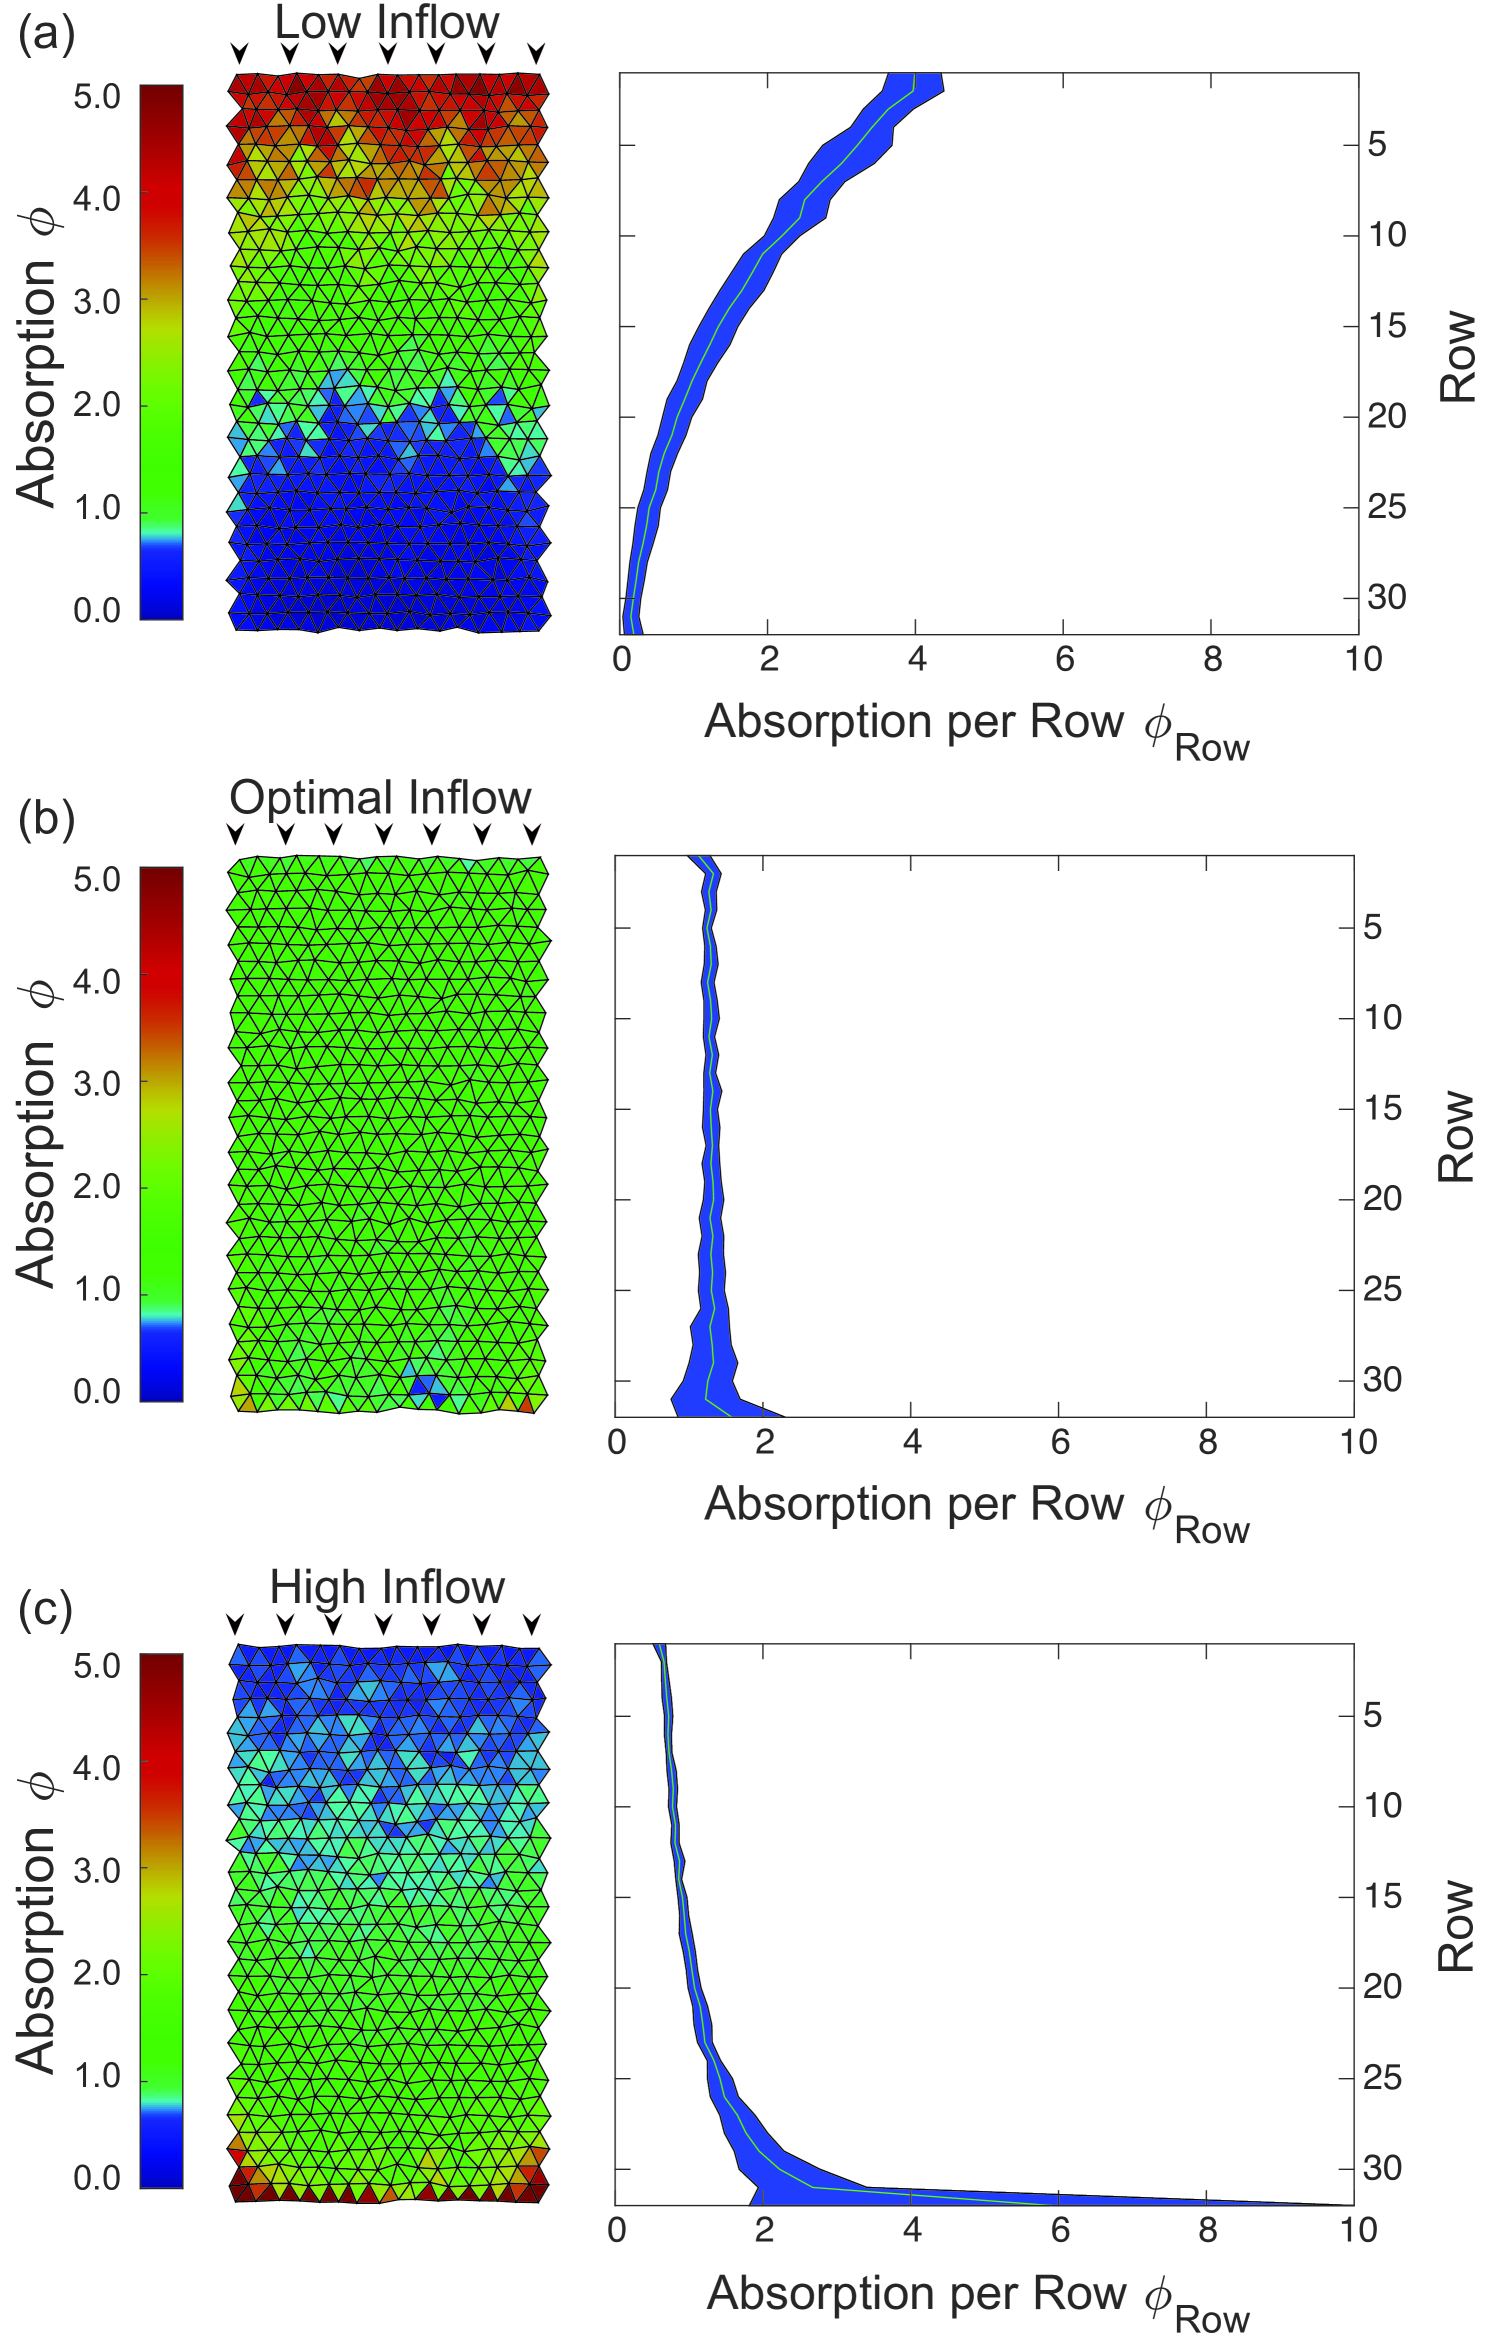
We first study metabolite supply patterns in uniform transport networks, where all tubes have the same radius . To compare different inflow rates we normalize the absorption by the total influx of metabolites. We find that the total fluid inflow rate is dominating the supply patterns, see Fig. 2. For small inflow rate, average flow velocities in the network are slow and the highest absorption is near the inflow nodes. Metabolites are not transported through to the end of the network limiting supply there. Calculating the mean absorption per row from inflow to opposing end, we can characterize this regime by , see Fig. 2 right column. For high inflow rates, average flow velocities are fast and the absorption increases with the distance from the inflow nodes . Metabolites arrive at the end of the network too quickly before getting absorbed limiting supply close to the inflow nodes. Between these limiting cases, we identify an inflow rate that gives rise to an optimally uniform supply pattern. We define the optimum by the lowest variance. The variance is calculated over the ensemble of all tubes. The overall variance in the optimal case is compared to and in the examples of low and high inflow rate shown in Fig. 2. In the optimally uniform supply pattern, absorption is the same constant rate in subsequent rows, . On the basis of this simple relation stating uniform absorption, a scaling law for the optimal inflow rate is derived next.
Scaling law for the optimal inflow rate
To derive a scaling law for the optimal inflow rate that gives rise to the most uniform supply pattern, we consider a one-dimensional toy model of connected single tubes that captures the essential flow and transport characteristics along the rows of the two-dimensional transport networks investigated above. For this, we look at a straight pipeline of identical tubes. As for the networks considered in the previous section, see Fig. 2, all tubes are of the same radius and length , in accordance with observations of diminishing radius hierarchy in higher order veins ronellenfitsch_topological_2015 ; sack_leaf_2013 . Metabolites and fluid are flowing into the first tube and fluid is leaving at a constant rate at every node between adjacent tubes. Metabolites cannot exit at nodes but remain in the fluid until the very end of the pipeline or are absorbed. Also the fluid inflow rate and total fluid outflow rate are equal, i.e. . This results in a constant decrease in flow rate by from one tube to the subsequent. To translate this to cross-sectionally averaged flow velocities, which are the flow properties determining absorption, we use . Consequently, the flow velocity in segment is given by .
The outflux of metabolites from one tube is equal to the influx of metabolites in the subsequent tube , since all tubes have the same radius . If is the total amount of metabolites flowing into the first tube, then only the fraction is flowing out while the fraction is absorbed. Generalizing we determine the absorption in tube as
| (8) |
The state of optimally uniform absorption is now defined by absorption in subsequent tubes being equal. We use this constraint to determine the inflow rate that corresponds to the optimally uniform supply pattern. Using Eq. (8) to write the absorption in the tube as a function of the absorption in the previous tube and inserting the equality constraint, we arrive at an expression including absorption capacities only, . Inserting the simplified expression for the absorption capacity from Eq. (7), we find the scaling law determining the optimal inflow rate to yield uniform absorption
| (9) |
where denotes the length of the sequence of pipes. Note, that this condition is independent of which tube segment is considered. The absorption is uniform along the entire sequence of tubes.
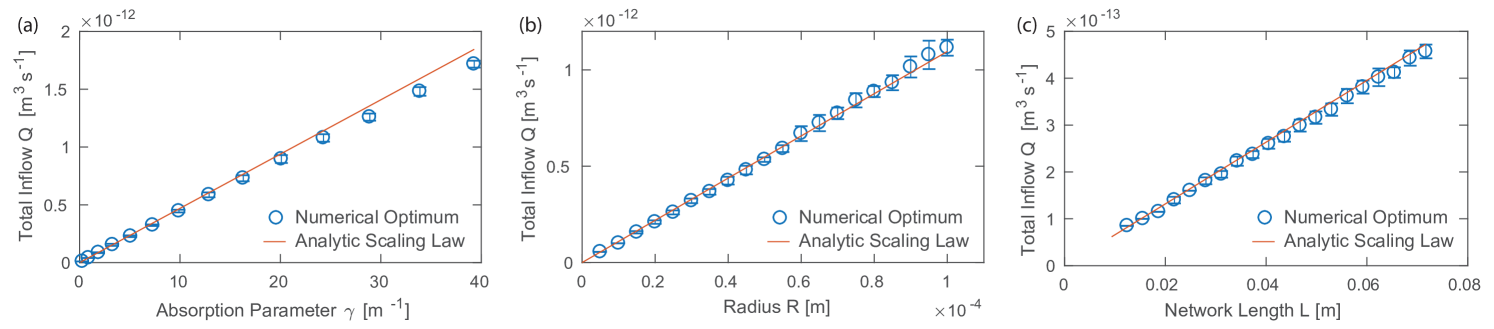
Our toy model is set up to capture the essential flow and transport characteristic along the rows of a two-dimensional network excerpt modulus a geometrical factor. To confirm that the same functional dependence of the optimal inflow rate holds for two-dimensional networks, we return to our simulations of rectangular two-dimensional networks. For a given parameter choice, we vary the inflow rate and determine its optimal value by the minimal variance in absorption. We independently vary the absorption parameter and the tube radius , equal for all tubes right now, as well as the overall size of the network , see Fig. 3. While one parameter was varied, the other parameters were kept constant. To cover a large parameter range, base parameters values are chosen as , , and , see supplementary material S5. For each parameter combination the inflow rate was varied in step sizes of . Note, to increase the overall size of the network additional nodes where added. Therefore, decreased, and thus the overall flow velocity gradient decreased as well. Each run over a parameter combination was repeated 15 times with different random Gaussian node perturbations of a rectangular two-dimensional network with tubes of the same radii . We find a linear scaling between the optimal inflow rate and the absorption parameter, the radius, and the overall size of the network in agreement with the scaling law’s prediction. Even more, if we multiply the optimal inflow rate derived above for the one-dimensional tube network by a geometrical factor taking into account the two-dimensional network geometry the numerical results follow exactly the analytical prediction. The geometrical factor is product of three terms , where the first term is correcting the length of the network and the later two are needed to correctly link the velocity profiles with the inflow in the network. The total length of the network in flow direction is effectively shortened as tubes of the two dimensional network are not connected with a angle of as in the toy model but the network is a tessellation of approximately equilateral triangles. The length of the network has thus to be shortened corresponding to the ratio of height and side length of such a triangle with . Considering the rows of nodes, the inflow of fluid in 16 nodes is distributed to 17 nodes in the next row. The flow in tubes connecting these two layers of nodes is thus reduced by the ratio . As the total inflow is the inflow over the complete width of the network, the optimal inflow has to flow into every of the 2 to 3 tubes connected to the 16 inflow node giving rise to .
Optimization of network architecture for uniform supply
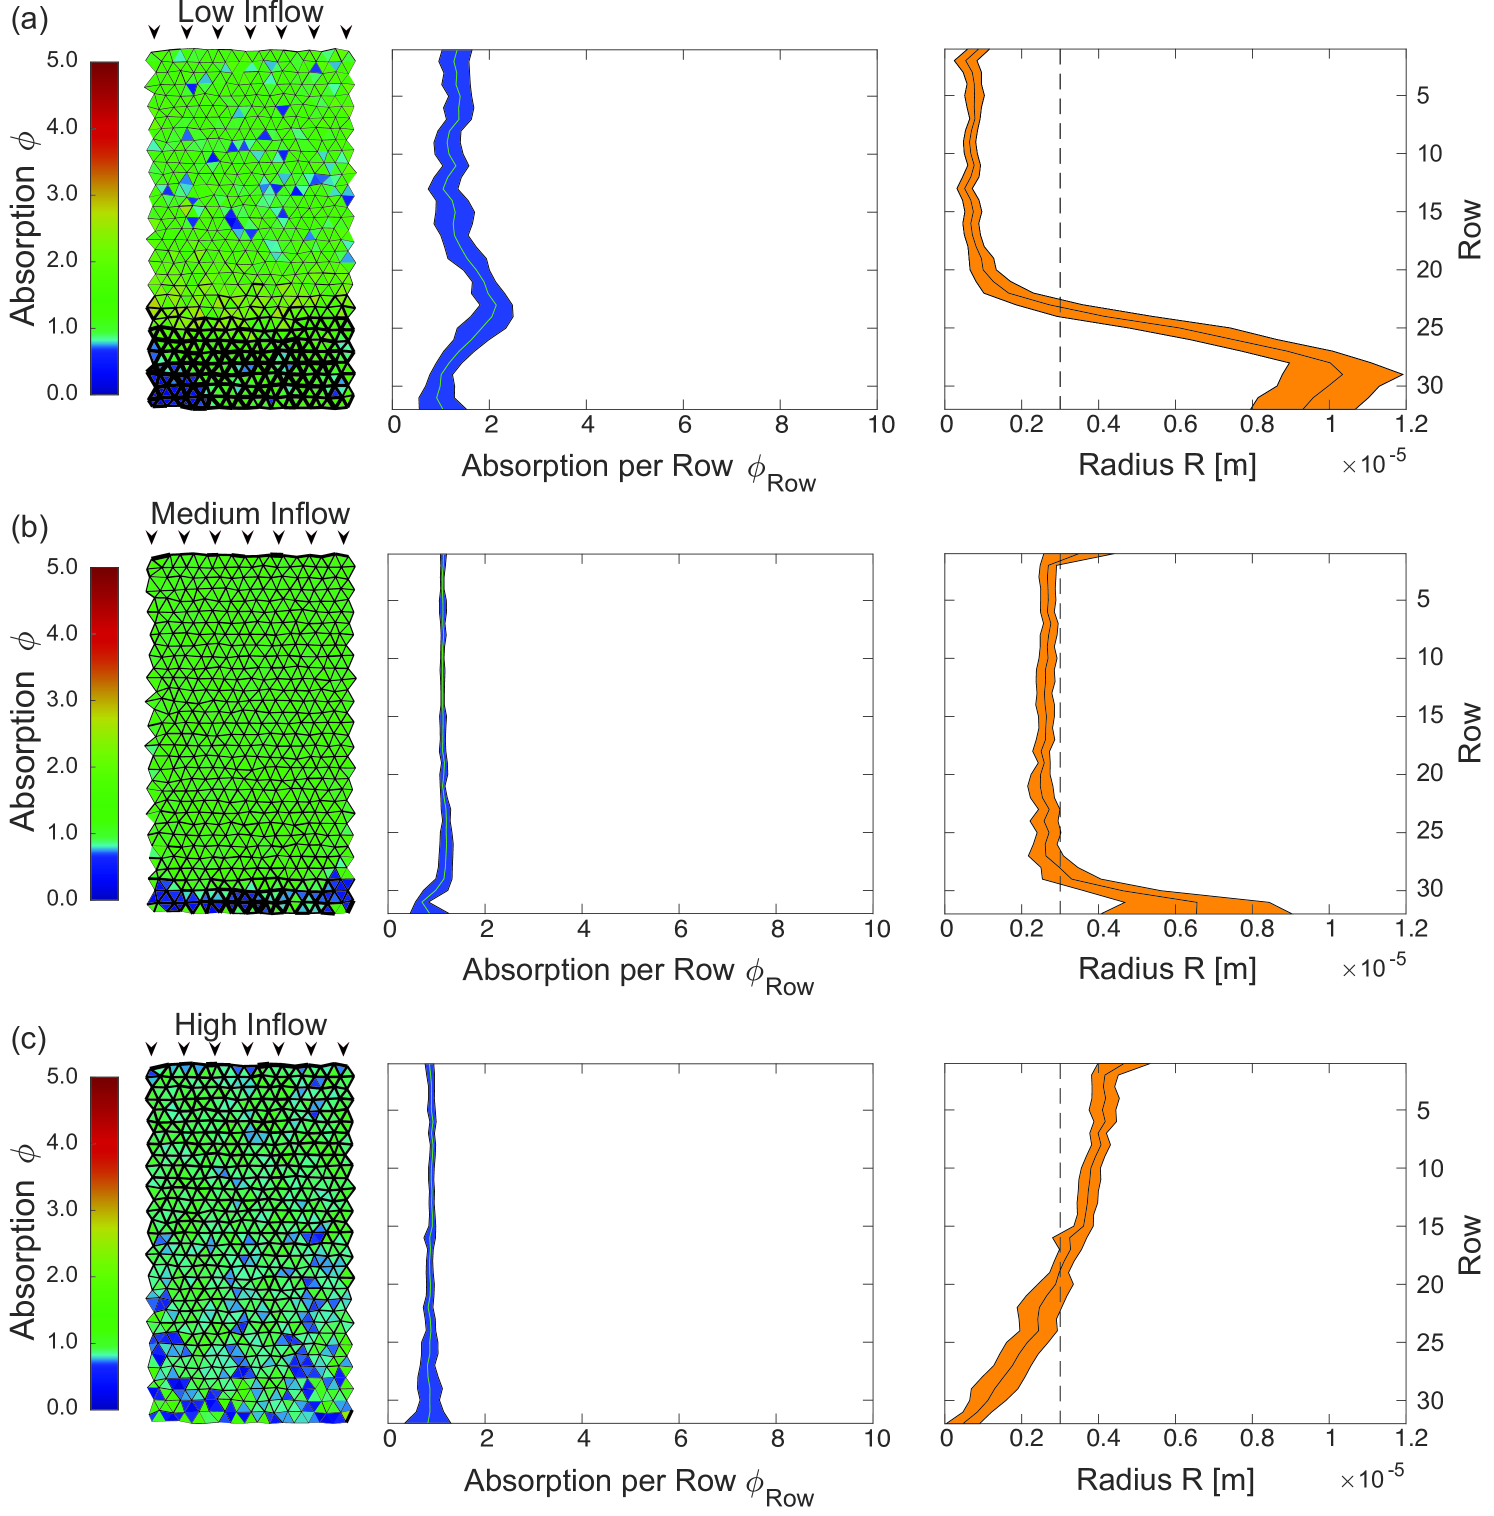
We found that a global change in the total fluid inflow rate is the most important control mechanisms to generate uniform supply patterns in a tissue pervaded by a transport network. How does a network architecture need to change to compensate low or high inflow rates? How much more can we minimize the variance in absorption even if fluid flow rate is optimal? To answer these questions we now optimize our previously found supply patterns by allowing for local dilation or contraction of tubes starting with the randomized networks introduced above. In addition to tube dilation and contraction, changes to the network architecture by discarding entire tubes are allowed. A tube is regarded as cut, if it radius is reduced below a threshold of , compared to an average tube radius of R=. While locally changing the network architecture, we keep the total amount of material within the network constant as we redistribute changes in over all radii equally. For this we numerically optimize the network topology using Monte-Carlo methods, explained in detail in supplementary material S3B.
We optimize the network architecture regarding uniform tissue supply for the cases of low, high and optimal inflow rate, see Fig. 4. In all three cases overall variance in absorption was successfully decreased. For low inflow rates, we observe a contraction of tubes near the influx nodes and an expansion of tubes toward the opposing end. Contraction of tubes speeds up flow velocities thus reducing otherwise dominating absorption close to the inflow nodes and thereby making metabolites available for absorption further onwards. The increase in absorption follows spatially the rapid increase in radius. This indicates that shifts in the radius distribution impact the local absorption profile strongly. For high inflow rates, we observe the opposite optimization mechanism. Tubes dilate close to the inflow and contract toward the opposing end. Here, dilation decreases flow rate and increases the absorption early on, while at the same time reducing the amount of metabolite flushing through. For the optimal inflow rate, we observe slight dilation near the inflow as well as near the outflow nodes. These changes correct for network artifacts arising from the chosen rectangular form of the excerpt. In all optimized networks we find small fluctuations in the absorption pattern which result from the randomized node positions and random tube lengths.
Discussion
We investigated what is needed to achieve a uniform supply rate of metabolites to tissue via a tubular transport network. We find that the fluid inflow rate is the most important control mechanism. We give an analytical scaling law for the optimal inflow rate as a function of system parameters. Yet, even if the optimal inflow rate is not available, altering the network geometry by dilating or contracting certain tube radii can reduce the overall variance in supply by an order of magnitude.
Optimizing for uniform supply rate across a transport network is a novel perspective regarding the theoretical investigation of optimal transport networks, where the focus is mainly on minimizing total dissipation durand_structure_2007 ; banavar_topology_2000 ; katifori_damage_2010 ; corson_fluctuations_2010 . For comparison, we compute the total dissipation for our example network shown in Figs. 2, 4. For the networks of equal radii, we find that the dissipation for the optimal inflow rate is of the same order of magnitude to hundredfold higher than for the less uniform supply patterns arising from low and high inflow rates, respectively. Optimizing the network architectures to enhance uniform metabolite supply even increases total dissipation for low and optimal inflow rate, while dissipation is only slightly decreased for high inflow rate. We conclude that total dissipation and uniform metabolite supply are orthogonal properties regarding transport networks. It could well be that biological transport networks balance both properties by optimizing them at the same time. Yet, we observe the differentiation of biological transport networks into different types of tubes like lower order versus higher order veins. This suggest that biological transport networks could be divided into parts that are targeted at transport costs, others targeted at mechanical structures, and others targeted at supply.
We find that inflow rate into a tissue has the biggest impact on how uniform supply is throughout the tissue. For plants, sub-optimal environments, such as a drought, lead to a reduction of water flow. Following our results, a change in the inflow rate will result in a change in the supply pattern, even if the same amount of metabolite is still available. Plant leaves can actively control fluid flow rates by managing evaporation via opening and closing of stomata. It is inspiring to note that therefore plants could control to some extend for optimal inflow rates. Unfortunately, to our knowledge, no data on flow rates in leaf veins is available to test this. Alternatively, we find that specific patterns of vein radii could also compensate sub-optimal inflow. Though the adaptation of xylem veins on drought conditions has received general attention, see e.g. alvarez_metabolomic_2008 ; EilmannDrought ; cannyXylemCons ; lovisolo_effects_1998 , it has not been investigated to what extend plants modify the hierarchy of higher order xylem vessel radii for compensatory patterns when grown in sub-optimal conditions. Although our findings predict the regulation of the flow rate by stomata control to be the dominant mechanism, it would be fascinating to check for radii patterns in higher order vessels with established means of vessel network analysis ronellenfitsch_topological_2015 .
We investigated uniform metabolite supply by xylem vein vasculature focusing on two dimensions. On the level of modeling metabolite absorption on vessel walls, our framework can readily be extended to network topologies embedded in a three dimensional space. That said, the dynamics of metabolite supply within the tissue surrounding the vessel walls changes dramatically if we go from two to three dimensions, simply because the physical space to be supplied increases. The spatial distribution of metabolite concentration in the tissue can be resolved by an explicit treatment of the reaction-diffusion dynamics in the extravascular space. Here, for example the Krogh formalism allows to reduce this computationally complex task to the spacing between vessels as an additional parameter krogh_number_1919 ; Rubenstein:2012 . To our knowledge the concept of Krogh radii has not been considered in plant tissue, yet. As we consider flat leaves, we restricted our analysis here to two dimensions. We studied vascular networks with biological observed vessel spacing of in our model, assuming that metabolite spread for these physiological values is not limited within the tissue but rather limited by the supply through the vasculature. Since we investigate uniform supply patterns the variation in absorption rates of neighboring vessels is by definition very small, also limiting supply variations in the tissue.
Since leaf vascular specifics have been incorporated in our model using a distinct source and sink distribution on the network level, the derived scaling law is only applicable to higher order xylem vessel networks. However, the chosen hydrodynamic perspective of the metabolite spread through a vascular system considers only few assumption and thus allows for a board applicability also in other biological systems. As such the absorption along a tube can be discussed in the setting of capillary beds in animal vasculature. Here, metabolites may be actively transported across the vessel wall with potentially non-linear reaction kinetics that we in this work only approximate by a linear absorption parameter. More importantly, vessels are so small, that blood flows in a plug flow and not Poiseuille flow. In our theoretical work, Poiseuille flow is the key to generate the fast mixing of metabolites across a tube, which is impaired in pure plug flow. However, blood cells being squeezed through the tiny vessel create turbulent eddies and recirculation zones in the flow, which drive fast mixing across a vessel Rubenstein:2012 . Based on fast mixing, our results may very well be applicable to capillary beds. For capillary beds, inflow rates are to first approximation a function of heart rate and the allocation of fluid along the hierarchical circulatory system. However, capillary beds also auto-regulate their flow by dilating or contracting so-called sphincters situated at the inflow nodes that dilate or contract the close by capillaries Rubenstein:2012 - a control mechanism in agreement with our findings. Note, that in this example even the location of compensatory regulation close to the inflow follows the predictions of our hydrodynamic model.
Taken together the evidence of control mechanisms in plant and animal vasculature, albeit scarce, suggests that indeed uniform supply might very well be targeted at the level of higher order veins and capillary beds. Our scaling law predicts a simple relationship between inflow rate and tissue size or vessel radius. Thereby, we pave the way to experimentally investigate supply patterns in biological transport networks.
Transport networks are at the basis of not only biological organisms but also technological design and medical application. Investigating what properties make a transport network give rise to uniform supply we identify the most important control mechanism, mainly inflow rate and secondary vessel diameter close to inlets. These controls may be important for so many more transport system than the ones exemplified here. But most importantly it sheds light on our understanding of the transport dynamics and not just fluid flow profiles in transport networks.
Acknowledgements
We like to thank M. P. Brenner and P. Cha for initial discussions about absorption in single tubes. This research was supported in part by the Deutsche Forschungsgemeinschaft (DFG) via grant SFB-937/A19 and the Max Planck Society.
References
- (1) S. Alvarez, E. L. Marsh, S. G. Schroeder, and D. P. Schachtman. Metabolomic and proteomic changes in the xylem sap of maize under drought. Plant Cell Environ., 31(3):325–340, Mar. 2008.
- (2) R. Aris. On the dispersion of a solute in a fluid flowing through a tube. Proc. R. Soc. A, 235(1200):67–77, 1956.
- (3) J. R. Banavar, F. Colaiori, A. Flammini, A. Maritan, and A. Rinaldo. Topology of the fittest transportation network. Phys. Rev. Lett., 84(20):4745–4748, May 2000.
- (4) L. Boddy, J. Hynes, D. P. Bebber, and M. D. Fricker. Saprotrophic cord systems: dispersal mechanisms in space and time. Mycoscience, 50(1):9–19, Jan. 2009.
- (5) S. Bohn and M. O. Magnasco. Structure, scaling, and phase transition in the optimal transport network. Phys. Rev. Lett., 98(8):088702, Feb. 2007.
- (6) H. Bruus. Theoretical Microfluidics. Number 18 in Oxford master series in physics. - Oxford [u.a.] : Oxford University Press, 2001-. Oxford Univ. Press, Oxford [u.a.], reprinted [with correction]. edition, 2009.
- (7) M. J. Canny, J. P. Sparks, C. X. Huang, and M. L. Roderick. Air embolisms exsolving in the transpiration water the effect of constrictions in the xylem pipes. Functional Plant Biology, 34(2):95–111, 2007.
- (8) P. Cha, K. Alim, and M. P. Brenner. Absorption in a dilating tube and its implication for blood flow. in preparation, 2018.
- (9) J. Chan, P. E. Bayliss, J. M. Wood, and T. M. Roberts. Dissection of angiogenic signaling in zebrafish using a chemical genetic approach. Cancer Cell, 1(3):257 – 267, 2002.
- (10) S.-S. Chang, S. Tu, K. I. Baek, A. Pietersen, Y.-H. Liu, V. M. Savage, S.-P. L. Hwang, T. K. Hsiai, and M. Roper. Optimal occlusion uniformly partitions red blood cells fluxes within a microvascular network. PLOS Comp. Biol., 13(12):e1005892, Dec. 2017.
- (11) B. Choat, R. Munns, M. McCully, J. Passioura, S. Tyerman, H. Bramley, and M. Canny. Water movement in plants. In B. Choat and R. Munns, editors, Plants in Action, chapter 3. Australian Society of Plant Scientists, Melbourne, 2010.
- (12) D. A. Coomes, S. Heathcote, E. R. Godfrey, J. J. Shepherd, and L. Sack. Scaling of xylem vessels and veins within the leaves of oak species. Biol. Lett., 4(3):302–306, June 2008.
- (13) F. Corson. Fluctuations and redundancy in optimal transport networks. Phys. Rev. Lett., 104(4):048703, Jan. 2010.
- (14) S. Datta and S. Ghosal. Dispersion due to wall interactions in microfluidic separation systems. Phys. Fluids, 20(1):012103, 2008.
- (15) M. Durand. Architecture of optimal transport networks. Phys. Rev. E, 73(1 Pt 2):016116, Jan. 2006.
- (16) M. Durand. Structure of optimal transport networks subject to a global constraint. Phys. Rev. Lett., 98(8):088701, Feb. 2007.
- (17) B. Eilmann, R. Zweifel, N. Buchmann, P. Fonti, and A. Rigling. Drought-induced adaptation of the xylem in scots pine and pubescent oak. Tree Physiology, 29(8):1011–1020, 2009.
- (18) Q. Fang, S. Sakadzić, L. Ruvinskaya, A. Devor, A. M. Dale, and D. A. Boas. Oxygen advection and diffusion in a three- dimensional vascular anatomical network. Opt. Express, 16(22):17530–17541, Oct. 2008.
- (19) M. Fricker and C. Willmer. Stomata. Springer Science & Business Media, Dec. 2012.
- (20) L. Graetz. Über die wärmeleitungsfähigkeit von flüssigkeiten. Ann. Phys., 254(1):79–94, Jan. 1882.
- (21) L. L. M. Heaton, E. López, P. K. Maini, M. D. Fricker, and N. S. Jones. Advection, diffusion, and delivery over a network. Phys. Rev. E, 86(2 Pt 1):021905, Aug. 2012.
- (22) H. N. Hemida, M. N. Sabry, A. Abdel-Rahim, and H. Mansour. Theoretical analysis of heat transfer in laminar pulsating flow. Int. J. Heat Mass Transf., 45(8):1767–1780, Apr. 2002.
- (23) N. M. Holbrook and M. A. Zwieniecki. Vascular transport in plants. Academic Press, Sept. 2011.
- (24) L. Horwitz. Some simplified mathematical treatments of translocation in plants. Plant Physiol., 33(2):81–93, Mar. 1958.
- (25) S. Isogai, M. Horiguchi, and B. M. Weinstein. The vascular anatomy of the developing zebrafish: An atlas of embryonic and early larval development. Dev. Biol., 230(2):278–301, Feb. 2001.
- (26) K. H. Jensen, E. Rio, R. Hansen, C. Clanet, and T. Bohr. Osmotically driven pipe flows and their relation to sugar transport in plants. J. Fluid Mech., 636:371–396, Oct. 2009.
- (27) K. H. Jensen and M. A. Zwieniecki. Physical limits to leaf size in tall trees. Phys. Rev. Lett., 110(1):018104, Jan. 2013.
- (28) G. E. Kapellos, T. S. Alexiou, and S. Pavlou. Chapter 8 - fluid-biofilm interactions in porous media. In S. M. Becker and A. V. Kuznetsov, editors, Heat transfer and fluid flow in biological processes, pages 207–238. Academic Press, Boston, 2015.
- (29) E. Katifori, G. J. Szöllősi, and M. O. Magnasco. Damage and fluctuations induce loops in optimal transport networks. Phys. Rev. Lett., 104:048704, Jan 2010.
- (30) A. Krogh. The number and distribution of capillaries in muscles with calculations of the oxygen pressure head necessary for supplying the tissue. The Journal of Physiology, 52(6):409–415, May 1919.
- (31) M. LaBarbera. Principles of design of fluid transport systems in zoology. Science, 249(4972):992–1000, Aug. 1990.
- (32) A. S. Levey, L. A. M. Stevens, C. H. Schmid, Y. L. M. Zhang, A. F. I. Castro, H. I. M. Feldman, J. W. Kusek, P. Eggers, F. Van Lente, T. Greene, and J. Coresh. A new equation to estimate glomerular filtration rate. Ann. Intern. Med., 150(9):604–612, May 2009.
- (33) C. Lovisolo and A. Schubert. Effects of water stress on vessel size and xylem hydraulic conductivity in Vitis vinifera L. J. Exp. Bot., 49(321):693–700, Apr. 1998.
- (34) E. M. Lungu and H. K. Moffatt. The effect of wall conductance on heat diffusion in duct flow. Journal of Engineering Mathematics, 16(2):121–136, 1982.
- (35) L. Ma, D. Ingham, and M. Pourkashanian. 16 - application of fluid flows through porous media in fuel cells. In D. Ingham and I. Pop, editors, Transport phenomena in porous media III, pages 418 – 440. Pergamon, Oxford, 2005.
- (36) S. Marbach, K. Alim, N. Andrew, A. Pringle, and M. P. Brenner. Pruning to increase taylor dispersion in physarum polycephalum networks. Phys. Rev. Lett., 117(17):178103, Oct. 2016.
- (37) C. D. Murray. The Physiological Principle of Minimum Work. Proc Natl Acad Sci U S A, 12(5):299–304, May 1926.
- (38) P. A. Netti, L. T. Baxter, Y. Boucher, R. Skalak, and R. K. Jain. Macro- and microscopic fluid transport in living tissues: Application to solid tumors. AIChE J., 43(3):818–834, Mar. 1997.
- (39) R. Phillips. Physical biology of the cell. Garland Science, Taylor & Francis Group, London, second edition edition, 2013.
- (40) C. A. Price, S. Wing, and J. S. Weitz. Scaling and structure of dicotyledonous leaf venation networks. Ecol. Lett., 15(2):87–95, Feb. 2012.
- (41) I. Rodriguez-Iturbe and A. Rinaldo. Fractal river basins: chance and self-organization. Cambridge Univ. Press, Cambridge [u.a.], 1997.
- (42) M. Rohden, A. Sorge, M. Timme, and D. Witthaut. Self-organized synchronization in decentralized power grids. Phys. Rev. Lett., 109(6):064101, Aug. 2012.
- (43) H. Ronellenfitsch and E. Katifori. Global optimization, local adaptation, and the role of growth in distribution networks. Phys. Rev. Lett., 117:138301, Sep 2016.
- (44) H. Ronellenfitsch, J. Lasser, D. C. Daly, and E. Katifori. Topological Phenotypes Constitute a New Dimension in the Phenotypic Space of Leaf Venation Networks. PLOS Computational Biology, 11(12):e1004680, Dec. 2015.
- (45) A. Roth-Nebelsick, D. Uhl, V. Mosbrugger, and H. Kerp. Evolution and function of leaf venation architecture: A review. Ann Bot, 87(5):553–566, May 2001.
- (46) D. A. Rubenstein, M. D. Frame, and W. Yin. Biofluid Mechanics. An introduction to fluid mechanics, macrocirculation, and microcirculation. Academic Press, 2012.
- (47) L. Sack and C. Scoffoni. Leaf venation: structure, function, development, evolution, ecology and applications in the past, present and future. New Phytol., 198(4):983–1000, June 2013.
- (48) L. Sack, C. Scoffoni, A. D. McKown, K. Frole, M. Rawls, J. C. Havran, H. Tran, and T. Tran. Developmentally based scaling of leaf venation architecture explains global ecological patterns. Nat Commun, 3:837, May 2012.
- (49) L. Sack, C. M. Streeter, and N. M. Holbrook. Hydraulic analysis of water flow through leaves of sugar maple and red oak. Plant Physiol., 134(4):1824–1833, Apr. 2004.
- (50) J. T. Santini, M. J. Cima, and R. Langer. A controlled-release microchip. Nature, 397(6717):335–338, Jan. 1999.
- (51) M. Schneider, J. Reichold, B. Weber, G. Székely, and S. Hirsch. Tissue metabolism driven arterial tree generation. Medical Image Analysis, 16(7):1397–1414, Oct. 2012.
- (52) P. Sen, S. Dasgupta, A. Chatterjee, P. A. Sreeram, G. Mukherjee, and S. S. Manna. Small-world properties of the indian railway network. Phys. Rev. E, 67(3):036106, Mar. 2003.
- (53) G. Taylor. Dispersion of soluble matter in solvent flowing slowly through a tube. Proc. R. Soc. A, 219(1137):186–203, Aug. 1953.
- (54) A. Tero, S. Takagi, T. Saigusa, K. Ito, D. P. Bebber, M. D. Fricker, K. Yumiki, R. Kobayashi, and T. Nakagaki. Rules for biologically inspired adaptive network design. Science, 327(5964):439–442, Jan. 2010.
- (55) E. T. Thorne, B. M. Young, G. M. Young, J. F. Stevenson, J. M. Labavitch, M. A. Matthews, and T. L. Rost. The structure of xylem vessels in grapevine (Vitaceae) and a possible passive mechanism for the systemic spread of bacterial disease. Am. J. Bot., 93(4):497–504, Apr. 2006.
- (56) N. Tufenkji and M. Elimelech. Correlation equation for predicting single-collector efficiency in physicochemical filtration in saturated porous media. Environ. Sci. Technol., 38(2):529–536, Jan. 2004.
- (57) A. J. van Bel, E. Mostert, and A. C. Borstlap. Kinetics of l-alanine escape from xylem vessels. Plant Physiol., 63(2):244–247, Feb. 1979.
- (58) G. Vico, S. Manzoni, S. Palmroth, and G. Katul. Effects of stomatal delays on the economics of leaf gas exchange under intermittent light regimes. New Phytologist, 192(3):640–652, Nov. 2011.
- (59) G. B. West, J. H. Brown, and B. J. Enquist. A general model for the structure and allometry of plant vascular systems. Nature, 400(6745):664–667, Aug. 1999.
- (60) F. I. Woodward and C. K. Kelly. The influence of CO2 concentration on stomatal density. New Phytologist, 131(3):311–327, Nov. 1995.
- (61) M. A. Zwieniecki, P. J. Melcher, C. K. Boyce, L. Sack, and N. M. Holbrook. Hydraulic architecture of leaf venation in Laurus nobilis L. Plant, Cell & Environment, 25(11):1445–1450, Nov. 2002.