Four microlensing giant planets detected through signals produced by minor-image perturbations
Abstract
Aims. We investigated the nature of the anomalies appearing in four microlensing events KMT-2020-BLG-0757, KMT-2022-BLG-0732, KMT-2022-BLG-1787, and KMT-2022-BLG-1852. The light curves of these events commonly exhibit initial bumps followed by subsequent troughs that extend across a substantial portion of the light curves.
Methods. We performed thorough modeling of the anomalies to elucidate their characteristics. Despite their prolonged durations, which differ from the usual brief anomalies observed in typical planetary events, our analysis revealed that each anomaly in these events originated from a planetary companion located within the Einstein ring of the primary star. It was found that the initial bump arouse when the source star crossed one of the planetary caustics, while the subsequent trough feature occurred as the source traversed the region of minor image perturbations lying between the pair of planetary caustics.
Results. The estimated masses of the host and planet, their mass ratios, and the distance to the discovered planetary systems are for KMT-2020-BLG-0757, for KMT-2022-BLG-0732, for KMT-2022-BLG-1787, and for KMT-2022-BLG-1852. These parameters indicate that all the planets are giants with masses exceeding the mass of Jupiter in our solar system and the hosts are low-mass stars with masses substantially less massive than the Sun.
Key Words.:
planets and satellites: detection – gravitational lensing: micro| Event | (RA, DEC)J2000 | |||
|---|---|---|---|---|
| KMT-2020-BLG-0757 | (18:04:32.48, -27:55:21.68) | 18.93 | 1.11 | |
| KMT-2022-BLG-0732 | (17:40:27.37, -35:51:27.97) | 17.82 | 2.54 | |
| KMT-2022-BLG-1787 | (17:50:22.37, -30:23:58.88) | 18.45 | 2.84 | |
| KMT-2022-BLG-1852 | (18:19:10.92, -24:16:16.90) | 18.72 | 0.77 |
1 Introduction
In contrast to the simplified representation of a planetary microlensing signal as a brief, discontinuous deviation in the smooth lensing light curve caused by the host star of the planet, the manifestations of planets exhibit a high degree of variability. These signals arise when the source crosses or approaches the caustic generated by the presence of a planet (Mao & Paczyński, 1991; Gould & Loeb, 1992). Caustics in microlensing represent the positions at which the magnification of a point source becomes infinitely large. Caustics induced by planets form single or multiple closed curves. The characteristics of these caustic curves, including their number, location, and size, vary depending on the separation and mass ratio between the planet and its host star. Combined with the varied trajectories of source stars, planetary signals exhibit diverse forms in terms of their location, duration, and shape. Consequently, simply depicting planetary signals as brief deviation often fails to capture their true complexity.
Identifying microlensing planets involves a meticulous procedure that entails considerable time and effort. Initially, anomalous events are sought by scrutinizing the light curves of lensing events. Subsequently, the planetary nature of these anomalies is discerned through rigorous analyses of the observed light curves. Current lensing surveys annually detect more than 3000 events, with roughly 10% exhibiting anomalies attributed to various causes. While some anomalies can be readily attributed to planetary presence, discerning the nature of others from their appearance alone is very challenging. To firmly identify anomalies, a detailed analysis involving complex procedures and extensive computations is necessary. Morphological studies play a crucial role by categorizing anomalies with similar characteristics and investigating the origins of each class. This approach not only aids in accurately characterizing lensing anomalies for future events with similar structures but also facilitates the early diagnosis of anomalies before conducting in-depth analyses.
As the count of microlensing planets rises, planets with signals exhibiting similar anomaly patterns are grouped and announced collectively. Han et al. (2017) and Poleski et al. (2017) provided illustrative instances of planetary signals emerging via a recurrent channel, as demonstrated in their analysis of the microlensing planets OGLE-2016-BLG-0263Lb and MOA-2012-BLG-006Lb, respectively. Jung et al. (2021) presented planetary signals observed in the lensing events OGLE-2018-BLG-0567 and OGLE-2018-BLG-0962, for which the planetary signals appeared on the sides of the lensing light curves due to the source stars’ crossings over caustics situated away from the planet hosts. Additionally, Han et al. (2024) introduced three microlensing planets – MOA-2022-BLG-563Lb, KMT-2023-BLG-0469Lb, and KMT-2023-BLG-0735Lb – whose signals exhibit consistent short-term dip features surrounded by weak bumps on both sides of the dip. Han et al. (2023) and Han et al. (2021a) exemplified weak short-term planetary signals generated without caustic crossings for the events KMT-2022-BLG-0475, KMT-2022-BLG-1480, KMT-2018-BLG-1976, KMT-2018-BLG-1996, and OGLE-2019-BLG-0954.
In this study, we present analyses of four planetary lensing events: KMT-2020-BLG-0757, KMT-2022-BLG-0732, KMT-2022-BLG-1787, and KMT-2022-BLG-1852. These events exhibit planetary signals with a common characteristic, originating from the source crossing over the ”planetary” caustic induced by ”close” planets, followed by source passage through the region of the ”minor-image” perturbation situated between the pair of planetary caustics. We elucidate the technical terms ”close,” ”minor-image,” ”planetary,” and ”central” caustics in the subsequent section.
The analyses of the planetary events are presented according to the following organization. In Sect. 2, we provide an overview of the observations conducted for the lensing events, including the instrumentation utilized for observations as well as the procedures implemented for data reduction and adjustment of error bars. In Sect. 3, we provide a brief overview on the fundamental principles of planetary microlensing and discuss the modeling process used to analyze the observed light curves of the lensing events. Subsequent subsections offer comprehensive analyses of individual events and their results. In Sect. 4, we examine the source stars associated with the events and estimate the angular Einstein radii of the events. In Sect. 5, we depict the Bayesian analyses conducted for each event and present estimates for the physical parameters of the planetary systems derived from these analyses. Finally, in Sect. 6, we summarize our findings and draw conclusions based on the results obtained.
2 Observations and data
All analyzed lensing events in this work were discovered from the microlensing survey conducted toward the Galactic bulge field by the Korea Microlensing Telescope Network (KMTNet: Kim et al., 2016). In Table 1, we present the equatorial and Galactic coordinates of the events, along with their baseline magnitudes () and the -band extinction () toward the fields. We investigated the availability of additional data from other lensing surveys and found that KMT-2020-BLG-0757 was also observed by the Microlensing Observations in Astrophysics (MOA: Bond et al., 2001) group, who designated the event as MOA-2020-BLG-249. For the analysis of this event, we utilized the combined data from both the KMTNet and MOA surveys. After analyzing the KMT-2020-BLG-0757 event, it was discovered that additional data had been obtained by the OMEGA group, who conducted follow-up of microlensing events in the entire sky. Our analysis incorporates these newly acquired data.
The KMTNet group utilizes a network of three telescopes that are strategically distributed in three locations of the Southern Hemisphere: at the Cerro Tololo Inter-American Observatory in Chile (KMTC), the South African Astronomical Observatory in South Africa (KMTS), and the Siding Spring Observatory in Australia (KMTA). These telescopes have identical specifications, featuring a 1.6 m aperture and are each equipped with a camera providing a field of view of 4 square degrees. The MOA group conducts its survey using the 1.8 m telescope lying at the Mt. John Observatory located in New Zealand. The MOA telescope is mounted by a camera providing 2.2 square degrees of field of view. Observations by the KMTNet and MOA surveys were mainly done in the and the customized MOA- bands, respectively. For both surveys, a fraction of images were taken in the band for the source color measurement. Observational cadences vary depending on the events and we will mention the cadence when we detail the analysis of each event. The supplementary observations of KMT-2020-BLG-0757 by the OMEGA group were conducted using the Las Cumbres Observatory Global Telescope (LCOGT) Network, which comprises multiple 1-meter telescopes (Brown et al., 2013).
Image reduction and photometry for the lensing events employed automated pipelines tailored to each survey. These pipelines utilized code developed by Albrow et al. (2017) for the KMTNet survey and by Bond et al. (2001) for the MOA survey. To ensure optimal data usage in the analysis, we performed an additional reduction of the KMTNet data employing the photometry code developed by Yang et al. (2024). The OMEGA data were processed using LCO’s BANZAI pipeline (McCully et al., 2018). Following the refinement of the data sets for each event, we adjusted the data error bars. This adjustment aimed not only to maintain consistency with the data scatter but also to ensure that the value per degree of freedom (dof) was set to unity for each dataset. The normalization process followed the procedure described in Yee et al. (2012).
3 Analyses of anomalies
Caustics induced by planets are classified into two types based on whether the planet is located within or outside the Einstein ring of the host star (Dominik, 1999). We use the notation to denote the normalized projected separation between the planet and its host, measured in units of the Einstein radius. Both close () and wide () planets generate two sets of caustics: one set near the host star (central caustic) and the other set located away from the host at approximately (planetary caustic). In cases where the planet-to-host mass ratio is very small and the planetary separation deviates from unity, the central caustics induced by close and wide planets closely resemble each other both in shape and size (Griest & Safizadeh, 1998). Conversely, the planetary caustics induced by these two types of planets differ from each other in various aspects: a wide planet generates a single four-cusp caustic on the planet side, while a close planet produces two sets of three-cusp caustics on the opposite side of the planet. As a result, the planetary signals arising from the planetary caustics of these two lens populations exhibit characteristics that can nearly always be distinguished. For an in-depth discussion on the properties of central and planetary caustics, refer to Chung et al. (2005) and Han (2006), respectively.

The planets discussed in this study share common characteristics stemming from perturbations of the minor image caused by their presence. When a source is gravitationally lensed by a single mass, it produces two images: the brighter one, known as the ”major image,” appears outside the Einstein ring, while the fainter image, referred to as the ”minor image,” lies within the Einstein ring (Gaudi & Gould, 1997). Perturbations to the primary image by a planet result in additional magnification due to the planet’s influence, leading to a positive deviation in the anomaly. Conversely, perturbations to the minor image by the planet lead to demagnification, resulting in negative deviations in the anomaly.
In Figure 1, we illustrate the magnification pattern of a lens system to show the emergence of caustics and the de-magnification region due to the presence of a close planet. The planet parameters of the lens system corresponding to the presented configuration are , where denotes the mass ratio between the planet and its host. Noteworthy is the expansive span of the de-magnification region, which extends between the central and planetary caustics. This implies that the perturbation resulting from the traversal of a source through this area may persist for an extended period.
Assuming a rectilinear relative motion between the lens and the source, a planet-induced anomaly in a lensing light curve is characterized by seven fundamental lensing parameters. Among these, the first three parameters describe the approach of the lens and the source. Specifically, they represent the time of the closest lens-source approach, the separation (scaled to the angular Einstein radius ) at , and the event timescale, respectively. The subsequent two parameters define the planetary lens system, indicating the normalized separation and mass ratio between the planet and host. The next parameter represents the incidence angle of the source relative to the planet-host axis. As the source crosses the caustic induced by the planet, the lensing magnifications are affected by finite-source effects. To incorporate these effects, an additional parameter, , is necessary. This parameter is defined as the angular source radius normalized to (normalized source radius), that is, .
For each lensing event, we undertake an analysis to determine a lensing solution, which comprises the set of lensing parameters that best characterize the observed anomaly. Initially, we search for the planet parameters using a grid approach with multiple initial values of , followed by finding the remaining parameters using a downhill approach based on the Markov chain Monte Carlo (MCMC) method. Subsequently, we construct a map on the parameter plane of – to identify local solutions. In the subsequent stage, we refine the local solutions, and then establish a global solution by comparing the values of the local solutions. If the fits of the local solutions are comparable, we present all degenerate solutions and investigate the origin of the degeneracy. In the subsequent subsections, we provide detailed descriptions of the analyses conducted for the individual events.

3.1 KMT-2020-BLG-0757
The lensing event KMT-2020-BLG-0757 was first discovered by the KMTNet group on August 28, 2020, corresponding to the reduced heliocentric Julian date . Subsequently, the MOA group identified the event on September 7, with , and designated it as MOA-2020-BLG-249. Following the identification reference of the KMTNet survey, which initially discovered the event, we subsequently refer to the event as KMT-2020-BLG-0757. The OMEGA collaboration conducted follow-up observations of the event with the alert issued by the MOA group.
| Parameter | Value |
|---|---|
| (HJD′) | |
| (days) | |
| (10-3) | |
| (rad) | |
| (10-3) |
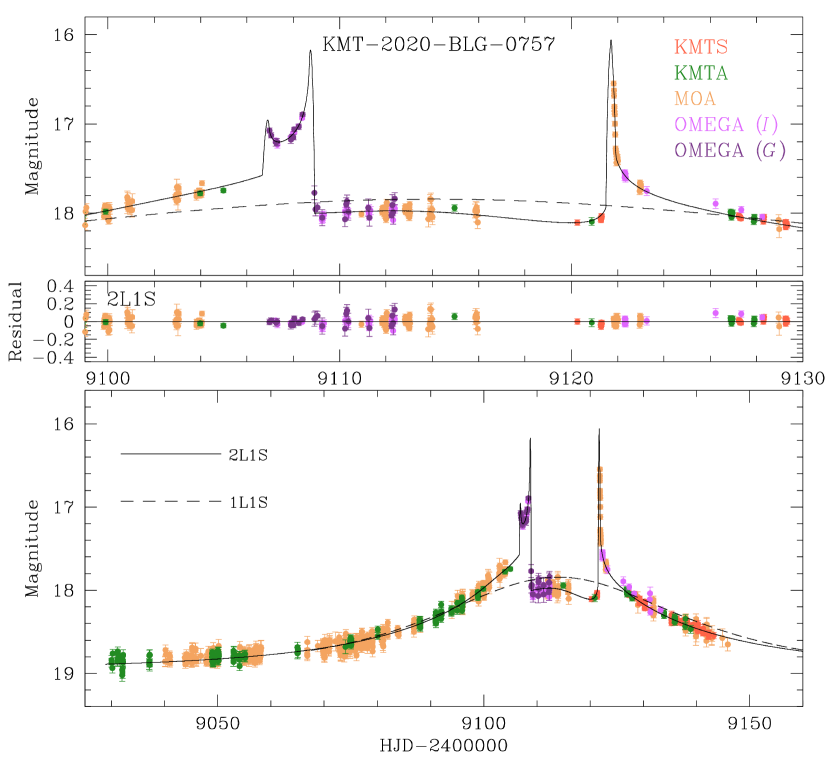
Figure 2 illustrates the event light curve constructed from the combination of the KMTNet, MOA, and OMEGA data. We note that the light-curve coverage of events from the 2020 season (including KMT-2020-BLG-0757) was severely impacted by the Covid-19 pandemic. Shortly after the start of the season, observations were discontinued at KMTC and KMTS. They were only resumed for KMTS near the end of the season, at HJD′ , as can be seen in Figure 2. As a result, the majority of the light curve was captured by the MOA and KMTA datasets, which were operation during the season. No data are available after due to the conclusion of the bulge season. The anomalous nature of the event was identified from the sharp rises of the source flux around and , which were observed by the OMEGA and MOA groups, respectively. Later examination of the light curve revealed additional deviations from the single-source single-lens (1L1S) model: positive deviations in the range and negative deviations during . From the investigation of previously identified microlensing planets, we found that the anomaly feature was similar to those appeared in the events MOA-2009-BLG-387 (Batista et al., 2011), OGLE-2015-BLG-0051 (Han et al., 2016), MOA-2016-BLG-227 (Koshimoto et al., 2017), KMT-2017-BLG-1038, KMT-2017-BLG-1146 (Shin et al., 2019), KMT-2017-BLG-2509, and OGLE-2019-BLG-0299 (Han et al., 2021b).
Through the modeling of the light curve, we identified a unique solution with . The complete lensing parameters of the solution, along with the corresponding value of the fit, are listed in Table 2. In Figure 3, we illustrate the configuration of the lens system corresponding to the solution. The configuration shows that the planetary and central caustics merge to form a single resonant caustic. The source crossed the caustic four times: at , , , and . The first and second passages occurred as the source traversed into and out of the lower planetary caustic, while the third and fourth passages occurred as it traversed into and out of upper planetary caustic. The U-shape trough region of the first caustic-crossing pair was covered by the OMEGA data, and the caustic exit of the second caustic-crossing pair was resolved by the MOA data. The normalized source radius was determined through the resolved caustic during the last crossing. The extended negative deviation region observed during the period was attributed to perturbations of the minor image resulting from the source passing through the region between the upper and lower planetary caustics.
3.2 KMT-2022-BLG-0732
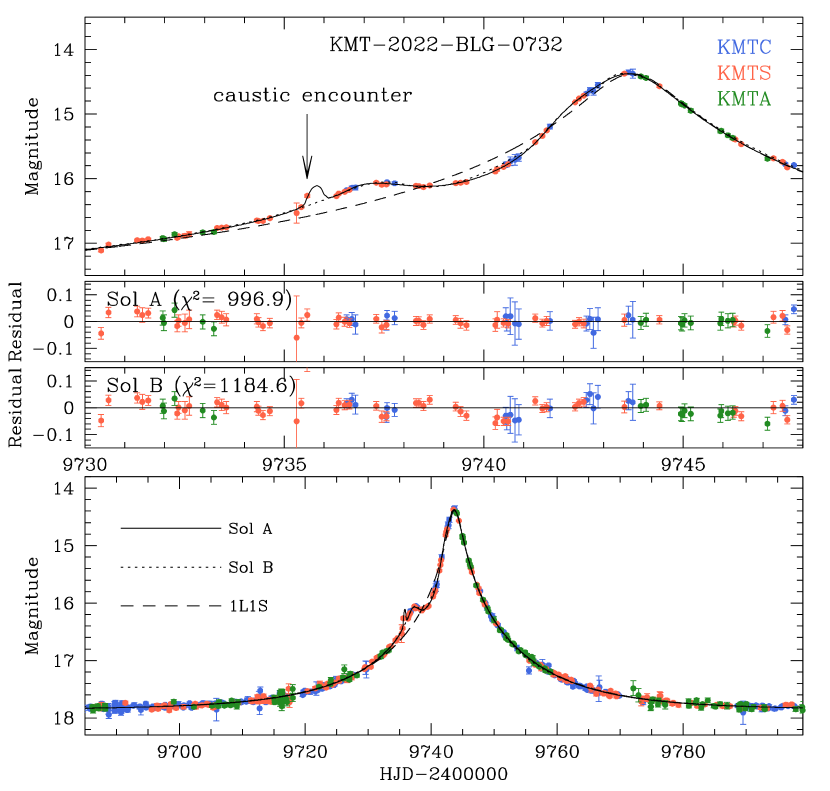
The KMTNet team detected the source flux enhancement of KMT-2022-BLG-0732 caused by lensing during the early stage of the event on May 9, 2022, corresponding to . The source was located within the KMTNet BLG37 field, toward which observations were conducted at a cadence of 2.5 hours. This event was not reported by other survey initiatives. Figure 4 presents the light curve of KMT-2022-BLG-0732. The rising portion of the light curve showcases a complex anomaly pattern. Especially, the segment observed during the period exhibits positive deviations with respect to a 1L1S model, while the segment observed during the period displays negative deviations.
By analyzing the lensing light curve, we have identified two distinct local solutions characterized by the planetary parameters and . These solutions are respectively referred to as ”sol A” and ”sol B.” Both solutions exhibit very low mass ratios between the lens components, indicating that the companion to the lens is likely a planetary mass object. Detailed lensing parameters of the solutions are provided in Table 3, while the model curves and residuals are depicted in Figure 4. Upon comparing the fits, it is evident that sol A offers a better explanation for the observed anomaly, particularly during the negative deviation phase . This is further supported by the substantial difference in values () between the two solutions, leading us to conclusively reject sol B.

| Parameter | sol A | sol B |
|---|---|---|
| (HJD′) | ||
| (days) | ||
| (10-3) | ||
| (rad) | ||
| (10-3) |
The lens system configuration for the event is depicted in Figure 5. Although ruled out, we also present the configuration corresponding to sol B to elucidate the origin of the degeneracy between the two solutions. The interpretation of sol A bears resemblance to that of KMT-2020-BLG-0757, as it involves the source passing through one of the planetary caustics induced by a close planet, followed by the passage through the minor-image perturbation region formed between the planetary and central perturbation region. We mark the KMTS data corresponding to the caustic encounter at with an arrow. Since the caustic was covered by a single point, we verified its validity by performing an additional modeling without this point. The best-fit model remained virtually unchanged, confirming the authenticity of the data point. According to sol B, on the other hand, the positive deviation is attributed to the source passage through the region extending from the on-line cusp of a resonant caustic, while the negative deviation is explained by the source passage near an off-axis cusp of the caustic. The resemblance between the model curves of sol A and sol B is not attributable to inherent degeneracy within the system, nor is the degeneracy notably significant. Therefore, we can classify it as an accidental degeneracy. A notable distinction in the anomaly pattern of KMT-2022-BLG-0732 compared to that of KMT-2020-BLG-0757 is the absence of an evident caustic-crossing spike. Upon examining the anomaly region corresponding to the time of the caustic crossing, we found that the caustic spike was blurred out because of significant finite-source effects. From the analyses of the region of the anomaly that was impacted by finite-source effects, the normalized source radius, , was measured.

3.3 KMT-2022-BLG-1787
The lensing event KMT-2022-BLG-1787 was initially detected by the KMTNet group on August 16, 2022, corresponding to . The event was densely observed because the source was located within the overlapping region of KMTNet’s prime fields BLG01 and BLG41, toward which observations were conducted with a cadence of 0.5 hours for each individual field and 0.25 hours in combined mode. Figure 6 shows the lensing light curve of the event. Continuing until the end of the 2022 bulge season, observations of its later stages were limited. The light curve exhibits anomalies similar to those observed in the two previous events, featuring both positive (around ) and negative deviations (occurring after ). This suggests a potential origin of the anomaly akin to those observed in the prior events.

| Parameter | Value |
|---|---|
| (HJD′) | |
| (days) | |
| (10-3) | |
| (rad) | |
| (10-3) |
In line with the anticipated anomaly pattern, the modeling of the event’s light curve yielded results that are consistent with those observed in the previous events. This reaffirms that the anomaly was caused by the source crossing over a planetary caustic generated by a close planet, followed by its passage through the region affected by the minor-image perturbation. Analysis of the event yielded a unique solution without any degeneracy. The estimated planet parameters are . The complete list of the lensing parameters is provided in Table 4.
In Figure 7, we present the lens-system configuration corresponding to the solution. The caustic configuration is very similar to that of KMT-2022-BLG-0732, except that the width between the planetary caustics is wider due to the larger planet-to-host mass ratio. The source passage through the tip of the lower planetary caustic produced the positive peak at , and the subsequent passage through the minor-image perturbation region resulted in a negative deviation. From analyzing the distorted bump feature due to finite-source effects, the normalized source radius was securely measured to be . It is worth noting that had observations continued until the end of the event, a second weak bump would have been visible around .

3.4 KMT-2022-BLG-1852
The KMTNet group detected the lensing event KMT-2022-BLG-1852 on August 19, 2022 (). The source was positioned within the KMTNet peripheral field BLG36, toward which observations were conducted with the lowest cadence (5.0 hours) among all 27 KMTNet fields. Despite this limitation in cadence, the light curve depicted in Figure 8 clearly exhibits an anomaly. This anomaly consists of an elongated dip () flanked by bumps on either side, resembling that observed in KMT-2022-BLG-1787. The significant deviation observed in the pre-dip bump suggests its formation due to a caustic crossing, while the weaker post-dip bump is likely a result of the source approaching a caustic cusp. These features in the anomaly is similar to those of KMT-2022-BLG-1787.
As expected due to the similarity in anomaly patterns, modeling the light curve of KMT-2022-BLG-1852 produced results consistent with those obtained for KMT-2022-BLG-1787: indicating the presence of a close planet within the lens system, and the anomaly being caused by the source traversing the planetary caustic followed by the passage through the region of minor-image perturbations. The modeling resulted in a single unique solution with planet parameters . A detailed list of the lensing parameters is provided in Table 5.
| Parameter | Value |
|---|---|
| (HJD′) | |
| (days) | |
| (10-3) | |
| (rad) | |
| (10-3) |
Figure 9 illustrates the configuration of the lens system. The configuration closely resembles that of KMT-2022-BLG-1787. One minor distinction is the direction of the source trajectory: in KMT-2022-BLG-1852, it is directed toward the right, while in KMT-2022-BLG-1787, it is directed toward the left. Despite the relatively low cadence, the first bump, which occurred as a result of the source crossing over the planetary caustic, was captured by the combined data sets. Consequently, the normalized source radius was measured to be , albeit with a relatively large uncertainty. As a somewhat technical point, the careful reader may have noticed that the two KMTC points on the night of HJD’=9812.xx (i.e., the caustic rise) are separated by just 3.4 hours, despite the nominal cadence of 5 hours for BLG36. Indeed such ”anomalously short” observation intervals are present in all neighboring nights. The reason for this is that during the second half of the season, KMTNet runs minute cycle of observations of its Eastern fields at the end of the night, that is, when the full set of KMT fields can no longer be observed because the Western fields have set. For typical fields with cadences of 1 hour or 2.5 hours, this results in a modest increase in coverage, but the effect is more dramatic for BLG36 because it has a 5-hour cadence. In this case, this end-of-night ”extra” point became one of only two points on the caustic, whose inclusion thus allowed for a good measurement of .

| Quantity | KMT-2020-BLG-0757 | KMT-2022-BLG-0732 | KMT-2022-BLG-1787 | KMT-2022-BLG-1852 |
|---|---|---|---|---|
| Source type | F9V | K3.5III | K3.5III | K2.5V (subgiant) |
| (as) | ||||
| (mas) | ||||
| (mas/yr) |
4 Source stars and angular Einstein radii
In this section, we provide details regarding the source stars involved in the individual lensing events. With the specified source type, we estimated the angular Einstein radius and relative lens-proper motion using the relations:
| (1) |
where represents the angular radius of the source. The normalized source radius was derived by examining the section of the light curve corresponding to caustic crossings, whereas the angular source radius was inferred from the type of the source. Given that all events exhibited anomalies involving caustic crossings, we were able to constrain the normalized source radii and subsequently the Einstein radii.

We determined the source type employing the methodology outlined in Yoo et al. (2004). According to this method, we first measured the instrumental color and magnitude, , of the source, and placed the source in the color-magnitude diagram (CMD) of stars lying near the source. The - and -band source magnitudes were determined by fitting the light curves of the corresponding bands to the model. This process utilized the data processed with the pyDIA code (Albrow et al., 2017). We then calibrated the color and magnitude using the centroid of the red giant clump (RGC) in the CMD as a reference, that is,
| (2) |
Here and respectively represent the reddening and extinction-corrected colors and magnitudes of the source and RGC centroid, and the term indicates the offsets in color and magnitude between the source and RGC centroid. The RGC centroid can be used as a reference for calibration because its de-reddened color and magnitude are known from Bensby et al. (2013) and Nataf et al. (2013), respectively.
Figure 10 shows the source stars and RGC centroids in the CMDs for the lensing events. Table 6 presents the values of , , , and for the events, along with the corresponding spectral types of the source stars. The spectral types inferred from the measured colors and magnitudes are F9V for KMT-2020-BLG-0757, K3.5III for KMT-2022-BLG-0732 and KMT-2022-BLG-1787, and K2.5 subgiant for KMT-2022-BLG-1852.
The angular source radius was determined based on the measured source color and magnitude. For this determination, we initially converted the color to color using the color-color relation provided by Bessell & Brett (1988). Subsequently, we utilized the – relationship established by Kervella et al. (2004) to infer the angular source radius. With the determined angular source radius, the Einstein radius and proper motion were calculated using the relations in Eq. (1). We present the estimated values of , and in Table 6. We further checked the information on the source stars in the Gaia catalog (Gaia Collaboration et al., 2018). For KMT-2022-BLG-0732 and KMT-2022-BLG-1787, we identified the source stars, while those of KMT-2020-BLG-0757 and KMT-2022-BLG-1852 were not registered in the catalog. Even for the events with identified source stars, only the -band magnitudes were available, with no information specifying the spectral types of the source stars.
| Quantity | KMT-2020-BLG-0757 | KMT-2022-BLG-0732 | KMT-2022-BLG-1787 | KMT-2022-BLG-1852 |
|---|---|---|---|---|
| () | ||||
| () | ||||
| (kpc) | ||||
| (AU) | ||||
5 Physical planet parameters
In this section, we derive estimates for the mass and distance of the discovered planetary systems. These physical lens parameters were derived from the lensing observables, namely the event timescale and the angular Einstein radius. These observables can provide constraints on the physical parameters because they are connected to and through the relationships represented as:
| (3) |
Here , represents the relative lens-source parallax, and denotes the source distance. The lens mass and distance can be uniquely determined by measuring an additional lensing observable of the microlens parallax through the relations given by Gould (2000) as:
| (4) |
The microlens-parallax vector is defined as , and its value can be determined by observing the subtle deformation of a lensing light curve, resulting from the deviation of the relative lens-source motion from rectilinear, caused by the orbital motion of Earth around the Sun: microlens-parallax effects (Gould, 1992). Because none of the events had a measured microlens parallax, we employed Bayesian analysis to estimate the lens parameters. This analysis incorporates the constraints provided by the measured lensing observables and together with priors of a Galaxy model and a mass function of objects within the Galaxy.


We carried out the Bayesian analysis according to the following procedure. In the initial stage, we conducted a Monte Carlo simulation to generate a large number of synthetic lensing events. Within this simulation, we extracted the distances to the lens and source, along with their relative proper motion from a Galactic model. Additionally, we derived the lens mass from a mass function model. Specifically, we employed the Galactic model outlined in Jung et al. (2021) to derive , , and , and adopted the mass function described in Jung et al. (2022). In the subsequent stage, we computed the lensing observables corresponding to the lens and source parameters utilizing the relationships in Eq. (4). Subsequently, we formed posterior distributions for and by assigning a weight to each synthetic event. This weight was determined by the expression:
| (5) |
where represent the time scale and Einstein radius of each synthetic event, denote the measured values, and are their uncertainties.
Figures 11 and 12 depict the posterior probability distributions for the lens masses and distances associated with the events. Table 7 provides a summary of the estimated masses of the host () and planet (), along with the distance and projected separation () between the planet and its host. For each parameter, the median value is presented as the central representative value, with the lower and upper limits determined as the 16% and 84% of the posterior distribution, respectively.
The identified planetary systems exhibit several common traits. Firstly, all planets orbit low-mass host stars, which are notably less massive than our Sun. The range of host star masses falls between and times the mass of the Sun. Secondly, the planets themselves are giants, exceeding the mass of Jupiter in our solar system within a range of to times the mass of Jupiter. Finally, all these planets are situated well beyond the ice line of their host stars, classifying them as ice giants.
Each panel of the posterior distributions separates the probability contributions from the disk and bulge lens populations using blue and red curves, respectively. The combined contribution is shown by the black curve. Table 7 details the probabilities for the disk () and bulge () populations. Notably, for KMT-2022-BLG-0732, the lens is more likely situated within the disk with a probability . Conversely, the remaining events exhibit a higher probability of residing in the bulge with probabilities .
6 Summary and conclusion
We conducted analyses of four microlensing events KMT-2020-BLG-0757, KMT-2022-BLG-0732, KMT-2022-BLG-1787, and KMT-2022-BLG-1852, for which the light curves commonly exhibit positive deviations and subsequent negative deviations. Unlike the usual brief anomalies observed in typical planetary microlensing events, the deviations in these events extend over a significant portion of the light curves. This prolonged deviation poses challenges in promptly identifying the presence of planets from the anomalies.
Our analysis revealed that each event’s anomaly was caused by a planetary companion situated within the Einstein ring of the primary star. The positive deviation of the anomaly was generated as the source traversed one of the planetary caustics induced by a close planet, while the negative deviation occurred as the source passed through the extended region of minor-image perturbations.
Upon estimating the physical parameters using the measured lensing observables of the events, we found several common features among the identified planetary systems. First, all the planets orbit low-mass host stars, significantly less massive than our Sun, ranging from 0.32 to 0.58 solar masses. Second, these planets themselves are classified as giants, exceeding the mass of Jupiter in our solar system, with masses ranging from 1.1 to 10.7 times Jupiter’s mass. Finally, all the planets reside well beyond the ice line of their host stars, making them ice giants.
Acknowledgements.
Work by C.H. was supported by the grants of National Research Foundation of Korea (2019R1A2C2085965). This research has made use of the KMTNet system operated by the Korea Astronomy and Space Science Institute (KASI) at three host sites of CTIO in Chile, SAAO in South Africa, and SSO in Australia. Data transfer from the host site to KASI was supported by the Korea Research Environment Open NETwork (KREONET). This research was supported by the Korea Astronomy and Space Science Institute under the R&D program (Project No. 2023-1-832-03) supervised by the Ministry of Science and ICT. The MOA project is supported by JSPS KAKENHI Grant Number JP24253004, JP26247023, JP23340064, JP15H00781, JP16H06287, JP17H02871 and JP22H00153. J.C.Y., I.G.S., and S.J.C. acknowledge support from NSF Grant No. AST-2108414. Y.S. acknowledges support from NSF Grant No. 2020740. C.R. was supported by the Research fellowship of the Alexander von Humboldt Foundation. This work was authored by employees of Caltech/IPAC under Contract No. 80GSFC21R0032 with the National Aeronautics and Space Administration. V.B. is supported by PRIN 2022 CUP D53D23002590006. R.F.J. acknowledges support for this project provided by ANID’s Millennium Science Initiative through grant ICN12_009, awarded to the Millennium Institute of Astrophysics (MAS), and by ANID’s Basal project FB210003. This project has received funding from the European Union’s Horizon 2020 research and innovation program under grant agreement No. 101004719 (OPTICON - RadioNet Pilot). This work is supported by the Polish MNiSW grant DIR/WK/2018/12.References
- Albrow et al. (2009) Albrow, M., Horne, K., Bramich, D. M., et al. 2009, MNRAS, 397, 2099
- Albrow et al. (2017) Albrow, M. 2017, MichaelDAlbrow/pyDIA: Initial Release on Github,Versionv1.0.0, Zenodo, doi:10.5281/zenodo.268049
- Batista et al. (2011) Batista, V., Gould, A., Dieters, S., et al. 2011, A&A, 529, A102
- Bensby et al. (2013) Bensby, T. Yee, J.C., Feltzing, S. et al. 2013, A&A, 549, A147
- Bessell & Brett (1988) Bessell, M. S., & Brett, J. M. 1988, PASP, 100, 1134
- Bond et al. (2001) Bond, I. A., Abe, F., Dodd, R. J., et al. 2001, MNRAS, 327, 868
- Brown et al. (2013) Brown, T. M., Baliber, N., Bianco, F. B., et al. 2013, PASP, 125, 1031
- Chung et al. (2005) Chung, S.-J., Han, C., Park, B.-G., et al. 2005, ApJ, 630, 535
- Dominik (1999) Dominik, M. 1999, A&A, 349, 108
- Gaudi & Gould (1997) Gaudi, B. S., & Gould, A. 1997, ApJ, 486, 85
- Gaia Collaboration et al. (2018) Gaia Collaboration, Brown, A. G. A., Vallenari, A., et al. 2018, A&A, 616, A1
- Gould (1992) Gould, A. 1992, ApJ, 392, 442
- Gould & Loeb (1992) Gould, A., & Loeb, L. 1992, ApJ, 396, 104
- Gould (2000) Gould, A. 2000, ApJ, 542, 785
- Griest & Safizadeh (1998) Griest, K., & Safizadeh, N. 1998, ApJ, 500, 37
- Han (2006) Han, C. 2006, ApJ, 638, 1080
- Han et al. (2016) Han, C., Udalski, A., Gould, A., et al. 2016, AJ, 152, 95
- Han et al. (2017) Han, C., Udalski, A., Gould, A., et al. 2017, AJ, 154, 133
- Han et al. (2021a) Han, C., Udalski, A., Kim, D., et al. 2021a, A&A, 650, A89
- Han et al. (2021b) Han, C., Udalski, A., Kim, D., et al. 2021b, A&A, 655, A21
- Han et al. (2023) Han, C., Udalski, A., Jung, Y. K., et al. 2023 A&A, 670, A172
- Han et al. (2024) Han, C., Jung, Y. K., Bond, I. A., et al. 2024, A&A, 683, A115
- Jung et al. (2021) Jung, Y. K., Han, C., Udalski, A., et al. 2021, AJ, 161, 293
- Jung et al. (2022) Jung, Y. K., Zang, W., Han, C., et al. 2022, AJ, 164, 262
- Kervella et al. (2004) Kervella, P., Thévenin, F., Di Folco, E., & Ségransan, D. 2004, A&A, 426, 29
- Koshimoto et al. (2017) Koshimoto, N., Shvartzvald, Y., Bennett, D. P., et al. 2017, AJ, 154, 3
- Kim et al. (2016) Kim, S.-L., Lee, C.-U., Park, B.-G., et al. 2016, JKAS, 49, 37
- Mao & Paczyński (1991) Mao, S., & Paczyński, B. 1991, ApJ, 374, 37
- McCully et al. (2018) McCully, C. Volgenau, N. H., Harbeck, D.-R., et al. 2018, SPIE Proceedings Volume 10707, Software and Cyberinfrastructure for Astronomy V, 107070
- Nataf et al. (2013) Nataf, D. M., Gould, A., Fouqué, P. et al. 2013, ApJ, 769, 88
- Poleski et al. (2017) Poleski, R., Udalski, A., Bond, I. A., et al. 2017, A&A, 604, A103
- Shin et al. (2019) Shin, I.-G., Ryu, Y.-H.m Yee, J. C., et al. 2019, AJ, 157, 146
- Yang et al. (2024) Yang, H., Yee, J. C., Hwang, K.-H., et al. 2024, MNRAS, 528, 11
- Yee et al. (2012) Yee, J. C., Shvartzvald, Y., Gal-Yam, A., et al. 2012, ApJ, 755, 102
- Yoo et al. (2004) Yoo, J., DePoy, D.L., Gal-Yam, A. et al. 2004, ApJ, 603, 139