Fourier analysis of spatial point processes
Abstract
In this article, we develop comprehensive frequency domain methods for estimating and inferring the second-order structure of spatial point processes. The main element here is on utilizing the discrete Fourier transform (DFT) of the point pattern and its tapered counterpart. Under second-order stationarity, we show that both the DFTs and the tapered DFTs are asymptotically jointly independent Gaussian even when the DFTs share the same limiting frequencies. Based on these results, we establish an -mixing central limit theorem for a statistic formulated as a quadratic form of the tapered DFT. As applications, we derive the asymptotic distribution of the kernel spectral density estimator and establish a frequency domain inferential method for parametric stationary point processes. For the latter, the resulting model parameter estimator is computationally tractable and yields meaningful interpretations even in the case of model misspecification. We investigate the finite sample performance of our estimator through simulations, considering scenarios of both correctly specified and misspecified models.
Keywords and phrases: Bartlett’s spectrum, data tapering, discrete Fourier transform, inhomogeneous point processes, stationary point processes, Whittle likelihood.
1 Introduction
Spatial point patterns, which are collections of events in space, are increasingly common across various disciplines, including seismology (Zhuang et al. (2004)), epidemiology (Gabriel and Diggle (2009)), ecology (Warton and Shepherd (2010)), and network analysis (D’Angelo et al. (2022)). A common assumption when analyzing such point patterns is that the underlying spatial point process is second-order stationary or second-order intensity reweighted stationary (Baddeley et al. (2000)). Under these assumptions, a majority of estimation procedures for the second-order structure of a spatial point process can be conducted through well-established tools in the spatial domain, such as the pair correlation function and -function (Illian et al. (2008); Waagepetersen and Guan (2009)). For a comprehensive review of spatial domain approaches, we refer the readers to Møller and Waagepetersen (2004), Chapter 4.
However, considerably less attention has been devoted to estimations in the frequency domain. In his pioneering work, Bartlett (1964) defined the spectral density function of a second-order stationary point process in two-dimensional space and proposed using the periodogram, a squared modulus of the discrete Fourier transform (DFT), as an estimator of the spectral density. For practical implementations, Mugglestone and Renshaw (1996) provided a guide to using periodograms with illustrative examples. Rajala et al. (2023) derived detailed calculations for the first- and second-order moments of the DFTs and periodograms for fixed frequencies. Despite these advances, theoretical properties of DFTs and periodograms remain largely unexplored. For example, fundamental properties for the DFTs of time series, such as asymptotic uncorrelatedness and asymptotic joint normality of the DFTs (cf. Brillinger (1981), Chapters 4.3 and 4.4), are yet to be rigorously investigated in the spatial point process setting.
One inherent challenge in conducting spectral analysis of spatial point processes is that spatial point patterns are irregularly scattered. As such, theoretical tools designed for time series data or spatial gridded data cannot be readily extended to the spatial point process setting. One potential solution is to discretize the (spatial or temporal) point pattern using regular bins. This approach allows the application of classical spectral methods from the “regular” time series or random fields to the aggregated count data. For example, Cheysson and Lang (2022) developed a frequency domain parameter estimation method for the one-dimentional stationary binned Hawkes process (refer to Section 5.1 below for details on the Hawkes process). See also Shlomovich et al. (2022) for the use of the binned Hawkes process to estimate the parameters in the spatial domain. However, aggregating events may introduce additional errors, and there is no theoretical result for binned count processes beyond the stationary Hawkes process case.
In this article, instead of focusing on the discretized count data, we aim to present a new frequency domain approach for spatial point processes utilizing the “complete” information in the process. In Section 2, we cover relevant terminologies (Section 2.1), review the concept of the DFT and periodogram incorporating data tapering (Section 2.2), and provide features contained in the spectral density functions and periodograms with illustrations (Section 2.3). Building on these concepts, we show in Section 3.1 that under an increasing domain framework and an -mixing condition, the DFTs are asymptotically jointly Gaussian, even when the DFTs share the same limiting frequencies. Therefore, our asymptotic results extend those of Rajala et al. (2023), who considered only fixed frequencies, enabling us to quantify statistics written in terms of the integrated periodogram (we will elaborate on this below).
A crucial aspect of showing asymptotic joint normality of the DFTs is utilizing spectral analysis tools for irregularly spaced spatial data. Matsuda and Yajima (2009) proposed a novel framework to define the DFT for irregularly spaced spatial data, where the observation locations are generated from a probability distribution on the observation domain. Intriguingly, the DFTs for spatial point processes and those for irregularly spaced spatial data exhibit similar structures. Therefore, tools developed for irregularly spaced spatial data, such as those by Bandyopadhyay and Lahiri (2009) and Subba Rao (2018), are also useful in spatial point process setting.
Despite the aforementioned similarities, it is important to note that the stochastic mechanisms generating spatial point patterns and irregularly spaced spatial data are very different. The former considers the number of events in a fixed area being random, while the latter determines a (deterministic) number of sampling locations at which the random field is observed. Moreover, from a technical point of view, unlike the random field case, the spectral density function of the spatial point process, as given in (2.5) below, is not absolutely integrable. Therefore, the interchange of summations in the expansions of covariances and cumulants of the DFTs is not straightforward. To reconcile the differences between the spatial point process and irregularly spaced spatial data settings, we introduce in Sections 3.1 and 4 several new assumptions tailored to the spatial point process setting. In Section 5, we verify these assumptions for four widely used point process models, namely the Hawkes process, Neyman-Scott point process, log-Gaussian Cox process, and determinantal point process.
Expanding on the theoretical properties of the DFTs for spatial point processes, we also consider parameter estimations. Our main interest lies in parameters expressed in terms of the spectral mean of the form , where is a prespecified compact region and is a continuous function on . To estimate the spectral mean, we employ the integrated periodogram as defined in (4.1) below. Parameters and estimators in this nature were first considered in Parzen (1957) and have since garnered great attention in the time series literature, given that both the kernel spectral density and autocovariance estimator take this general form. In Section 4, we derive the central limit theorem (CLT) for the integrated periodogram under an -mixing condition. We note that since the integrated periodogram is written as a quadratic form of the DFTs, one cannot directly use the standard techniques to show the CLT for -mixed point processes, as reviewed in Biscio and Waagepetersen (2019), Section 1. Instead, we use a series of approximation techniques to prove the CLT for the integrated periodogram. See Appendices A.4 and F in the Supplementary Material for details. As a direct application, in Theorem 4.2, we derive the asymptotic distribution of the kernel spectral density estimator.
Another major application of the integrated periodogram is the model parameter estimation. Whittle (1953) introduced the periodogram-based approximation of the Gaussian likelihood for stationary time series. Subsequently, the concept of Whittle likelihood was extended to lattice (Guyon (1982); Dahlhaus and Künsch (1987)) and irregularly spaced spatial data (Matsuda and Yajima (2009); Subba Rao (2018)). In Section 6, we develop a procedure to fit parametric spatial point process models based on the Whittle-type likelihood (hereafter, just Whittle likelihood) and obtain sampling properties of the resulting estimator. A noteworthy aspect of our estimator is that it not only estimates the true parameter when the model is correctly specified but also estimates the best fitting parameter when the model is misspecified, where “best” is defined in terms of the spectral divergence criterion. While misspecified first-order intensity models have been considered (e.g., Choiruddin et al. (2021)), as far as we aware, our result is the first attempt that studies both the first- and second-order model misspecifications for (stationary) spatial point processes. In Section 7, we compare the performances of our estimator and two existing estimation methods in the spatial domain through simulations.
Lastly, proofs, auxiliary results, and additional simulations can be found in the Supplementary Material, Yang and Guan (2024) (hereafter, just Appendix).
2 Spectral density functions for the second-order stationary point processes
2.1 Preliminaries
In this section, we introduce the notation used throughout the article and review terminologies related to the mathematical presentation of spatial point processes.
Let and let and be the real and complex fields, respectively. For a set , denotes the cardinality of and () denotes a set containing all -tuples of pairwise disjoint points in . For a vector , , , and denote the norm, Euclidean norm, and maximum norm, respectively. For vectors and in , and , provided . Now we define functional spaces. For and , denotes the set of all measurable functions such that . For in either or , the Fourier transform and the inverse Fourier transform are respectively defined as
Throughout this article, let be a simple spatial point process defined on . Then, the th-order intensity function (also known as the product density function) of , denoted as , satisfies the following identity
| (2.1) |
for any positive measurable function . Next, we define the cumulant intensity functions. For , let be the set of all partitions of and for (), let . Then, the th-order cumulant intensity function (cf. Brillinger (1981), Chapter 2.3) of is defined as
| (2.2) |
2.2 Spectral density function and its estimator
From now onwards, we assume that is a th-order stationary () point process. An extension to the nonstationary point process case will be discussed in Section I. Under the th-order stationarity, we can define the th-order reduced intensity functions as follows:
| (2.3) |
The th-order reduced cumulant intensity function, denoted as , is defined similarly, but replacing with in (2.3). In particular, when , we use the common notation and refer to it as the (constant) first-order intensity.
Next, the complete covariance function of at two locations (which are not necessarily distinct) in the sense of Bartlett (1964) is defined as
| (2.4) |
where is the Dirac-delta function. Heuristically, is the covariance density of and , where is the counting measure induced by and is an infinitesimal region in that contains . Provided that , we can define the non-negative valued spectral density function of by the inverse Fourier transform of as
| (2.5) |
Here, we use (2.4) in the second identity. See Daley and Vere-Jones (2003), Sections 8.2 for the mathematical construction of Bartlett’s spectral density function.
To estimate the spectral density function, we assume that the point process is observed within a compact domain (window) of the form
| (2.6) |
where for , is an increasing sequence of positive numbers. Now, we define the DFT of the observed point pattern that incorporates data tapering—a commonly used approach to mitigate the bias inherent in the periodogram (Tukey (1967)). Let be a non-negative data taper on with compact support . For a domain of form (2.6), let
| (2.7) |
where . Let , . Throughout the article, we assume , . Using these notation, the DFT incorporating data taper is defined as
| (2.8) |
where denotes the volume of . We note that by setting on , the tapered DFT above encompasses the non-tapered DFT
| (2.9) |
Unless otherwise specified, we will use the term “DFT” to indicate the tapered DFT defined as in (2.8). Unlike the classical setting in time series or random fields, the DFT is not centered. By applying (2.1), it can be easily seen that , where
| (2.10) |
is the bias factor. Therefore, the centered DFT is defined as
| (2.11) |
To estimate the unknown first-order intensity, the feasible criterion of becomes
| (2.12) |
where () is an unbiased estimator of .
Finally, we define the periodogram and its feasible criterion respectively by
| (2.13) |
2.3 Features of the spectral density functions and their estimators
To motivate the spectral approaches for spatial point processes, the top panel of Figure 1 display four spatial point patterns on the observation domain . These patterns are generated from four different stationary isotropic point process models, exhibiting clustering behaviors in realizations A and B but repulsive behaviors in realizations C and D. All four models share the same first-order intensity, set at 0.5. In the middle panel of Figure 1, we plot the pair correlation function (PCF; middle left) and spectral density function (middle right) for each process.
Realizations
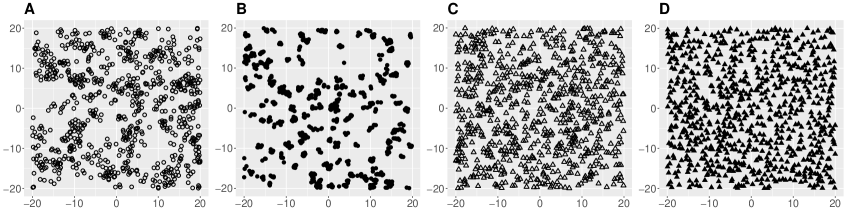
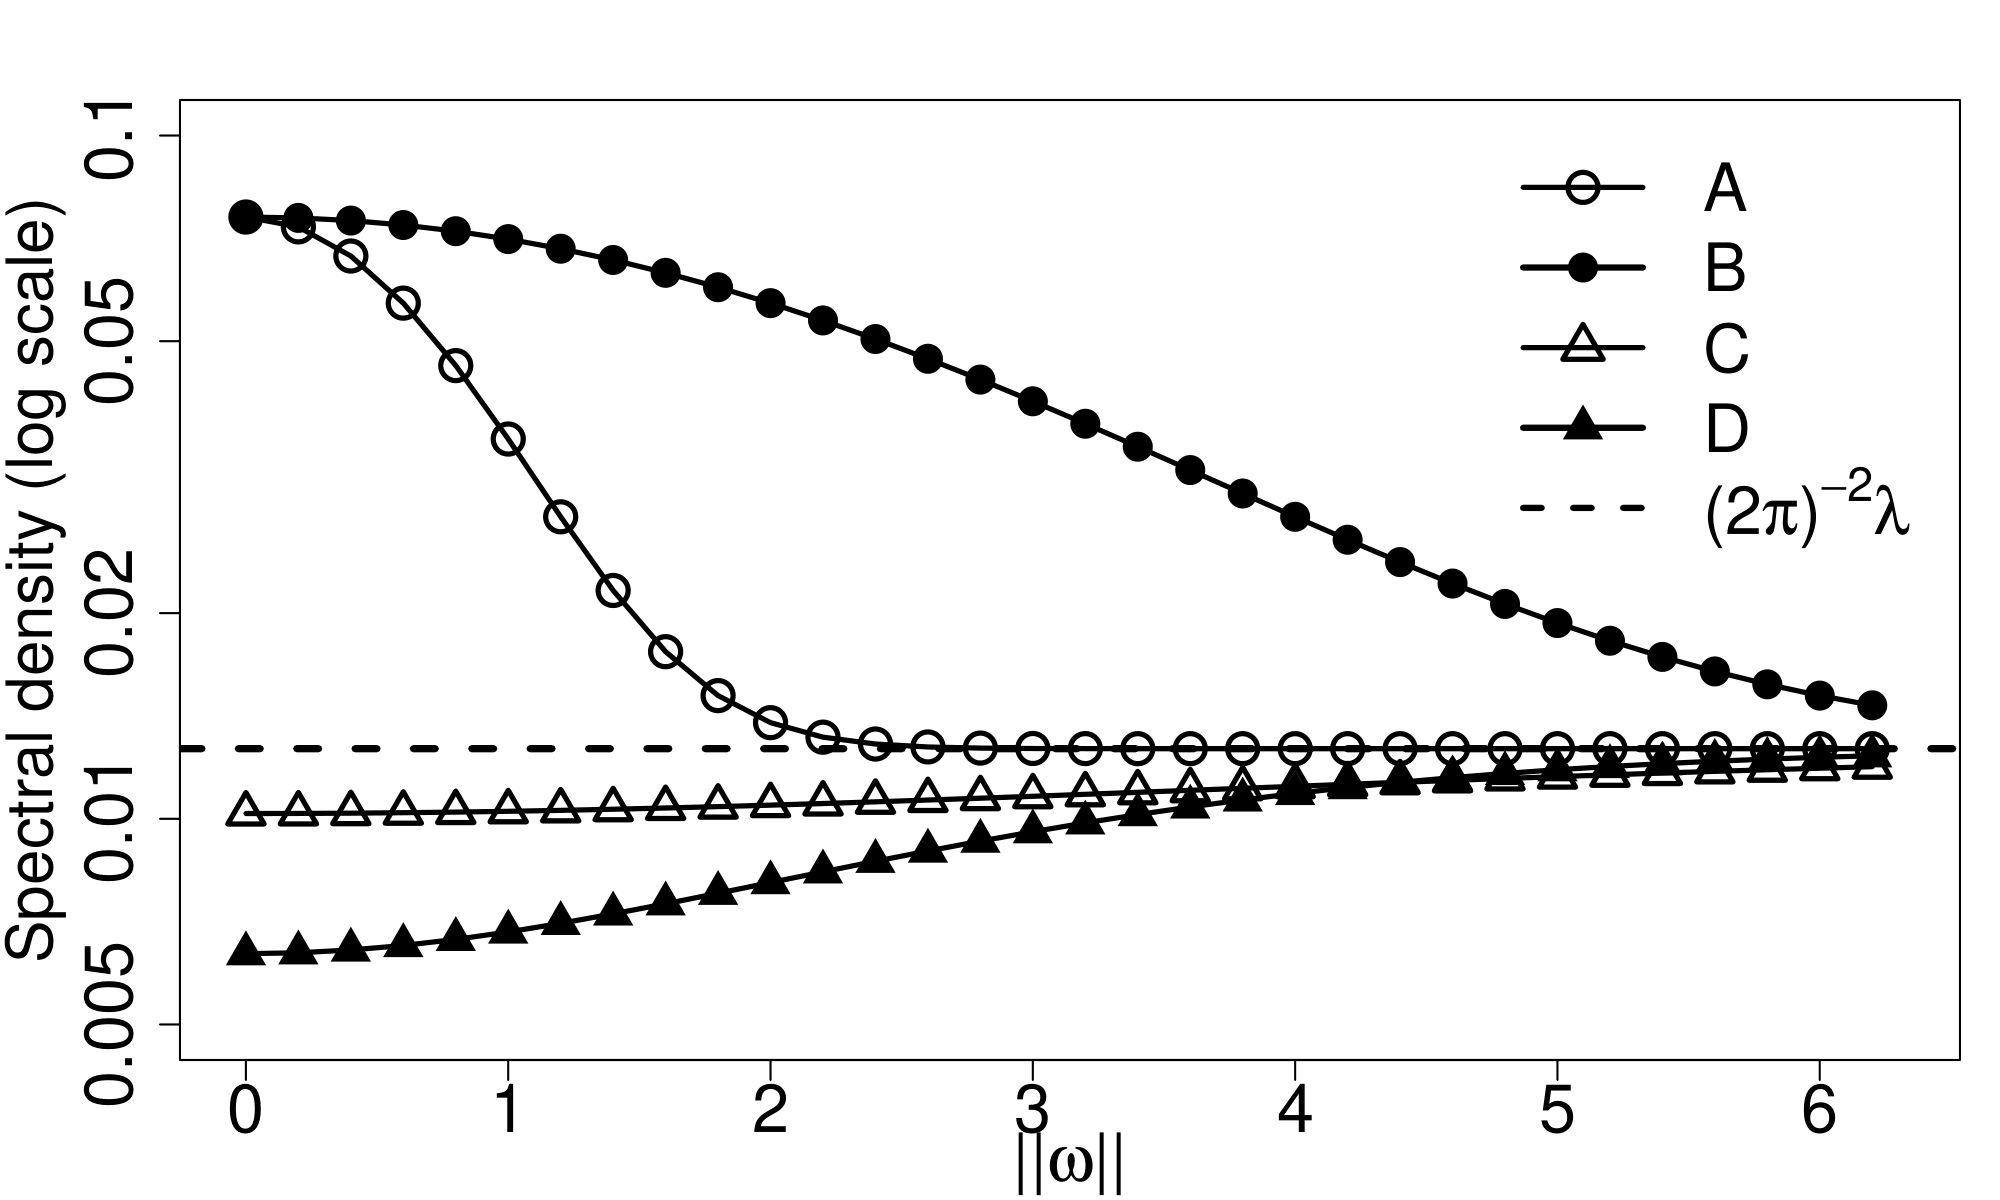
Pair correlation functions and spectral density functions

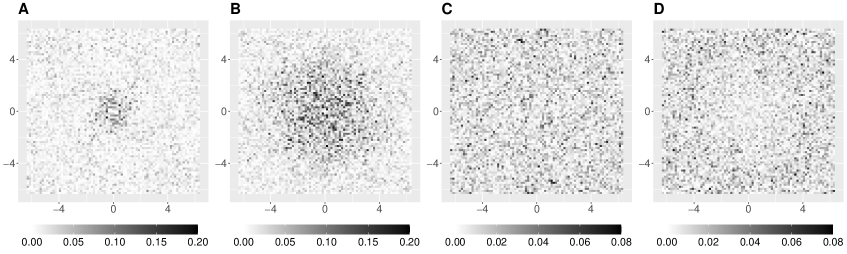
Periodograms
We now investigate how the features of the spatial point patterns are reflected in the spectral density functions. Since the PCF , by using (2.5), we have
| (2.14) |
Given the uniqueness of the Fourier transform, the information contained in the spectral density function can be fully recovered from the first-order intensity and the PCF, and vice versa. However, while the PCF captures only ”local” information of the point process at a certain lag , the spectral density function encapsulates ”global” information of the point process, including the first-order intensity (at high frequencies) and overall clustering/repulsive behavior (at low frequencies).
High frequency information. Assuming (which is equivalent to the Assumption 3.2 for below), (2.14) implies . Therefore, at high frequencies, the spectral density function contains information about the first-order intensity.
Low frequency information. Note, (resp. ) implies the clustering (resp. repulsive) behavior at the fixed lag . In the frequency domain, by using (2.14), we have for . Therefore, the spectral density function evaluated at low frequencies above (resp. below) the asymptote indicates the “overall” clustering (resp. repulsive) behavior of the point process.
Rate of convergence. Comparing the clustered or repulsive realizations, realization B is more clustered than A while realization D is more repulsive than C. Reflected from the PCFs of the associated models, the PCF of model B is larger at small lag distances but drops more rapidly as the lag distance increases when compared to that of model A, while the PCF of model D is smaller than that of model C. In the frequency domain, one can also extract information on the quality of the clustering and repulsive behaviors. Since the decaying rate of the Fourier transform is related to the smoothness of the original function (cf. Folland (1999), Theorem 8.22), the faster (resp. slower) convergence of the spectral density to the asymptote implies a smoother (resp. rougher) PCF.
Properties of the periodogram. Lastly, we discuss properties of the periodogram as a raw estimator of the spectral density function. The bottom panel of Figure 1 plots the periodograms for realizations A–D. Using a computational method described in Appendix H.2, it takes less than 0.06 seconds to evaluate the periodograms on a grid of frequencies for each model. We observe that for all realizations, the periodograms follow the trend of the corresponding spectral density functions. However, the periodograms are very noisy, indicating that uncorrelated noise fluctuations are added to the trend. We rigorously investigate theoretical properties of the periodograms in Theorem 3.1 below. To obtain a consistent estimator of the spectral density function, one can locally smooth the periodogram. Detailed computations of the smoothed periodogram with illustrations can be found in Appendix H.1 and the theoretical results for the smoothed periodogram are presented in Sections 3.2 and 4.
3 Asymptotic properties of the DFT and periodogram
3.1 Asymptotic results
In this section, we investigate asymptotic properties of the DFT and periodogram. To do so, we require the following sets of assumptions.
The first assumption is on the increasing-domain asymptotic framework.
Assumption 3.1.
Let () be a sequence of increasing windows of form (2.6) with . Moreover, grows with the same speed in all coordinates of :
| (3.1) |
The next assumption is on the higher-order cumulants of .
Assumption 3.2.
Let be fixed. For , the cumulant density function in (2.2) is well-defined and
| (3.2) |
For an th-order stationary process, Assumption 3.2 can be equivalently expressed as , .
The next assumption concerns the -mixing coefficient of that was first introduced by Rosenblatt (1956). For compact and convex subsets , let . Then, for , the -mixing coefficient of is defined as
| (3.3) | ||||
where denotes the -field generated by in .
Assumption 3.3.
Let be the -mixing coefficient of defined in (3.3). We assume one of the following two conditions.
-
(i)
There exists such that as .
-
(ii)
There exists such that as .
The last set of assumptions is on the data taper.
Assumption 3.4.
The data taper , , is non-negative and has a compact support on . Moreover, satisfies one of the following two conditions below.
-
(i)
is continuous on .
-
(ii)
Let be fixed. For with , exists and is continuous on .
Assumption 3.4(i) encompasses the non-taper case, i.e., on . Assumption 3.4(ii) for is used to show the -asymptotic normality of the integrated periodogram. To be more precise, it is required to show the Fourier transform of is absolutely integrable on . As an alternative condition, one can use a slightly different condition:
| exists for any . | (3.4) |
Our theoretical results remain unchanged when substituting Assumption 3.4(ii) for with (3.4). An example of a data taper that satisfies (3.4) is provided in (7.1). According to our simulation results in Section 7, the choice of data taper does not seem to affect the performance of the periodogram-based estimator.
Using the aformentioned sets of assumptions, we now establish the asymptotic joint distribution of the feasible criteria of the DFTs and periodograms. Recall (2.10) and (2.12). It is easily seen that . Consequently, we exclude the frequency at the origin. Next, we introduce the concept of asymptotically distant frequencies by Bandyopadhyay and Lahiri (2009). For two sequences of frequencies and on , we say and are asymptotically distant if
Now, we compute the limit of and for two asymptotically distant frequencies.
Theorem 3.1 (Asymptotic uncorrelatedness of the DFT and periodogram).
Let be a second-order stationary point process on . Suppose that Assumptions 3.1, 3.2 (for ), and 3.4(i) hold. Let and be sequences on such that , , and are pairwise asymptotically distant. Moreover, let be a sequence that is asymptotically distant from and converges to the fixed frequency . Then,
| (3.5) | |||
| (3.6) |
If we further assume Assumption 3.2 for holds and and are asymptotically distant, then
| (3.7) |
Proof.
See Appendix B.1. ∎
By using the aforementioned moment properties in conjunction with the -mixing condition, we derive the asymptotic joint distribution of the DFTs and periodograms.
Theorem 3.2 (Asymptotic joint distribution of the DFTs and periodograms).
Let be a second-order stationary point process on . Suppose that Assumptions 3.1, 3.2 (for ), 3.3(i), and 3.4(i) hold. For a fixed , , …, denote sequences on that satisfy the following three conditions: for ,
-
(1)
.
-
(2)
is asymptotically distant from .
-
(3)
and are asymptotically distant from .
Then, we have
where denotes weak convergence and are independent standard normal random variables on . Therefore, by using the continunous mapping theorem, we have
where are independent chi-squared random variables with degrees of freedom two.
Proof.
See Appendix B.2. ∎
Remark 3.1.
The limit frequencies need not be distinct nor nonzero, as long as the sequences satisfy the conditions (1)–(3) in Theorem 3.2.
3.2 Nonparametric kernel spectral density estimator
We observe from Theorem 3.1 that , . Therefore, the periodogram is an inconsistent estimator of the spectral density function. In this section, we obtain a consistent estimator of the spectral density function via periodogram smoothing.
Let be a positive continuous and symmetric kernel function with compact support on , satisfying and . For a bandwidth , let , . For ease of presentation, we set . Thus, we write , . Now, we define the kernel spectral density estimator by
| (3.8) |
Below, we show that consistently estimates the spectral density function.
Theorem 3.3.
Proof.
See Appendix B.3. ∎
4 Estimation of the spectral mean statistics
Let be a prespecified compact region on that does not depend on the index . For a real continuous function on , our goal is to estimate parameter written in terms of the the spectral mean on :
| (4.1) |
A natural estimator of is the integrated periodogram
| (4.2) |
We briefly mention two examples of estimation problems for spatial point processes that fall under the above framework. First, let , where is a kernel function with bandwidth as in Section 3.2. Since is locally constant in a small neighborhood of , as , we have . Thus, , as in (3.8), is our non-parametric estimator of the spectral density. Second, let , where is a family of spectral density functions with parameter . Then, denotes the spectral divergence between and . An estimator of the spectral divergence is given by , which we refer to as the Whittle likelihood. Please see Section 6 for further details on the Whittle likelihood and the resulting model parameter estimation.
To derive the asymptotic properties of the integrated periodogram, we note that the variance expression of involves the fourth-order cumulant term of . To obtain a simple limiting variance expression of , we assume that is fourth-order stationary, thus both and in (2.3) are well-defined for . Following an argument similar to Bartlett (1964), we introduce the complete fourth-order reduced cumulant density function, denoted as . Heuristically, this function is defined as a cumulant density function of , , , and , where may not necessarily be distinct. Explicitly, can be written as a sum of reduced cumulant intensity functions of orders up to four. See (D.14) in the Appendix for a precise expression. Therefore, under Assumption 3.2 for , it can be easily seen that , in turn, the fourth-order spectral density of can be defined as an inverse Fourier transform of
| (4.3) |
for . We now introduce the following assumptions on and . For , let be the th-order partial derivative.
Assumption 4.1.
Suppose the spectral density function of is well-defined for all . Moreover, satisfies the following: (i) and (ii) for with , exists for and .
We make two remarks on the above assumptions. Firstly, we observe from (2.5) that is not absolutely integrable. Instead, given Assumption 4.1(i), the spectral density function, when appropriately “shifted”, admits the Fourier transformation
| (4.4) |
Secondly, for some parametric models (e.g., the log-Gaussian Cox processes in Section 5.3 below), a closed-form expression for is not available, while has an analytic form. In this case, a sufficient condition for Assumption 4.1(i) to hold is that has continuous partial derivatives up to order , as per Folland (1999), Theorem 8.22 (see also page 257 of the same reference). Moreover, since , Assumption 4.1(ii) holds if .
Assumption 4.2.
Suppose that , is well-defined for all . Moreover, satisfies the following: (i) and (ii) is twice partial differentiable with respect to and the second-order partial derivative is bounded above.
By using the same auguments above, sufficient conditions for Assumption 4.2 to hold in terms of the differentiability and integrability of () also can be easily derived.
Now, we are ready to state our main theorem addressing the asymptotic normality of .
Theorem 4.1 (Asymptotic distribution of the integrated periodogram).
Let be a fourth-order stationary point process on , that is, (2.3) is satisfied for . Then, the following three assertions hold.
- (i)
- (ii)
- (iii)
Proof.
See Appendix A. ∎
Remark 4.1 (Estimation of the asymptotic variance).
Since and above are unknown functions of the spectral density and fourth-order spectral density function, the asymptotic variance of needs to be estimated. In Appendix G, we provide details on the estimation of using the subsampling method.
As a direct application of the above theorem, we derive the asymptotic distribution of the kernel spectral density estimator. Recall (3.8).
Theorem 4.2.
Proof.
See Appendix B.4. ∎
5 Examples of spatial point process models
In this section, we provide examples of four widely used stationary spatial point process models and specify the conditions under which each model satisfies Assumptions 3.2, 3.3, and 4.1, which are required to establish the asymptotic results in Sections 3 and 4.
5.1 Example I: Hawkes processes
The Hawkes process is a doubly stochastic process on characterized by self-exciting and clustering properties (Hawkes (1971a, b)). A stationary Hawkes process is described by a conditional intensity function of the form , . Here, is the immigration intensity and is a measurable function satisfying , referred to as the reproduction function. The spectral density function of the Hawkes process, as stated in Daley and Vere-Jones (2003), Example 8.2(e), is given by , . Here, denotes the first-order intensity of the corresponding Hawkes process.
To verify Assumption 3.2 for Hawkes processes, Jovanović et al. (2015) provides explicit expressions of the cumulant intensity functions, thus one can check (3.2) for the specified cumulant intensity functions. To assess the -mixing conditions, Cheysson and Lang (2022), Theorem 1, states that if , for some , then , as . Therefore, if has a th-moment (resp. th-moment) for some , then the corresponding Hawkes process satisfies Assumption 3.3(i) (resp. 3.3(ii)). Lastly, to check for Assumption 4.1, one can employ the expression of , provided the Fourier transform of has a closed form expression. For example, if the reproduction function has a form for some , then , . Therefore, the defined satisfies Assumption 4.1.
5.2 Example II: Neyman-Scott point processes
A Neyman-Scott (N-S) process (Neyman and Scott (1958)) is a special class of the Cox process, where the random latent intensity field is given by , . Here, is a homogeneous Poisson process with intensity and is a probability density (kernel) function on . Common choices for include and , where is the volume of the unit ball on . The corresponding N-S process for the kernel functions and are known as the Thomas cluster process and Matérn cluster process. Using, for example, Chandler (1997), Equation (37) (see also Daley and Vere-Jones (2003), Exercise 8.2.9(c)), the spectral density function for the N-S process is given by , , where denotes the first-order intensity of the corresponding N-S process. In particular, the spectral density function of the Thomas cluster process is given by
| (5.1) |
Prokešová and Jensen (2013) (page 398) showed that the N-S process satisfies Assumption 3.2 for all . Moreover, according to Lemma 1 of the same reference, if as for some (resp. ), then the corresponding N-S process satisfies Assumption 3.3(i) (resp. 3.3(ii)). Assumption 4.1 can be verified for specific kernel functions with known forms of their Fourier transform. In particular, spectral density functions associated with Thomas cluster processes and Matérn cluster processes satisfy Assumption 4.1.
5.3 Example III: Log-Gaussian Cox Processes
The log-Gaussian Cox process (LGCP; Møller et al. (1998)) is a special class of the Cox process where the logarithm of the intensify field is a Gaussian random field. Let be a stationary LGCP driven by the intensity field and let , , be the autocovariance function of the log intensity field. Then, by using Møller et al. (1998), Equation (4), the second-order reduced cumulant is given by , .
Assumption 3.2 holds for arbitrary , provided . See Zhu et al. (2023), Lemma D.1. Concerning Assumption 3.3, Doukhan (1994), page 59, stated that for a stationary random field on , if as for some (resp. ), then the corresponding LGCP on satisfies Assumption 3.3(i) (resp. 3.3(ii)). However, a general -mixing condition for stationary Gaussian random fields on is not readily available. Lastly, since the second-order reduced cumulant function has a closed-form expression in terms of , Assumption 4.1 can be easily verified when is specified (see the remarks after Assumption 4.1).
5.4 Example IV: Determinantal point processes
The Determinantal point process (DPP), first introduced by Macchi (1975), has the intensity function characterized by the determinant of some function. To be specific, a stationary determinantal point process induced by a kernel function , denoted as DPP(), has the reduced intensity function , , . Here, we assume that the kernel function is symmetric, continuous, and belongs to satisfying , . Then, the second-order reduced cumulant function and the spectral density function of DPP() are respectively given by and . Therefore, the DPPs exhibit a repulsive behavior. For example, choosing the Gaussian kernel with parameter restriction , the spectral density function corresponds to is given by
| (5.2) |
Biscio and Lavancier (2016) showed that DPP() satisfies Assumption 3.2 for any . Moreover, Poinas et al. (2019) showed , . Therefore, if there exists (resp. ) such that as , then DPP() satisfies Assumption 3.3(i) (resp. 3.3(ii)). Therefore, DPP with the Gaussian kernel satisfies Assumption 3.3(ii). Lastly, Assumption 4.1 can be verified provided has a known Fourier transform, including the case of in (5.2).
6 Frequency domain parameter estimation under possible model misspecification
As an application of the CLT results in Section 4, we turn our attention to inferences for spatial point processes in the frequency domain through the Whittle likelihood. Let be a family of second-order stationary spatial point processes with parameter . The associated spectral density function of is denoted as , . Then, we fit the model with spectral density using the pseudo-likelihood given by
| (6.1) |
Here, is a prespecified compact and symmetric region on . Let
| (6.2) |
be our proposed model parameter estimator. Here, we do not necessarily assuming the existence of such that the true spectral density function . Since the periodogram is an unbiased estimator of the “true” spectral density, the best fitting parameter could be
| (6.3) |
The best fitting parameter has a clear interpretation in terms of the spectral divergence criterion, as above computes the spectral (information) divergence between the true and conjectured spectral densities. Investigations into the properties of the Whittle estimator under model misspecification for time series and random fields can be found in Dahlhaus and Wefelmeyer (1996); Dahlhaus and Sahm (2000); Subba Rao and Yang (2021). We mention that, in the case where the mapping is injective and the model is correctly specified, it can be easily seen that is uniquely determined and satisfies .
Now, we assume the following for the parameter space.
Assumption 6.1.
The parameter space is a compact subset of , . The parametric family of spectral density functions is uniformly bounded above and bounded below from zero. is twice differentiable with respect to and its first and second derivatives are continuous on . in (6.3) is uniquely determined and lies in the interior of . Lastly, in (6.2) exists for all and lies in the interior of .
To obtain the asymptotic variance of , for , let
| (6.4) | ||||
Here, and are the first- and second-order derivatives of with respect to , respectively, and denotes the (true) fourth-order spectral density of . In the scenario where the model is correctly specified, we have .
The following theorem addresses the asymptotic behavior of the our proposed estimator under possible model misspecification.
Theorem 6.1.
Let be a fourth-order stationary point process on , that is, (2.3) is satisfied for . Suppose that Assumptions 3.1, 3.2 (for ), 3.4(ii) (for ), 4.1, and 6.1 hold. Then,
| (6.5) |
Now, let . Suppose in (6.4) is invertible. Then, under Assumptions 3.1, 3.2 (for ), 3.3(ii), 3.4(ii) (for ), 4.1, 4.2, and 6.1, we have
| (6.6) |
Proof.
See Appendix B.5. ∎
Remark 6.1.
The condition on being less than four in the asymptotic normality of is required to ensure that the bias of converges to zero. This restriction is also imposed in the random fields literature (e.g., Dahlhaus and Künsch (1987); Matsuda and Yajima (2009)). By using the debiasing technique considered in Guillaumin et al. (2022), one can establish the asymptotic normality of the “debiased” Whittle estimator for all . The details will be reported in a future study.
Remark 6.2.
We provide a summary of the procedure for estimating the asymptotic variance of . Recall (6.6). can be easily estimated by replacing and with and , respectively, in (6.4). To estimate one can employ the subsampling variance estimation method for , as described in Appendix G (see also, Remark 4.1). The theoretical properties of this estimated variance will not be investigated in this article.
7 Simulation studies
To corroborate our theoretical results, we conduct some simulations on the model parameter estimation. Additional simulation results can be found in Appendices H.2–H.4. Due to space constraints, we only consider the following two point process models on :
- •
- •
For each model, we generate spatial point patterns within the observation domain (window) for varying side lengths . To assess the performance of the different parameter estimation methods, we compare our estimator as in (6.2) with two existing methods in the spatial domain: the maximum likelihood-based method (ML) and the minimum contrast method (MC).
Specifically, for the ML method, given the intractable nature of the likelihood functions for TCPs and GDPPs, we maximize the log-Palm likelihood (Tanaka et al. (2008)) for the TCPs and use the asymptotic approximation of the likelihood (Poinas and Lavancier (2023)) for GDPPs. For the MC method, we minimize the contrast function of form where denotes the parametric pair correlation function (PCF) for the isotropic process and is an estimator of the PCF. Since the PCF of the TCP model does not include the parameter , we do not include the estimation of in the MC method for TCPs. Similarly, as the PCF of GDPP is solely a function of , we do not include the estimation of in the MC method for GDPPs. Finally, following the guidelines from Biscio and Lavancier (2017) (see also, Diggle (2013)), for MC methods, we choose the tuning parameters and where is the length of the window and for TCPs and for GDPPs.
Lastly, all simulations are conducted over 500 independent replications of spatial point patterns and for each replication, we compute the three previously mentioned three model parameter estimators.
7.1 Practical guidelines for the frequency domain method
We now discuss three practical issues arising during the evaluation of our estimator.
Choice of the data taper. We use the data taper , where for ,
| (7.1) |
Then, it is easily seen that satisfies (3.4), in turn, meeting the condition on in Theorem 6.1. However, in our simulations, selection of seems not notably impact the performance of our estimator.
Choice of . In practice, we select the prespecified domain for the Whittle likelihood in (6.1) as for some . Inspecting Theorem 3.1 (also Theorem B.1 in the Appendix) we exclude the frequencies near the origin (corresponding to frequencies such that ) due to the large bias of the periodogram at frequencies close to the origin. The upper bound can be chosen such that for , ensuring information outside has little contribution to the form of spectral density function. In case where no information on the true spectral density function is available, can be replaced with its kernel smoothed periodogram in the selection criterion of .
Discretization. Since the Whittle likelihood in (6.1) is defined as an integral, we approximate with its Riemann sum
| (7.2) |
where for and , . The feasible criterion of in (6.2) is . An efficient way to compute the periodograms on a grid is discussed in Appendix H.2.
In simulations, we set , where is the side length of the window. As a theoretical justification, Subba Rao (2018) proved the asymptotic normality of the averaged periodogram under an irregularly spaced spatial data framework. She also showed that setting is ”optimal” in the sense that a finer grid () does not improve the variance of the averaged periodogram. However, we do not yet have theoretical results for the asymptotics of in the spatial point process framework. These will be investigated in future research.
7.2 Results under correctly specified models
In this section, we simulate the spatial point patterns from the TCP model with parameter and the GDPP model with parameter . For spatial patterns generated by the TCPs (resp. GDPPs), we fit the parametric TCP models (resp. GDPP models) using three different estimation methods. Following the guideline in Section 7.1, we set the prespecified domain in our estimator for both TCP and GDPP. This choice captures the shape of the spectral densities without adding unnecessary computation.
The bias and standard errors of three different methods are presented in Table 1. See also, Figures H.2 and H.3 in the Appendix for the empirical distributions
| Model | Window | Parameter | Method | ||
|---|---|---|---|---|---|
| Ours | ML | MC | |||
| TCP | -0.04(0.11) | -0.07(0.70) | -0.04(0.10) | ||
| 0.72(3.52) | -0.62(9.51) | — | |||
| 0.02(0.07) | -0.06(0.35) | 0.01(0.10) | |||
| Time(sec) | 0.74 | 0.38 | 0.07 | ||
| -0.02(0.05) | -0.02(0.05) | -0.01(0.05) | |||
| 0.60(1.77) | 0.24(3.37) | — | |||
| 0.01(0.04) | -0.02(0.20) | 0.00(0.06) | |||
| Time(sec) | 2.38 | 5.67 | 0.23 | ||
| -0.01(0.04) | 0.00(0.03) | 0.00(0.03) | |||
| 0.25(1.03) | 0.15(1.23) | — | |||
| 0.01(0.02) | 0.00(0.03) | 0.00(0.03) | |||
| Time(sec) | 9.15 | 173.66 | 1.95 | ||
| GDPP | 0.00(0.10) | 0.03(0.07) | — | ||
| 0.01(0.09) | -0.02(0.03) | 0.05(0.07) | |||
| Time(sec) | 0.14 | 1.84 | 0.05 | ||
| 0.00(0.06) | 0.01(0.04) | — | |||
| 0.01(0.04) | -0.01(0.01) | 0.02(0.03) | |||
| Time(sec) | 0.39 | 30.70 | 0.08 | ||
| 0.00(0.03) | 0.01(0.02) | — | |||
| 0.00(0.02) | 0.00(0.01) | 0.00(0.02) | |||
| Time(sec) | 1.62 | 590.02 | 0.67 | ||
First, we examine the accuracy of the estimators. Our estimator exhibits the smallest root-mean-squared erorr (RMSE) of and in the TCP model across all windows; has the smallest RMSE for when ; and has reliable estimation results for the GDPP model. The MC estimator performs well for both the TCP and GDPP models, achieving the smallest RMSE for in the TCP model for and . The ML estimator consistently performs the best for the GDPP model. For the TCP model, the ML estimators of and yield satisfactory finite sample results, but that of exhibits a relatively large standard error. Overall, the biases and standard errors of all three estimators tend to decrease to zero as the window size increases.
Moving on, we consider the computation time of each method. Firstly, the MC method has the fastest computation time for both models and all windows. Secondly, the ML method exhibits a reasonable computation speed for both models when , yielding the expected number of observations equal to 200 (for TCP) or 100 (for GDPP). However, when the number of observations are in the order of a few thousands (corresponding to ), the ML method incurs the longest computational time. Lastly, our method takes less than 10 seconds to compute the parameter estimates for the TCP model and less than 2 seconds for the GDPP model both under . Specifically, the computation for our method involves two steps: (a) evaluation of and (b) optimization of in (7.2). Once step (a) is done, there is no need to update the set of periodograms in the optimization step. In the simulations, it takes, on average, less than 0.5 seconds to evaluate for both TCP and GDPP. This indicates that most of the computational burden for our method stems from the optimization of the Whittle likelihood. By employing a coarse grid in (7.2), i.e., using instead of , the computational time can dramatically decrease.
As a final note, bear in mind that the number of parameters for the MC method is one for TCP and two for GDPP, representing a lower parameter count compared to the corresponding ours or ML estimators. Additionally, the contrast function of the MC method for both TCP and GDPP is specifically designed for isotropic processes. Therefore, for the models we consider in this simulations, the MC method clearly holds a computational advantage over both our method and the ML method.
7.3 Results under misspecified models
Now, we consider the case when the models fail to identify the true point patterns. For the data-generating process, we simulate from the LGCP model driven by the latent intensity field , , where the first-order intensity is and the covariance function is , . Following the arguments in Section 5.3, the true spectral density function , , is given by
| (7.3) |
In each simulation, we fit the TCP model with parameter . To examine the effect of the selection of the prespecified domain, we use and when evaluating our estimator.
Next, we consider the best fitting TCP model. The best fitting TCP parameter is given by , where
| (7.4) |
is the Riemann sum analogue of in (6.3). Figure 2 illustrates the (log-scale of) the true spectral density (; solid line) and the best fitting TCP spectral density functions for (dashed line) and (dotted line). We note that the best TCP spectral densities evaluated on two different domains ( and ) have distinct characteristics. In detail, for captures the peak and the curvature of the true spectral density more accurately but fails to identify the true asymptote (horizontal line with amplitude ). On the other hand, for successfully captures the asymptote of the true density but underestimates the power near the origin.
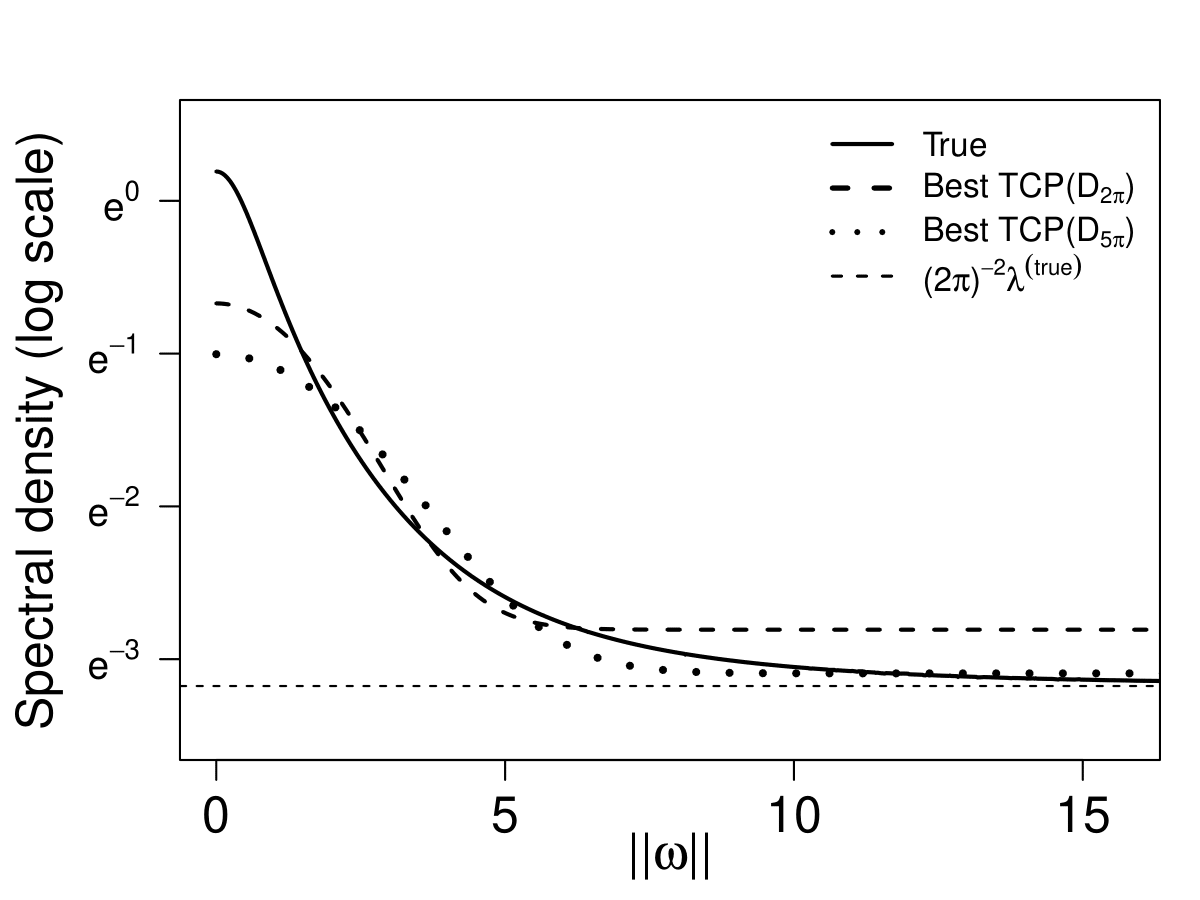
Table 2 below summarizes parameter estimation results. The empirical distribution of each estimator can be found in Figure H.4 in Appendix. For the parameter fitting, we also report the estimation of the first-order intensity .
| Window | Par. | Best Par. | Method | ||||
|---|---|---|---|---|---|---|---|
| Ours() | Ours() | ML | MC | ||||
| 0.32 | 0.25 | 0.38(0.23) | 0.38(0.23) | 0.43(1.73) | 0.25(0.28) | ||
| 7.46 | 7.08 | 7.49(7.75) | 6.41(5.19) | 14.96(19.59) | — | ||
| 0.17 | 0.10 | 0.32(0.80) | 0.16(0.28) | 0.34(0.34) | 0.24(0.17) | ||
| 2.38 | 1.79 | 2.16(1.34) | 1.76(0.75) | 1.49(0.53) | — | ||
| Time(sec) | — | — | 0.61 | 3.43 | 0.21 | 0.07 | |
| 0.31 | 0.24 | 0.36(0.13) | 0.30(0.10) | 0.12(0.07) | 0.13(0.06) | ||
| 7.74 | 7.37 | 7.33(3.79) | 6.88(3.69) | 20.02(18.46) | — | ||
| 0.18 | 0.10 | 0.20(0.08) | 0.11(0.05) | 0.48(0.53) | 0.36(0.25) | ||
| 2.43 | 1.80 | 2.36(0.92) | 1.79(0.43) | 1.60(0.31) | — | ||
| Time(sec) | — | — | 1.68 | 11.13 | 2.99 | 0.16 | |
| 0.32 | 0.25 | 0.34(0.08) | 0.27(0.06) | 0.09(0.03) | 0.09(0.03) | ||
| 7.63 | 7.13 | 7.53(2.21) | 7.16(2.36) | 20.44(10.52) | — | ||
| 0.18 | 0.10 | 0.19(0.04) | 0.11(0.03) | 0.41(0.20) | 0.46(0.19) | ||
| 2.44 | 1.80 | 2.44(0.59) | 1.81(0.24) | 1.64(0.17) | — | ||
| Time(sec) | — | — | 5.17 | 40.45 | 71.16 | 1.36 | |
We first discuss the best fitting parameters. As already shown in Figure 2 above, the best fitting parameter results reveal substantial differences between and . Surprisingly, the first-order intensity of the best fitting TCP model on is which significantly deviates from the true first-intensity (). The rationale behind this discrepancy is that the true spectral density function in is still distant from its asymptote value . Therefore, the information contained in proves insufficient for estimating the true first-order intensity. As a remedy for the discrepancy between the fitted first-order intensity and the true first-order intensity, one may fit the ”reduced” TCP model. Specifically, we can fit the TCP model with a parameter constraint , where is the unbiased estimator of . One advantage of using such a parameter constraint is that the estimated first-order intensity of the reduced TCP model always correctly estimates the true first-order intensity. Please refer to Appendix H.4 for details on the construction of the reduced TCP model and its parameter fitting results.
Next, we examine the estimation outcomes from different methods. As the window size increases, our estimators evaluated on and converge toward the corresponding best fitting parameters. These results substantiate the asymptotic behavior of our estimator in Theorem 6.1. For the ML estimator, the standard errors of the estimation of and decrease as the window size increases, however, the standard error of the estimated is still large even the window size is large. It is observed that tends to converges to a fixed value (approximately 1.6), but the estimated value (resp. estimated value) tends to increase (resp. decrease) as increases. It is intriguing that the ML estimator estimates the true first-order intensity of the process even the model is misspecified. However, to the best of our knowledge, there are no theoretical results available for the ML estimator under model misspecification. Lastly, the standard errors of the MC estimators decreases as the window increases. However, based on the results on Table 2, it is not clear that the MC estimator under model misspecification converges to a fixed parameter which is non-shrinking or non-diverging.
Lastly, our estimator based on the prespecified domain is reasonably fast even for the largest window . However, when the prespecified domain is , the computation time can take up to 40 seconds per simulation. This is because when computing , the number of computational grids for is about times larger than that of . To reduce the computation time, one may consider using a coarse grid on such as using a coarse grid .
8 Concluding remarks and possible extensions
In this article, we study the frequency domain estimation and inferential methods for spatial point processes. We show that the DFTs for spatial point processes still satisfy the asymptotic joint Gaussianity, which is a classical result for the DFTs applicable to time series or spatial statistics. Our approach accommodates irregularly scattered point patterns, thus the fast Fourier transform algorithm is not applicable for evaluating the DFTs on a set of grids. Nevertheless, our simulations indicate that the DFT based model parameter estimation method remains computationally attractive with satisfactory finite sample performance. The advantage of our method becomes more pronounced when fitting a model with misspecification. We prove that our proposed model parameter estimator is asymptotically Gaussian, estimating the “best” fitting parameter that minimizes the spectral divergence between the true and conjectured spectra. According to our simulation results, it appears that our method is the only promising approach that exhibits satisfactory large sample properties under model misspecification, distinguishing itself from other two spatial domain methods—the likelihood-based method and least square method.
We anticipate that our frequency domain approaches can be well extended to multivariate point processes. In multivariate case, one need to consider the “joint” higher-order intensity and cumulant intensity functions, as introduced in Zhu et al. (2023), Section 2. Additionally, the sets of assumptions presented in this paper need appropriate reformulation (see Section 4.1 of the same reference). In Appendix I, we show that our DFT-based approaches can also be extended to the class of inhomogeneous processes, but a significant portion of the theoretical development on frequency domain methods of the inhomogeneous processes are remained open. This will be a good revenue for the furture research.
Acknowledgments
JY acknowledge the support of the Taiwan’s National Science and Technology Council (grants 110-2118-M-001-014-MY3 and 113-2118-M-001-012). The authors thank Hsin-Cheng Huang and Suhasini Subba Rao for fruitful comments and suggestions, and Qi-Wen Ding for assistance with simulations. The authors also wish to thank the two anonymous referees and editors for their valuable comments and corrections, which have greatly improved the article in all aspects.
References
- Baddeley et al. (2000) A. J. Baddeley, J. Møller, and R. Waagepetersen. Non-and semi-parametric estimation of interaction in inhomogeneous point patterns. Stat. Neerl., 54(3):329–350, 2000. doi: 10.1111/1467-9574.00144.
- Bandyopadhyay and Lahiri (2009) S. Bandyopadhyay and S. N. Lahiri. Asymptotic properties of discrete Fourier transforms for spatial data. Sankhya A, 71(2):221–259, 2009.
- Bartlett (1964) M. S. Bartlett. The spectral analysis of two-dimensional point processes. Biometrika, 51(3/4):299–311, 1964. doi: 10.2307/2334136.
- Biscio and Lavancier (2016) C. A. N. Biscio and F. Lavancier. Brillinger mixing of determinantal point processes and statistical applications. Electron. J. Stat., 10(1):582–607, 2016. doi: 10.1214/16-EJS1116.
- Biscio and Lavancier (2017) C. A. N. Biscio and F. Lavancier. Contrast estimation for parametric stationary determinantal point processes. Scand. J. Stat., 44(1):204–229, 2017. doi: 10.1111/sjos.12249.
- Biscio and Waagepetersen (2019) C. A. N. Biscio and R. Waagepetersen. A general central limit theorem and a subsampling variance estimator for -mixing point processes. Scand. J. Stat., 46(4):1168–1190, 2019. doi: 10.1111/sjos.12389.
- Brillinger (1981) D. R. Brillinger. Time series: Data Analysis and Theory. Holden-Day, INC., San Francisco, CA, 1981. Expanded edition.
- Chandler (1997) R. E. Chandler. A spectral method for estimating parameters in rainfall models. Bernoulli, 3(3):301–322, 1997. doi: 10.2307/3318594.
- Cheysson and Lang (2022) F. Cheysson and G. Lang. Spectral estimation of Hawkes processes from count data. Ann. Statist., 50(3):1722–1746, 2022. doi: 10.1214/22-AOS2173.
- Choiruddin et al. (2021) A. Choiruddin, J.-F. Coeurjolly, and R. Waagepetersen. Information criteria for inhomogeneous spatial point processes. Aust. N. Z. J. Stat., 63(1):119–143, 2021. doi: 10.1111/anzs.12327.
- Dahlhaus (1997) R. Dahlhaus. Fitting time series models to nonstationary processes. Ann. Statist., 25(1):1–37, 1997. doi: 10.1214/aos/1034276620.
- Dahlhaus and Künsch (1987) R. Dahlhaus and H. Künsch. Edge effects and efficient parameter estimation for stationary random fields. Biometrika, 74(4):877–882, 1987. doi: 10.1093/biomet/74.4.877.
- Dahlhaus and Sahm (2000) R. Dahlhaus and M. Sahm. Likelihood methods for nonstationary time series and random fields. Resenhas IME-USP (São Paulo J. Math. Sci.), 4(4):457–477, 2000.
- Dahlhaus and Wefelmeyer (1996) R. Dahlhaus and W. Wefelmeyer. Asymptotically optimal estimation in misspecified time series models. Ann. Statist., 24(3):952–974, 1996. doi: 10.1214/aos/1032526951.
- Daley and Vere-Jones (2003) D. J. Daley and D. Vere-Jones. An Introduction to the Theory of Point Processes: Volume I: Elementary Theory and Methods. Springer, New York City, NY., 2003. doi: 10.1007/b97277. second edition.
- D’Angelo et al. (2022) N. D’Angelo, G. Adelfio, A. Abbruzzo, and J. Mateu. Inhomogeneous spatio-temporal point processes on linear networks for visitors’ stops data. Ann. Appl. Stat., 16(2):791–815, 2022. doi: 10.1214/21-AOAS1519.
- Diggle (2013) P. J. Diggle. Statistical Analysis of Spatial and Spatio-Temporal Point Patterns. CRC press, New York, NY, 2013. doi: 10.1201/b15326. 3rd edition.
- Ding et al. (2024) Q.-W. Ding, J. Shin, and J. Yang. Pseudo-spectra of multivariate inhomogeneous spatial point processes. Technical report, 2024.
- Doukhan (1994) P. Doukhan. Mixing: Properties and Examples. Springer, New York City, NY., 1994. doi: 10.1007/978-1-4612-2642-0.
- Folland (1999) G. B. Folland. Real Analysis: Modern Techniques and Their Applications, volume 40. John Wiley & Sons, New York, NY, 1999. 2nd edition.
- Gabriel and Diggle (2009) E. Gabriel and P. J. Diggle. Second-order analysis of inhomogeneous spatio-temporal point process data. Stat. Neerl., 63(1):43–51, 2009. doi: 10.1111/j.1467-9574.2008.00407.x.
- Guan and Sherman (2007) Y. Guan and M. Sherman. On least squares fitting for stationary spatial point processes. J. R. Stat. Soc. Ser. B. Stat. Methodol., 69(1):31–49, 2007. doi: 10.1111/j.1467-9868.2007.00575.x.
- Guillaumin et al. (2022) A. P. Guillaumin, A. M. Sykulski, S. C. Olhede, and F. J. Simons. The debiased spatial Whittle likelihood. J. R. Stat. Soc. Ser. B. Stat. Methodol., 84(4):1526–1557, 2022. doi: 10.1111/rssb.12539.
- Guyon (1982) X. Guyon. Parameter estimation for a stationary process on a -dimensional lattice. Biometrika, 69(1):95–105, 1982. doi: 10.2307/2335857.
- Hawkes (1971a) A. G. Hawkes. Spectra of some self-exciting and mutually exciting point processes. Biometrika, 58(1):83–90, 1971a. doi: 10.2307/2334319.
- Hawkes (1971b) A. G. Hawkes. Point spectra of some mutually exciting point processes. J. R. Stat. Soc. Ser. B. Stat. Methodol., 33(3):438–443, 1971b. doi: 10.1111/j.2517-6161.1971.tb01530.x.
- Illian et al. (2008) J. Illian, A. Penttinen, H. Stoyan, and D. Stoyan. Statistical Analysis and Modelling of Spatial Point Patterns. John Wiley & Sons, Hoboken, NJ., 2008. doi: 10.1002/9780470725160.
- Jovanović et al. (2015) S. Jovanović, J. Hertz, and S. Rotter. Cumulants of Hawkes point processes. Phys. Rev. E, 91(4):042802, 2015. doi: 10.1103/PhysRevE.91.042802.
- Macchi (1975) O. Macchi. The coincidence approach to stochastic point processes. Adv. in Appl. Probab., 7(1):83–122, 1975. doi: 10.1017/s0001867800040313.
- Matsuda and Yajima (2009) Y. Matsuda and Y. Yajima. Fourier analysis of irregularly spaced data on . J. R. Stat. Soc. Ser. B. Stat. Methodol., 71(1):191–217, 2009. doi: 10.1111/j.1467-9868.2008.00685.x.
- Møller and Waagepetersen (2004) J. Møller and R. Waagepetersen. Statistical Inference and Simulation for Spatial Point Processes. Chapman and Hall/CRC, Boca Raton, FL, 2004. doi: 10.1201/9780203496930.
- Møller et al. (1998) J. Møller, A. R. Syversveen, and R. P. Waagepetersen. Log Gaussian Cox processes. Scand. J. Stat., 25(3):451–482, 1998. doi: 10.1111/1467-9469.00115.
- Mugglestone and Renshaw (1996) M. A. Mugglestone and E. Renshaw. A practical guide to the spectral analysis of spatial point processes. Comput. Statist. Data Anal., 21(1):43–65, 1996. doi: 10.1016/0167-9473(95)00007-0.
- Newey (1991) W. K. Newey. Uniform convergence in probability and stochastic equicontinuity. Econometrica, 59(4):1161–1167, 1991. doi: 10.2307/2938179.
- Neyman and Scott (1958) J. Neyman and E. L. Scott. Statistical approach to problems of cosmology. J. R. Stat. Soc. Ser. B. Stat. Methodol., 20(1):1–29, 1958. doi: 10.1111/j.2517-6161.1958.tb00272.x.
- Parzen (1957) E. Parzen. On consistent estimates of the spectrum of a stationary time series. Ann. Math. Stat., 28(2):329–348, 1957. doi: 10.1214/aoms/1177706962.
- Pawlas (2009) Z. Pawlas. Empirical distributions in marked point processes. Stochastic Process. Appl., 119(12):4194–4209, 2009. doi: 10.1016/j.spa.2009.10.002.
- Poinas and Lavancier (2023) A. Poinas and F. Lavancier. Asymptotic approximation of the likelihood of stationary determinantal point processes. Scand. J. Stat., 50(2):842–874, 2023. doi: 10.1111/sjos.12613.
- Poinas et al. (2019) A. Poinas, B. Delyon, and F. Lavancier. Mixing properties and central limit theorem for associated point processes. Bernoulli, 25(3):1724–1754, 2019. doi: 10.3150/18-BEJ1033.
- Prokešová and Jensen (2013) M. Prokešová and E. V. B. Jensen. Asymptotic Palm likelihood theory for stationary point processes. Ann. Inst. Statist. Math., 65(2):387–412, 2013. doi: 10.1007/s10463-012-0376-7.
- Rajala et al. (2023) T. A. Rajala, S. C. Olhede, J. P. Grainger, and D. J. Murrell. What is the Fourier transform of a spatial point process? IEEE Trans. Inform. Theory, 69(8):5219–5252, 2023. doi: 10.1109/TIT.2023.3269514.
- Rosenblatt (1956) M. Rosenblatt. A central limit theorem and a strong mixing condition. Proc. Natl. Acad. Sci. USA, 42(1):43–47, 1956. doi: 10.1073/pnas.42.1.43.
- Shlomovich et al. (2022) L. Shlomovich, E. A. K. Cohen, N. Adams, and L. Patel. Parameter estimation of binned Hawkes processes. J. Comput. Graph. Statist., 31(4):990–1000, 2022. doi: 10.1080/10618600.2022.2050247.
- Subba Rao (2018) S. Subba Rao. Statistical inference for spatial statistics defined in the Fourier domain. Ann. Statist., 46(2):469–499, 2018. doi: 10.1214/17-AOS1556.
- Subba Rao and Yang (2021) S. Subba Rao and J. Yang. Reconciling the Gaussian and Whittle likelihood with an application to estimation in the frequency domain. Ann. Statist., 49(5):2774–2802, 2021. doi: 10.1214/21-AOS2055.
- Tanaka et al. (2008) U. Tanaka, Y. Ogata, and D. Stoyan. Parameter estimation and model selection for Neyman-Scott point processes. Biom. J., 50(1):43–57, 2008. doi: 10.1002/bimj.200610339.
- Tukey (1967) J. W. Tukey. An introduction to the calculations of numerical spectrum analysis. In Spectral Analysis of Time Series (Proc. Advanced Sem., Madison, Wis., 1966), pages 25–46. John Wiley, New York, 1967.
- Waagepetersen and Guan (2009) R. Waagepetersen and Y. Guan. Two-step estimation for inhomogeneous spatial point processes. J. R. Stat. Soc. Ser. B. Stat. Methodol., 71(3):685–702, 2009. doi: 10.1111/j.1467-9868.2008.00702.x.
- Warton and Shepherd (2010) D. I. Warton and L. C. Shepherd. Poisson point process models solve the “pseudo-absence problem” for presence-only data in ecology. Ann. Appl. Stat., 4(3):1383–1402, 2010. doi: 10.1214/10-aoas331.
- Whittle (1953) P. Whittle. The analysis of multiple stationary time series. J. R. Stat. Soc. Ser. B. Stat. Methodol., 15:125–139, 1953. doi: 10.1111/j.2517-6161.1953.tb00131.x.
- Yang and Guan (2024) J. Yang and Y. Guan. Supplement to “Fourier analysis of spatial point processes”. Technical report, 2024.
- Zhu et al. (2023) L. Zhu, J. Yang, M. Jun, and S. Cook. On minimum contrast method for multivariate spatial point processes. arXiv preprint arXiv:2208.07044, 2023.
- Zhuang et al. (2004) J. Zhuang, Y. Ogata, and D. Vere-Jones. Analyzing earthquake clustering features by using stochastic reconstruction. J. Geophys. Res. Solid Earth, 109(B05301), 2004. doi: 10.1029/2003JB002879.
Appendix A Proof of Theorem 4.1
A.1 Equivalence between the feasible and infeasible criteria
Let
| (A.1) |
be a feasible criterion of the integrated periodogram as in (4.2). In theorem below, we show that and are asymptotically equivalent. Therefore, both statistics share the same asymptotic distribution.
Theorem A.1.
Proof. Let , , and let
Then, we have , . Therefore, the difference between the feasible integrated periodogram and its theoretical counterpart can be expressed as
where , . By using Theorem E.2 below, both and converges to zero in as . Thus, we get the desired results.
Thanks to the above theorem, it is enough to prove Theorem A.1 for replacing in the statement.
A.2 Proof of the asymptotic bias
By using Theorem D.1 below, an expectation of the (theoretical) periodogram can be expressed as
where is the Fejér Kernel defined as in (C.15). Therefore, applying Lemma C.3(b) to the above expression, we have
| (A.2) |
uniformly in . Therefore, an expectation of is bounded by
as . Thus, combining the above with Theorem A.1, we show (i).
A.3 Proof of the asymptotic variance
To show the asymptotic variance, we first fix term. First, we view as a function on by letting when . Since , let
| (A.3) |
be the Fourier transform of . Next, for a finite region , let
| (A.4) |
where if and zero otherwise. Therefore, the Fourier transform of , denoted , is equal to which vanishes outside . By using similar arguments as in Matsuda and Yajima (2009), Lemmas 4 and 5, we have as in sense and for large enough , is closely approximated with uniformly for all .
Now, we make an expansion of . By using that , for , we have
| (A.5) | ||||
Therefore, we have , where
By using Theorem D.3 below, we have
| (A.6) |
Therefore, for sufficiently large , is arbitrary close to .
Similarly, the limit of is
| (A.7) | |||||
A.4 Proof of the asymptotic normality
Because of Theorem A.1, it is enough to show the asymptotic normality of the feasible . Let and let
| (A.9) |
Then, is nonstochastic and is bounded by as due to Theorem 4.1(i). Therefore, and are asymptotically equivalent.
Now, we focus on the asymptotic distribution of . Since cannot be written as an additive form of the periodograms of the sub-blocks, one cannot directly apply for the standard central limit theorem techniques that are reviewed in Biscio and Waagepetersen (2019), Section 1. Instead, we will “linearize” the periodogram and show that the associated linear term dominates.
Without loss of generality, we assume that there exists such that , . Therefore, increases proportional to the order of . Next, let be chosen such that , where is from Assumption 3.3(ii). Let
Therefore, is a disjoint union that is included in . Let , where
Therefore, is the DFT evaluated within the sub-block of . Let
Let and let
| (A.10) |
In Theorem F.3 below, we show that and are asymptotically equivalent. An advantage of using over is that is written in terms of the sum of which are based on the statistics on the non-overlapping sub-blocks of . Therefore, one can show the -mixing CLT for using the standard independent and telescoping sum techniques (cf. Guan and Sherman (2007)). Details can be found in Appendix F.2 (Theorem F.5). This together with Theorem 4.1(i) and (ii), we get the desired results.
Appendix B Additional proofs of the main results
B.1 Proof of Theorem 3.1
Below we show that the feasible DFT is asymptotically equivalent to its theoretical counterpart as in (2.11).
Theorem B.1.
Proof. By definition, . By using Lemma E.1(b) below, we have for some . Therefore, . Next, by using (2.10) and Lemma C.2 below, we have
. Thus, we get the desired result.
Now we are ready to prove Theorem 3.1. Thanks to the above theorem, it is enough to prove the theorem for replacing in the statement. First, we will show (3.5). Recall in (2.7). By using Theorem D.2 below, the leading term of is . Therefore, by using Lemma C.2 below, we have
Since Assumption 3.2(for ) implies , by taking a limit on each side above, we show (3.5).
B.2 Proof of Theorem 3.2
Let and be the real and imaginary parts of , respectively. Then, by using Theorem B.1 above, it is enough to show
| (B.2) |
where is the -dimensional standard normal random variable.
To show (B.2), we will first show that the asymptotic variance of the left hand side of above is an unit matrix. Note that
Therefore, for , we have
Therefore, by using Theorem 3.1, one can show
Similarly, for ,
All together, we show that the limiting variance of the left hand side of (B.2) is a unit matrix.
Next, let . We define , where
| (B.3) |
Then, it is easily seen that any linear combination of the left hand side of (B.2) can be expressed as for an appropriate . Therefore, thanks to Cramér-Wald device, to show the asymptotic normality in (B.2), it is enough to show that is asymptotically normal. CLT for under -mixing condition can be easily seen using standard techniques (cf. Guan and Sherman (2007)). One thing that is needed to verify is to show there exists such that
| (B.4) |
We will show the above holds for , provided Assumption 3.2(i) for . We note that
| (B.5) |
where and . Therefore, since in (B.3) is bounded above uniformly in and , we can apply Lemma D.5 and get
Thus, we show (B.4) for . The remaining parts for proving CLT are routine (which may be obtained from the authors upon request).
B.3 Proof of Theorem 3.3
Let
| (B.6) |
be the theoretical counterpart of the kernel spectral density estimator. Then, in Corollary E.1 below, we show that and are asymptotically equivalent. Therefore, it is enough to show that consistently estimates the spectral density for all . By using (B.1) together with , we have
Moreover, by using classcial kernel method (cf. Ding et al. (2024), proof of Theorem 5.1), it can be easily seen that as . Therefore, by using triangular inequality, we have
| (B.7) |
Next, by using a similar argument as in Appendix A.3 (see also, the proof of Ding et al. (2024), Theorem 5.1), it can be seen that the variance of is bounded by
| (B.8) |
We mention that unlike the case of Appendix A.3, we do not require Assumption 4.2 to prove (B.8). This is because in the expansion of using (A.5), the fourth-order cumulant term is bounded by due to Lemma D.5 below. Therefore, combining (B.7) and (B.8), we have as . This proves the theorem.
B.4 Proof of Theorem 4.2
By using Corollary E.1 below, and share the same asymptotic distribution. Therefore, it is enough to show the asymptotic normality of . Since the scaled kernel function has a support on , can be written as an (theoretical) integrated periodogram by setting , . Therefore, the proof of the asymptotic normality is almost identical to that of the proof of Theorem 4.1. We will only sketch the proof.
The bias. By using Lemma C.3(b), we have
Moreover, by using classical nonparametric kernel estimation results (cf. Ding et al. (2024), Theorem 5.2), we have
, .
Therefore,
, provided
.
The variance. By using a similar argument to prove Theorem 4.1(ii), one can get
where
Now, we calculate the limit of for . We note that , . Therefore, by treating as a new kernel function in the convolution equation and using that , it is easily seen that
Similarly, one can show that
To calculate the limit of , we note that
Therefore, . All together, we have
The asymptotic normality. Proof of the asymptotic normality of is almost identical with the proof of the asymptotic normality of in (A.9) (we omit the details). All together, we prove the theorem.
B.5 Proof of Theorem 6.1
First, we will show the consistency of . Recall in (6.3). We will first show the uniform convergence of , that is,
| (B.9) |
By using Theorem 4.1(i) together with uniform boundedness of , we have
, . Next, since as due to argument in Appendix A.3, we have for each . Therefore, to show (B.9), it is enough to show that is stochastic equicontinuous (Newey (1991), Theorem 2.1).
Let and we choose such that . Then, since and has a first order derivative with respect to which are continuous on the compact domain , there exist such that
Therefore, for arbitrary with
Using Theorem 4.1(i,ii) and the term in the bracket above is as uniformly over . Therefore, is stochastic equicontinuous and, in turn, we show the uniform convergence (B.9).
Next, recall and are minimizers of and , respectively. Then, by using (B.9),
Therefore, we have and since, by assumption, is the unique minimizer of , we have . This proves (6.5).
Next, we show the asymptotic normality of . By using a Taylor expansion and using that , there exists , a convex combination of and , such that
We first focus on . By simple algebra, we have
By using the (uniform) continuity of , , , and , and since is also a consistent estimator of , we have as . Next, by using Theorems 4.1, the first two terms in is as . Therefore, we have
| (B.10) |
Next, we focus on . By simple algebra, we have
The first term above is zero since and by using
Theorem 4.1 with a help of Cramér-Wald device, the second term is asymptotically centered normal with
variance
where
Therefore, we conclude,
| (B.11) |
Combining (B.10) and (B.11) and by using continuous mapping theorem, we have
Thus, we show (6.6). All together, we get the desired results.
Appendix C Representations and approximations of the Fourier transform of the data taper
Let has a form in (2.6). Recall in (2.7)
For two data taper functions with support , we define
| (C.1) |
The term and frequently appears throughout the proof of main results. For example, they are related to the expression of . See Lemma D.1 below.
In this section, our focus is to investigate the representations and approximations of and . We first begin with . Since the support of is , can be written as , where
| (C.2) | ||||
In the theorem below, we obtain a rough bound for . Let
Throughout this section, we let be a generic constant that varies line by line.
Theorem C.1.
Proof. Recall (C.2). We bound and separately. First, is bounded by
Since has a rectangle shape, it is easily seen that
| (C.5) |
Therefore, is bounded by
| (C.6) |
Next, we bound . We note that
| (C.7) | ||||
Since is continuous on a compact support, is bounded and uniformly continuous in . Therefore,
and for fixed ,
Substitute the above two into (C.7), we have and
Combining these results with (C.6), we show (C.3) and (C.4).
If we further assume that is Lipschitz continuous on , then
Therefore, from (C.6) and (C.7), we have
Therefore, we prove the assertion. All together, we get the desired results.
To show the limiting variance of the integrated periodogram in (4.2), we require sharper bound for . Below, we give a bound for , provided and are either constant in or satisfies Assumption 3.4(ii) for . To do so, let be the Fourier coefficients of that satisfies
| (C.8) |
The Fourier coefficients of are defined in the same manner. For centered rectangle (which also includes the degenerate rectangles), we let
| (C.9) |
Theorem C.2.
Let and are the data taper on a compact support . Suppose and are either constant on or satisfy Assumption 3.4(ii) for . Then, the following two assertions hold.
-
(i)
satisfies the following identity
-
(ii)
Let . Then, there exist and number of sequences of centered rectangles (which may include degenerate rectangles) where depends only on and such that for and ,
Proof. First, we will show (i). We will assume that and both satisfies Assumption 3.4(ii) for . The case when either or is constant on is straightforward since the corresponding Fourier coefficients for in are if and zero otherwise. By using Folland (1999), Theorem 8.22(e) (see also an argument on page 257 of the same reference), we have and thus both and are finite. For ,
| (C.10) | ||||
Here, we use Fubini’s theorem in the second identity which is due to and . Similarly, for ,
| (C.11) |
Combining the above two expressions, we show (i).
Next, we will show (ii). We first focus on . From (C.10), we have
Here, we use
in the second inequality. We note that is also a rectangle, and for all . Therefore, for the centered version of the rectangle , denoted , we have
Substitute this into the upper bound of , we have
| (C.12) | ||||
Secondly, we focus in . We first note that can be written as a disjoint union of finite number of rectangles, where the number of the rectangles are at most . See the example in the Figure C.1 below for .
Let be the disjoint union of rectangles and is the centered . Then, by using (C.11), we have
Here, we use (C.5) in the last inequality above. Therefore, we have
| (C.13) | ||||
Combining (C.12) and (C.13), we get the desired result. All together, we prove the theorem.
Next, we focus on in (2.7). The following lemma provides an approximation of .
Lemma C.1.
Let be a data taper that satisfies Assumption 3.4(i). Then, for ,
Suppose . Then, for fixed , as ,
If further assume that is Lipschitz continuous on , then the left term above is bounded by uniformly in .
Proof. We will show the lemma for . The case for is treated similarly (cf. Brillinger (1981), page 402). For , the left hand side above is equal to . Thus, by Theorem C.1, the above is true for .
Next, we bound for . The lemma below together with Theorem C.1 are used to prove the asymptotic orthogonality of the DFT in Theorem 3.1.
Lemma C.2.
Let satisfies Assumption 3.1. Let be a data taper such that . Let be a sequence on that is asymptotically distant from . Then,
| (C.14) |
Proof. Since has a compact support and , . Therefore,
Here, we use change of variables in the second identity. Note that as due to Assumption 3.1. Therefore, by Riemann-Lebesgue lemma, we have . Thus, we get the desired result.
Finally, we generalize the Fejér Kernel that are associated with data taper (cf. Matsuda and Yajima (2009), Equation (21)). For with support on , let
| (C.15) |
where is defined as in (2.10) and .
Lemma C.3.
Proof. (a)–(d) are due to Matsuda and Yajima (2009), Lemmas 1 and 2. The upper bound of (d) is which depends only on . To show (e), let be the compact support of . Then, by using Cauchy-Schwarz inequality and point (a),
Thus, we prove (e). All together, we get the desired results.
Appendix D Bounds for the cumulants of the DFT
In this section, we study the expressions and bounds of terms that are written in terms of the product of cumulants of the DFT. This section is essential to prove the asympotic orthogonality of the DFTs in Theorem 3.1 and includes the limit of the variance of the integrated periodogram in Section 4. Throughout the section, we let be a generic constant that varies line by line.
D.1 Expressions of the covariance of the DFTs
To begin with, we obtain the expressions for in terms of the second-order measures. Note that these expressions above were also verified in Rajala et al. (2023), Proposition IV.1 and Equation (47).
Theorem D.1.
Proof. We will only show (D.1) and (D.2) for the non-tapered case. A general case can be treated similarly. Since is centered DFT and is deterministic, we have
By using (2.9),
Thus, by using (2.1) for both terms above, we have
Next, by using that and , we have
Therefore, we show (D.1) for on .
(D.2) can be easily seen by using the above identity and .
Lastly, to show (D.3), by substituting (4.4) into (D.1) for , we have
Since due to Assumption 4.1(i) and , we can apply Fubini’s theorem to interchange the summation above and get
Here, we use (2.10) and on the second identity and Lemma C.3(a) on the last identity. Thus, we get the desired results.
All together, we prove the theorem.
Lemma D.1.
Suppose that Assumption 3.2 holds for . Then, for ,
Proof. By using (D.2) and using that has a support on ,
Here, we use change of variables and in the second identity. Thus, we get the desired result.
Using the above lemma together with bound for in Theorem C.1, we obtain the leading term of .
Theorem D.2.
Proof. By using Lemma D.1 and , the first term in the expansion of is
Here, we use (2.5) in the last identity. Similarly, the remainder term of the difference between and is bounded by
| (D.5) |
By using Theorem C.1, the first term above is as uniformly in . To bound the second term, by using C.1 again, we have and , . Therefore, by dominated convergence theorem, the second term above is as uniformly in . Thus, we get the desired result.
D.2 Bounds on the terms involving covariances
Let
| (D.6) | ||||
The term appears in the integrated form of in the proof of Theorem 4.1. Below, we give an approximation of . Let
| (D.7) |
and let
| (D.8) | ||||
Lemma D.2.
Proof. Recall . Substitute this to (D.6), can be decomposed into four terms. The first term is
The above term is nonzero if and only if . Therefore, the first term is equivalent to
By applying Lemma C.1, we have
Here, we use in the identity. Moreover, under Assumption 3.1, it is easily seen that as . Therefore, the first term is as .
Similarly, the second and third terms are equal to
Finally, by using (4.4), the fourth term is equal to
Since due to Assumption 4.1(i), we can apply Fubini’s theorem and get
where is defined as in (D.8).
Next, from (C.15), the Fejér kernel based on is
| (D.9) |
Substitute this into the above, we have
All together, we show the lemma.
Next, we bound the term that are associated with in (D.8).
Lemma D.3.
Proof. Recall (D.8). By using Theorem C.2(ii), the first term in the expression of
is bounded by
Substitute the above into (D.10), the first term in the expansion of (D.10) is bounded by
Since and due to Assumption 4.1, we can apply Lemma C.3(d) and get
uniformly over . Thus, the above term is bounded by
We first note that due to the dominated convergence theorem. Moreover, since , by applying dominated convergence theorem again, we show that the above term is as .
Similarly, the second term in the decomposition of (D.10) is as .
Lastly, we bound the third term. By using Theorem C.2(ii) again, the third term in the decomposition of (D.10) is bounded by
By using Lemma C.3(d) and , the integral is bounded above and the upper bound is depends only on . Therefore, the above is bounded by
By using a similar dominated convergence argument above, the third term is as .
All together, we show prove the lemma.
Now, we are ready to compute the limit of in Section A.3. Recall
Theorem D.3.
Suppose the same set of assumptions in Theorem 4.1(ii) holds. Then,
Proof. First, by using (D.2), we have
By using Cauchy-Schwarz inequality, the above is absolutely integrable, thus, we can interchange the summations and get
where is from (D.6). In the above, we use an inverse transform of (A.4) in the second identity and the change of variables and in the last identity.
Next, recall in (D.7). Then, by Assumption 4.1(i), and has the Fourier representation as in (4.4). We note that for large enough due to Assumption 3.1. Thus, by using this fact together with Lemma D.2, for large enough , we have , where
as , and
where is Fejér kernel based on defined as in (D.9) and is the remainder term defined as in (D.8).
We bound each term above. The first term is
| (D.11) | ||||
where . Here, the last identity is due to Plancherel theorem. By using (4.4) and (A.4) together with Fubini’s theorem, the second term is
| (D.12) | ||||
Finally, by using Fubini’s theorem and Lemmas C.3(b) and D.3, the third term is
| (D.13) | ||||
Combining (D.11)–(D.13), we conclude
Thus, we prove the theorem.
D.3 Bounds on the terms involving higher order cumulants
We give an expression of the complete fourth-order cumulant of the DFTs. Through a simple combinatorial argument, the fourth-order complete reduced cumulant, denoted , can be written as a sum of the 15 different reduced cumulant functions:
| (D.14) | ||||
Lemma D.4.
Proof. The proof is similar to that of the proof of Theorem D.1. We omit the details.
Using the above expression, we calculate the limit of in Section A.3. Recall
Theorem D.4.
Suppose the same set of assumptions in Theorem 4.1(ii) holds. Then,
where is the fourth-order spectrum.
Proof. By using Lemma D.4 and Fubini’s theorem, can be written as
Let . Then, from (D.14) and (4.3), the inverse Fourier transform of is . By using a similar decomposition as in Lemma D.2, we have , where
and
Here, we use change of variables and in the second identity above. To obtain an expression of , by using (A.3), . Therefore,
| (D.15) |
Obtaining an expression for is similar to that in deriving an expression for above. By using similar techniques as in Lemmas D.2 and D.3, it can be shown that for large ,
Here, we use Lemma C.3(b) in the second identity and Fubini’s theorem and (A.4) in the last identity. Therefore,
| (D.16) |
Combining (D.15) and (D.16), we have
Thus, we obtain the limit of .
To end this section, we obtain the bounds for the general higher order cumulant term.
Lemma D.5.
Proof. We will only show the above for under fourth-order stationarity. The general cases are treated similarly (see the statement after Assumption 3.2). Let . By generalizing Lemma D.4, we have
where is defined as in (D.14). Let , , and let . Then, we have
Here, we use change of variables , , and in the second inequality, and the last identity is due to absolute integrability of under Assumption 3.2 for . Thus, we prove the lemma for under fourth-order stationarity.
Appendix E Asymptotic equivalence of the periodograms
In this section, we obtain some cumulant bounds that appear in the first and second moments of the different . These bounds are mainly used to prove an asymptotic equivalence between the feasible and infeasible integrated periodograms (see Theorem A.1). However, the results derived in this section may also be of independent interest in periodogram-based methods for spatial point process. Throughout the section, we let be a generic constant that varies line by line. Recall (2.13):
| (E.1) | ||||
In the following lemma, we bound the cumulants that are made of and
| (E.2) |
Lemma E.1.
Proof. Recall . (b) and (d) are straightforward due to Lemma D.5. To show (e), we note that
Thus, (e) follows from (b) and (d).
Next, we will show (a). We first note that . Therefore, by using Theorem D.2,
where is the spectral density and error above is uniform over . Since under Assumption 3.2(for ) and by using (2.10), we have
Similarly, we have as . Thus, we show (a).
Lastly, (c) is straightforward due to Lemma D.5. All together, we get the desired results.
Using the bounds derived above, we obtain the bounds for the first-order moments for and and the second-order moment for .
Theorem E.1.
Suppose that Assumptions 3.2(for ) and 3.4(i) hold. Let and be defined as in (E.1). Then, for , we have
| (E.3) | |||||
| (E.4) |
where error above is uniform over .
If we further assume Assumption 3.2 for . Then, for ,
| (E.5) |
Now, let
where is a compact region on and is a symmetric continuous function on . In the following theorem, we show that and are asympototically negligible.
Theorem E.2.
Proof. We first calculate the expectations. By using (E.4) and Lemma C.3(d), we have
| (E.6) | ||||
Similarly, by using (E.3) and Lemma C.3(d),(e), we have
| (E.7) | ||||
Next, we calculate the variances. By using (E.5) and Lemma C.3(d), is bounded by
| (E.8) | ||||
To bound , we need more sophisticated calculations. By using indecomposable partitions, for , we have
Thus, we have , where
We will bound each term above. First, since , we have
| (E.9) |
By using Lemmas C.3(e) and E.1(c), is bounded by
| (E.10) |
To bound , we only focus on the term in the expansion of and other three terms are treated similarly. By using Lemma E.1(b) and Theorem D.2, (a part of) is bounded by
where error is uniform over . By using Lemma C.3(e), the second term above is as . Moreover, the first term is bounded by
Here, the inequality is due to Lemma C.3(d) and the second identity is due to Lemma C.3(e). All together, we conclude that
| (E.11) |
Combining (E.9), (E.10), and (E.11), we conclude
| (E.12) |
Combining (E.7) and (E.12), we have as and (E.6) and (E.8) yield as . Thus, we get the desired results.
Lastly, recall the theoretical counterpart of the kernel spectral density estimator in (B.6). As a consequence of the above theorem, we obtain the probabilistic bound for the difference .
Corollary E.1.
Proof. Let , . Then, , where
By simple calculation, we have
Therefore, by using similar techniques to bound the first- and second-order moments of in Theorem E.2, we have
To bound the expectation of , by using a similar argument as in (E.7), we have
Here, we use a modification of Lemma C.3(e)
in the second inequality above. Similarly, by using an expansion of in the proof of Theorem E.2, one can easily seen that as . Therefore, both and converges to zero in as . Thus, we prove the theorem.
Appendix F Verification of the -mixing CLT for the integrated periodogram
In this section, we will provide greater details the CLT for defined as in (A.9). With loss of generality, we assume that grows proportional to as . Thus, increases with order . Next, let be chosen such that , where is from Assumption 3.3(ii).. For , let
Thus, is a disjoint union that is included in . Let and let . Then, it can be easily seen that
| (F.1) |
F.1 Linearization of the integrated periodogram
Now, decompose the DFT using sub-blocks. Let
Let , , be the centered DFTs. Then, since is a disjoint union of and , we have
| (F.2) |
Furthermore, since is a disjoint union and . can be written as
| (F.3) |
where
| (F.4) |
Recall and from (A.9) and (A.10), respectively. Our aim in this section is to show that is asymptotically negligible. To do so, we introduce an intermediate statistic. For , let
| (F.5) |
In the next two theorems, we will show that and are asymptotically negligible.
Theorem F.1.
Proof. Since both and are centered, we will only require to show that
. Let and . Then, we have
| (F.6) |
From (F.2), we have
Therefore, the variance term (F.6) can be decomposed into four terms. We will only focus on the term
| (F.7) |
and other three terms can be treated similarly. Using indecomposable partition, the above term is , where
By using a similar techniques to show Lemma D.5, we have
Therefore,
Here, the second identity is due to (F.1). Now, let
be a truncated taper function. Then, we have
Therefore, can be viewed as a (centered) DFT on with taper function . Thus, from the modification of the results of Theorem 4.1(ii), we have
Therefore, by using (F.1), we conclude as . Similarly, we can show as . All together, the term in (F.7) limits to zero as . By using similar technique, we can bound other three terms in the decomposition in (F.6). Therefore, we have
Lastly, since is finite, so does . Therefore, by using (F.1), we show . Thus, we get the desired results.
Now, we study the asymptotic equivalence of . Recall (F.3) and (F.5). We have
where
| (F.8) |
To show that is asymptotically negligible, we require the covariance inequality below. For , let
Lemma F.1.
Proof. We first show (F.9). For the brevity, we write . Note that and are disjoint and . Therefore, by using well-known covariance inequality (cf. Doukhan (1994), Theorem 3(1)), we have
where . Then, by using and Lemma D.5, we show as , provided Assumption 3.2 for holds. Substitute this to above, we show (F.9).
To show (F.10), we first note that for a centered random variable , . Apply this identity to the left hand side of (F.10), we get
By using similar arguments above, the second term above is bounded by . To bound for the first term, we first note that and by using Hölder’s inequality, we have
Therefore, by using covariance inequality and the Hölder’s inequality, we have
Thus, we show (F.10). All together, we get the desired results.
Now, we are ready to prove the theorem below.
Theorem F.2.
Proof. By using a similar argument as in the proof of Theorem F.1, it is enough to show . Note
| (F.11) |
We will bound each term above. To bound the first term, by using Theorems 4.1(ii), F.1, and F.4 (below), we have
| (F.12) |
where and are defined as in (4.5). Therefore, the first term in (F.11) is as . To bound the second term, we will use a -mixing condition. For , let be a set of disjoints points in . Then,
where
We will bound each term in the expansion of . By using (F.9), the first term is bounded by
Let . Then, for fixed and , the number of disjoint pairs that satisfies is upper bounded by for some constant . Therefore, by using Assumption 3.3(ii) the right hand side above is bounded by
Here, we use Assumption 3.3(ii) on the first inequality, and on the second inequality, , , and on the third inequality, and on the identity. Thus, we have
| (F.13) |
To bound the second term, we use (F.10) and Assumption 3.3(ii) and get
Similarly, the third term is bounded by
Substitute these results into the expansion of , we have
| (F.14) |
Substituting (F.12) and (F.14) into (F.11), we show as . Thus, we prove the theorem.
F.2 CLT for
Recall , where
In this section, we prove the CLT for . First, we calculate the asymptotic variance of .
Theorem F.4.
Proof. For , let be an independent copy of and let
| (F.15) |
Then, by using a standard telescoping sum argument (cf. Pawlas (2009)), one can easily shown that as . Therefore,
Now, we focus on the variance of . Since also has a rectangle form that satisfies Assumption 3.1, from the modification of the proof of the asymptotic variance of in Theorem 4.1(ii), one can show that
Therefore, we have
Here, the last identity is due to (F.1), , and . Thus, we get the desired result.
Now, we are ready to prove the CLT for .
Theorem F.5.
Proof. Recall from (F.15) has the same asymptotic distribution with . To show the CLT for , we only need to check the Lyapunov condition: for some ,
| (F.16) |
We will show the above for , provided Assumption 3.2 for . To show (F.16), it is enough to show
| (F.17) |
This is because, once we show (F.17), one can show
Thus, (F.16) holds for . Using (B.5), we have
From Theorem 4.1(ii), we have
| (F.18) |
Therefore, . To bound the fourth-order cumulant term, we note that
| (F.19) | |||||
Now, we will evaluate the cumulant term above. Note that
Using indecomposable partitions, the above joint cumulant can be written as sum of product of cumulants of form , where and for . By using an argument in Lemma D.5, the leading term (which has the largest order) is a product of four joint cumulants of order two. An example of such term is
| (F.20) | ||||
Now, we will bound one of the terms in (F.19) that is associated with the above cumulant products. Let outside the domain . By using Lemma D.1, we have
| (F.21) |
where and are defined as in (2.7) and (C.1). Therefore, the integral term in the decomposition of (F.19) that is associated with (F.20) has 16 terms. We will only bound the two representative terms. Other 14 terms will be bounded in the similar way. The first representative term is
where for .
Here, we use change of variables , , , and in the identity above and in is the Jacobian determinant. Since is bounded and has a compact support and , it is easily seen that is also bounded and has a compact support. Then, by iteratively applying Lemma C.3(c),(d), and (e), we have
as .
The second representative term is
To bound the above term, we require a sharp bound for . Let be the Fourier coefficients of that satisfies (C.8). Then, by using Theorem C.2(ii) together with an inequality and change of variables , , , and , the above is bounded by
where is a bounded function with compact support.
By using Lemma C.3(d),(e) the term in integral with respect to is uniformly bounded above. With this observation together with and , the above term is as . Therefore, we conclude that the decomposition of (F.19) associated with (F.20) is as .
Similarly, all other terms in the indecomposable partition are as . Thus, and this shows (F.17).
Appendix G Estimation of the asymptotic variance
Recall the integrated periodgram in (4.1). By Theorem 4.1, the () confidence interval of the spectral mean of form (4.1) is
where is the -th quantile of the standard normal random variable and and are defined as in (4.5). The quantity is in terms of the unknown spectral density function and complete fourth-order spectral density function. In this section, we sketch the procedure to estimate the asymptotic variance by the mean of subsampling.
To ease the presentation, we assume that grows proportional to as . Thus the side lengthes increases proportional to order of . For , let be a sequence of increasing numbers such that as . Therefore, we have for any . Now, let
Unlike the subrectangle in Appendix F, are the subrectangles of that can be overlapped. For and , we define subsampling analogous of the DFT by
Note that the above definition is slightly different from of (F.4) since alters the data taper function for each subretangle. By simple calculation, we have , where for , , and ,
Therefore, the subsample version of the integrated periodogram is given by
where is an unbiased tapered estimator of the first-order intensity function. In practice, one can approximate using Riemann sum as outlined in Section 7.1. Now, our subsampling estimator of the asymptotic variance of is
where is the common volume of . Under appropriate moment and mixing conditions such as conditions –) in Biscio and Waagepetersen (2019) (page 1174), one may expect that is a consistent estimator of the asymptotic variance . A rigourous proof of the sampling properties of will be reported in future research.
Appendix H Additional simulation results
H.1 Computation and illustration of the kernel spectral density estimator
In this section, we describe the computation of the kernel spectral density estimator and provide illustrations. Recall in (3.8). Since has an integral form, Riemann sum approximation of is
| (H.1) |
where is the side length of the observation domain and for . The summation above is a finite sum due to the fact that has a support . For a selection of the kernel function, we choose a triangular kernel for where . The bandwidth is set at which is an optimal rate in the sense of mean-squared error criterion (see Ding et al. (2024), Section 6.1 for details).
In top panels of Figure H.1 below, we calculate of each periodogram that are computed in the bottom panels of Figure 1. In the middle panels, we evaluate the absolute biases of and in the bottom panels, we evaluate the absolute biases of .
Kernel spectral density estimator (KSDE)
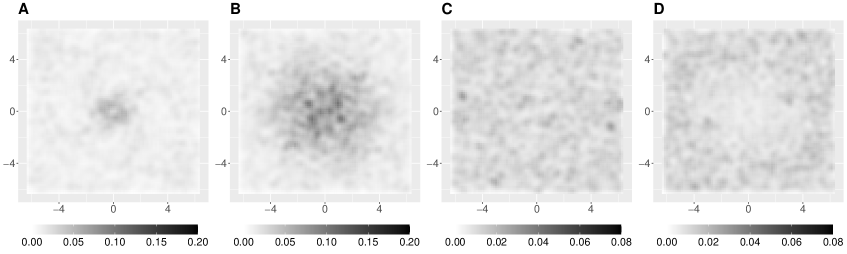
Absolute bias of the periodogram
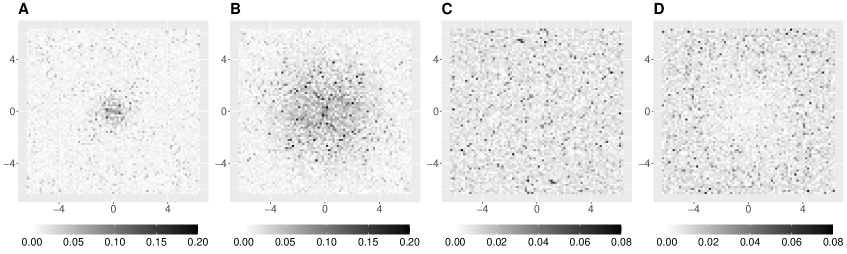
Absolute bias of the KSDE
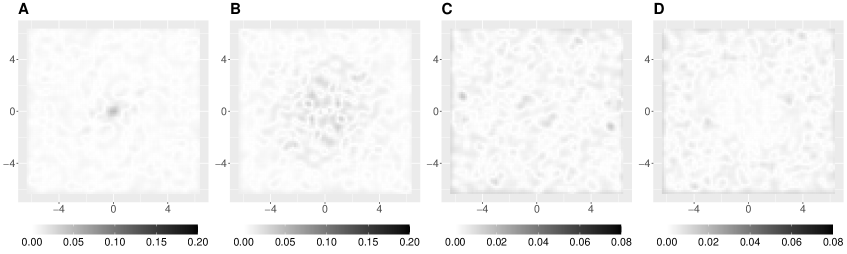
For all models, the absolute bias of the periodograms (middle panels) have similar patterns to those of the corresponding spectral density functions. This can be explained by using Theorem 3.1 that for . Therefore, the middle panels indicate that the periodogram is inconsistent. However, the absolute bias of the smoothed periodograms (bottom panels) are nearly zero across all frequencies and all models. This solidifies the thoeretical results in Thoerem 3.3 which states that is a consistent estimator of for all .
H.2 Computation of the periodograms
In this section, we discuss an implementation of computing periodograms to evaluate the discretized Whittle likelihood in (7.2). For the simplicity, we assume . The cases when or can be treated similarly.
Let the observation window be for . Suppose that the prespecified domain has a rectangle form centered at the origin, thus the gridded version of , denotes , also forms a rectangular grid. Let this retangular grid can be written as for some . Suppose further that data taper function is separable, i.e., for some and let
| (H.2) |
We will assume that has a closed form expression, thus, there is no additional computational burden to approximate the integral in .
Now, we will discuss an efficient way to compute based on the observed point pattern in . From its definition, where and are as in (2.8) and (2.10), respectively. Therefore, we will compute and separately. Since is separable, the tapered DFT can be written as , where and , . Then, the matrix form of is equal to , where for ,
Next, we calculate . Again using separability of , we have
Here, is the same constant as above and are as in (H.2). Therefore, a matrix form of is , where
These give algorithms for the fast computation of the periodogram on grid.
H.3 Additional Figures
In this section, we provide supplementary figures for the simulation results in Section 7.
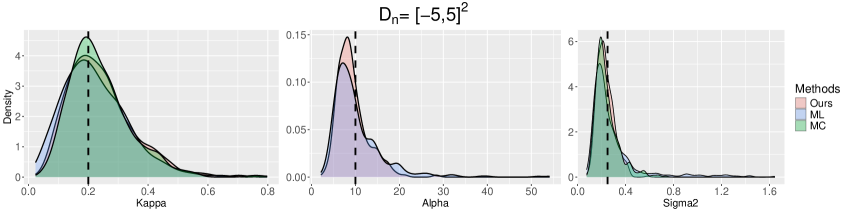
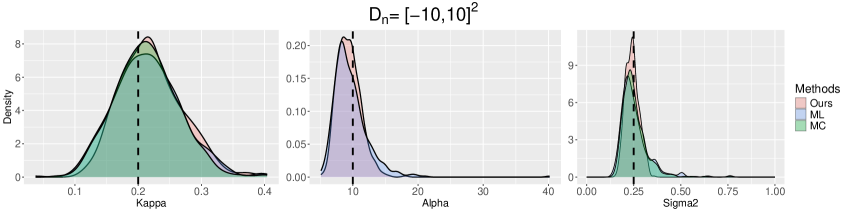
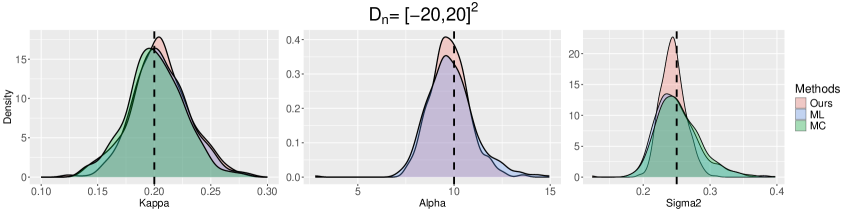
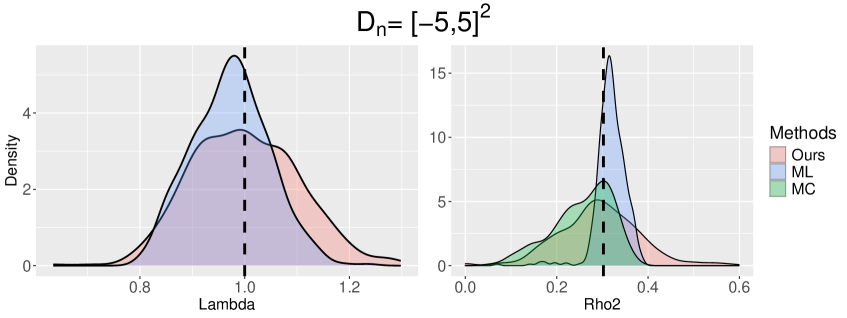
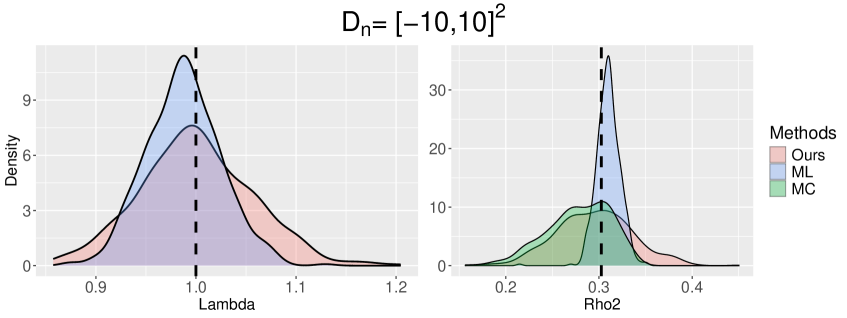
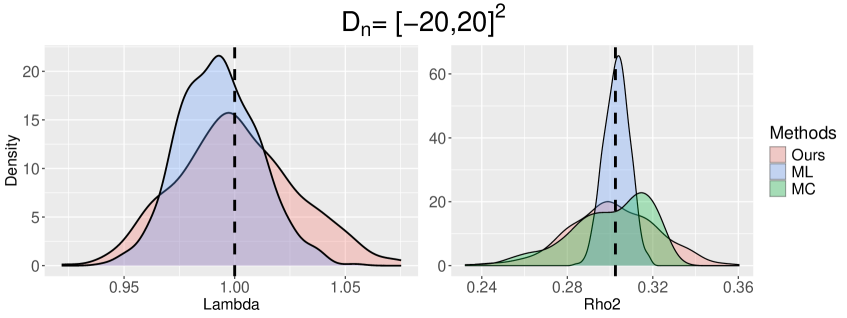
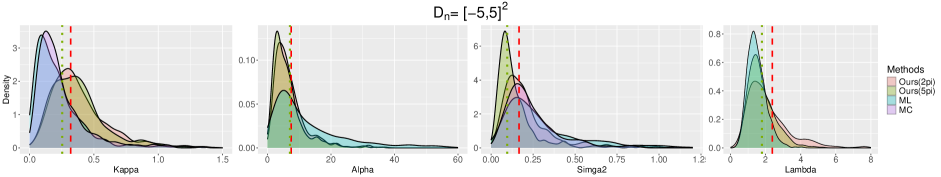
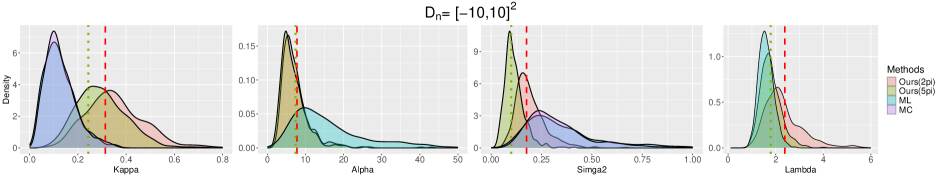
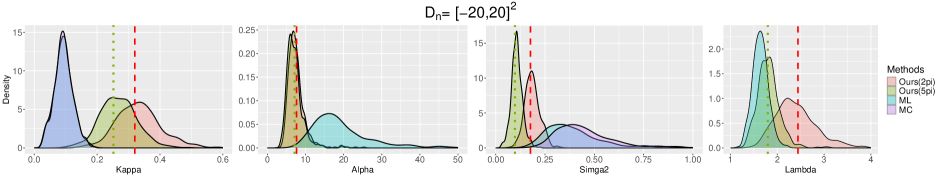
H.4 Additional simulations
As discussed in Section 7.3, in case the model misspecifies the true spatial point pattern, the best fitting model may not always accurately estimates the true first-intensity. In this section, we provide a potential remedy to overcome this issue by fitting the ”reduced” model.
For our simulation, we generate the same LGCP model on as in Section 7.3 and fit the Thomas clustering process (TCP) models with parameters as in Section 5.2. However, for each simulated point pattern, we constraint the parameter , where is a nonparameteric unbiased estimator of the ”ture” first-order intensity. We denote this model with constraint as the ”reduced” TCP model. The reduced TCP model has two free parameters and the estimated first-order intensity for the fitted reduced TCP model is . Therefore, the reduced TCP model corrected estimates the true first-order intensity.
For each simulation, we fit the reduced TCP model using three estimation methods: discrete version of our estimator as described in Section 7.1, maximum likelihood-based method using the log-Palm likelihood(ML; Tanaka et al. (2008)), and the minimum contrast method (MC). When evaluating our estimator, we follow the guidelines as in Section 7.1 and consider the two prespecified domains and .
Now, we consider the best fitting reduced TCP model. The (discretized) Whittle likelihood of the reduced model is
| (H.3) |
Here, , is the side length of the observation window, and . Then, we report . Since varies by simulations, the best fitting reduced TCP parameters also varies by simulations. However, we note that under mild conditions, consistently estimates the true first-order intensity , the ”ideal” best reduced TCP parameters are , where
| (H.4) |
where is the true spectral density function as in (7.3) and .
Table H.1 summarizes parameter estimation results. The results are also illustrated in Figure H.5. We note that as the observation domain increases, our estimators (for and ) tend to converge to the corresponding (ideal) best fitting reduced TCP parameters. Whereas, the standard errors of the ML and MC estimator for does not seem to significantly decrease to zero even for the sample points for few thousands (corresponds to the observation domain ). Moreover, there is no clear evidence in Table H.1 and Figure H.5 that the parameter estimates for the ML and MC converge to some fixed non- diverging or non-shrinking parameters.
| Window | Par. | Best Par. | Method | ||||
|---|---|---|---|---|---|---|---|
| Ours() | Ours() | ML | MC | ||||
| 0.22 | 0.25 | 0.38(0.25) | 0.42(0.35) | 0.28(0.34) | 0.25(0.28) | ||
| 0.09 | 0.08 | 0.13(0.12) | 0.12(0.13) | 0.19(0.15) | 0.24(0.17) | ||
| Time(sec) | — | — | 0.14 | 0.71 | 0.30 | 0.06 | |
| 0.21 | 0.24 | 0.27(0.09) | 0.30(0.11) | 0.13(0.06) | 0.13(0.06) | ||
| 0.09 | 0.08 | 0.10(0.04) | 0.09(0.04) | 0.34(0.17) | 0.36(0.25) | ||
| Time(sec) | — | — | 0.47 | 2.68 | 0.91 | 0.16 | |
| 0.21 | 0.24 | 0.23(0.05) | 0.26(0.06) | 0.09(0.03) | 0.09(0.03) | ||
| 0.09 | 0.08 | 0.10(0.02) | 0.08(0.03) | 0.41(0.19) | 0.46(0.19) | ||
| Time(sec) | — | — | 1.76 | 11.66 | 13.21 | 1.38 | |
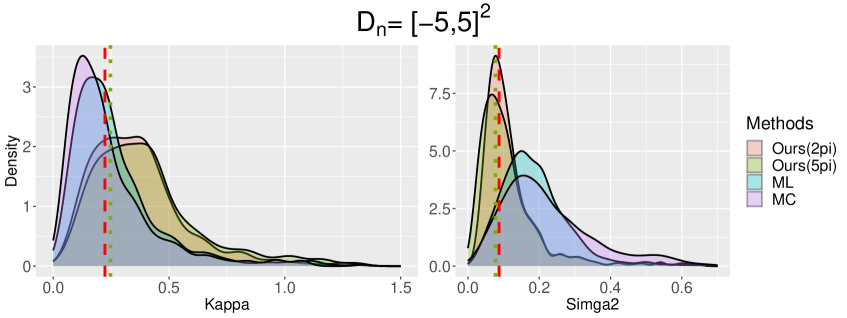
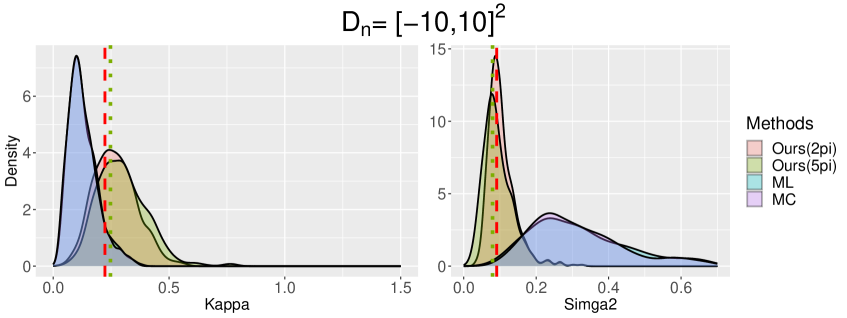
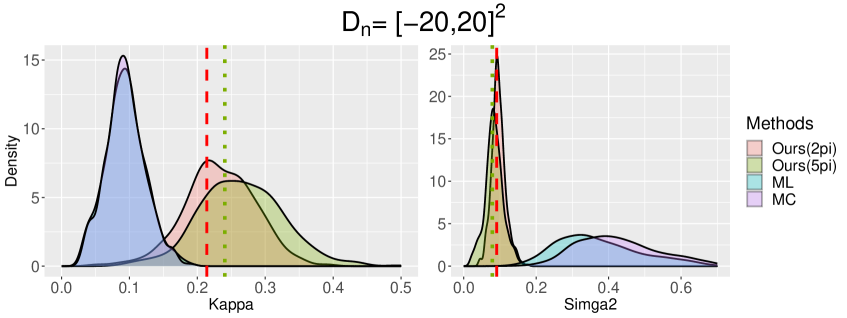
Appendix I Spectral methods for nonstationary point processes
I.1 A new DFT for the intensity reweighted process
Recall the th-order intensity function as in (2.1). In this section, we do not presuppose the (second-order) stationarity of the point process . Instead, we let be a simple second-order intensity reweighted stationary (SOIRS) point process on (Baddeley et al. (2000)). That is, there exists such that
| (I.1) |
where is the first-order intensity that does not need to be a constant. The second-order stationary point processes fit within this framework by setting , where is the constant first-order intensity and is the reduced second-order cumulant intensity function.
To leverage the Fourier methods developed for the stationary case, we consider a slight variant of the ordinary DFT defined in (2.8). The analogous large sample results for the ordinary DFT under the SOIRS framework are similar, with greater details provided in Ding et al. (2024).
Definition I.1 (Intensity reweighted DFT).
Let be an SOIRS spatial point process on () of form (2.6). Then, the intensity reweighted DFT (IR-DFT) with the data taper is defined as
| (I.2) |
Before investigating the theoretical properties of the IR-DFT, we draw a comparison between the IR-DFT and the ordinary DFT. Firstly, unlike the ordinary DFT, is contingent on the underlying unknown first-order intensity function. Secondly, under stationarity, and in (2.8) are related through , where is the constant first-order intensity. Lastly, by using (2.1), we have , where is the bias factor as defined in (2.10). Therefore, the expectation of the IR-DFT is a deterministic function depends solely on the data taper and the domain .
By using the above bias expression, we now can define the theoretical centered IR-DFT and IR-periodogram respectively as
| (I.3) |
I.2 Asymptotic properties of the IR-DFT and IR-periodogram
In this section, we study asymptotic properties for the IR-DFT and IR-periodogram. To do so, we adopt a different asymptotic framework compared to the stationary case. This is because if we only rely on Assumption 3.1 as our asymptotic setup for general SOIRS processes, there is no gain in information of at the fixed location as the domain increases. Therefore, in a similar spirit to Dahlhaus (1997), we consider an infill-type asymptotic framework for the first-order intensity function below. For a domain , we use the notation to indicate the observations of are confined within .
Assumption I.1.
Let () be a sequence of SOIRS processes defined on the increasing domain of form (2.6). Let and be the first- and second-order cumulant intensity functions of , respectively. Then, the following structural assumptions on and hold:
-
(i)
For , is a strictly positive function on and there exists non-negative function , , with a compact support on , such that
(I.4) -
(ii)
For and , where does not depend on .
Under Assumption I.1(i), the IR-DFT can be written as
| (I.5) |
Here, we use the notation instead of to emphasize the asymptotic framework as in Assumption I.1(i). The centered IR-DFT and IR-periodogram, denoted by and , respectively, can be defined similarly.
Theorem I.1 below addresses the asymptotic uncorrelatedness of the IR-DFTs.
Theorem I.1 (Asymptotic uncorrelatedness of the IR-DFT).
Let () be a sequence SOIRS point processes that satisfy Assumption I.1. Suppose that Assumptions 3.1, 3.2 (for ), and Assumption 3.4(i) hold. Furthermore, from (I.4) is strictly positive and continuous on . Let and be two asymptotic distant sequencies on . Then,
| (I.6) |
If we further assume , then
| (I.7) |
Proof.
To prove the theorem, we first start with the expression of the covariance of the IR-DFT. The proof of lemma below is almost identical to that of the proof of Lemma D.1 so we omit the details.
Lemma I.1.
Under second-order stationarity, an expectation of the periodogram converges to the spectral density function. Bearing this in mind, along with the limiting behavior in (I.7), we define the intensity reweighted pseudo-spectral density functions SOIRS processes.
Definition I.2 (Intensity reweighted pseudo-spectral density function).
It follows from (I.7) that is an even and non-negative function on . However, unlike the classical spectral density function, the IR-PSD depends on the specify data taper function . Under stationarity, equals , where is the spectral density.
In the theorem below, we derive the asymptotic joint distribution of the theoretical IR-DFTs and IR-periodograms. The proof is almost identical to that of Theorem 3.2, so we omit the details.
Theorem I.2 (Asymptotic joint distribution of the IR-DFTs and IR-periodograms).
Let () be a sequence of SOIRS spatial point processes that satisfy Assumption I.1. Suppose that Assumptions 3.1, 3.2 (for ), 3.3(i), and 3.4(i) hold. Furthermore, from (I.4) is strictly positive and continuous on . For a fixed , , …, denote sequences on that satisfy conditions (1) and (3) in the statement of Theorem 3.2. Then,
where are independent standard normal random variables on . By using continuous mapping theorem, we conclude
where are independent chi-squared random variables with degrees of freedom two.