Gaussian process regression for transition state search
Abstract
We implemented a gradient-based algorithm for transition state search which uses Gaussian process regression (GPR). Besides a description of the algorithm we provide a method to find the starting point for the optimization if only the reactant and product minima are known. We perform benchmarks on test systems against the dimer method and partitioned rational function optimization (P-RFO) as implemented in the DL-FIND library. We found the new optimizer to significantly decrease the number of required energy and gradient evaluations.
1 Introduction
The investigation of reaction mechanisms is a central goal in theoretical chemistry. Any reaction can be characterized by its potential energy surface (PES) , the energy depending on the nuclear coordinates of all atoms. Minima on the PES correspond to reactants and products. The minimum-energy path, the path of lowest energy that connects two minima, can be seen as an approximation to the mean reaction path. It proceeds through a first-order saddle point (SP). Such a SP is the point of highest energy along the minimum-energy path. The energy difference between a minimum and a SP connected to the minimum is the reaction barrier, which can be used in transition state theory to calculate reaction rate constants. SPs are typically located by iterative algorithms, with the energy and its derivatives calculated by electronic structure methods in each iteration. Thus, SP searches are typically the computationally most expensive procedures in the theoretical study of reaction mechanisms. Thus, efficient black-box algorithms are required to increase the efficiency of such simulations. Here, we present such an algorithm based on machine learning techniques.
A fist-order saddle point is characterized by a vanishing gradient of the energy with respect to all coordinates and a single negative eigenvalue of the respective Hessian. The eigenmode corresponding to that negative eigenvalue is the transition mode, a tangent of the minimum-energy path. The SP can be seen as an approximation of the transition state. While a general transition state is a surface that encapsulates the reactant minimum, the lowest-energy point on such a general transition state that minimizes recrossing is in many cases a fist-order SP. Thus, a SP is often referred to as transition structure or simply as transition state (TS).
Since the search for transition states is such a central task in computational chemistry, many algorithms have been proposed. The most general one is probably a full Newton search. This has the disadvantage that it converges to any SP, not necessarily first-order ones. Moreover, it requires to calculate the Hessian of the potential energy with respect to the coordinates at each step, which is computationally rather expensive. An algorithm, which also requires Hessian information, but converges specifically to first-order SPs is the partitioned rational function optimization1 (P-RFO), which is based on the rational function approximation to the energy of the RFO method.2 It typically shows excellent convergence properties, but its requirement for Hessians renders P-RFO impractical in many cases. Algorithms that find first-order SPs without Hessian information are the so-called minimum mode following methods3. They find by rotating a dimer on the PES4 or the Lanczos method.5, 6 By reversing the component of the force in the direction of one can build a new force that takes the algorithms to a first-order SP.
Previous work compared P-RFO and gradient-based minimum mode following methods and found the latter to be advantageous in many cases.7 Even if they need more steps until convergence, this is compensated by the fact that no Hessians have to be calculated.
The P-RFO-based optimization technique we present in this paper locates SPs without Hessian information. It uses energy and gradient information in the methodology of Gaussian process regression (GPR).8 This allows us to use P-RFO on an interpolated PES that is much cheaper to evaluate than the original PES without ever calculating Hessians on the original PES. Kernel-based methods like GPR are increasingly used in theoretical chemistry to predict different kinds of chemical properties. 9, 10, 11, 12, 13, 14, 15, 16, 17, 18 Among these are minimization algorithms on the PES,19, 20 in some cases even without the requirement for analytical gradients.19 Especially interesting for our case is that GPR was already used to search for SPs: the efficiency of the nudged elastic band method (NEB)21, 22 was drastically improved using GPR.23, 24 In contrast to that approach, we use a surface walking algorithm, focusing on the SP rather than optimizing the whole path.
Sometimes it can be difficult to make a good first guess for the SP to start the algorithm. For the NEB method a procedure was introduced to provide a starting path using only geometrical properties of the system at two known minima. It is called image-dependent pair potential (IDPP).25 If we know the two minima that the wanted TS connects, we will make use of that potential to find an initial guess for our TS to start the optimization.
This paper is organized as follows. We briefly introduce the methodology of GPR in the next section. Subsequently we describe in detail how our optimizations make use of GPR. Then we show some benchmarks of the new optimizer and compare it to the well-established dimer method and P-RFO in DL-FIND.26, 27 The complete algorithm presented in this paper is implemented in DL-FIND and accessible via ChemShell. 28, 29 The code will be made publicly available.
All properties in this paper are expressed in atomic units (Bohr for positions and distances, Hartree for energies), unless other units are specified.
2 Methods
Gaussian process regression.
The idea of GPR is described at length in the literature8 and we will only briefly review the basic idea. One can build a surrogate model for the PES using energies at certain configurations of the molecule . These configurations are called training points. In Cartesian coordinates the dimension of the system is , while is the number of atoms in the system. The key element of the GPR scheme is the covariance function . The covariance function describes the covariance between two random variables at the points and that take on the value of the energies. In simplified terms, the covariance function is a similarity measure between these two energies. In our case we use a form of the Matérn covariance function30
| (1) |
in which we abbreviated . The parameter describes a characteristic length scale of the Gaussian process (GP). It determines how strongly the covariance between two random variables (describing energies) decreases with distance.
Given a prior estimate of the PES, before we have included the training points in the interpolation, one can build the GPR-PES as follows.
| (2) |
The vector is the solution of the linear system
| (3) |
for all . The elements
| (4) |
are the entries of the so called covariance matrix in which is the Kronecker delta. The parameter describes a noise that one assumes on the energy data. If one includes gradients in the scheme, one can introduce an additional parameter for the noise on the gradient data.
Since the kernel function is the only dependency of , we can obtain gradients and Hessians of the GPR-PES. For the first derivative in dimension , i.e. in the direction of the -th unit vector we get
| (5) |
and similarly
| (6) |
for second derivatives, in dimensions and . In a previous paper we explicitly describe how one can include gradient information into this scheme.20 In this paper we always use energy and gradient information at the training points. In order to build the GPR-PES we then have to solve a linear system with a covariance matrix of size . We solve this linear system via Cholesky decomposition. This yields a scaling of . In our case we can decrease the formal scaling to with a multi-level approach described below.
The optimization algorithm.
In our optimization algorithm we take a similar approach as the P-RFO optimizer and built up a surrogate model for the PES. In contrast to P-RFO we only use energy and gradient information. We do not need any second derivatives. We use GPR to build the surrogate model by interpolating the energy and gradient information we obtain along the optimization procedure. On the resulting GPR-PES we can cheaply obtain the Hessian and therefore, also perform a P-RFO optimization. Our algorithm can be seen as a GPR-based extension to P-RFO to dispense the need for Hessian evaluations. The result is used to predict a SP on the real PES. We perform all optimizations in Cartesian coordinates.
Convergence criteria.
We call the vector that points from the last estimate of the TS to the current estimate of the TS the step vector , while the gradient at the current estimate of the TS is referred to as . DL-FIND uses a combination of convergence criteria, given a single tolerance value, . The highest absolute value of all entries and the Euclidean norm of both, and , have to drop below certain thresholds:
| (7) | ||||||
| (8) | ||||||
| (9) | ||||||
| (10) | ||||||
In these equations stands for the number of dimensions in the system. If all these criteria are fulfilled, the TS is considered to be converged. These are the same criteria that are used for other TS optimizers in DL-FIND.
Parameters.
We chose a length scale of during all optimization runs. The noise parameters were chosen as . Despite accounting for numerical errors in the electronic structure calculations they also function as regularization parameters to guarantee convergence of the solution in Equation (3). We chose the noise parameters as small as possible without compromising the stability of the system. We generally found small values for the noise parameters to work better for almost all systems. As the prior mean, , of Equation (2), we set the mean value of all training points.
| (11) |
The parameter , the maximum step size, must be specified by the user.
Converging the transition mode.
We start the optimization at an initial guess for the SP. At this point we obtain an approximate Hessian from a GPR-PES constructed from gradient calculations. This is done in such a way that we try to converge the eigenvector to the smallest eigenvalue of the Hessian, the transition mode . An estimate of that transition mode at the point is found according to the following procedure, which is the equivalent of dimer rotations in the dimer method.
-
1.
Calculate the energy and the gradient at the point and also at the point
(12) with arbitrarily chosen. We generally chose . The results are included as training points in a new GPR-PES. We set for our optimizer. Let .
-
2.
Evaluate the Hessian of the resulting GPR-PES at the point .
-
3.
Compute the smallest eigenvalue of and the corresponding eigenvector .
-
4.
As soon as
(13) we assume that the transition mode is converged, this procedure is terminated, and we move on the PES as we describe in the next section.
-
5.
If the transition mode is not converged, calculate the energy and gradient at the point
(14) and include the results to build a new GPR-PES. Increment by one and go back to step .
The procedure to converge the transition mode is not repeated after each movement of on the PES but only after such moves. In these cases we start at the second step of the described procedure with the evaluation of the Hessian at the respective point. The initial guess for the transition mode after steps is the vector of the last optimization of the transition mode. We use (an angle smaller than ) at the very first point and (an angle smaller than ) at every subsequent point at which we want to converge the transition mode.
Performing steps on the PES.
In agreement with the minimum-mode following methods we assume that we have enough Hessian-information available to move on the PES to the SP as soon as the transition mode is found. We call the points that are a result from these movements on the PES , with . The points correspond to the midpoints in the dimer method. We use a user-defined parameter to limit the step size along the optimization. The step size can never be larger than . The steps on the PES, starting at the point , are performed according to the following procedure.
-
1.
Find the SP on the GPR-PES using a P-RFO optimizer. This optimization on the GPR-PES is stopped if one of the following criteria is fulfilled.
-
•
The step size of this optimization is below .
-
•
We found a negative eigenvalue (smaller than ) and the highest absolute value of all entries of the gradient on the GPR-PES drops below .
-
•
The Euclidean distance between the currently estimated TS and the starting point of the P-RFO optimization is larger than .
If none of these are fulfilled after P-RFO steps, we use a simple dimer translation. The dimer translation is done until one of the criteria above is fulfilled or the Euclidean distance between the currently estimated TS and the starting point is larger than . The P-RFO method converged in less than steps in all of the presented test cases of this paper.
-
•
-
2.
Overshooting the estimated step, according to the overshooting procedures described in the next section, resulting in .
-
3.
Calculate the energy and gradient at and build a new GPR-PES.
The used P-RFO implementation for this procedure is the same as used in DL-FIND (with Hessians of the GPR-PES re-calculated in each step). P-RFO tries to find the modes corresponding to overall translation and rotation of the system and ignores them. Numerically, it is not always clear which modes these are. Therefore, we found it to be very beneficial to project the translational modes out of the inferred Hessian. This yields translational eigenvalues that are numerically zero. Otherwise, the TS search via P-RFO tends to translate the whole molecule, leading to an unnecessary large step size.
Overshooting.
As we have done in the optimization algorithm for minimum search,20 we try to shift the area in which we predict the SP to an interpolation regime rather than an extrapolation regime. This is because machine learning methods perform poorly in extrapolation. The overshooting is done, dependent on the angle between the vectors along the optimization: let be the vector from the point to the next estimate for the TS according to the first step in the procedure described in the previous section. Let be the vector pointing from to . If , the point is simply calculated according to the procedure described in the previous section with no overshooting. We calculate an angle
| (15) |
and introduce a scaling factor
| (16) |
that scales
| (17) |
as soon as . The scaling limit is chosen to be . But it is reduced if the algorithm is close to convergence and it is increased if for two consecutive steps, i.e. we overshoot more than once in a row. We refer to our previous work for a more detailed description of the calculation of .20 We also use the separate dimension overshooting procedure from that paper: if the value of a coordinate along the steps changed monotonically for the last steps, a one dimensional GP is used to represent the development of this coordinate along the optimization. It is optimized, independent from the other coordinates. To account for coupling between the coordinates in succeeding optimization steps this procedure is suspended for steps after it was performed. After these two overshooting procedures the step is scaled down to . The chosen overshooting procedures might seem too aggressive at first glance. But the accuracy of the GPR-PES is largely improved if we overshoot the real TS. This is a crucial difference to conventional optimizers: a step that is too large/in the wrong direction can still be used to improve the next estimate of the TS.
Multi-level GPR.
Just like in our previous work20 we include a multi-level scheme to reduce the computational effort of the GPR. A more detailed explanation of the multi-level approach can also be found there. The most demanding computational step in the GPR scheme is solving Equation (3). The computational effort to solve this system can be reduced by limiting the size of the covariance matrix. Our multi-level scheme achieves this by solving several smaller systems instead of one single large system. This eliminates the formal scaling with the number of steps in the optimization history. To achieve this, we take the oldest training points in the GP to build a separate GP called . This is done as soon as the number of training points reaches . The predicted GPR-PES from is used as in Equation (2) for the GP built with the remaining training points that we call . The new training points are added to . When eventually has more than training points we rename to and use the oldest training points in to build a new . We always take as the prior to . The with the highest index just uses the mean of all energy values at the contained training points as its prior. The number of levels increases along the optimization but since the number of points in all is kept below a certain constant the formal scaling of our GPR scheme is . Splitting the points which were used to converge the smallest eigenvalue of the Hessian (according to the procedure for the converging of the transition mode described above) leads to a loss in accuracy of the second order information of the GPR-PES and consequently, to inaccurate predictions of the step direction by the underlying P-RFO. Therefore, we increase and by one if those points would be split into different levels and try the splitting again after including the next training point. When we successfully performed the splitting, the original values of and are restored. We set the values and for all tests performed in this paper. We also want to guarantee that we always have information about the second derivative in . Therefore, we start our Hessian approximation via Procedure 1 after steps on the PES. As a result, the points that belong to the last Hessian approximation are always included in . The method described so far is referred to as GPRTS in the following.
Finding a starting point via IDPP.
If one intends to find a TS that connects two known minima, the algorithm tries to find a good guess for the starting point of the TS search automatically. To that end we optimize a nudged elastic band (NEB) 21, 22 in the image dependent pair potential (IDPP).25 The construction of this potential does not need any electronic structure calculations, but is a good first guess for a NEB path based on geometrical considerations. Given images of the optimized NEB in the IDPP, our algorithm calculates the energy and gradient of the real PES at image with for even and for odd . Only from this point on we perform energy evaluations of the real PES. Then we calculate the scalar product between the gradient at point and the vector to the next image on the NEB path.
| (18) |
If , we calculate the energy and the gradient at , otherwise at in order to aim at a maximum in the energy. This is repeated until we change the direction along the NEB and would go back to a point at which we already know the energy and the gradient. The point we found in this procedure is assumed to be the best guess for the TS on the NEB and is the starting point for our optimizer. All the energy and gradient information acquired in this procedure is used to build the GPR-PES. The optimization technique including the usage of the NEB in the IDPP potential will be abbreviated as GPRPP.
3 Results
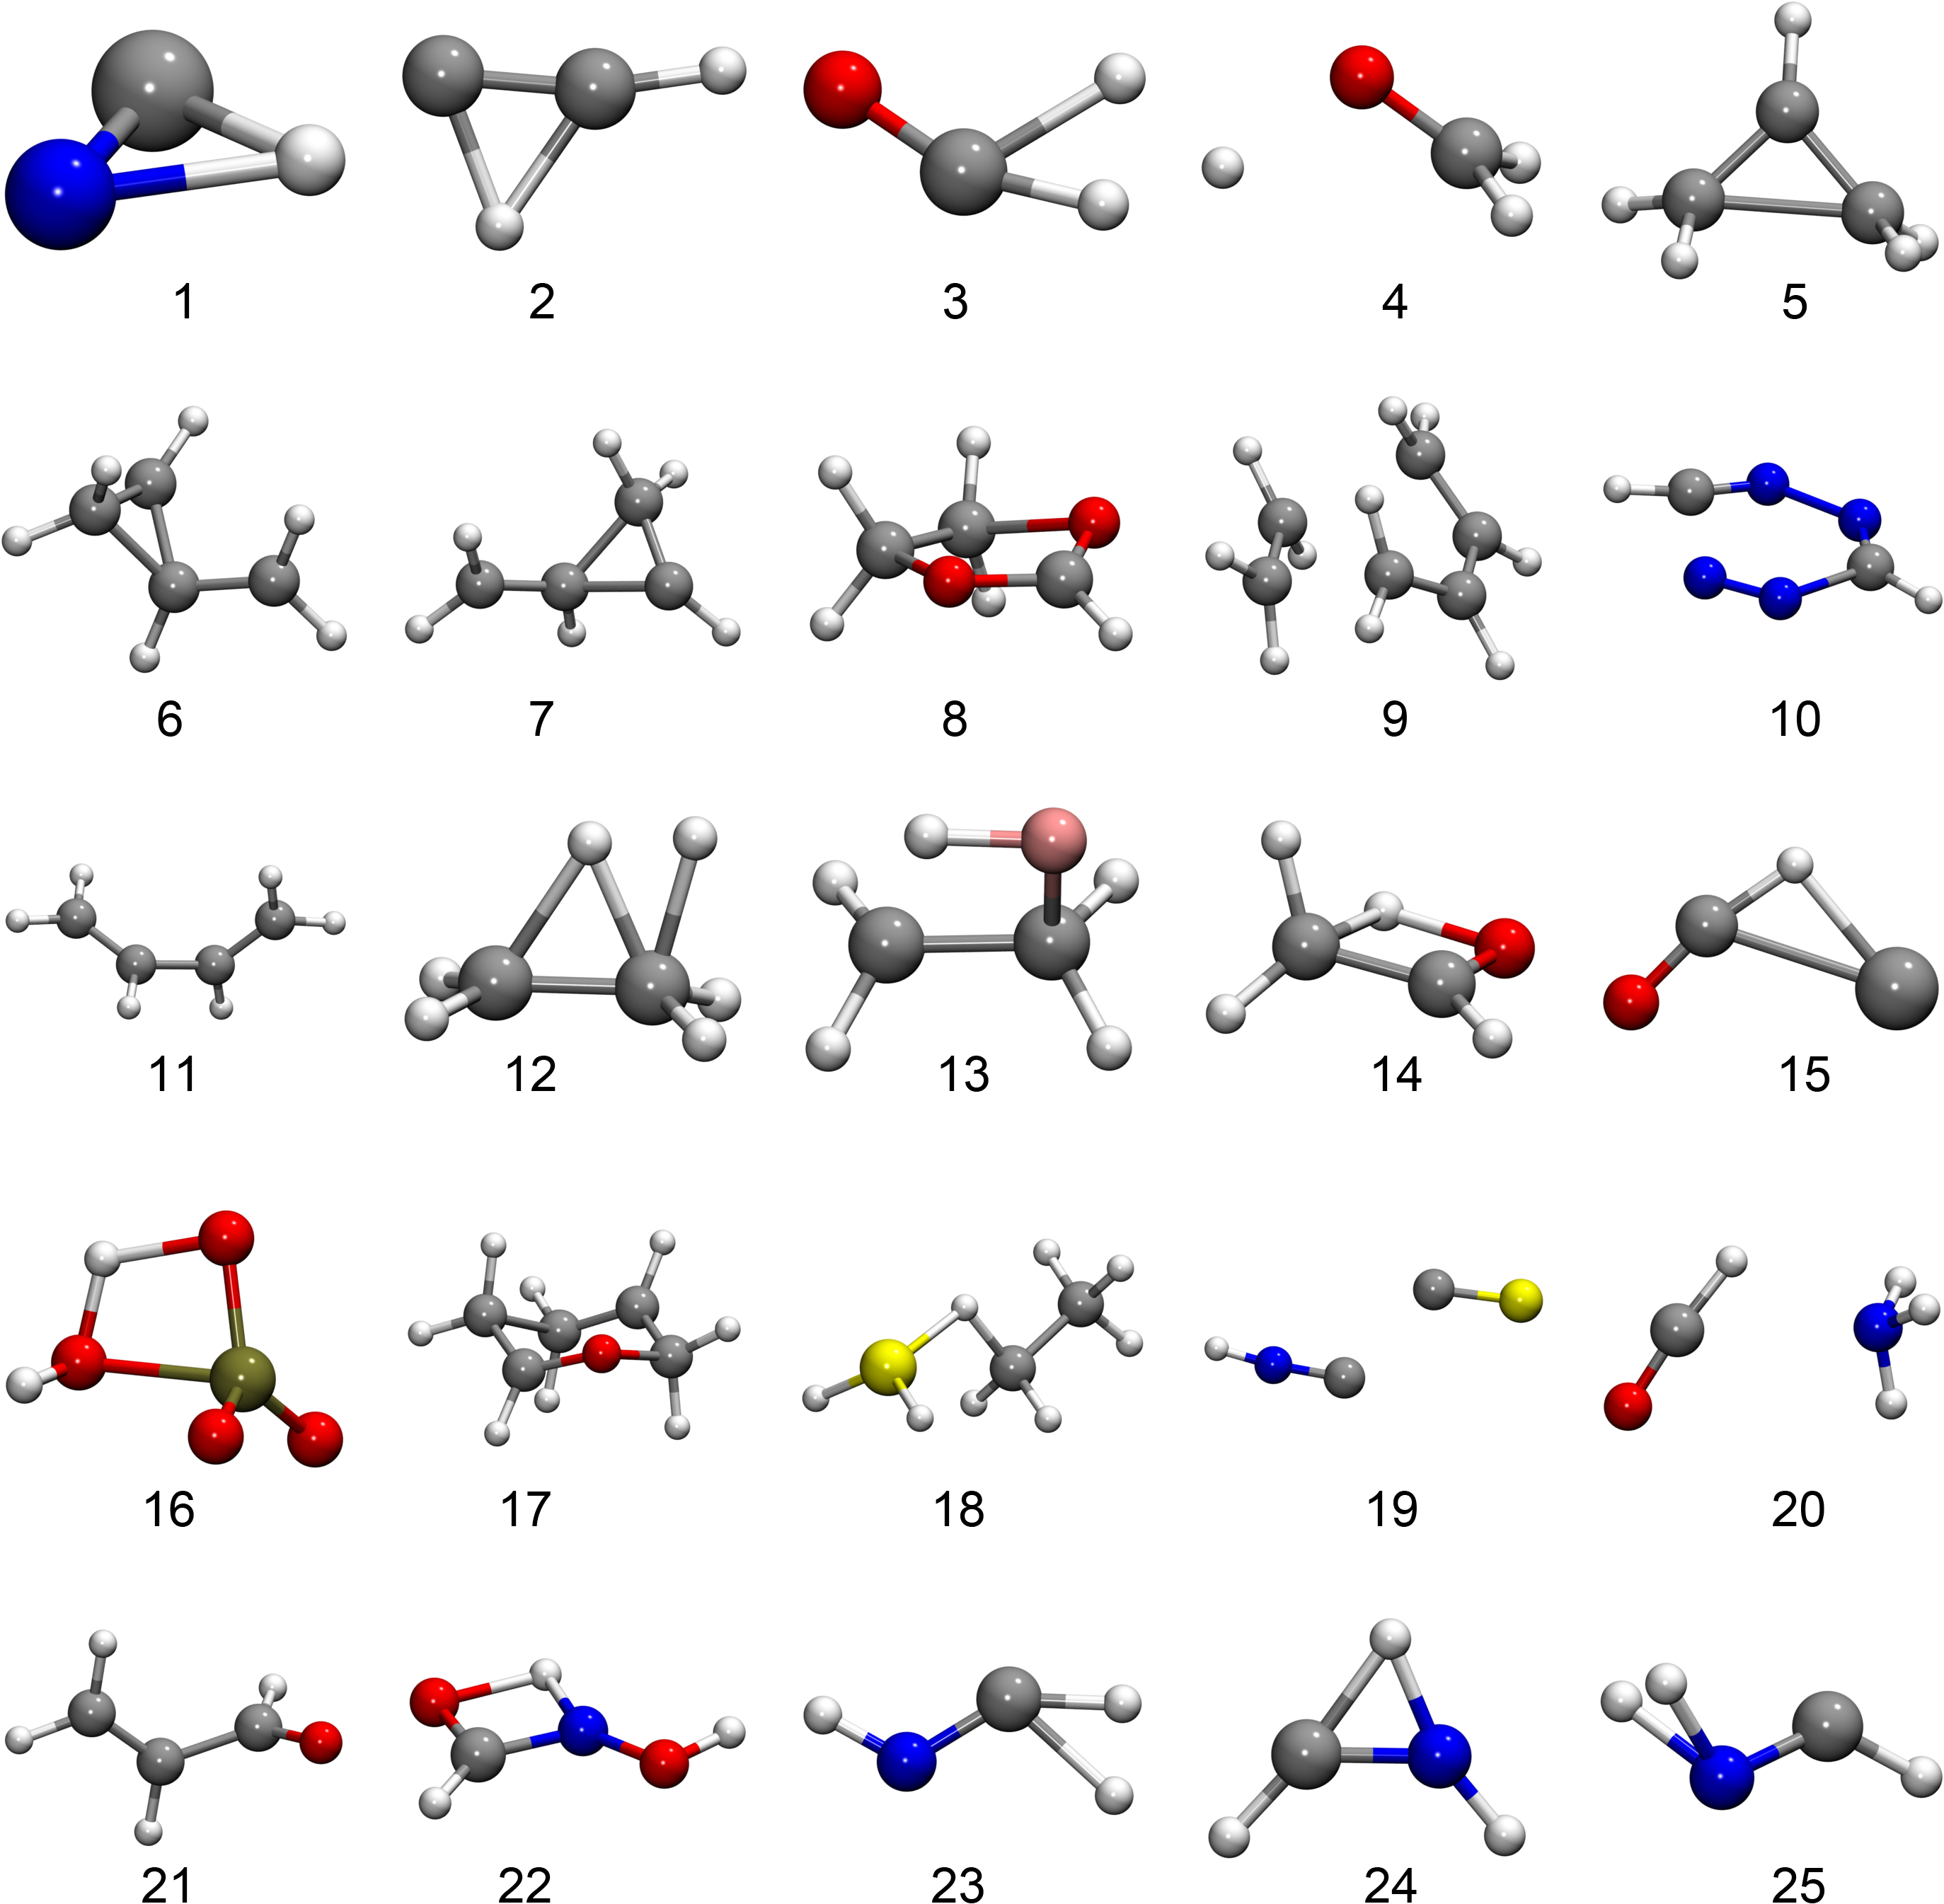
To benchmark our TS search we chose test systems: first of all, test systems suggested by Baker.31 The starting points of the optimizations were chosen following Ref. 31 close to a TS on Hartree–Fock level. However, we use the semi-empirical AM132 method for the electronic structure calculations. We plot all the TSs we found in the Baker test set in Fig. 1. These TSs were found by GPRTS except for the TS in system , , and for which we used the dimer method. These exceptions were made since the GPRTS method finds a different transition than implied by the test set for system and . For system GPRTS does not converge.
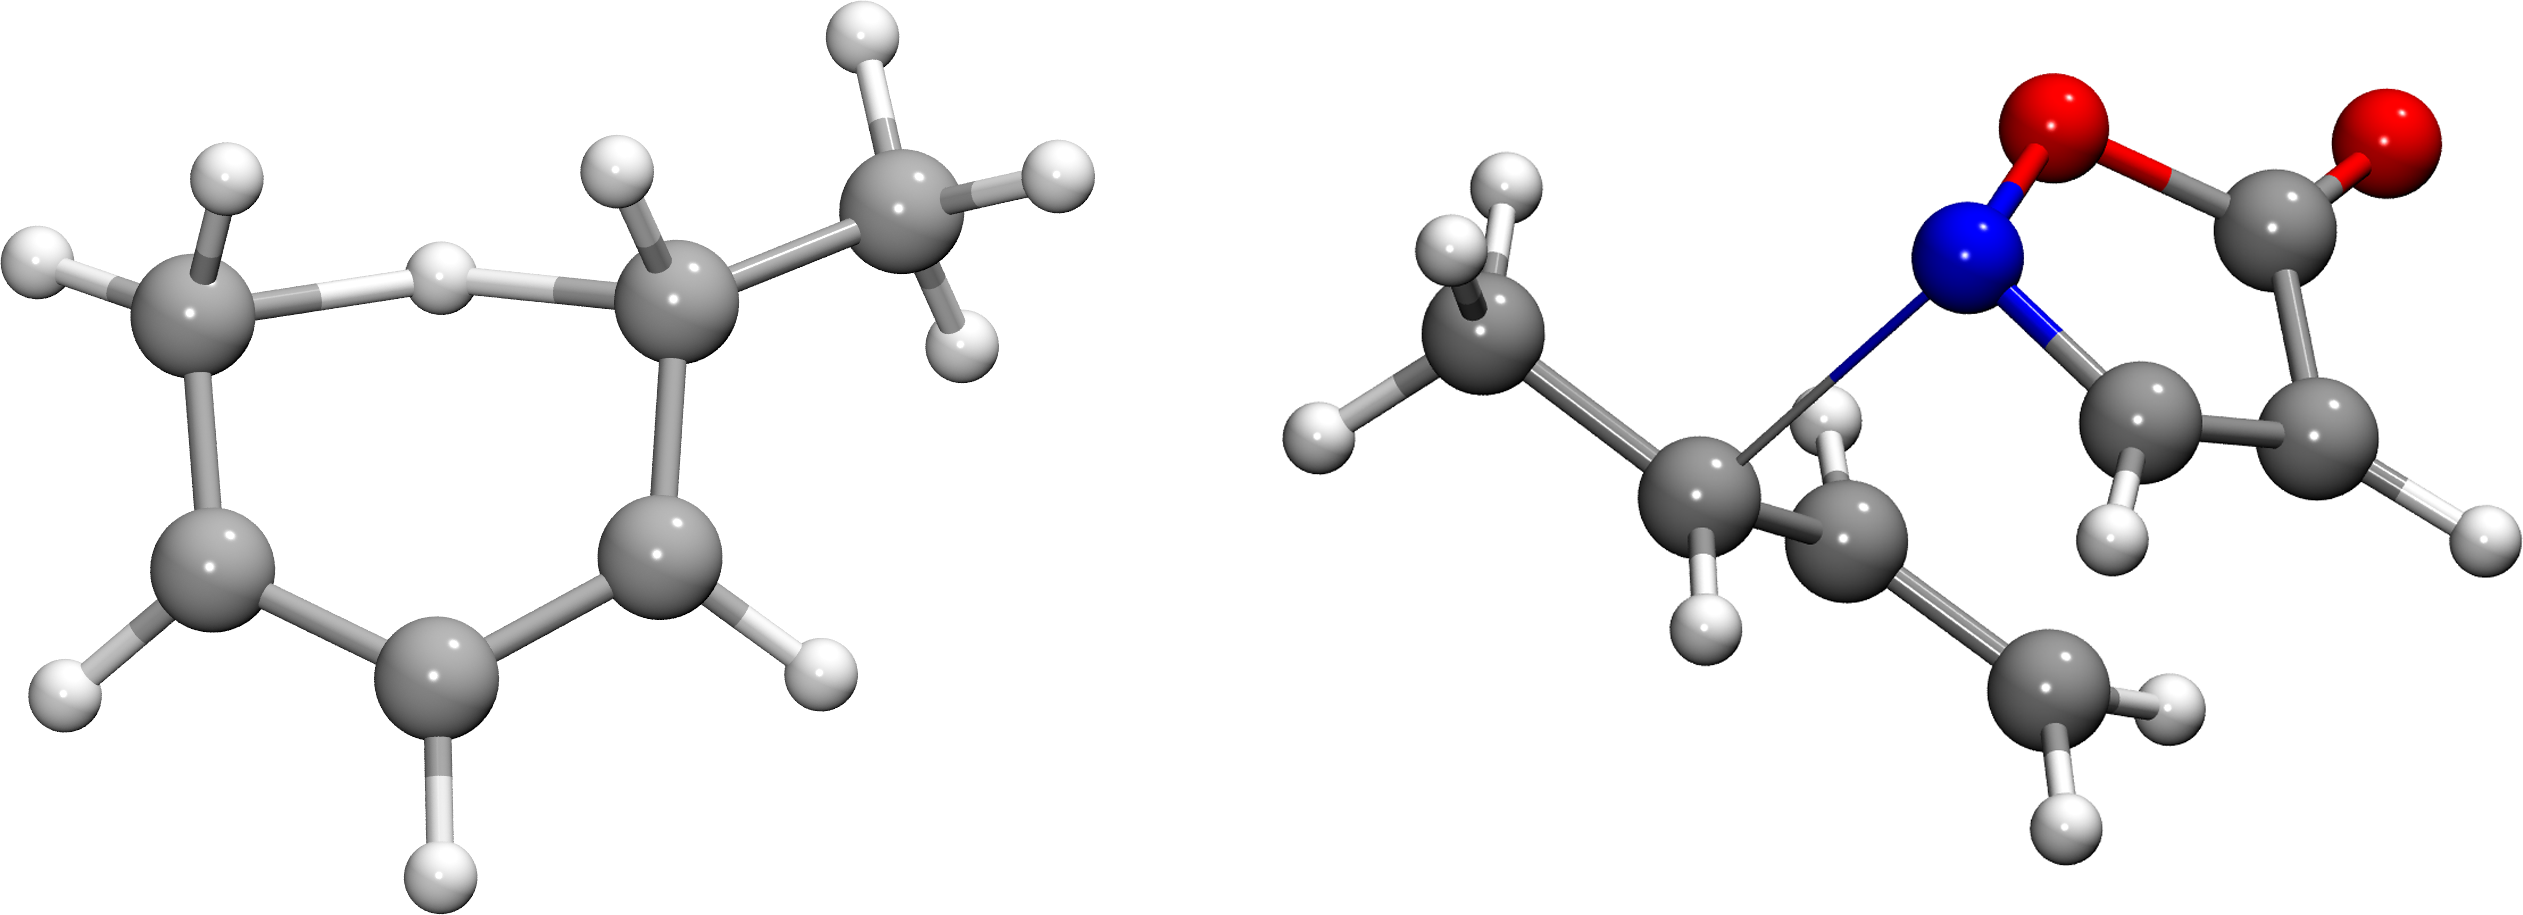
Furthermore, we chose two test systems on DFT level using the BP86 functional33, 34 and the 6-31G* basis set.35 Firstly, an intramolecular [1,5] H shift of 1,3(Z)-hexadiene to 2(E),4(Z)-hexadiene as investigated in Ref. 36. Secondly, an asymmetric allylation of a simple isoxazolinone as investigated in Ref. 37, see Fig. 2. The starting points for the TS searches on those two systems were chosen by chemical intuition to approximate the real TS.
In the next section we compare the new GPR-based TS search (GPRTS) against the dimer method and the P-RFO method as they are implemented in DL-FIND. This is our first benchmark. In the following section we evaluate our GPRPP approach as a second benchmark.
Every time the energy is evaluated we also evaluate the gradient, a process which will be referred to merely as energy evaluation in the following for simplicity.
| Energy evaluations | Energy differences | RMSD values | ||||||
|---|---|---|---|---|---|---|---|---|
| GPRTS | dimer | P-RFO | dimer | P-RFO | dimer | P-RFO | ID | |
| nc | ||||||||
| err | ||||||||
| err | ||||||||
| err | err | |||||||
Benchmarking the optimization.
We optimized the TSs of our test set using the new GPRTS optimizer and also the established dimer method and the P-RFO method in DL-FIND. We compare the number of energy evaluations that all three methods need until convergence in table 1. Note that analytic Hessians are available for systems and . P-RFO uses () analytic Hessians for system (). Those are not counted as energy evaluations. In the other systems the Hessians are calculated using central difference approximation via gradients. The required gradients are counted as energy evaluations in the table. Note that every energy evaluation in our tables always refers to evaluating the energy and the gradient of the PES. We chose a maximum step size of and a tolerance for all optimizations.
The P-RFO method calculates the Hessian at the first point and then only every following steps. All other Hessians are inferred via the update mechanism by Bofill. 38
We see that the GPRTS method generally requires fewer energy evaluations than the other methods and has the least convergence problems. In table 1 we also show the energy differences (the energy from the respective method minus the energy from GPRTS) and root mean squared deviations (RMSD) of the found TSs, compared to the TSs found by GPRTS. Looking at the specific systems with relevant deviations for the found TSs we observe the following differences, compare Fig. 1:
-
•
System 3: P-RFO finds a different TS in which is completely abstracted. Its energy is Hartree lower than that of the TS found by GPRTS.
-
•
System 4: GPRTS and P-RFO yield a smaller distance of the -Atom to the remaining atom. which corresponds to a different transition than intended: a rotation of the group.
-
•
System 6: GPRTS finds a different angle H–C–C at the carbene end.
-
•
System 7: P-RFO finds an opening of the ring structure which remains closed in the other cases.
-
•
System 10: GPRTS finds a TS in that is abstracted, the dimer method finds the depicted opening of the ring. The opening of the ring is also found via GPRTS if one uses a smaller step size. P-RFO finds a closed ring structure as the TS.
-
•
System 11: P-RFO finds a more planar structure.
-
•
System 14: The dimer method finds a mirror image of the TS found by the other methods, thus the high RMSD.
-
•
System 20: P-RFO finds a different orientation of , rotated relative to , and also with a slightly different distance.
-
•
System 22: P-RFO finds a different angle of the attached group. The resulting molecule is not planar. The resulting structures of GPRTS and the dimer method are planar.
-
•
System 26: P-RFO does not find the -transfer but an opening of the ring.
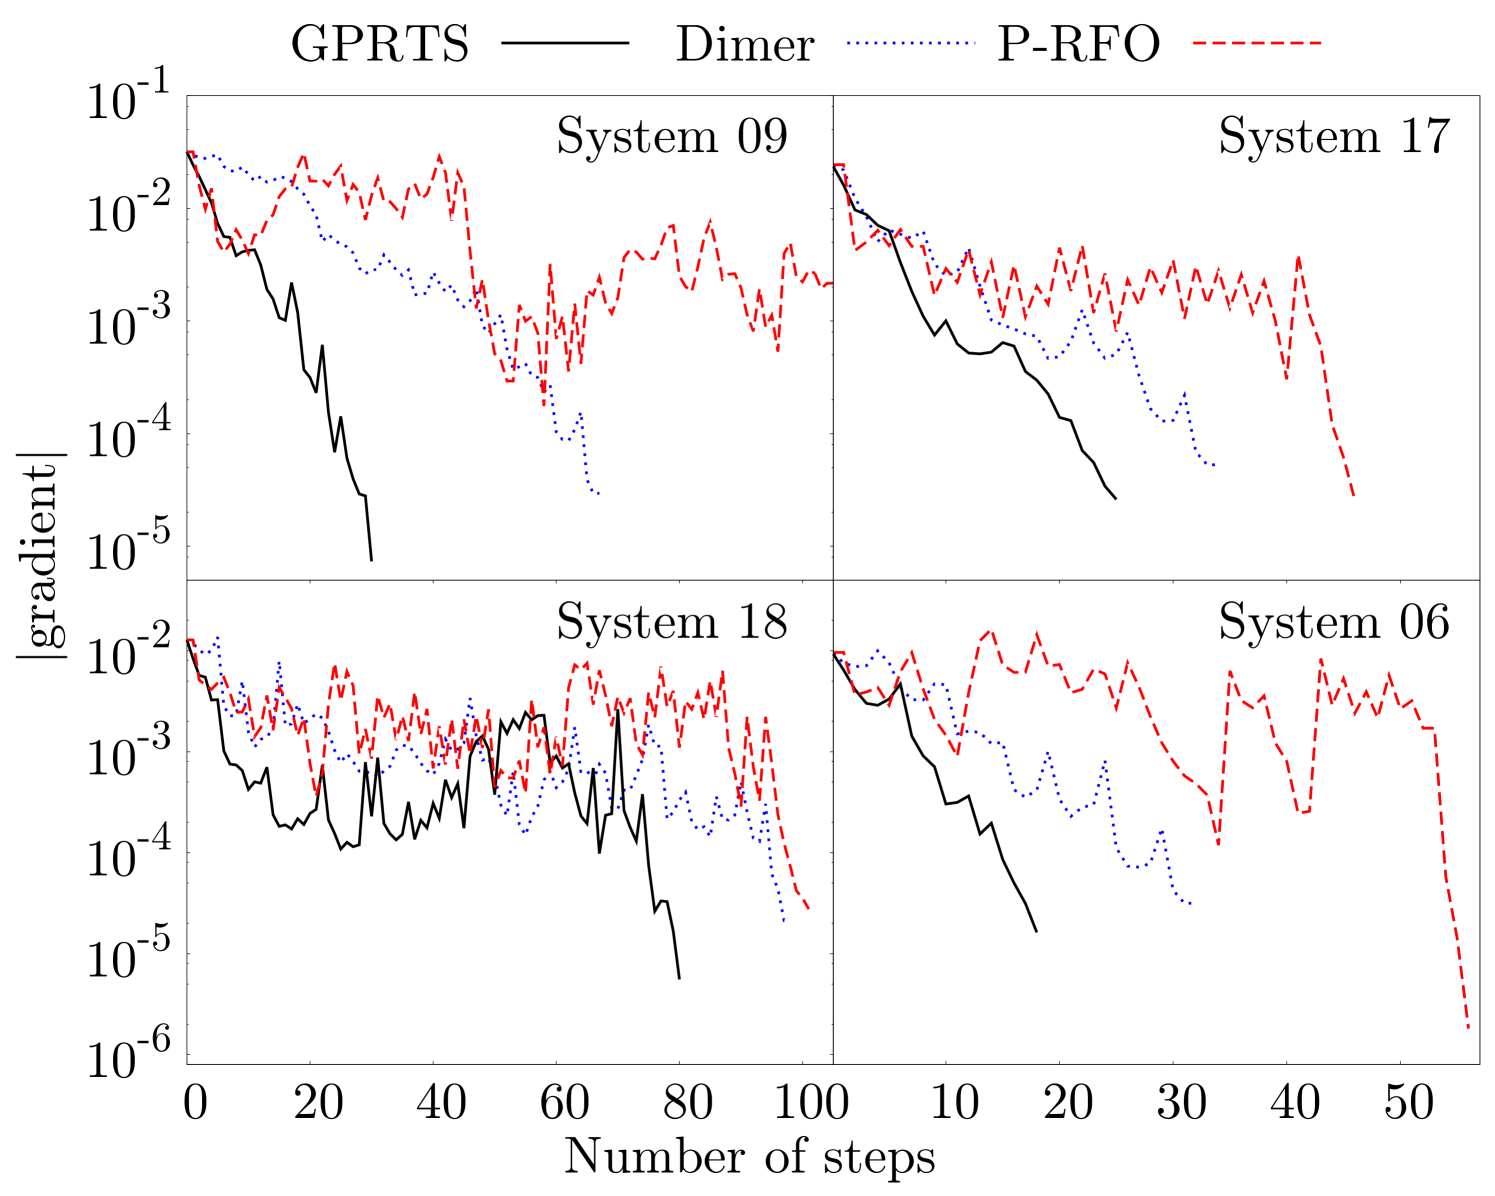
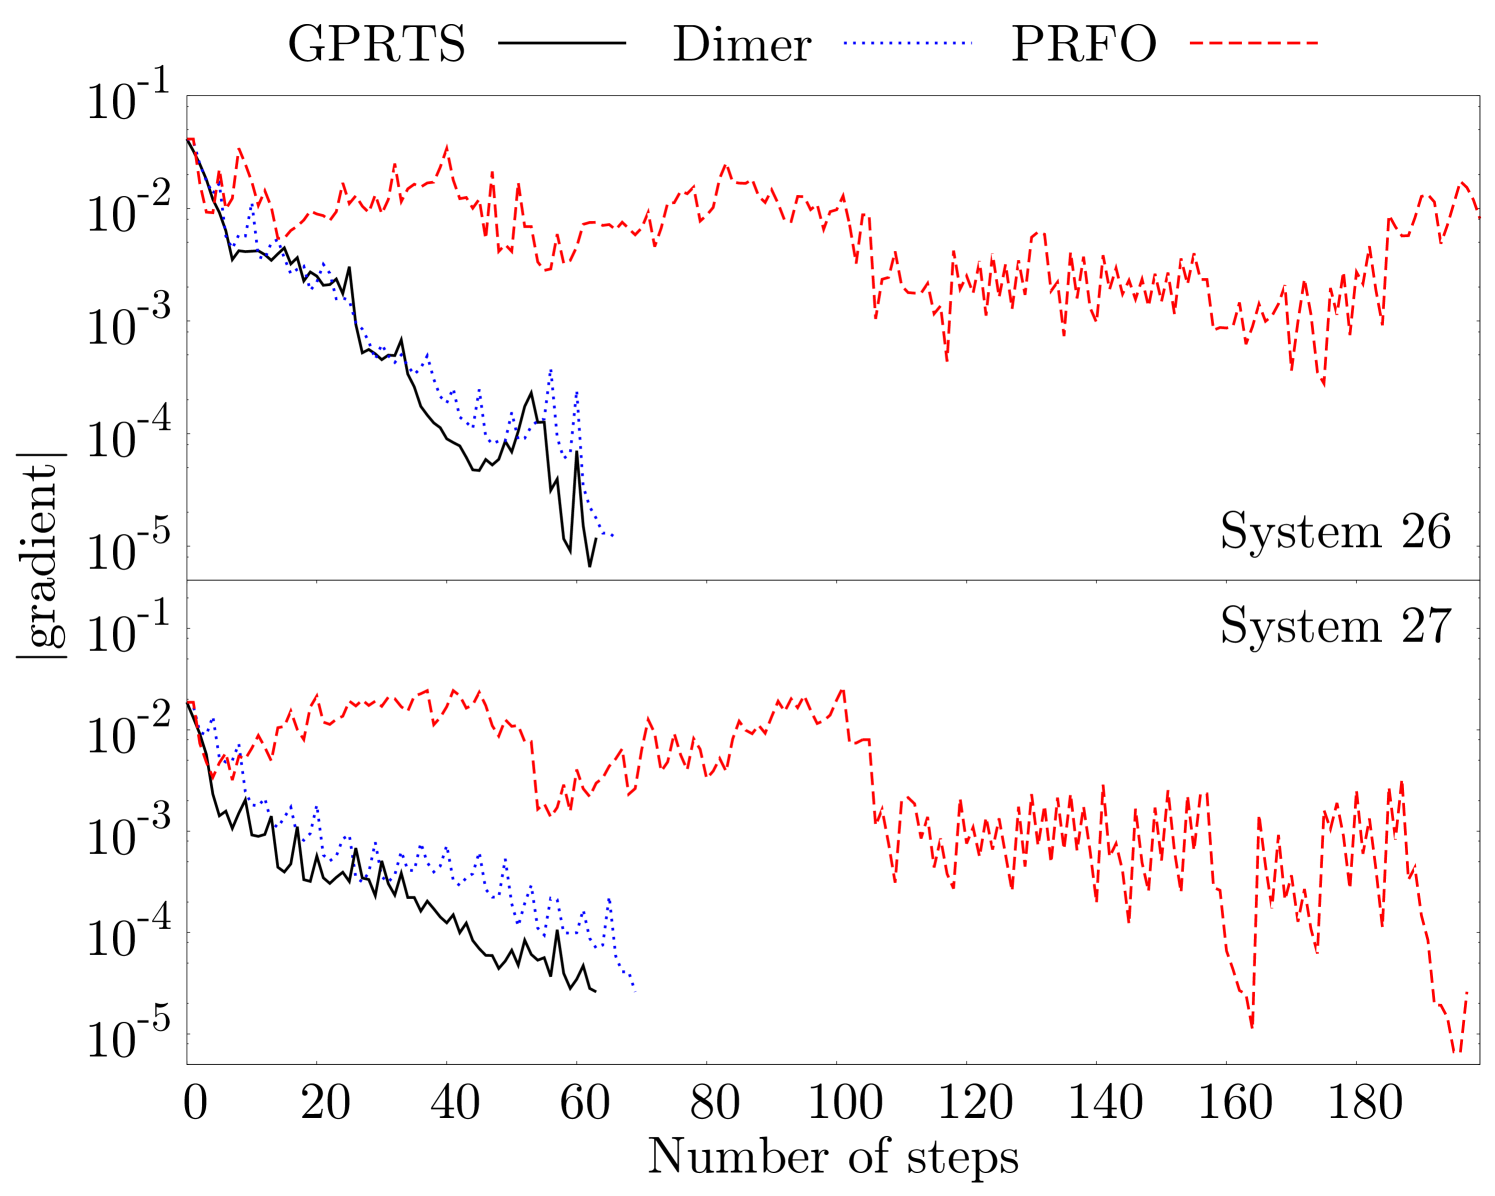
Furthermore, we also compare the evolution of the residual error of GPRTS, P-RFO, and the dimer method during the TS search for the four largest test systems in the Baker test set in Fig. 3 and for systems and in Fig. 4. In both plots we only count the number of steps on the PES that are taken along the optimization runs. The energy evaluations performed to converge the transition mode, to rotate the dimer, and to calculate the Hessian in P-RFO are excluded. We see a significant speedup with the new GPRTS optimizer. In addition, the new method needs also fewer gradients than the dimer method to approximate the Hessian appropriately. In our optimizer we often see jumps of the gradient norm at around steps. This is where the multi-level approach creates the first separate GP. Therefore, we include a possibility to increase the number of training points in the last level in the code to get better performance in high-precision calculations. We do not make use of this possibility in all test systems presented in the paper.
Benchmarking GPRPP.
As described in the previous section about finding a starting point via IDPP we use an approximated NEB path between two known minima to find a good starting point for the TS search. To prepare the input for our test systems we proceeded as follows:
- •
-
•
We performed IRC path searches to find the two minima connected by the TS.
-
•
The geometries of these minima are used as starting points for GPRPP.
-
•
Additionally, GPRTS, dimer and P-RFO searches are started from . In GPRPP, the points on the NEB path are included in the GPR, while in GPRTS they are excluded.
In the benchmarks reported in table 2 the additional points to find are included in the number of steps that the GPRPP optimizer needs, but not in the numbers for the other methods. Our approximated NEB path consists of images for all test cases. The number of additional energy evaluations that GPRPP needs to find is or for all test systems. We set the same maximum step size and tolerance value as in the previous section. We compare the number of energy evaluations all methods need until convergence in table 2. We also show the energy differences (the energy from the respective method minus the energy from GPRPP) and RMSD values compared to GPRPP. Note that analytic Hessians are available for systems and . P-RFO uses analytic Hessians for system and for system . Those are not counted as energy evaluations. In the other systems the Hessians are calculated via finite differences and the required gradients are counted as energy evaluations in the table. We observe that GPRPP and GPRTS yield consistently good results. Comparing GPRPP and GPRTS we see no clear tendency whether it is useful to include the points that lead to in order to improve the speed of the convergence. On the other hand, we have one system that only converges when these points are included. We conclude that the stability might be improved using the GPRPP method with the additional training points in comparison to pure GPRTS. This will strongly depend on the choice of the starting point for GPRTS.
| Energy evaluations | Energy differences | RMSD values | |||||||||
|---|---|---|---|---|---|---|---|---|---|---|---|
| GPRPP | GPRTS | dimer | P-RFO | GPRTS | dimer | P-RFO | GPRTS | dimer | PRFO | ID | |
| nc | nc | ||||||||||
| err | |||||||||||
| nc | |||||||||||
| err | |||||||||||
| err | |||||||||||
| err | |||||||||||
| nc | nc | ||||||||||
| nc | |||||||||||
| err | |||||||||||
| err | err | err | |||||||||
Looking at the energy differences and RMSD values we see a few deviations between the results of the different methods that we like to discuss, compare Fig. 1.
-
•
System 4: The abstracted atom has a different angle and distance in every optimization.
-
•
System 10: GPRPP and P-RFO found a closed, symmetric ring structure. GPRTS found a similar ring as in the reference structure depicted in Fig. 1, only with larger distance of the two nitrogen atoms to the carbons. The dimer method leads to a problem with the AM1 SCF convergence.
-
•
System 11: P-RFO finds a more planar structure.
-
•
System 12: The dimer method does not converge. All other methods yield the same TS, in which the two hydrogen atoms that get abstracted are moved more towards one of the carbon atoms.
-
•
System 14: Dimer, GPRTS and P-RFO all find the mirror image of the TS found by GPRPP.
-
•
System 15: GPRPP converges to the correct SP but the suggested starting point leads all other methods to a configuration for which the AM1 SCF cycles do not converge anymore.
-
•
System 18: Dimer and P-RFO yield slightly different angles between the atoms.
-
•
System 20: GPRTS yields unrealistic large distances of the two molecules. The other two methods do not converge. They start unrealistically increasing the distance of the two molecules as well.
-
•
System 23: GPRPP finds the same TS as depicted in Fig. 1, only with a different angle of the hydrogen that is attached to the nitrogen. All other methods find too large, and each a different, distance of the that is abstracted.
-
•
System 27: P-RFO finds a different orientation of the ring structure corresponding to a different TS.
The clear superiority of the new optimizer in the test systems indicates that the GPR-based representation of the Hessian is very well suited for finding the minimum mode. The suggested starting points for the TS searches are plausible in most systems. Overall the initial guess for the TS search using the IDPP seems to be sufficient for our usage in the GPRPP method but is generally not advisable for other TS-search algorithms. In some test cases it can only be used if one manually corrects for chemically unintuitive TS estimates.
Timing.
Our GPR based optimizer has a larger computational overhead than the other optimizers. Solving the linear system of Equation (3) and the P-RFO runs on the GPR-PES surface can be highly time consuming. With the multi-level approach we limit the computational effort of solving the linear system. Also we parallelized the evaluation of the Hessian matrix, needed for P-RFO, with OpenMP. We look at the timing in the two DFT-based optimization runs of our first benchmark in table 3.
| Time [seconds] (% used by optimizer) | |||
|---|---|---|---|
| ID | GPRTS | dimer | P-RFO |
| 26 | 461 (5%) | 810 (0%) | 3665 (0%) |
| 27 | 419 (15%) | 891 (0%) | 1374 (0%) |
The fraction of time spent on the GPRTS optimizer can vary because the P-RFO optimization on the GPR-PES converges faster or slower, depending on the system. The time spent on the runs using the dimer method and P-RFO is almost exclusively consumed by the energy evaluations along the runs.
We also have a look at the timing of the runs of our second benchmark in table 4. Note that P-RFO converges to a different TS in system and this number is not comparable.
| Time [seconds] (% used on optimizer) | ||||
|---|---|---|---|---|
| ID | GPRPP | GPRTS | dimer | P-RFO |
| 26 | 366 (5%) | 353 (2%) | 886 (0%) | 520 (0%) |
| 27 | 1041 (5%) | 1473 (6%) | 3608 (0%) | 4129 (0%) |
The presented timings were done on an Intel i5-4570 quad-core CPU. The DFT calculations were parallelized on all four cores, as well as the evaluation of the Hessian of the GPR-PES. Overall, we see that the GPR-based optimizer has an overhead that depends on the system. But the overhead is easily compensated by the smaller number of energy calculations that have to be performed. The overall time in test systems and is reduced by a factor of by our new optimizer. The improvement will be more significant if the optimization is done with a higher level of electronic structure calculations.
4 Discussion
For our optimizations we use Cartesian coordinates. In many cases it was proven that one can improve the interpolation quality of machine learning methods by choosing coordinate systems that incorporate translational, rotational, and permutational invariance. 11, 16, 39, 10 More modern descriptors like the Coulomb matrix representation or the Bag of Bonds approach increase the number of dimensions in the system. Considering the scaling of our optimizer this might lead to performance problems. It was shown that one can use a Z-Matrix representation in the GPR framework for geometry optimization19. This introduces new hyperparameters for the length scales. Our algorithms are not capable of handling those. For traditional TS optimizers the usage of internal coordinate systems like the Z-matrix is not generally advisable. 40, 31 Therefore, it is not clear whether the usage of internal coordinates will improve the performance of the optimizer significantly. This has to be studied in future work. With this in mind it might also be beneficial to try a different covariance function/kernel than the one we used. By simple cross-validation (using a set of additional test points to validate a reasonable choice of the hyperparameters) on several test systems we saw that the squared exponential covariance function yields generally worse results. We did not test other covariance functions/kernels. We also made no explicit use of the statistical properties that GPR yields. One can optimize the hyperparameters via the maximum likelihood estimation8 and one can make uncertainty predictions of the predicted energies via the variance. The former was initially used to explore the space of hyperparameters , , and . But the values that were chosen for this paper were obtained via cross-validation on several test systems. We found the optimization of hyperparameters based on the maximum likelihood estimation to yield no consistent improvements on the overall performance of the optimizations. The use of uncertainty predictions, i.e. the variance, could be used to find a maximum step size dynamically. Nevertheless, we found no advantage of a variance-based approach over using a simple distance measure as the maximum step size.
Since the computational effort of our GPR approach scales cubically with the number of dimensions, we mainly recommend our optimizer for smaller systems. In higher dimensional systems one may also have to increase the number of training points in the last level of our multi-level approach which makes the optimizer less efficient. We recommend to increase the number of training points for the last level only for smaller systems for which one wants to do high-precision calculations.
Our algorithm apparently is more sensitive to numerical errors than the dimer method: choosing different floating point models for the compiler can lead to a different performance of the optimizer. This effect can also be observed when using P-RFO. The dimer method seems to be almost immune to this effect. The solution of the linear system, the evaluations of the GPR-PES, the diagonalization of the Hessian, and the P-RFO method on the GPR-PES all yield slightly different results when using different floating-point models. These machine-precision errors can lead to varying performance of the optimizer. In our tests the performance varies only by a few energy evaluations (mostly less than , always less than ), to the better or worse. In some test cases these variations might be higher, also using P-RFO. For the benchmarks presented in the paper we set no explicit compiler flag and use the standard setting for floating point operations of Intel’s fortran compiler, version . That is, using “more aggressive optimizations on floating-point calculations”, as can be read in the developer guide for ifort.
The overall result of our benchmark is very promising. The big advantage of the new GPRTS optimizer is twofold: firstly, one can get a quite precise representation of the second order information with GPR that seems to be superior to traditional Hessian update mechanisms. Secondly, our algorithm is able to do very large steps, as part of the overshooting procedures. Doing large steps and overshooting the estimated solution does not hinder the convergence since the optimizer can use that information to improve the predicted GPR-PES. Therefore, even bad estimates of the next point can lead to an improvement in the optimization performance.
Our GPRPP method of finding a starting point for the TS search seems to work quite well. It is generally not advisable to use the estimated starting point in other optimization algorithms. But it is sufficiently accurate for our GPRPP method. Also the additional points of the NEB in the IDPP seem to improve the stability of the optimization in many cases. If chemical intuition or some other method leads to a starting point very close to the real TS, the pure GPRTS method might still be faster.
5 Conclusions
We presented a new black box optimizer to find SPs on energy surfaces based on GPR. Only a maximum step size has to be set manually by the user. It outperforms both well established methods (dimer and P-RFO). The speedup in the presented test systems is significant and will be further increased when using higher level theory for the electronic structure calculations. We also presented an automated way of finding a starting geometry for the TS search using the reactant and product geometries. We advise to use this approach for systems in which the two minima are known and the estimate of the TS is not straightforward. In the presented test systems the method is very stable and fast.
Acknowledgments
We thank Bernard Haasdonk for stimulating discussions. This work was financially supported by the European Union’s Horizon 2020 research and innovation programme (grant agreement No. 646717, TUNNELCHEM) and the German Research Foundation (DFG) through the Cluster of Excellence in Simulation Technology (EXC 310/2) at the University of Stuttgart.
References
- Baker 1986 Baker, J. An algorithm for the location of transition states. J. Comput. Chem. 1986, 7, 385–395
- Banerjee et al. 1985 Banerjee, A.; Adams, N.; Simons, J.; Shepard, R. Search for stationary points on surfaces. J. Phys. Chem. 1985, 89, 52–57
- Plasencia Gutiérrez et al. 2017 Plasencia Gutiérrez, M.; Argáez, C.; Jónsson, H. Improved Minimum Mode Following Method for Finding First Order Saddle Points. J. Chem. Theory Comput. 2017, 13, 125–134
- Henkelman and Jónsson 1999 Henkelman, G.; Jónsson, H. A dimer method for finding saddle points on high dimensional potential surfaces using only first derivatives. J. Chem. Phys. 1999, 111, 7010–7022
- Lanczos 1950 Lanczos, C. An iteration method for the solution of the eigenvalue problem of linear differential and integral operators. J. Res. Natl. Bur. Stand. B 1950, 45, 255–282
- Zeng et al. 2014 Zeng, Y.; Xiao, P.; Henkelman, G. Unification of algorithms for minimum mode optimization. J. Chem. Phys. 2014, 140, 044115
- Heyden et al. 2005 Heyden, A.; Bell, A. T.; Keil, F. J. Efficient methods for finding transition states in chemical reactions: Comparison of improved dimer method and partitioned rational function optimization method. J. Chem. Phys. 2005, 123, 224101
- Rasmussen and Williams 2006 Rasmussen, C. E.; Williams, C. K. Gaussian processes for machine learning; MIT press Cambridge, 2006; Vol. 1
- Alborzpour et al. 2016 Alborzpour, J. P.; Tew, D. P.; Habershon, S. Efficient and accurate evaluation of potential energy matrix elements for quantum dynamics using Gaussian process regression. J. Chem. Phys. 2016, 145, 174112
- Bartók et al. 2013 Bartók, A. P.; Kondor, R.; Csányi, G. On representing chemical environments. Phys. Rev. B 2013, 87, 184115
- Ramakrishnan and von Lilienfeld 2017 Ramakrishnan, R.; von Lilienfeld, O. A. Reviews in Computational Chemistry; JWS, 2017; pp 225–256
- Mills and Popelier 2011 Mills, M. J.; Popelier, P. L. Intramolecular polarisable multipolar electrostatics from the machine learning method Kriging. Comput. Theor. Chem. 2011, 975, 42 – 51
- Handley et al. 2009 Handley, C. M.; Hawe, G. I.; Kell, D. B.; Popelier, P. L. A. Optimal construction of a fast and accurate polarisable water potential based on multipole moments trained by machine learning. Phys. Chem. Chem. Phys. 2009, 11, 6365–6376
- Fletcher et al. 2014 Fletcher, T. L.; Kandathil, S. M.; Popelier, P. L. A. The prediction of atomic kinetic energies from coordinates of surrounding atoms using kriging machine learning. Theor. Chem. Acc. 2014, 133, 1499
- Ramakrishnan and von Lilienfeld 2015 Ramakrishnan, R.; von Lilienfeld, O. A. Many molecular properties from one kernel in chemical space. CHIMIA 2015, 69, 182–186
- Hansen et al. 2015 Hansen, K.; Biegler, F.; Ramakrishnan, R.; Pronobis, W.; von Lilienfeld, O. A.; Müller, K.-R.; Tkatchenko, A. Machine Learning Predictions of Molecular Properties: Accurate Many-Body Potentials and Nonlocality in Chemical Space. J. Phys. Chem. Lett. 2015, 6, 2326–2331
- Dral et al. 2017 Dral, P.; Owens, A.; Yurchenko, S.; Thiel, W. Structure-based sampling and self-correcting machine learning for accurate calculations of potential energy surfaces and vibrational levels. J. Chem. Phys. 2017, 146, 244108
- Deringer et al. 2018 Deringer, V. L.; Bernstein, N.; Bartók, A. P.; Cliffe, M. J.; Kerber, R. N.; Marbella, L. E.; Grey, C. P.; Elliott, S. R.; Csányi, G. Realistic Atomistic Structure of Amorphous Silicon from Machine-Learning-Driven Molecular Dynamics. J. Phys. Chem. Lett. 2018, 9, 2879–2885
- Schmitz and Christiansen 2018 Schmitz, G.; Christiansen, O. Gaussian process regression to accelerate geometry optimizations relying on numerical differentiation. J. Chem. Phys. 2018, 148, 241704
- Denzel and Kästner 2018 Denzel, A.; Kästner, J. Gaussian process regression for geometry optimization. J. Chem. Phys. 2018, 148, 094114
- Mills and Jónsson 1994 Mills, G.; Jónsson, H. Quantum and thermal effects in dissociative adsorption: Evaluation of free energy barriers in multidimensional quantum systems. Phys. Rev. Lett. 1994, 72, 1124–1127
- Henkelman et al. 2000 Henkelman, G.; Uberuaga, B. P.; Jónsson, H. A climbing image nudged elastic band method for finding saddle points and minimum energy paths. J. Chem. Phys. 2000, 113, 9901–9904
- Koistinen et al. 2016 Koistinen, O.-P.; Maras, E.; Vehtari, A.; Jónsson, H. Minimum energy path calculations with Gaussian process regression. Nanosystems: Phys. Chem. Math. 2016, 7, 925–935
- Koistinen et al. 2017 Koistinen, O.-P.; Dagbjartsdóttir, F. B.; Ásgeirsson, V.; Vehtari, A.; Jónsson, H. Nudged elastic band calculations accelerated with Gaussian process regression. J. Chem. Phys. 2017, 147, 152720
- Smidstrup et al. 2014 Smidstrup, S.; Pedersen, A.; Stokbro, K.; Jónsson, H. Improved initial guess for minimum energy path calculations. J. Chem. Phys. 2014, 140, 214106
- Kästner et al. 2009 Kästner, J.; Carr, J. M.; Keal, T. W.; Thiel, W.; Wander, A.; Sherwood, P. DL-FIND: An Open-Source Geometry Optimizer for Atomistic Simulations. J. Phys. Chem. A 2009, 113, 11856–11865
- Kästner and Sherwood 2008 Kästner, J.; Sherwood, P. Superlinearly converging dimer method for transition state search. J. Chem. Phys. 2008, 128, 014106
- Sherwood et al. 2003 Sherwood, P.; de Vries, A. H.; Guest, M. F.; Schreckenbach, G.; Catlow, C. A.; French, S. A.; Sokol, A. A.; Bromley, S. T.; Thiel, W.; Turner, A. J. et al. QUASI: A general purpose implementation of the QM/MM approach and its application to problems in catalysis. J. Mol. Struct. Theochem. 2003, 632, 1 – 28
- Metz et al. 2014 Metz, S.; Kästner, J.; Sokol, A. A.; Keal, T. W.; Sherwood, P. ChemShell-a modular software package for QM/MM simulations. Wiley Interdiscip. Rev. Comput. Mol. Sci. 2014, 4, 101–110
- Matérn 2013 Matérn, B. Spatial variation; SSBM, 2013; Vol. 36
- Baker and Chan 1996 Baker, J.; Chan, F. The location of transition states: A comparison of Cartesian, Z-matrix, and natural internal coordinates. J. Comput. Chem. 1996, 17, 888–904
- Dewar et al. 1985 Dewar, M. J.; Zoebisch, E. G.; Healy, E. F.; Stewart, J. J. Development and use of quantum mechanical molecular models. 76. AM1: a new general purpose quantum mechanical molecular model. J. Am. Chem. Soc. 1985, 107, 3902–3909
- Becke 1988 Becke, A. Density-functional exchange-energy approximation with correct asymptotic behavior. Phys. Rev. A 1988, 38, 3098–3100
- Perdew 1986 Perdew, J. P. Density-functional approximation for the correlation energy of the inhomogeneous electron gas. Phys. Rev. B 1986, 33, 8822–8824
- Hariharan and Pople 1973 Hariharan, P. C.; Pople, J. A. The influence of polarization functions on molecular orbital hydrogenation energies. Theor. Chem. Acc. 1973, 28, 213–222
- Meisner and Kästner 2018 Meisner, J.; Kästner, J. Dual-Level Approach to Instanton Theory. J. Chem. Theory Comput. 2018, 14, 1865–1872
- Rieckhoff et al. 2017 Rieckhoff, S.; Meisner, J.; Kästner, J.; Frey, W.; Peters, R. Double Regioselective Asymmetric C-Allylation of Isoxazolinones: Iridium-Catalyzed N-Allylation Followed by an Aza-Cope Rearrangement. Angew. Chem. Int. Ed. 2017, 57, 1404–1408
- Bofill 1994 Bofill, J. M. Updated Hessian matrix and the restricted step method for locating transition structures. J. Comput. Chem. 1994, 15, 1–11
- Behler 2016 Behler, J. J. Chem. Phys. 2016, 145, 170901
- Baker and Hehre 1990 Baker, J.; Hehre, W. J. Geometry optimization in cartesian coordinates: The end of the Z-matrix? J. Comput. Chem. 1990, 12, 606–610