GIFT: Guided and Interpretable Factorization for Tensors -
An Application to Large-Scale Multi-platform Cancer Analysis
Abstract.
Motivation: Given multi-platform genome data with prior knowledge of functional gene sets, how can we extract interpretable latent relationships between patients and genes?
More specifically, how can we devise a tensor factorization method which produces an interpretable gene factor matrix based on gene set information while maintaining the decomposition quality and speed?
Method: We propose GIFT, a Guided and Interpretable Factorization for Tensors.
GIFT provides interpretable factor matrices by encoding prior knowledge as a regularization term in its objective function.
Results:
Experiment results demonstrate that GIFT produces interpretable factorizations with high scalability and accuracy, while other methods lack interpretability. We apply GIFT to the PanCan12 dataset, and GIFT reveals significant relations between cancers, gene sets, and genes, such as influential gene sets for specific cancer (e.g., interferon-gamma response gene set for ovarian cancer) or relations between cancers and genes (e.g., BRCA cancer APOA1 gene and OV, UCEC cancers BST2 gene).
Availability: The code and datasets used in the paper are available at https://github.com/leesael/GIFT.
Contact: sael@cs.stonybrook.edu
1. Introduction
Increasing number of multi-platform genome data of a single person, such as a cancer patient, are being generated. These data describe different biological aspects of a person and need to be integratively analyzed to obtain a holistic view. However, due to the complexity of the problem, the results of existing methods are difficult to interpret and often do not scale to larger data (Thomas and Sael,, 2015). Interpretability of the results obtained by the methods is important as most bio-medical studies focus on discoveries. Scalability of an analysis method is also important as the number of data increases.
1.1. Integrative Genomic Data Analysis for Cancer Studies
The Cancer Genome Atlas (TCGA) have reported several integrated genome-wide studies of cancer data. In 2013, TCGA published the PanCan12 dataset that includes multi-platform genomic information of 12 tumor types (Weinstein et al.,, 2013). The dataset has boosted many genomic cancer analyses (Anaya et al.,, 2016; Riaz et al.,, 2017) including the TCGA original multi-platform data analysis (Hoadley et al.,, 2014). (Hoadley et al.,, 2014) utilizes cluster-of-cluster analysis (COCA) approach for stratification of the Pancan12 dataset. The COCA is a two-step approach that clusters against cluster results of individual data types. Although the method is applicable for large data, the two-step process makes it difficult to trace back and interpret the results. Multi-kernel approaches are also a multi-step approach that the first generates individual kernels from each data type, the second learns a multi-kernel, and the third applies the multi-kernel to cluster or classify (Thomas and Sael,, 2017). Although kernel-based methods are highly accurate, interpretability is lost in the generation of the kernels. Another integrative method widely used by TCGA is PARADIGM (Vaske et al.,, 2010; Kandoth et al.,, 2013; Hoadley et al.,, 2014). The method is based on Bayesian network inference and is dependent on the biological pathway used and protein expression data. Due to these requirements, it is often applied to a small number of genes.
1.2. Matrix/Tensor Mining Methods
Matrix factorization methods, such as the non-negative matrix factorization (NMF), are broadly used across multiple domains, including a bio-data analysis, to analyze data represented as matrices. NMF was also used extensively by the TCGA group (Koboldt et al.,, 2012; Hoadley et al.,, 2014; Kandoth et al.,, 2013) and others (Hofree et al.,, 2013; Kim et al.,, 2015; Zhu et al.,, 2017) for studying single-platform genome analyses such as somatic mutations or gene expressions.
Natural extensions of single data type modeled as matrices to multi-platform data type are tensors, i.e., multi-dimensional arrays. Tensors are widely applied to represent many real-world data such as movie rating and network traffic data expressed as 3-order tensors with (movie - user - time) and (source IP - destination IP - time) triples, respectively. Multi-platform genome data can also be represented as a 3-order tensor that contains the experiment values indexed with (patient - gene - experimental platform).
Tensor factorization (TF) methods are applied to analyze tensor data just as matrix factorization methods are used for analyzing matrices. TF decomposes a given tensor into factor matrices and a core tensor that contains latent relationships between original components. Applications of TF include anomaly detection from network traffic data (Eliassi-Rad et al.,, 2006), healthcare monitoring from sensor data (Wang et al.,, 2017), fraud detection from social network data, and biomedical data (Cichocki,, 2013; Kim et al.,, 2017).
However, tensor factorization methods have not been extensively applied to genomic data mainly due to scalability, missing data problem, and interpretability. For example, the PanCan12 dataset forms a 3-order tensor of size . A regular tensor decomposition method will not run due to intermediate data explosion that occurs in the calculation (Jeon et al., 2016b, ). We have previously addressed the scalability and missing data problems (Choi et al.,, 2017; Oh et al., 2017b, ; Shin et al., 2017a, ) and various ways to exploit prior knowledge to obtain high-quality factorizations or intended latent patterns (Choi et al.,, 2017; Choi and Sael,, 2017; Jeon et al., 2016a, ; Lee et al.,, 2017). However, factor matrices produced by existing methods are hard to interpret due to their density and unclear value distributions.
Developing an interpretable TF method is essential for analyzing its resultant factors more effectively; poor interpretability makes it hard to discover latent patterns. The main challenge is to make factor matrices interpretable while preserving the TF accuracy. Our goal is to devise an interpretable TF method for partially observed tensors exploiting prior knowledge while preserving the accuracy and scalability.
1.3. Contributions
| Method | P-Tucker (Oh et al., 2017b, ) | Silenced-TF | GIFT |
|---|---|---|---|
| Interpretability | ✓ | ✓ | |
| Accuracy | ✓ | ✓ | |
| Scalability | ✓ | ✓ | ✓ |
Our main contributions are as follows.
-
•
Method. We propose GIFT (Guided and Interpretable Factorization for Tensors) that outputs interpretable factor matrices by constraining the factor matrices based on prior knowledge.
-
•
Experiments. We validate that GIFT is not only interpretable but highly scalable and accurate (Table 1).
-
•
Discovery. We apply GIFT to large-scale multi-platform cancer genome analysis using the PanCan12 dataset and show how the method easily and successfully discovers significant relations between genes, gene sets, and patients, as summarized in Table 4.
2. Methods
In this section, we describe datasets used, preliminaries of tensors, and proposed methods. Preliminaries contain tensor basics and a brief description of our baseline approach P-Tucker (Oh et al., 2017b, ) that we have recently proposed. In the proposed methods, we first describe naive interpretable approach Silenced-TF and then suggest more advanced method GIFT.
2.1. Data Processing
We use PanCan12 (Weinstein et al.,, 2013) and Hallmark gene set data from MSigDB (Liberzon et al.,, 2011) collections as an input tensor and a mask matrix, respectively. Table 2 summarizes the data we used in this paper.
| Dataset | Order | Dimension | Observable Entries |
|---|---|---|---|
| PANCAN12 tensor | 3 | (4555, 14351, 5) | 180M |
| Sampled-PANCAN12 | 3 | (4555, 14351, 5) | 36144M |
| Mask matrix | 2 | (14351, 50) | 7K |
2.1.1. Mask Matrix
We generate a gene group mask matrix in a form of (gene - gene set) using the Hallmark data, which contain 50 important gene sets. Each column of mask matrix corresponds to a gene set. If a gene is contained in a gene set then it is unmasked, i.e., is set to ; otherwise, the gene is masked, i.e., set to 1. If no prior-knowledge is known, the mask matrices are set to zero matrices with the size of corresponding factor matrices.
2.1.2. PanCan12 Tensor
The PanCan12 dataset is represented as a 3-order tensor in a form of (patient - gene - platform; experiment value). Initially, the 4.7 version of the PanCan12 was downloaded from the Sage Bionetworks repository, Synapse (Omberg et al.,, 2013). The PanCan12 contains multi-platform data with mapped clinical information of patients group into cohorts of twelve cancer type: bladder urothelial carcinoma (BLCA), breast adenocarcinoma (BRCA), colon and rectal carcinoma (COAD, READ), glioblastoma multiforme (GBM), head and neck squamous cell carcinoma (HNSC), kidney renal clear cell carcinoma (KIRC), acute myeloid leukemia (LAML), lung adenocarcinoma (LUAD), lung squamous cell carcinoma (LUSC), ovarian serous carcinoma (OV), and uterine corpus endometrial carcinoma (UCEC). After download, probes of each platform are mapped to corresponding gene symbols. Then, subjects that have less than two evidence are removed from the dataset and genes that are not part of Hallmark set are removed. The resulting data for each platform are min-max normalized and is further normalized such that the Frobenius norm, i.e.,.
2.2. Tensor Preliminaries
In this section, we describe preliminaries of a tensor and its factorization methods. Table 3 summarizes symbols used in this paper.
| Symbol | Definition |
|---|---|
| tensor (Euler script, bold letter) | |
| matrix (uppercase, bold letter) | |
| scalar (lower case, italic letter) | |
| order (number of modes) of a tensor | |
| dimensionality of the th mode of input and core tensor | |
| th factor matrix | |
| th entry of | |
| set of observable entries of | |
| number of observable entries of input and core tensor | |
| regularization parameter for factor matrices | |
| Frobenius norm | |
| element-wise multiplication | |
| outer product | |
| n-mode product |
2.2.1. Tensor
A tensor is a multi-dimensional array which is a generalization of a matrix and a vector. A mode or a way indicates each axis of a tensor, and an order is the number of modes or ways. We denote a tensor using boldface Euler script letters (e.g., ). A tensor is an -order tensor which has modes whose lengths are from to . A vector and a matrix are regarded as a - and a -order tensor, respectively. We denote a matrix and a vector using boldface uppercase (e.g., ) and lowercase letters (e.g., ), respectively. The th row of is denoted by , and the th column of is denoted by .
2.2.2. Tensor Decomposition
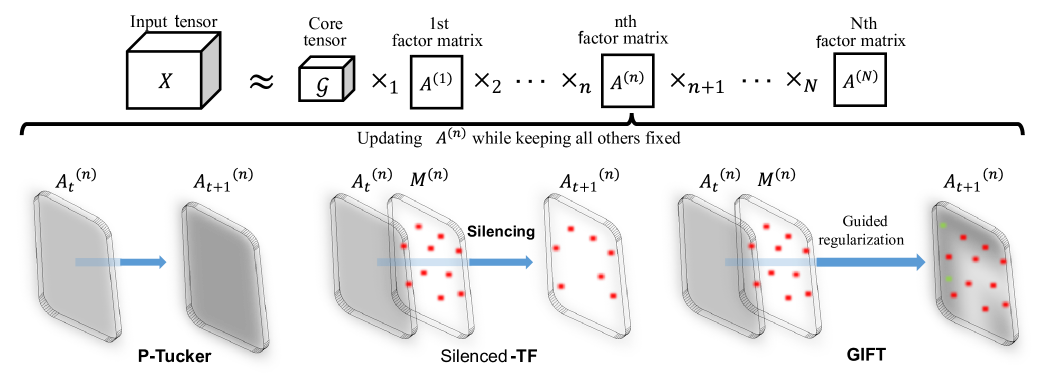
Among many tensor decomposition methods, we use Tucker factorization (Tucker,, 1966; De Lathauwer et al.,, 2000) methods, which allows us to discover not only latent concepts but also relations between the concepts hidden in tensors (Oh et al., 2017b, ). Tucker factorization decomposes a given tensor into a core tensor and factor matrices , as defined in Definition 2.1.
Definition 2.1.
(Tucker factorization) Given a tensor , the Tucker factorization of rank finds a core tensor and factor matrices , which minimize the following objective function (1).
| (1) |
Note that Equation (1) assumes missing entries of as zeros. Each column vector of a factor matrix generally represents each different concept. A higher value in a vector indicates that the corresponding element is highly related to the concept. Assuming a given tensor is movie rating data with (movie - user - time) triples, then a column vector in a movie-factor matrix can have a concept such as a horror or comic genre.
2.2.3. Partially Observable Tensor Factorization
Many real-world tensors have missing values in them (i.e. partially observed). Applying standard Tucker factorization methods to the data triggers highly inaccurate results since they regard missing entries as zeros. Partially observable tensor factorization methods focus only on observed entries to tackle this problem, and a partially observable Tucker factorization is defined as follows.
Definition 2.2.
(Partially Observable Tucker Factorization) Given a tensor with observable entries , a partially observable Tucker factorization of rank finds a core tensor and factor matrices which minimize the following objective function.
| (2) | ||||
Note that denotes a regularization parameter for factor matrices, and we used -regularization to prevent overfitting, which has been widely used in recommender systems (Koren et al.,, 2009; Shin et al., 2017a, ).
2.2.4. Baseline Approach: P-Tucker
Among many Tucker factorization methods (Smith and Karypis,, 2017; Oh et al., 2017a, ; Filipović and Jukić,, 2015), P-Tucker (Oh et al., 2017b, ) shows the best scalability and accuracy for partially observable tensors by focusing on observed entries of the tensors. The objective function of P-Tucker is the same to Equation (2), and P-Tucker uses a row-wise alternating least squares (ALS) to minimize the loss function. In detail, P-Tucker first chooses a row of a factor matrix to be updated while fixing all the others, and it computes three intermediate data , , and defined as follows. Notice that is a identity matrix.
is a length vector whose th entry is
| (3) |
is a matrix whose th entry is
| (4) |
and is a length vector whose th entry is
| (5) |
Using the above intermediate data, P-Tucker updates a row by an update rule . After updating factor matrices, P-Tucker calculates reconstruction error by the following rule.
| (6) |
If the error converges or the maximum iteration is reached, P-Tucker stops iterations and performs QR decompositions to orthogonalize factor matrices and update a core tensor accordingly. Note that (Oh et al., 2017b, ) suggests full details and proofs of the update process.
2.3. Proposed Methods
The main challenge is to devise a method which employs prior knowledge to produce interpretable factors while maintaining the decomposition quality and speed.
2.3.1. Silenced-TF
Although our previous method P-Tucker presents high scalability and accuracy, it is hard to interpret the results of P-Tucker since the factor matrices are dense and there is no direct interpretable connection between significant components, i.e. genes in each factor column that describes a group. Silenced-TF literally silences uninteresting or unnecessary parts of factor matrices and updates the rest using the same algorithm of P-Tucker.
More specifically, given a tensor with observable entries , Silenced-TF of rank finds a core tensor and factor matrices which minimize the following objective function subjected to mask matrices .
| (7) | ||||||
| subject to |
The difference in Silenced-TF compared to P-Tucker is in the selective updates of rows of factor matrices. To be more specific, given the mask matrices that encode the prior knowledge, Silenced-TF only updates an entry in the gene factor matrix, , when the corresponding masking element is 0, and Silenced-TF sets the entry in the gene factor matrix as a zero when is 1. By masking, Silenced-TF offers interpretable gene factor matrices in addition to the benefits offered by P-Tucker: scalability and applicability for partially observed data.
2.3.2. GIFT
Two potential weaknesses of Silenced-TF are low factorization accuracy due to many zeros in its factor matrices and inability to find genes that have a significant relationship to the gene group if they are specified as a member the gene group. To address these weaknesses, we propose GIFT which offers interpretability, high accuracy, and flexibility. GIFT tackles the problem by employing selective regularization of factor matrices. GIFT penalties proportional to on masked entries of factor matrices during the update process. Thus, GIFT makes a distinction between the values of masked and unmasked genes for each gene group. Moreover, the accuracy of GIFT is similar to P-Tucker since masked entries can also have small values unlike the strict zero constraints of Silenced-TF.
GIFT encodes mask matrices into its objective function as a regularization term. The specific loss function of GIFT is given by the following Equation (8).
| (8) | ||||
The main difference between P-Tucker and GIFT is an existence of mask matrices in a regularization term. GIFT uses instead of just , where denotes an element-wise multiplication. Through the specially-designed regularization, GIFT fully exploits prior knowledge encoded in . Compared to Silenced-TF, GIFT shows flexibility regarding the updates of masked entries. Instead of fixing them as zeros, GIFT imposes regularizations on them, which tend to make the values smaller, but not normally zeros.
Algorithm 1 describes how GIFT updates given factor matrices. When GIFT updates a row (line 6), it requires a diagonal matrix which reflects masking information (line 5), while P-Tucker uses an identity matrix . The other parts of GIFT are the similar to that of P-Tucker. Table 1 shows a comparison of GIFT, Silenced-TF, and P-Tucker.
3. Results
In this section, we describe experimental results of GIFT compared to Silenced-TF and P-Tucker. We aim to answer the following questions.
[Q1] Interpretability: How interpretable are factor matrices produced by GIFT and the other methods? (Section 3.2)
[Q2] Accuracy: How accurately do GIFT and the other methods factorize a given tensor and predict missing entries of the tensor? (Section 3.3)
[Q3] Scalability: How well do GIFT and the other methods scale up with respect to the number of observed entries of a tensor? (Section 3.4)
3.1. Experimental Settings
GIFT, Silenced-TF, and P-Tucker are implemented in C with OpenMP and Eigen libraries. We run our experiments on a single machine with 20 cores / 40 threads, equipped with an Intel Xeon E5-2630 v4 2.2GHz CPU and 512GB RAM. We set the default rank as . In reporting running times, we use the average elapsed time per iteration, not the total running time. Notice that we use absolute values of factor matrices for all experiments.
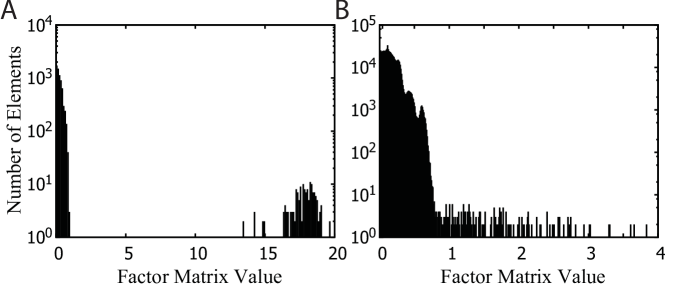
3.2. Interpretability
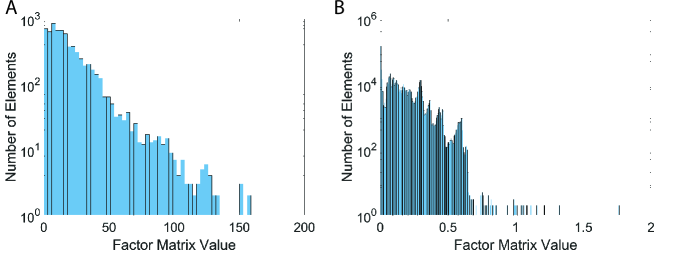
We regard a gene factor matrix as interpretable if the genes composing a gene set (unmasked) have distinguishably larger factor values than the factor values of genes that are not in the gene set (masked). In Silenced-TF, this is strictly enforced by making the factor values of genes that are not in the gene set (masked) are all set to zeros. In GIFT, this is not strictly enforced. In other words, there is a potential that factor values of the masked genes become large and those of the unmasked genes become small. This is likely to happen only when the prior knowledge and the data do not agree. However, as presented in Figure 2, GIFT generates a gene factor matrix within high factor values (larger than 10) for the subset of unmasked entries (A) and small factor values (less than 1) for a majority of the masked entries (B). This shows that GIFT has learned the latent relationships of cancer patients to gene sets and significant genes in the gene set. P-Tucker, on the other hand, produces a gene factor matrix with value distribution that has small or no correlation to a gene set (refer to the supplementary material for the results of Silenced-TF and P-Tucker).
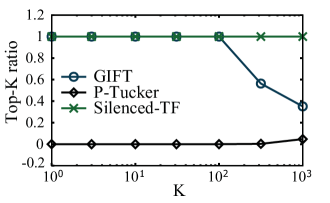
Additionally, top-K ratios can be used as a metric of interpretability. A top-K ratio indicates how many unmasked entries are included in total top-K entries (in descending order by values) of a gene factor matrix, which is defined as follows.
| (9) |
Figure 3 illustrates top-K ratios. P-Tucker shows the worst top-K ratios for all K since it does not distinguish unmasked and masked entries in the calculation. Although Silenced-TF exhibits the highest top-K ratios for all K by silencing the masked entries, Silenced-TF cannot discover important masked entries which are closely related to unmasked entries since their values are all set to zeros. Meanwhile, the top-K ratio of GIFT is the highest until and decreases rapidly after when the important unmasked entries are saturated and top values start including the unimportant unmasked entries and important masked entries. Overall, Silenced-TF and GIFT provide interpretable factorizations with respect to distributions of values in a factor matrix and top-K ratios.
3.3. Accuracy
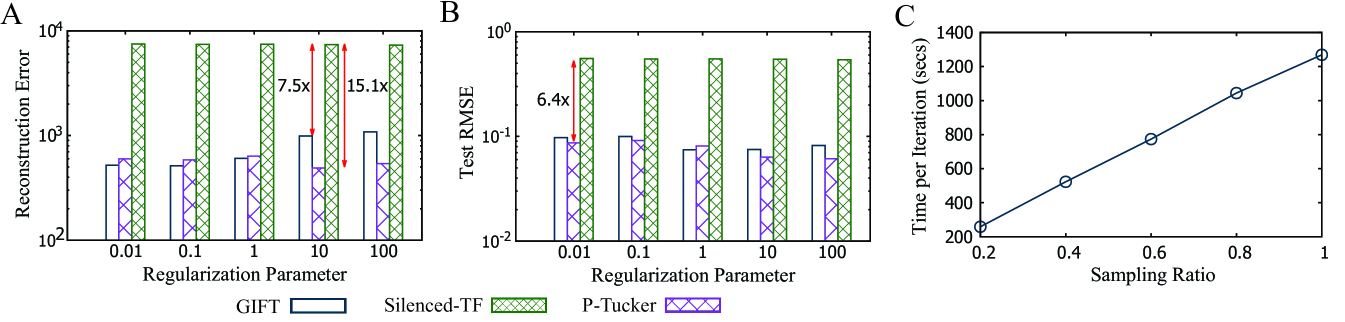
We use two evaluation metrics—reconstruction error and test root means square error (RMSE)—to measure the accuracy. Reconstruction error indicates an accuracy of a factorization as given in Equation (6) and test RMSE implies how accurately a method predicts missing entries of a tensor. To measure test RMSE, we split the PANCAN12 tensor into training/test data with a ratio of 9 to 1. As illustrated in Fig. 4A and Fig. 4B, Silenced-TF exhibits the worst accuracy due to many zeros in a silenced factor matrix. The reconstruction error and test RMSE of Silenced-TF are and higher than that of P-Tucker when and , respectively. While P-Tucker shows the best accuracy in most cases, GIFT presents relatively small accuracy loss compared to that of Silenced-TF; in particular, test RMSE of GIFT is slightly higher or even better than that of P-Tucker.
3.4. Scalability
Scalability test is performed by varying the number of observable entries by randomly sampling 20%, 40%, 60%, 80%, and 100% from the PANCAN12 tensor. As shown in Fig. 4C, GIFT scales near linearly in terms of the number of observable entries. We omit results of P-Tucker and Silenced-TF since they present similar scalability to that of GIFT (refer to the supplementary material). Note that computational time and memory usage increase exponentially in regular tensor decompositions.
3.5. Discovery
In this section, we describe our finding on (cancer - gene sets), (gene sets - genes), and (cancer - genes) relations hidden in the PANCAN12 dataset by interpreting results of GIFT with .
| Cancer | Gene set | Genes | Factor | Gene Description |
| HNSC, LUAD, LUSC, BLCA | TGF beta signaling | SKIL∗ | 0.5146 | Encodes the SNON, negative regulators of TGF-beta signaling (Tecalco-Cruz et al.,, 2012). |
| FKBP1A∗ | 0.4692 | Interacts with a type I TGF-beta receptor. | ||
| LEFTY2∗ | 0.2925 | Encodes a secreted ligand of the TGF-beta family of proteins. | ||
| GBM | Angiogenesis | PF4∗ | 0.5049 | Inhibits cell proliferation and angiogenesis in vitro and in vivo (Bikfalvi,, 2004). |
| VCAN∗ | 0.4500 | Encodes a protein involving in cell adhesion, and angiogenesis (Wight,, 2002). | ||
| LPL- | 0.0429 | Encodes lipoprotein lipase (Wang and Eckel,, 2009). | ||
| BRCA | Estrogen response late | IL17RB∗ | 0.3807 | Involved in development and progression of breast cancer (Alinejad et al.,, 2017). |
| TFF3∗ | 0.3640 | Promotes invasion and migration of breast cancer (May and Westley,, 2015). | ||
| PTGER3- | 0.0200 | Encode protein related to digestion and nervous system. | ||
| Bile acid metabolism | APOA1∗ | 0.3973 | Encodes lipoprotein lipase, an enzyme which hydrolyzes lipoprotein. Known breast cancer risk factor (Martin et al.,, 2015). | |
| OV, UCEC | Interferon-gamma response | IRF7∗ | 0.5727 | Encodes interferon regulatory factor 7. |
| BST2∗ | 0.4986 | High levels of BST2 have been identified in ovarian cancer (Shigematsu et al.,, 2017). | ||
| SSPN- | 0.0983 | Associated with a skeletal muscle membrane (Lapidos et al.,, 2004). | ||
| Apoptosis | CASP8AP2+ | 1.4708 | Associated with apoptosis of leukemic lymphoblasts (Flotho et al.,, 2006). | |
| Encoded protein plays a regulatory role in Fas-mediated apoptosis (Imai et al.,, 1999). | ||||
| READ, COAD | Protein secretion | STX7∗ | 0.4854 | Controls vesicle trafficking events involved in cytokine secretion (Achuthan et al.,, 2008). |
| KIRC, LAML | Mitotic spindle | LATS1∗ | 0.4913 | Binds phosphorylated zyxin and moves it to the mitotic spindle. |
3.5.1. Cancer to gene sets findings
Given specific cancer type, which gene set is the most relevant to the cancer type? We first explain our discovery procedure and introduce several examples of (cancer - gene sets) relations found by GIFT.
We first compute an influence of each gene set on a patient and extract top- important gene sets for the patient. After that, we aggregate all top- gene sets of patients suffering from the given cancer and derive top- relevant gene sets to cancer by choosing top- frequent gene sets in aggregations. In detail, is a latent feature of -th patient, and is a relation between gene sets and columns of a patient-factor matrix. Then, we use as an influence of each gene set on the -th patient. The -th element of indicates the influence of -th gene set on the -th patient. We extract top- most important gene sets for each patient by selecting top- highest values in . Finally, we count the frequency of gene sets that appeared in the top- gene sets of all patients of a given cancer type. We regard the most frequent gene set as the most relevant one to the given cancer.
The first and second columns of Table 4 show (cancer - gene sets) relations discovered by GIFT. For breast cancer (BRCA), GIFT considers ‘Estrogen response late’ and ‘Bile acid metabolism’ gene sets closely related to breast cancer. It is well known that the estrogen plays a key role in the occurrence of breast cancer while the relation to ‘Bile acid metabolism’ gene set seems unnatural. However, (Murray et al.,, 1980) reveal that patients with breast cancer have significantly low fecal bile acid concentration than that of controlled patients. For ovarian cancer (OV), a relation to the ‘Interferon-gamma response’ gene set is supported by (Wall et al.,, 2003). They show that interferon-gamma causes apoptosis in human epithelial ovarian cancer. The ‘TGF beta signaling’ gene set is frequent among many types of cancer including Head and Neck Squamous Cell Carcinoma (HNSC), Lung adenocarcinoma (LUAD), Lung Squamous, Cell Carcinoma (LUSC), and Bladder carcinoma (BLCA). The reason is that the Transforming growth factor- (TGF-) gene set is a tumor suppressor which affects many types of human cancers (Kretzschmar,, 2000).
3.5.2. Gene sets to genes findings
Given a gene set, which genes are important or unimportant within it? Is there a gene not included but related to the gene set? A high value in the gene factor matrix indicates that the corresponding gene is highly related to the corresponding gene set. We sort the genes in each column of the gene factor matrix in descending order by their value and inspect high-value genes for each gene set.
We show how the discovered (gene sets - genes) relations are supported by biological facts with examples. The second and third columns of Table 4 show (gene sets - genes) relations retrieved by GIFT. The SKIL gene in the ‘TGF beta signaling’ gene set is identified to be important by GIFT. The SKIL gene encodes a protein which antagonizes TGF- signaling (Tecalco-Cruz et al.,, 2012). The PF4 gene in the ‘Angiogenesis’ gene set, reported to be important by GIFT, is known as an inhibitor of cell proliferation and angiogenesis (Bikfalvi,, 2004). The IRF7 gene in the ‘Interferon-gamma response’ gene set is also identified to be important, and the gene encodes interferon regulatory factor 7. The LPL gene in the ‘Angiogenesis’ gene set is unimportant according to the discovery result of GIFT. The LPL gene encodes lipoprotein lipase, an enzyme which hydrolyzes lipoprotein (Wang and Eckel,, 2009), thus it has low relatedness to angiogenesis. GIFT also reports the CASP8AP2 gene is closely related to the ‘Apoptosis’ gene set although the gene is not included in the gene set. The CASP8AP2 gene is associated with apoptosis of leukemic lymphoblasts in reality (Flotho et al.,, 2006).
3.5.3. Cancer to genes findings
Given specific cancer type, which genes affect the cancer type most? We suggest (cancer - genes) relations by combining two relations (cancer - gene sets) and (gene sets - genes) discovered by GIFT.
The first and third columns of Table 4 show (cancer - genes) relations found by GIFT. We regard gene sets in the second column of the table as bridges for (cancer - genes) relations. We deduce the IL17RB and TFF3 genes are significant to breast cancer since the genes are both important for the ‘Estrogen response late’ gene set and the gene set is the most relevant one to breast cancer. (Alinejad et al.,, 2017) showed that IL17RB is crucial in development and progression of breast cancer in effect. Moreover, (May and Westley,, 2015) reveal that the TFF3 gene promotes invasion and migration of breast cancer. GIFT also finds that the APOA1 gene in the ‘Bile acid metabolism’ gene set is highly related to breast cancer. High levels of APOA1 are known to be related to increased breast cancer risk (Martin et al.,, 2015). In the case of ovarian cancer, GIFT asserts a strong relation to the BST2 gene. High levels of BST2 have been identified in ovarian cancer (Shigematsu et al.,, 2017).
4. Discussions and Conclusion
In this paper, we proposed GIFT, a guided and interpretable factorization method for tensors. GIFT provides interpretable factor matrices by encoding prior knowledge through selective regularization. Experiment results demonstrate that GIFT produces interpretable factorizations with high scalability and accuracy, while other methods lack accuracy or interpretability. In practice, we apply GIFT to human cancer analytic using the PANCAN12 dataset and successfully identify important relations between cancers, gene sets, and genes. For instance, GIFT suggests influential gene sets for specific cancer (e.g., interferon-gamma response gene set for ovarian cancer). In addition, GIFT discovers relations between cancers and genes (e.g., BRCA cancer APOA1 gene and OV, UCEC cancers BST2 gene). Furthermore, GIFT is able to extract out-of-the-box relations, which are not given in prior information. Specifically, in Hallmark gene set data, a CASP8AP2 gene was not included in a gene set about apoptosis. However, GIFT elicits a relation between the gene and gene set, which is an acknowledged relation by (Flotho et al.,, 2006; Imai et al.,, 1999).
Funding
This research was supported by Basic Science Research Program through the National Research Foundation of Korea
(NRF-2015R1C1A2A01055739) and by the Korea Evaluation Institute Of Industrial Technology under the “Global Advanced Technology Center” (10053204).
References
- Achuthan et al., (2008) Achuthan,A., Masendycz,P., Lopez,J.A., Nguyen,T., James,D.E., et al. (2008) Regulation of the endosomal snare protein syntaxin 7 by colony-stimulating factor 1 in macrophages. Molecular and cellular biology, 28 (20), 6149–6159.
- Alinejad et al., (2017) Alinejad,V., Dolati,S., Motallebnezhad,M. and Yousefi,M. (2017) The role of il17b-il17rb signaling pathway in breast cancer. Biomedicine & Pharmacotherapy, 88, 795–803.
- Anaya et al., (2016) Anaya,J., Reon,B., Chen,W.M., Bekiranov,S. and Dutta,A. (2016) A pan-cancer analysis of prognostic genes. PeerJ, 3, e1499.
- Bikfalvi, (2004) Bikfalvi,A. (2004) Platelet factor 4: an inhibitor of angiogenesis. In Seminars in thrombosis and hemostasis vol. 30, pp. 379–385 Copyright© 2004 by Thieme Medical Publishers, Inc., 333 Seventh Avenue, New York, NY 10001, USA.
- Choi et al., (2017) Choi,D., Jang,J.G. and Kang,U. (2017) Fast, accurate, and scalable method for sparse coupled matrix-tensor factorization. arXiv preprint arXiv:1708.08640.
- Choi and Sael, (2017) Choi,D. and Sael,L. (2017) SNeCT: Scalable network constrained Tucker decomposition for integrative multi-platform data analysis. arXiv preprint.
- Cichocki, (2013) Cichocki,A. (2013) Tensor decompositions: a new concept in brain data analysis? arXiv preprint arXiv:1305.0395.
- De Lathauwer et al., (2000) De Lathauwer,L., De Moor,B. and Vandewalle,J. (2000) A multilinear singular value decomposition. SIAM journal on Matrix Analysis and Applications, 21 (4), 1253–1278.
- Eliassi-Rad et al., (2006) Eliassi-Rad,T., Ungar,L.H., Craven,M. and Gunopulos,D., eds (2006). Proceedings of the Twelfth ACM SIGKDD, Philadelphia, PA, USA, August 20-23, 2006. ACM.
- Filipović and Jukić, (2015) Filipović,M. and Jukić,A. (2015) Tucker factorization with missing data with application to low-n-rank tensor completion. Multidimensional systems and signal processing, 26 (3), 677–692.
- Flotho et al., (2006) Flotho,C., Coustan-Smith,E., Pei,D., Iwamoto,S., and et al. (2006) Genes contributing to minimal residual disease in childhood acute lymphoblastic leukemia: prognostic significance of casp8ap2. Blood, 108 (3), 1050–1057.
- Hoadley et al., (2014) Hoadley,K.A., Yau,C., Wolf,D.M., Cherniack,A.D., and et al. et al. (2014) Multiplatform analysis of 12 cancer types reveals molecular classification within and across tissues of origin. Cell, 158 (4), 929–944.
- Hofree et al., (2013) Hofree,M., Shen,J.P., Carter,H., Gross,A. and Ideker,T. (2013) Network-based stratification of tumor mutations. Nature Methods, 10 (11), 1108–1115.
- Imai et al., (1999) Imai,Y., Kimura,T., Murakami,A., Yajima,N., Sakamaki,K. and Yonehara,S. (1999) The CED-4-homologous protein FLASH is involved in Fas-mediated activation of caspase-8 during apoptosis. Nature, 398 (6730), 777–785.
- (15) Jeon,B., Jeon,I., Sael,L. and Kang,U. (2016a) Scout: scalable coupled matrix-tensor factorization-algorithm and discoveries. In Data Engineering (ICDE), 2016 IEEE 32nd International Conference on pp. 811–822 IEEE.
- (16) Jeon,I., Papalexakis,E.E., Faloutsos,C., Sael,L. and Kang,U. (2016b) Mining billion-scale tensors: Algorithms and discoveries. The VLDB Journal, 25 (4), 519–544.
- Kandoth et al., (2013) Kandoth,C., Schultz,N., Cherniack,A.D., Akbani,R., and et al. (2013) Integrated genomic characterization of endometrial carcinoma. Nature, 497 (7447), 67–73.
- Kim et al., (2015) Kim,S., Sael,L. and Yu,H. (2015) A mutation profile for top-k patient search exploiting gene-ontology and orthogonal non-negative matrix factorization. Bioinformatics, 31 (22), 3653–3659.
- Kim et al., (2017) Kim,Y., El-Kareh,R., Sun,J., Yu,H. and Jiang,X. (2017) Discriminative and Distinct Phenotyping by Constrained Tensor Factorization. Scientific Reports, 7 (1), 1–12.
- Koboldt et al., (2012) Koboldt,D.C., Fulton,R.S., McLellan,M.D., Schmidt,H. and et al. (2012) Comprehensive molecular portraits of human breast tumours. Nature, 490(7418), 61–70.
- Koren et al., (2009) Koren,Y., Bell,R. and Volinsky,C. (2009) Matrix factorization techniques for recommender systems. Computer, 42 (8), 30–37.
- Kretzschmar, (2000) Kretzschmar,M. (2000) Transforming growth factor- and breast cancer: transforming growth factor-/smad signaling defects and cancer. Breast Cancer Research, 2 (2), 107.
- Lapidos et al., (2004) Lapidos,K.A., Kakkar,R. and McNally,E.M. (2004) The dystrophin glycoprotein complex. Circulation research, 94 (8), 1023–1031.
- Lee et al., (2017) Lee,J., Choi,D. and Sael,L. (2017) CTD: Fast, Accurate, and Interpretable Method for Static and Dynamic Tensor Decompositions. arXiv.
- Liberzon et al., (2011) Liberzon,A., Subramanian,A., Pinchback,R., Thorvaldsdóttir,H., et al. (2011) Molecular signatures database (MSigDB) 3.0. Bioinformatics, 27(12), 1739–1740.
- Martin et al., (2015) Martin,L.J., Melnichouk,O., Huszti,E., Connelly,P.W., and et al. (2015) Serum lipids, lipoproteins, and risk of breast cancer: a nested case-control study using multiple time points. JNCI: Journal of the National Cancer Institute, 107 (5).
- May and Westley, (2015) May,F.E. and Westley,B.R. (2015) Tff3 is a valuable predictive biomarker of endocrine response in metastatic breast cancer. Endocrine-related cancer, 22 (3), 465–479.
- Murray et al., (1980) Murray,W., Blackwood,A., Calman,K. and MacKay,C. (1980) Faecal bile acids and clostridia in patients with breast cancer. British journal of cancer, 42 (6), 856–860.
- (29) Oh,J., Shin,K., Papalexakis,E.E., Faloutsos,C. and Yu,H. (2017a) S-hot: scalable high-order tucker decomposition. In WSDM.
- (30) Oh,S., Park,N., Sael,L. and Kang,U. (2017b) Scalable Tucker Factorization for Sparse Tensors - Algorithms and Discoveries. arxiv .
- Omberg et al., (2013) Omberg,L., Ellrott,K., Yuan,Y., Kandoth,C., and et al. (2013) Enabling transparent and collaborative computational analysis of 12 tumor types within The Cancer Genome Atlas. Nature Genetics, 45 (10), 1121–1126.
- Riaz et al., (2017) Riaz,N., Blecua,P., Lim,R.S., Shen,R., and et al. (2017) Pan-cancer analysis of bi-allelic alterations in homologous recombination dna repair genes. Nature Communications, 8 (1), 857.
- Shigematsu et al., (2017) Shigematsu,Y., Oue,N., Nishioka,Y., Sakamoto,N., and et al. (2017) Overexpression of the transmembrane protein bst-2 induces akt and erk phosphorylation in bladder cancer. Oncology Letters, 14 (1), 999–1004.
- (34) Shin,K., Sael,L. and Kang,U. (2017a) Fully scalable methods for distributed tensor factorization. TKDE, 29 (1), 100–113.
- Smith and Karypis, (2017) Smith,S. and Karypis,G. (2017) Accelerating the tucker decomposition with compressed sparse tensors. In Europar.
- Tecalco-Cruz et al., (2012) Tecalco-Cruz,A.C., Sosa-Garrocho,M., Vázquez-Victorio,G., Ortiz-García,L., and et al. (2012) Transforming growth factor-/smad target gene skil is negatively regulated by the transcriptional cofactor complex snon-smad4. Journal of Biological Chemistry, 287 (32), 26764–26776.
- Thomas and Sael, (2015) Thomas,J. and Sael,L. (2015) Overview of integrative analysis methods for heterogeneous data. In The 2015 International Conference on Big Data and Smart Computing (BigComp 2015) number 1 pp. 266–270 IEEE.
- Thomas and Sael, (2017) Thomas,J. and Sael,L. (2017) Multi-Kernel LS-SVM based integration bio-clinical data analysis and application to ovarian cancer. International Journal of Data Mining and Bioinformatics, in press.
- Tucker, (1966) Tucker,L.R. (1966) Some mathematical notes on three-mode factor analysis. Psychometrika, 31 (3), 279–311.
- Vaske et al., (2010) Vaske,C.J., Benz,S.C., Sanborn,J.Z., Earl,D., and et la. (2010) Inference of patient-specific pathway activities from multi-dimensional cancer genomics data using PARADIGM. Bioinformatics, 26 (12), i237–45.
- Wall et al., (2003) Wall,L., Burke,F., Barton,C., Smyth,J. and Balkwill,F. (2003) Ifn- induces apoptosis in ovarian cancer cells in vivo and in vitro. 9, 2487–96.
- Wang and Eckel, (2009) Wang,H. and Eckel,R.H. (2009) Lipoprotein lipase: from gene to obesity. American Journal of Physiology-Endocrinology and Metabolism, 297 (2), E271–E288.
- Wang et al., (2017) Wang,X., Yang,C. and Mao,S. (2017) Tensorbeat: tensor decomposition for monitoring multi-person breathing beats with commodity wifi. CoRR, abs/1702.02046.
- Weinstein et al., (2013) Weinstein,J.N., Collisson,E.A., Mills,G.B., Shaw,K.R.M., and et la. et al. (2013) The cancer genome atlas pan-cancer analysis project. Nature genetics, 45 (10), 1113–1120.
- Wight, (2002) Wight,T.N. (2002) Versican: a versatile extracellular matrix proteoglycan in cell biology. Current opinion in cell biology, 14 (5), 617–623.
- Zhu et al., (2017) Zhu,R., Liu,J.X., Zhang,Y.K. and Guo,Y. (2017) A Robust Manifold Graph Regularized Nonnegative Matrix Factorization Algorithm for Cancer Gene Clustering. Molecules, 22 (12), 2131.
Supplementary Information
1.1. Interpretability
In this section, we offer additional experimental results of GIFT and other methods. In detail, we first introduce several value distributions of masked and unmasked entries derived by three methods and describe scalability of the algorithms with respect to the number of observed entries in a tensor.
Figure 1 illustrates value distributions of masked and unmasked entries derived by GIFT (). Compared to the result offered by the main paper (), the gap between masked and unmasked ones becomes much larger. Although it provides more interpretable results, its accuracy is lower than that of the case when . Moreover, it is hard to reveal important masked entries when . Thus, we use in the discovery section.
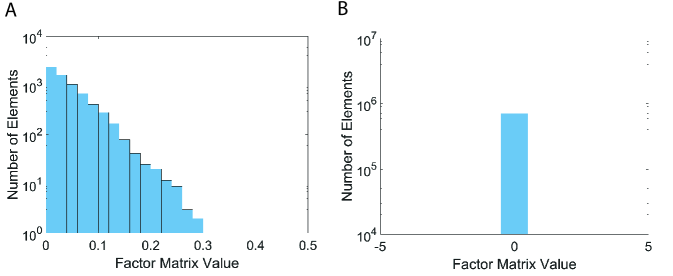
However, P-Tucker fails to make a distinction between masked and unmasked entries, as shown in Figure 2. The results are easily expected since P-Tucker does not differentiate the masked and unmasked ones when it updates factor matrices.
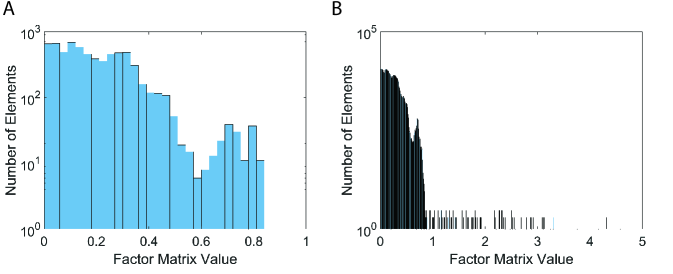
On the other hand, Silenced-TF produces interpretable results, as presented in Figure 3. The values of masked entries are fixed to zeros, while the values of unmasked entries are varying from 0 to 0.3. Although Silenced-TF provides interpretable results, it cannot retrieve important masked entries as the values of them are set to zeros.
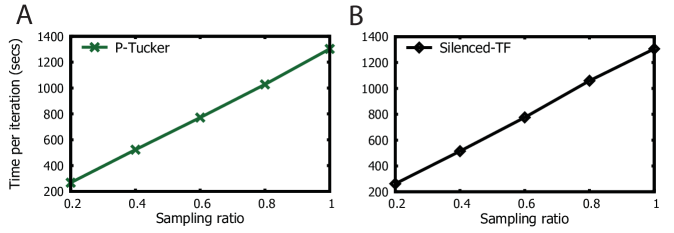
1.2. Scalability
We vary the number of observable entries by randomly sampling 20%, 40%, 60%, 80%, and 100% from the PANCAN12 tensor. As shown in Figures 4, P-Tucker (A) and Silenced-TF (B) scale near linearly in terms of the number of observable entries.