GINA – A Polarized Neutron Reflectometer at the Budapest Neutron Centre
Abstract
The setup, capabilities and operation parameters of the neutron reflectometer GINA, the recently installed “Grazing Incidence Neutron Apparatus” at the Budapest Neutron Centre, are introduced. GINA, a dance-floor-type, constant-energy, angle-dispersive reflectometer is equipped with a 2D position-sensitive detector to study specular and off-specular scattering. Wavelength options between 3.2 and are available for unpolarized and polarized neutrons. Spin polarization and analysis are achieved by magnetized transmission supermirrors and radio-frequency adiabatic spin flippers. As a result of vertical focusing by a five-element pyrolytic graphite monochromator, the reflected intensity from a sample has been doubled. GINA is dedicated to studies of magnetic films and heterostructures, but unpolarized options for non-magnetic films, membranes, and other surfaces are also provided. Shortly after its startup, reflectivity values as low as have been measured by the instrument. The instrument capabilities are demonstrated by a non-polarized and a polarized reflectivity experiment on a Si wafer and on a magnetic film of isotope-periodic layer composition. The facility is now open for the international user community. Its further development is underway establishing new sample environment options and spin analysis of off-specularly scattered radiation as well as further decreasing the background.
I Introduction
The ever increasing need for product advancement and miniaturization keeps membranes, thin film assemblies, magnetic and non-magnetic multilayer and patterned heterostructures in the limelight of materials science and technological development. In recent years more and more complex methods, instrumental and evaluation types have emerged to meet the new challenges. Due to the matching wavelength range of cold neutrons and their extreme sensitivity to the interface structure and to the internal magnetic fields, neutron reflectometry (NR) is a rather capable non-destructive method to investigate such nanostructures. Reflected intensity measured as a function of the momentum transfer , perpendicular to the sample surface provides information on the scattering length density (SLD) depth profile. Normalized reflectivities are usually recorded from unity in the total reflection regime to values of about , where it drops by five to six orders of magnitude. Layer thicknesses appear as regular features in the reflected intensity and may be modeled using optical formalisms. Parratt (1954); Felcher (1981) Similar but spin dependent formalisms apply for polarized neutron reflectometry (PNR) in magnetic studies. Deák et al. (2001); Rühm, Toperverg, and Dosch (1999); Majkrzak and Berk (1996) By fitting the appropriate model to the measured intensities as a function of , one can extract layer thickness, interfacial roughness, and depth-dependent SLD, as well as magnetization profile. By measuring scattered intensity as a function of an in-plane wave vector component , one can, in addition, characterize lateral structures. Sinha et al. (1988) In the lateral direction, the interface may be rough on different length scales or may display a defined periodicity, resulting in diffuse scattering or Bragg reflections in scans, respectively. Polarized neutron reflectometry (PNR) not only provides an isotope-selective atomic density depth profile (as well in the case of deeply buried layers) with a spatial resolution of a few nanometers, Krueger (2001); Fragneto-Cusani (2001) but it is also a highly sensitive magnetometry to determine the vector properties of the magnetization. The prototype polarized neutron reflectometer was developed and built at Argonne in the 1980s. Felcher et al. (1987); Ankner and Felcher (1999) The increased interest in magnetic thin film analytical instruments triggered by the discovery of the giant magnetoresistance and related phenomena ref (2005); Shinjo (2009) resulted in a boom of PNR studies Zabel (2006); Zabel et al. (2008); Zabel, Theis-Bröhl, and Toperverg (2007) as well as the construction of a number of new neutron reflectometers with polarization option at neutron sources across the globe.
The Budapest Research Reactor (BRR) of the Budapest Neutron Centre
(BNC), Hungary operates some 15 instruments on thermal channels and cold
guides. Rosta and Baranyai (2011) BRR is a tank type reactor, moderated and cooled
by light water. The core flux is
.
The “Grazing Incidence Neutron Apparatus” (GINA),
a polarized-beam neutron reflectometer has recently been
installed Bottyán et al. (2012) on the cold guide of BRR. Here we report
on the design, the construction and the operation parameters of GINA.
Although over 30 neutron reflectometers offer polarization option
worldwide, 111The actual list with links to the neutron
reflection facilities can be found at the page of A.R. Rennie:
http://material.fysik.uu.se/Group_members/adrian/reflect.htm
the overall available beam time on polarized reflectometers
is generally overbooked, thus a new instrument and its performance may
interest the growing user community.
II GENERAL OVERVIEW OF THE GINA INSTRUMENT
The GINA neutron reflectometer is a constant-energy angle-dispersive instrument with a horizontal scattering plane. Nagy (2010) The monochromator assembly, which is mounted in a gap of the cold neutron guide 10/3, selects the wavelength of the monochromatic beam within the range of and can focus the beam in the vertical plane. In order to produce a polarized neutron beam, a magnetized polarizing supermirror (PSM) in transmission geometry and an adiabatic radio frequency (RF) spin flipper Bazhenov et al. (1993); Grigoriev, Okorokov, and Runov (1997) are used. The beam scattered by the sample undergoes spin analysis by an identical setup of a spin flipper and a spin filter, and finally it is detected by a two-dimensional position sensitive detector. To reduce the background, the detector is encased in a B2O3-mixed polyethylene shielding and four motorized slits are provided in the beam path to discard the undesired neutrons, including those scattered from the device components. The complete instrument setup is shown in Fig. 1. The neutron-optical devices of the reflectometer are mounted on two X95 optical benches 222Newport Co., Irvine, CA, USA, www.newport.com to provide accurate definition of the beam height and a heavy-load support for various additional elements.
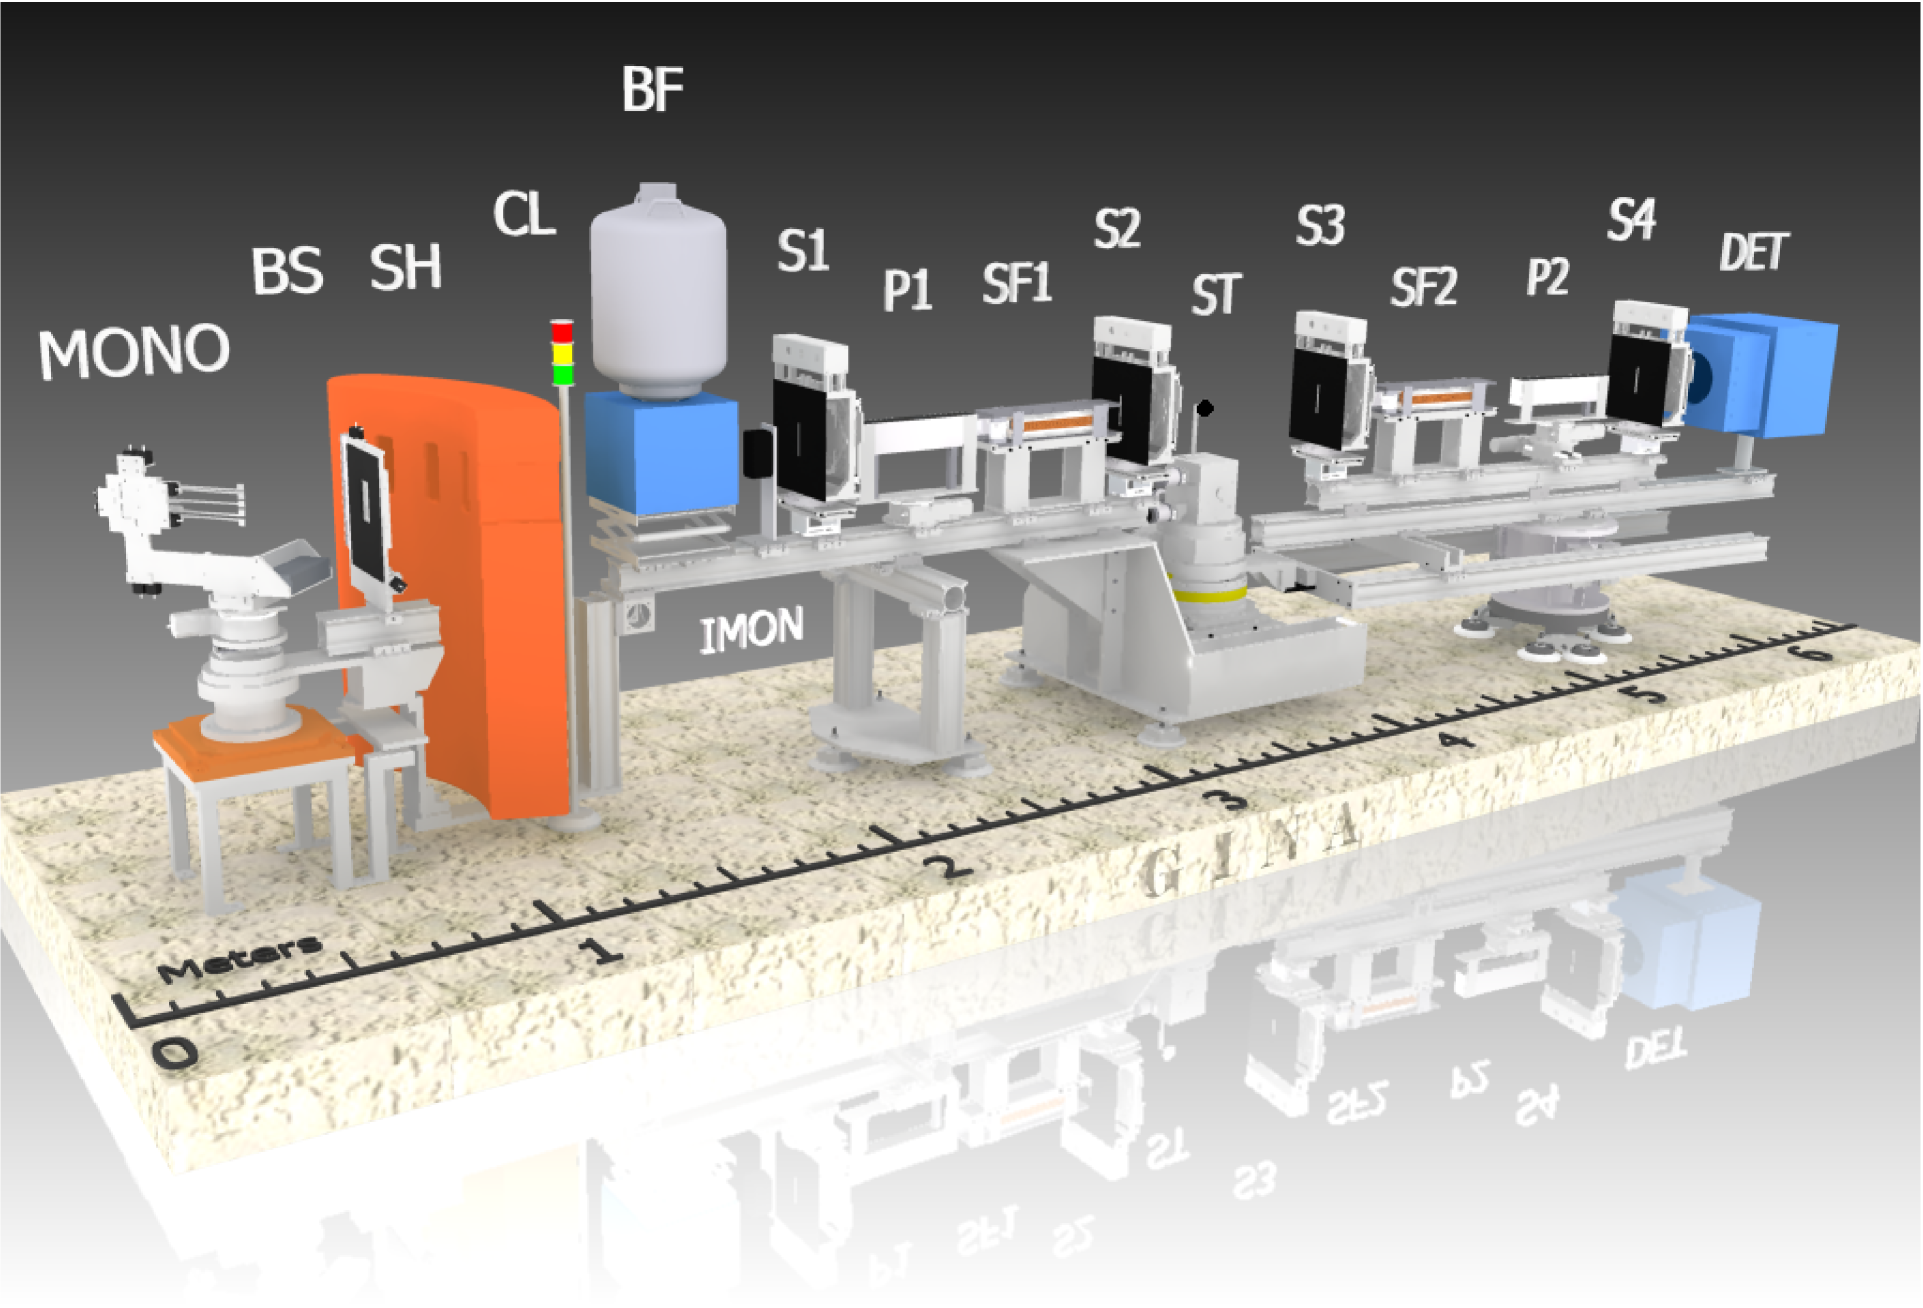
The optical bench B1 (cf. Fig. 1) defines the horizontal optical axis of the reflectometer and supports the beam shutter, the intensity monitor detector, the cryostat of the beryllium filter BF, the slit S1, the polarizer P1, the spin flipper SF1 and the slit S2. Bypassing the radiation shielding by a U-shape construction, the bench B1 is connected to the turntable of the monochromator, a heavy-load goniometer with vertical axis. The axis of the turntable coincides with that of the monochromator. The angle of the optical axis relative to the guide and consequently the wavelength can be changed by manually rotating the entire GINA setup around the turntable while air pads are activated and the entire setup floats over the marble floor. The allowed wavelengths are restricted at present to 3.2, 3.9, 4.6, 5.2 and by the respective channels through the cylindrical concrete shielding around the monochromator unit.
The downstream end of the optical bench B1 is fixed to the central goniometer tower ST, the components of which define the position and orientation of the sample surface relative to the beam and supports the various sample environment components (electromagnet, cryostat, etc.). The X95 optical bench B2 – the 2-arm of the reflectometer – is connected to the sample turntable underneath the central goniometer tower and it supports the slit S3, the spin flipper SF2, the spin analyzer P2, and the slit S4 in front of the detector unit along with its electronics and dedicated control PC. The encoder-controlled precise motion around the turntable is performed by a rubber-coated motorized wheel under the respective while the air pads are pressurized (cf. Fig. 1).
III WAVELENGTH SELECTION AND FOCUSING
The monochromator is located 17.8 meters downstream from the cold source. The curved Ni/Ti supermirror neutron guide between the cold source and the GINA monochromator has a horizontal radius of , a height of and a width of . The inner, outer, top and bottom mirrors are of and 2, respectively.
The TOF neutron spectrum of the beam leaving this guide section was measured by the pinhole camera technique J. Füzi (2008) looking upstream from behind the GINA monochromator. The results are shown in Fig. 2. Spectrum (a) and spectrum (b) represent the directions of neutrons passing through the monochromator crystals and alongside of them, respectively. The parameters of the TOF experiment – monochromator to pinhole distance , pinhole to detector distance (flight length) , pinhole diameter: , chopper open time: , bin time: , detector gas absorption depth: – resulted in a wavelength resolution J. Füzi (2006) of , leading to at and 6.2% at , about 3 to 4 times worse than the actual monochromator resolution. Consequently, the dips appear wider and shallower in Fig. 2 at and than they are in reality. 333During the preparation of the manuscript, the monochromator crystals have been exchanged and rearranged for optimum reflectivity, as well as further shielding was installed along the beam path, which resulted in a considerable increase of the reflected intensity to background ratio to . These modifications, along with new filter/polarizer options will be reported upon elsewhere.
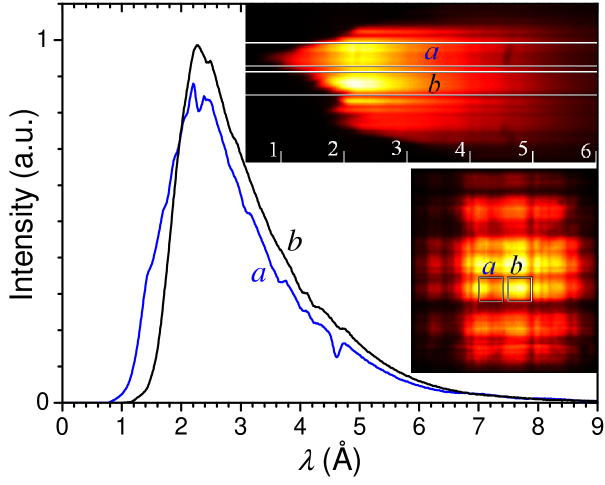
The TOF pinhole imaging measurement results in a 3-dimensional data set: horizontal and vertical pixel positions of a detector event in correlation with the pinhole distance give the corresponding divergence angles and time elapsed from chopper opening in correlation with flight distance give the neutron speed (energy, wavelength). A horizontal plane cut in this database (or a sum of several such cuts) yields the local (height averaged) intensity distribution as a function of horizontal divergence and wavelength (similar to Fig. 1 in Ref. J. Füzi, 2008, explained in more detail in Ref. Füzi, 2008a).
The lower inset of Fig. 2 displays the detector image summed up for the wavelength interval. The upper inset is a horizontal divergence vs. wavelength map summed up for the height of the summation areas (squares with sides of 29 mm) in the lower inset. The monochromator assembly is mounted on a turntable connected to the optical bench B1 and comprises five highly oriented pyrolytic graphite (HOPG) crystals of , attached to thin horizontal Al alloy rods (Fig. 3) and are lined up around the vertical axis.
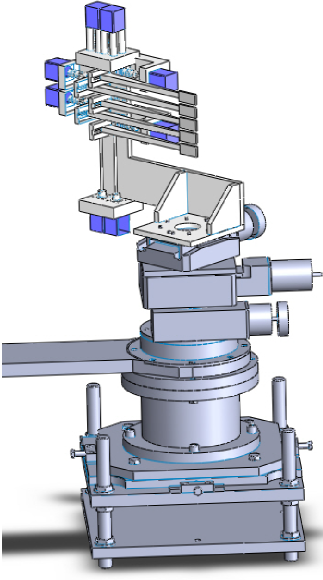
The mounting rod of the central graphite crystal is directly attached to the monochromator bench, which is alined with respect to the axis of the monochromator turntable and can be rotated around its vertical axis. The rods of the remaining four crystals (two above and two below) are attached to small motorized 2-axis goniometers for horizontal alignment and vertical focusing.
Vertical focusing to the sample position resulted in doubling the intensity reflected by a sample at grazing incidence as compared to the non-focused case of parallel graphite crystals.
The entire monochromator assembly can be tilted around a horizontal axis. When the instrument is not in operation, the monochromator assembly can be moved out of the beam using a linear stage. All eleven motions mentioned above are motorized and remotely controllable.
For the purpose of normalizing the measured reflectivity to the incident intensity, a low efficiency beam monitor detector 444Canberra XERAM, type MNH 10/4.2 SCAL with an active area of is mounted in the beam path downstream of the monochromator assembly. The detecting efficiency of the intensity monitor is for neutrons.
Bragg reflections by the HOPG crystals contain higher harmonics according to the energy distribution of the incident neutron beam. These fractional-wavelength neutrons need to be filtered out from the beam incident onto the sample. GINA is equipped with a Be filter with Be-slab size of (heightwidthdepth) which is cold-finger-cooled by liquid nitrogen during regular operation. The transmission of the filter was measured using the TOF technique with a wavelength resolution of 6%. This experiment revealed that the filter has a transmission of 40.7% and 86.6% for , without and with liquid nitrogen cooling, respectively, while suppressing all higher harmonics at both temperatures (Fig. 4).

IV SPIN POLARIZATION AND ANALYSIS
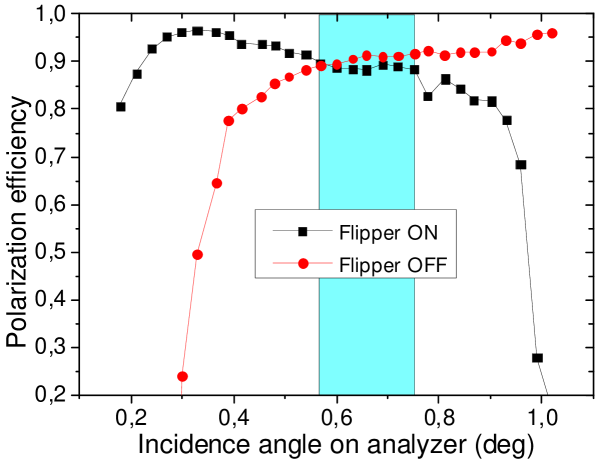
In order to produce polarized neutrons an Fe-Co/Si magnetic supermirror polarizer (made by Neutron Optics, Berlin) is used. The vertically oriented Si wafers with supermirror coating are mounted onto a rotator and a translator for adjustment to optimum polarization efficiency (defined below). The supermirror is placed between yokes of a permanent magnet construction with an in-plane vertical magnetic field of . For spin analysis of the reflected beam, a PSM analyzer is used in an identical construction with the polarizer. By this setup, spin analysis of specular scattering is easily possible. In the case of off-specular scattering detailed studies are also possible but the experiments are rather time consuming. Both supermirrors are used in transmission geometry. The corresponding overall polarization efficiency (of P1, SF1 and P2) is shown in Fig. 5 as a function of the incident angle on the analyzer PSM.
In neutron reflectometry the signal to background ratio is always a critical parameter and has to be maximized. Suppression of scattering of neutrons by the beam-line components is the key issue. Therefore, instead of using Mezei flippers of simpler construction (always wires in the beam) we decided to opt for RF spin flippers of own design and fabrication based on adiabatic fast passage (AFP). Bazhenov et al. (1993); Grigoriev, Okorokov, and Runov (1997) The flipper coil is placed in a transverse static magnetic field with longitudinal gradient, produced by two iron plates energized by Nd-Fe-B permanent magnet stacks upstream and shunted by soft iron rods downstream. The numerical simulation of the AFP processFüzi (2008b) for design and virtual testing purposes has been performed based on the measured magnetic field distribution of the constructed frame. The RF coil for longitudinal RF field is part of a serial electric resonant circuit, with a sinusoidal current and bandwidth (full width at half maximum, FWHM) of and at the resonance frequency of . The RF current is provided by a remote controlled power supply. 555Flipper power supply type ANSFR-83C (Promel Unlimited, Budapest, Hungary) The parameters of the adiabatic RF spin flippers are summarized in Table I. The flipper efficiency is better than 99% at any wavelength above , as recently proven on flippers of similar design. Saerbeck et al. (2012)
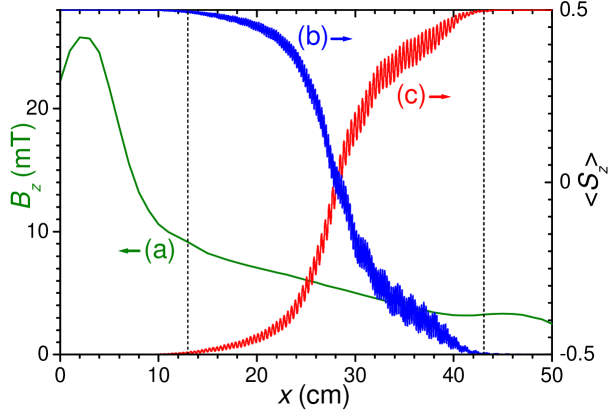
The present flipper design is insensitive to the external field variations and/or influence of magnetic components along the beam path. It can be used in the entire wavelength range of GINA without further adjustment. The static field and the simulated projection of the magnetic moment of the neutron onto the direction of the field are shown in Fig. 6 as a function of the neutron position along the beam path within the yokes of the flipper. For sake of clarity, the curves for two different wavelength values are plotted for spin-up and spin-down incoming spin states, respectively. Should the flipper terminate abruptly, i.e. at a given position both the static gradient field and the RF field become zero (a situation neither desired nor feasible), the neutrons would emerge with spin-state probability determined by the value of the respective curve at that position.
For neutron spin analysis an identical set of adiabatic RF spin flipper and PSM is placed downstream to the sample. The overall polarization efficiency of the setup was determined by measuring the reflected and transmitted intensity on the analyzer P2 (placed in the sample position) with and without activating the spin flipper SF1, while spin flipper SF2 was kept OFF. The polarization efficiency was calculated by the formula
| (1) |
where and are the corresponding reflected and transmitted intensities by the analyzer P2. This yields an overall efficiency of 0.9 for P1, SF1 and P2.
| Parameter | Range |
|---|---|
| beam height | 60 mm |
| wavelength range | |
| frequency | 175 kHz |
| coil length / coil diameter | 300 mm / 60 mm |
| number of turns | 100 |
| inductance / capacitance | 95 H / 8.8 nF |
| voltage / current (effective) | 40 V / 4 A |
| magnet block (Nd-Fe-B) | mm3 |
| yoke | mm3 |
| magnetic field in the centre | 5.6 mT |
| longitudinal gradient | mT/cm |
V SAMPLE POSITIONING
The flat sample is mounted on an adjustable vertical flat surface attached to the top cradle of the central goniometer tower. The sample mounting depends on the sample environment. For room temperature reflectivity measurements the flat surface has a small bore through which the sample is sucked to the vertical surface and held in position during the experiment by a small vacuum pump. In such a way undesired scattering by the fixing elements is minimized. Symmetrical sample positioning is ensured by using two cradles and two perpendicular linear stages. The cradles and translators position the sample in the vertical plane and set the sample surface orientation. The and angles are encoder controlled for increased precision. Fine positioning of the beam is maintained by several slits with cadmium blades. The slits can be opened in the range of 0 to with a precision better than 0.2 mm. One slit (S1) is placed downstream of the Be filter and one (S2) downstream of flipper SF1, just upstream of the sample. The slit S1 defines the beam on the polarizer mirror to decrease the beam divergence thus to increase the polarization ratio. Slit S2 decreases the beam divergence on the sample and absorbs the neutrons which might not reach the sample or scattered off by the polarizer. With these optical elements the setup can achieve a relative -resolution of 10% to 2% for the available -range of 0.005 to 0.25.
VI SAMPLE ENVIRONMENT
GINA is primarily dedicated to reflectometry of magnetic heterostructures. For studies of magnetism, vital environmental parameters are (low) temperature and (occasionally high) applied magnetic field. A closed cycle cryostat (comprising a cold finger setup 666The cold finger cryostat is of Edwards CoolStar Coldhead 2-9 type, driven by an Edwards Cryodrive 3 closed cycle He compressor and evacuated by a small turbomolecular pump) can be mounted on the central goniometer tower of GINA with or without the electromagnet. The sample temperature can be varied in the nominal 9 to range. 777Temperature control is performed by a Model 336 Lakeshore controller using standard Pt-100 and carbon glass sensors The GINA beam line is equipped with an air-cooled electromagnet which produces magnetic fields up to for the pole distance of that accommodates the 1.5” diameter Al cap of the cryostat. A water-cooled air core coil pair provides smaller magnetic fields up to approx. .
VII NEUTRON DETECTION AND BACKGROUND REDUCTION
For detecting the neutrons, a commercial position sensitive multi-wire proportional chamber is used (made by Mirrotron Ltd., Budapest). It is of active area and is filled with mixture of bar partial pressures and has a nominal spatial resolution 2 mm, and Al-window absorption and gas absorption efficiency of 8% and 94%, respectively at . In order to suppress the background, the detector is encased in a polyethylene shielding of 30 mm thickness containing natural B2O3. The two-dimensional spatial detection is managed by two delay lines and the positions are determined by a DASY TDC module (produced by ESRF, Grenoble) installed in a slot of the detector PC which is dedicated exclusively to the detector data acquisition and mounted on the -arm of the reflectometer. When detecting specular scattering, two slits (S3 and S4) are placed in front of the detector window to discard undesired radiation. If no spin analysis is required, for further background suppression, an evacuated flight tube is mounted along the entire length of the detector arm. Mounting the spin analyzer and flipper in a vacuum vessel is a plan for the future. The basic operation parameters of the GINA reflectometer are summarized in Table II.
VIII INSTRUMENT CONTROL
The GINA hardware and the control software are rather flexible and are designed for maximum remote controllability. In its full configuration, GINA comprises more than 30 stepping motors. 888The stepping motors are controlled by MCU-2FX and StepPack controllers from Advanced Control System Corporation, USA or SixPack 2 integrated controllers produced by TRINAMIC Motion Control GmbH, Germany. Certain critical motions, such as and angles and precision slit positions are absolute or relative encoder-controlled. A custom made unit built around a USB multi-function data acquisition module 999USB data acquisition module of type DT 9802, produced by Data Translation, USA controls the air compressor, the air pads, the liquid nitrogen level and temperature in the Be-filter, the beam shutter and its control lights, the beam intensity monitor and the various modular DC power supplies (the latter ones to energize electromagnets, and various coils in the setup including optional Mezei flippers). The high voltage power supplies of the detector and that of the beam monitor, the linear amplifiers, the discriminators and the ratemeters are realized in modules of NIM standard. The control PC directly communicates with the detector PC via ethernet and with the indexer modules of the motion control units as well as with the temperature controller via RS232 lines. All listed components are controlled by the GINASoft control software written in LabView V10.0 for MS Windows. The user interface of the program allows for various alignment and scan modes as well as changing polarization and sample environment (flipper current and frequency, temperature, magnet current, etc.) remotely. For increased user comfort the command format of the user interface is user-configurable, and includes a command format that resembles to that of SPEC. 101010SPEC by Certified Scientific Software, http://www.certif.com 2D detector pictures and reduced reflectivity data can be efficiently viewed and manipulated during data acquisition. Collected and manipulated data as well as extended log information (including graphics) are saved in a clearly structured database format. Human control is facilitated by a web camera which is installed in the control PC. Using remote desktop option, most operations can be performed remotely via internet from outside the experimental hall or even from a distant continent.
| Parameter | Range |
|---|---|
| wavelength | in five steps |
| present wavelength | |
| max. scattering angle | |
| angular resolution | |
| background level at the 2D detector | cps cm-2 |
| detector | 2D PSD |
| detector resolution | mm2 |
| neutron flux at the monochromator exit | |
| background reflectivityNote (3) | |
| (unpolarized, 4” Si) | |
| overall polarization efficiencyNote (3) of polarizer and analyser SM |
IX DATA HANDLING AND EVALUATION
Users of the GINA reflectometer are offered the data handling and evaluation software FitSuite, Sajti, Deák, and Bottyán (2009); *refe30a a thoroughly documented program with a detailed project home page, written for Windows and Linux, which is presently suitable for evaluating data of 14 experimental methods, including specular polarized neutron reflectometry (with e.g. model for diffusion, also in isotope-periodic multilayers) and off-specular (diffuse) polarized neutron reflectometry (in the distorted-wave Born approximation) as well as specular x-ray reflectometry. Specular and off-specular reflectivities are calculated using the matrix approach Ref. Deák et al., 2001 and the Distorted Wave Born Approximation given in Ref. Deák et al., 2007. FitSuite Sajti, Deák, and Bottyán (2009); *refe30a handles the corresponding theories and sample structures consistently in a common structure and allows for parameter restrictions, correlations and simultaneous simulation and fit of models to the experimental data.
X EXAMPLE REFLECTOGRAMS
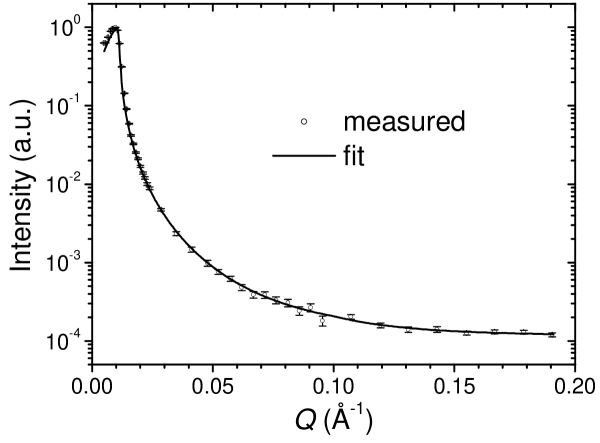
Two example reflectograms are chosen to highlight the present performance of the GINA setup. The first one is the specular reflectivity of a 4-inch Si wafer measured in non-polarized mode. The data shown in Fig. 7 were collected over a time of 22 hours. The fit to the experimental points gave an SLD value of for the native surface oxid layer of 20 thickness and roughnesses of 4 for both the silicon and the native oxide surfaces, respectively. The SLD for the silicon was kept constant to the nominal value of . The obtained SLD value for the oxide layer is slightly smaller than the SLD value of for amorphous bulk SiO2. This deviation may result from the lower density of the thin oxide layer as compared to that of the bulk. The fit, full line in Fig. 7, provides a background reflectivity of .
The second example is a magnetized Ni film. Polarized neutron reflectometry provides a means to simultaneously determine the atomic layer and magnetization profile in a multilayer. Deviation of both atomic and magnetic momentum density of Ni films from the bulk values was a subject of earlier neutron reflectometric studies. Singh and Basu studied a Ni film of 1500 on glass substrate (a neutron mirror) by unpolarized and polarized neutron reflectometry. Singh and Basu (2006, 2009) Their analysis of the data provided a nearly 50% decrease of the atomic and a similar extent of decrease in the magnetic momentum density in a surface layer of 235 and an about 10% decrease of both quantities in the rest of the film without any chemical change. Therefore we decided to study such effects on a carefully prepared Ni film. In order to exclude undesired surface effects, an isotopic multilayer Ni film of nominal layer structure was prepared by molecular beam epitaxy in the Wigner Research Centre for Physics, Budapest depositing Ni of natural isotopic abundance by electron beam evaporation and 96.2% enriched 62Ni from a Knudsen cell onto MgO of size. Reflection high energy electron deposition images taken during deposition revealed both epitaxial and polycrystalline regions in the multilayer. Due to the large negative SLD of 62Ni, it provides a sensitive probe of any structural change in the multilayer. Specular reflectivity of the sample was measured on the GINA reflectometer at room temperature in polarized mode without polarization analysis. Prior to the experiment the sample was magnetized from the virgin state by 50 mT in-plane external magnetic field parallel to the guide field. The total data collection time was 56 hours. In Figs. 8a–8b the reflectivities and are shown together with the curves of the simultaneous fit by FitSuite Sajti, Deák, and Bottyán (2009); *refe30a (latter in full lines). For clarity, the measured and fitted spin asymmetry curves are displayed separately in Fig. 8c.
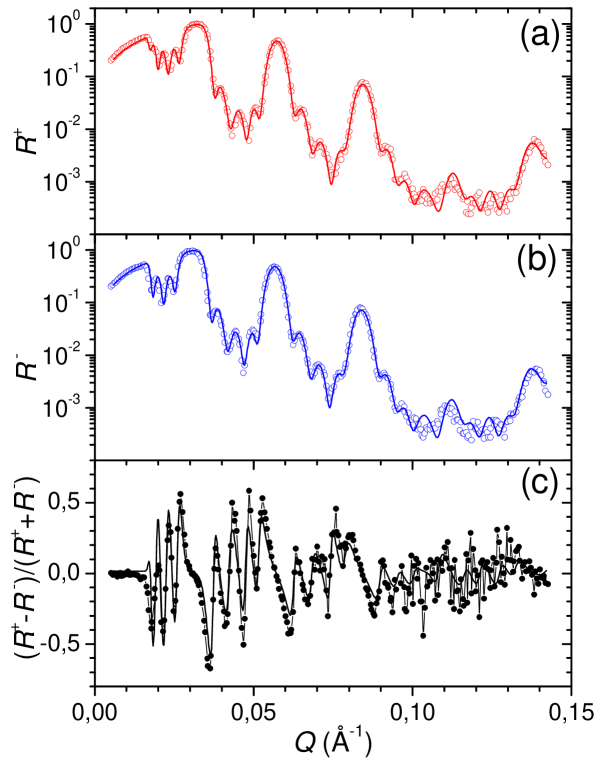
The simultaneous fit was constrained to a periodic layer structure and yielded layer thicknesses of and for natNi and 62Ni, respectively and common rms interface roughness of . The errors are statistical errors as obtained by the least-squares fit. The fitted scattering length densities were: ; showing only minor deviations from their known bulk SLD values, consequently as well as from the bulk Ni atomic density. The magnetization in the natNi and 62Ni layers were kept identical in the fit which provided . This value amounts only to 66% of the known room temperature saturation magnetization MS of the bulk Ni (, Cullity and Graham (2008) corresponding to ). This may be either due to a decrease of the Ni magnetic moment in the layers or an incomplete magnetic saturation of the sample. The reflectivity measurement was performed in 50 mT external magnetic field. This in-plane field strength was considered sufficient for saturation, since the bulk Ni saturates at 300 Oe even along the direction of the hard magnetization. Cullity and Graham (2008)
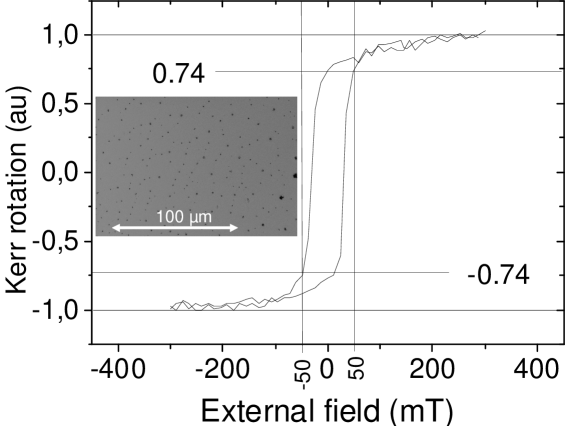
However, the magnetooptical Kerr-loop (Fig. 9) taken subsequent to the reflectivity measurement revealed a partial (74%) saturation of the Ni film in 50 mT. The somewhat lower value of 66% provided by the reflectivity fit can be explained by a lower magnetization of the near-edge regions of the sample, contributing to the reflectivity but not to the MOKE signal. Scanning electron microscopic pictures of the sample surface (inset in Fig. 9) reveals sparse plane-perpendicular tubular discontinuities of the multilayer. Image analysis provides 1.37% surface coverage of the tube openings. Therefore the total volume of the tubes and their effect on the average film density is negligible in the present sample.
XI SUMMARY
We have shown that GINA, the newly installed dance-floor-type constant energy angle-dispersive neutron reflectometer at the Budapest Neutron Centre is a versatile instrument in both polarized and unpolarized modes of operation. Examples were given for both modes of operation. The sample orientation of the reflectometer is vertical. The available sample environment facilities are: closed cycle cryostat optionally combined with external magnetic field by an iron core electromagnet up to 0.55 T or air core coils for 35 mT in various directions, spin polarization and polarization analysis by single polarizing supermirrors. Detection of specular and diffuse scattering is facilitated by a two-dimensional position-sensitive detector. All components of the instrument are controlled by a program written in LABVIEW. The program allows for alignment and scan modes as well as changing polarization and sample environment parameters remotely. Reflectivities above five orders of magnitude have been measured with further improvements underway. Further developments including an environmental cell for biomimetic membrane studies, an electromagnet with higher fields and orientation versatility and a supermirror fan analyzer and further background suppression elements are also planned. The GINA reflectometer is open for Hungarian and international users throughout the year. 111111Information concerning proposal submissions can be found at www.bnc.hu
Acknowledgements.
The GINA team is grateful to Prof. H. Dosch, former director of Max-Planck-Institut für Metallforschung for his continued interest in the GINA project and for the transfer of a number of components of EVA, a former neutron reflectometer operated by the Max-Planck-Institut für Metallforschung, Stuttgart at the Institut Laue-Langevin, Grenoble, France. Important support obtained from the members of the Stuttgart neutron group, namely from A. Vorobiev and P. Falus, (Grenoble) and A. Rühm and J. Franke (Garching) is deeply appreciated. Helpful advises by Yu. V. Nikitenko (Frank Laboratory of Neutron Physics, JINR, Dubna, Russia) at an early stage of the GINA project are gratefully acknowledged. We are also grateful to T. Keller, (Max-Planck-Institut für Festkörperforschung, Stuttgart) for his valuable support in the later stage of the construction work. Authors are thankful for the electronic and mechanical design and construction work on the GINA components to the colleagues at the Wigner Research Centre for Physics), Budapest, (formerly KFKI Research Institute for Particle and Nuclear Physics) in particular to P. Rusznyák, J. Gigler, G. Gy. Kertész and L. Jakab, as well as the mechanical workshop team led by F. Bodai. The support of the management and staff of the reactor of the Budapest Neutron Centre and preparation of the 62Ni/ natNi multilayer sample by F. Tanczikó are gratefully acknowledged. This work was partially supported by the National Office for Research and Technology of Hungary and the Hungarian National Science Fund (OTKA) under contracts NAP-VENEUS’05 and K 62272, respectively. Mobility support for A.V. Petrenko by the bilateral project between JINR (Dubna) and the Hungarian Academy of Sciences is gratefully appreciated.References
- Parratt (1954) L. G. Parratt, Phys. Rev. 95, 359 (1954).
- Felcher (1981) G. P. Felcher, Phys. Rev. B 24, 1595 (1981).
- Deák et al. (2001) L. Deák, L. Bottyán, D. L. Nagy, and H. Spiering, Physica B: Condensed Matter 297, 113 (2001), proceeding of the Third International Workshop on Polarised Neutrons.
- Rühm, Toperverg, and Dosch (1999) A. Rühm, B. P. Toperverg, and H. Dosch, Phys. Rev. B 60, 16073 (1999).
- Majkrzak and Berk (1996) C. F. Majkrzak and N. F. Berk, Physica B: Condensed Matter 221, 520 (1996), proceedings of the Fourth International Conference on Surface X-ray and Neutron Scattering.
- Sinha et al. (1988) S. K. Sinha, E. B. Sirota, S. Garoff, and H. B. Stanley, Phys. Rev. B 38, 2297 (1988).
- Krueger (2001) S. Krueger, Current Opinion in Colloid & Interface Science 6, 111 (2001).
- Fragneto-Cusani (2001) G. Fragneto-Cusani, Journal of Physics: Condensed Matter 13, 4973 (2001).
- Felcher et al. (1987) G. P. Felcher, R. O. Hilleke, R. K. Crawford, J. Haumann, R. Kleb, and G. Ostrowski, Review of Scientific Instruments 58, 609 (1987).
- Ankner and Felcher (1999) J. F. Ankner and G. P. Felcher, Journal of Magnetism and Magnetic Materials 200, 741 (1999).
- ref (2005) Proceedings of the 8th International Conference on Surface X-ray and Neutron Scattering (Physica B: Condensed Matter 357 (1-2), 2005) and references therein.
- Shinjo (2009) T. Shinjo, Nanomagnetism and Spintronics (Elsevier Science, 2009) and review articles therein.
- Zabel (2006) H. Zabel, Materials Today 9, 42 (2006).
- Zabel et al. (2008) H. Zabel, K. Theis-Bröhl, M. Wolff, and B. P. Toperverg, IEEE Transactions on Magnetics 44, 1928 (2008).
- Zabel, Theis-Bröhl, and Toperverg (2007) H. Zabel, K. Theis-Bröhl, and B. P. Toperverg, “Polarized neutron reflectivity and scattering from magnetic nanostructures and spintronic materials,” in Handbook of Magnetism and Advanced Magnetic Materials (John Wiley & Sons, Ltd, 2007) p. 2327.
- Rosta and Baranyai (2011) L. Rosta and R. Baranyai, Neutron News 22, 31 (2011).
- Bottyán et al. (2012) L. Bottyán, D. G. Merkel, B. Nagy, and J. Major, Neutron News 23, 21 (2012).
-
Note (1)
The actual list with links to the neutron reflection
facilities can be found at the page of A.R. Rennie:
http://material.fysik.uu.se/Group_members/adrian/reflect.htm. - Nagy (2010) B. Nagy, Installation of the GINA polarized reflectometer and its first applications to magnetic multilayers, Master’s thesis, University of Technology and Economics, Budapest (2010), in Hungarian.
- Bazhenov et al. (1993) A. N. Bazhenov, V. M. Lobashev, A. N. Pirozhkov, and V. N. Slusar, Nuclear Inst. and Methods in Physics Research, A 332, 534 (1993).
- Grigoriev, Okorokov, and Runov (1997) S. V. Grigoriev, A. I. Okorokov, and V. V. Runov, Nuclear Instruments and Methods in Physics Research Section A: Accelerators, Spectrometers, Detectors and Associated Equipment 384, 451 (1997).
- Note (2) Newport Co., Irvine, CA, USA, www.newport.com.
- J. Füzi (2008) J. Füzi, Nuclear Instruments and Methods in Physics Research Section A: Accelerators, Spectrometers, Detectors and Associated Equipment 586, 41 (2008), proceedings of the European Workshop on Neutron Optics, NOP ’07.
- J. Füzi (2006) J. Füzi, Physica B: Condensed Matter 385–386, Part 2, 1253 (2006), proceedings of the Eighth International Conference on Neutron Scattering.
- Note (3) During the preparation of the manuscript, the monochromator crystals have been exchanged and rearranged for optimum reflectivity, as well as further shielding was installed along the beam path, which resulted in a considerable increase of the reflected intensity to background ratio to . These modifications, along with new filter/polarizer options will be reported upon elsewhere.
- Füzi (2008a) J. Füzi, in Modern Developments in X-Ray and Neutron Optics, Springer Series in optical science, Vol. 137, edited by A. Erko, M. Idir, T. Krist, and A. Michette (Springer Berlin Heidelberg, 2008) pp. 43–55.
- Note (4) Canberra XERAM, type MNH 10/4.2 SCAL.
- Füzi (2008b) J. Füzi, Measurement Science and Technology 19, 034013 (2008b).
- Note (5) Flipper power supply type ANSFR-83C (Promel Unlimited, Budapest, Hungary).
- Saerbeck et al. (2012) T. Saerbeck, F. Klose, A. P. L. Brun, J. Füzi, A. Brule, A. Nelson, S. A. Holt, and M. James, Review of Scientific Instruments 83, 081301 (2012).
- Note (6) The cold finger cryostat is of Edwards CoolStar Coldhead 2-9 type, driven by an Edwards Cryodrive 3 closed cycle He compressor.
- Note (7) Temperature control is performed by a Model 336 Lakeshore controller using standard Pt-100 and carbon glass sensors.
- Note (8) The stepping motors are controlled by MCU-2FX and StepPack controllers from Advanced Control System Corporation, USA or SixPack 2 integrated controllers produced by TRINAMIC Motion Control GmbH, Germany.
- Note (9) USB data acquisition module of type DT 9802, produced by Data Translation, USA.
- Note (10) SPEC by Certified Scientific Software, http://www.certif.com.
- Sajti, Deák, and Bottyán (2009) S. Sajti, L. Deák, and L. Bottyán, “Fitsuite a general program for simultaneous fitting (and simulation) of experimental data,” (2009), arXiv:0907.2805v1 [cond-mat.other] .
- ref (2009) (2009), The computer program FitSuite is available from www.fs.kfki.hu.
- Deák et al. (2007) L. Deák, L. Bottyán, D. L. Nagy, H. Spiering, Y. N. Khaidukov, and Y. Yoda, Phys. Rev. B 76, 224420 (2007).
- Singh and Basu (2006) S. Singh and S. Basu, Surface Science 600, 493 (2006).
- Singh and Basu (2009) S. Singh and S. Basu, Journal of Physics: Condensed Matter 21, 055010 (2009).
- Cullity and Graham (2008) B. D. Cullity and C. D. Graham, Introduction to Magnetic Materials (Wiley-IEEE Press, 2008).
- Note (11) Information concerning proposal submissions can be found at www.bnc.hu.