GRB 050410 and GRB 050412: are they really dark GRBs?
Abstract
Aims. We present a detailed analysis of the prompt and afterglow emission of GRB 050410 and GRB 050412 detected by Swift for which no optical counterpart was observed.
Methods. We analysed data from the prompt emission detected by the Swift BAT and from the early phase of the afterglow obtained by the Swift narrow field instrument XRT.
Results. The keV energy distribution of the GRB 050410 prompt emission shows a peak energy at 53 keV. The XRT light curve of this GRB decays as a power law with a slope of 1.060.04. The spectrum is well reproduced by an absorbed power law with a spectral index and a low energy absorption =41021 cm-2 which is higher than the Galactic value. The keV prompt emission in GRB 050412 is modelled with a hard (=0.70.2) power law. The XRT light curve follows a broken power law with the first slope =0.70.4, the break time Tbreak=254 s and the second slope =2.8. The spectrum is fitted by a power law with spectral index which is absorbed at low energies by the Galactic column.
Conclusions. The GRB 050410 afterglow light curve reveals the expected characteristics of the third component of the canonical Swift light curve. Conversely, a complex phenomenology was detected in the GRB 050412 because of the presence of the very early break. The light curve in this case can be interpreted as being the last peak of the prompt emission. The two bursts present tight upper limits for the optical emission, however, neither of them can be clearly classified as dark. For GRB 050410, the suppression of the optical afterglow could be attributed to a low density interstellar medium surrounding the burst. For GRB 050412, the evaluation of the darkness is more difficult due to the ambiguity in the extrapolation of the X-ray afterglow light curve.
Key Words.:
gamma rays:bursts - X-rays: individual(GRB 050410, GRB 050412)teresa.mineo@ifc.inaf.it
1 Introduction
Gamma-Ray Bursts (GRBs), the brightest explosions in the universe, produce emission across the whole electromagnetic spectrum from -rays to radio wavelengths. However, multi-wavelength observations have shown that the optical counterpart following the prompt emission is detected in only about 50% of the well localised events (De Pasquale et al. 2003; Roming et al. 2006; Roming & Mason 2006).
The paucity of optical detections of GRB afterglows has been explained by invoking different mechanisms (Lazzati et al. 2002; Lamb & Reichart 2000; Groot et al. 1998; Taylor et al. 1998; Wijers et al. 1998; Totani 1997). More recently, by comparing the Swift optical, X-ray and -ray data sets, Roming et al. (2006) identified a class of optically “dark” GRBs with higher than normal -ray efficiency. A possible mechanism proposed for these GRBs is based on a Poynting flux dominated outflow (Zhang & Kobayashi 2005) where the transfer of the energy from the fireball to the medium is delayed, leading to the suppression of the reverse shock, likely responsible for the prompt optical emission, and to an apparent high -ray efficiency. A stronger alternative mechanism proposed is a pure non-relativistic hydrodynamical reverse shock (Kobayashi 2000; Nakar & Piran 2004; Beloborodov 2005; Kobayashi et al. 2005; Uhm & Beloborodov 2006; McMahon et al. 2006).
The characterisation of optical darkness has been previously based on the upper limit of the optical/NIR afterglow flux (Rol et al. 2005; Filliatre et al. 2005, 2006) or the optical-to-X-ray spectral index (Jakobsson et al. 2004). In particular, if the optical-to-X-ray spectral index, , is lower than the afterglow should be classified as dark; while for Rol et al. (2005) dark afterglows are those with optical upper limits falling below the extrapolation of the X-ray spectrum to the optical range.
The Swift Gamma-Ray Burst Explorer (Gehrels et al. 2004), successfully launched on 2004 November 20, is a multi-wavelength observatory dedicated to the discovery and study of GRBs and their afterglows. It carries three instruments: the Burst Alert Telescope (BAT; Barthelmy et al. 2005) and the two narrow-field instruments: the X-Ray Telescope (XRT; Burrows et al. 2005) and the Ultra-Violet Optical Telescope (UVOT; Roming et al. 2005b). Swift’s capability of rapidly repointing the spacecraft in a few tens of seconds after a BAT detection, allows a study of the first phases of an afterglow evolution over a broad energy range from optical to X-rays.
In this paper, we present the results on the analysis of the prompt and the afterglow emission of GRB 050410 and GRB 050412 observed by Swift, two bursts for which no optical counterpart was detected.
Errors in the paper are relative to a 90% confidence level for a single parameter ( = 2.71). Times are referenced from the BAT trigger, T0. The decay and spectral indices are parameterised as follows: where (erg cm-2 s-1 Hz-1) is the monochromatic flux as a function of time and frequency ; we also use as the photon index (ph cm-2 s-1 keV-1) where is the number of photons at the energy .
2 Observation
GRB 050410 triggered BAT at 12:14:25.36 UT (Fenimore et al. 2005). At the time of the first detection, GRB 050410 was within the Swift Earth-limb constraint, therefore, the observatory executed a delayed automated slew to the BAT position and started observing with the narrow-field instruments 32 minutes after the burst. At that time, the X-ray afterglow was too faint for the XRT to produce an on-board centroid, therefore a position was determined during ground processing (La Parola et al. 2005). No new source was detected by UVOT within the BAT and XRT error circles down to a 3 limiting magnitude of V = 19.9, B = 21.2 and U =20.9 (Boyd et al. 2005). Ground based follow-up also did not detect any optical counterpart for GRB 050410 down to a limiting magnitude of R 20.5 at times after the burst of T=13.3 ks (Misra et al. 2005), T=17.5 ks (Ofek & Lipkin 2005) and T=20.6 ks (Rumyantsev et al. 2005); and limiting magnitudes of Gunn i = 21.5 and Gunn z = 20.0 at T=56.2 ks after the burst (Cenko & Fox 2005a). No radio counterpart was detected down to 2 upper limit of 114 Jy (Soderberg 2005a).
The second burst considered in the paper, GRB 050412, was discovered by Swift at 05:44:03 UT (Cummings et al. 2005; Tueller et al. 2005). The observatory executed an automated slew to the BAT position and the XRT and UVOT began taking data 99 s after the BAT trigger. The position of the X-ray counterpart was derived from the first orbit of data and was given in Mangano et al. (2005). UVOT data revealed no evidence of a fading source in the 5 radius XRT error circle; the 3 limiting magnitude was V = 19.1 (Roming et al. 2005a). The Chandra X-ray Observatory observed GRB 050412 with the ACIS for 20 ks on 2005 April 17, when the source was no longer visible in the XRT data. No X-ray source was detected by Chandra and an upper limit on the unabsorbed keV flux of 3.610-15 erg cm-2 s-1 was inferred (Berger & Fox 2005).
Ground based optical follow-up did not detect any counterpart for GRB 050412 at early epochs down to a limiting magnitude of R 20 at times after the burst of T=7.1 s (Quimby et al. 2005), T=250 s (Torii 2005); T=360 s (Cenko & Fox 2005b) and T=2.5 ks, (Berger et al. 2005). The most constraining optical observation was performed with the FOCAS on the Subaru 8.2 m telescope atop Mauna Kea at 2.3 h from the burst and it gave a 3-sigma upper limit of Rc=24.9 on the afterglow emission (Kosugi et al. 2005). However, a source at the centre of the XRT error circle with the magnitude of Rc=26.00.5 was detected 7.2 h after the burst with a second set of observations but because of the marginal detection, it was not possible to determine whether it was a point source or a galaxy (Kosugi et al. 2005). No radio counterpart of GRB 050412 was detected down to 2 upper limit of 38Jy (Soderberg 2005b).
3 BAT and XRT data reduction and analysis
The BAT event data were re-analysed using the standard analysis software111see http://swift.gsfc.nasa.gov/docs/swift/ included in the HEAsoft 6.0.4 package. Response matrices were generated with the task BATDRMGEN using the latest spectral redistribution matrices. The BAT background was subtracted using a mask-weighting technique that is only effective up to 150 keV.
XRT data were calibrated, filtered and screened with the XRTDAS software package, included in the HEAsoft 6.0.4 package, to produce cleaned photon list files. Only time intervals with the CCD temperature below 47 Co were selected. Table 1 shows the observation log for GRB 050510 and GRB 050512.
| Obs. # | Start Time (UT) | Exposure | |
| (yyyy-mm-dd hh:mm:ss) | WT (s) | PC (s) | |
| GRB 050410 | |||
| 1 | 2005-04-10 12:46:24 | 9 436 | 8 635 |
| 2 | 2005-04-12 16:15:47 | – | 4 740 |
| 3 | 2005-04-12 00:11:47 | – | 1 473 |
| 4 | 2005-04-14 00:22:44 | – | 3 184 |
| 5 | 2005-04-15 00:30:44 | – | 10 895 |
| 6 | 2005-04-16 00:32:01 | – | 13 086 |
| 7 | 2005-04-17 16:45:01 | – | 6 418 |
| 8 | 2005-04-19 00:50:42 | – | 9 832 |
| 9 | 2005-04-20 00:54:29 | – | 11 123 |
| 10 | 2005-04-21 00:55:58 | – | 1 828 |
| Total exposure (s) | 9 436 | 71 214 | |
| GRB 050412 | |||
| 1 | 2005-04-12 05:45:47 | 3 019 | 1 950 |
| 2 | 2005-04-14 00:04:59 | – | 3 719 |
| 3 | 2005-04-17 09:28:35 | – | 6 200 |
| Total exposure (s) | 3 019 | 11 869 | |
Standard grade selection, 0–12 for Photon Counting (PC) mode and 0–2 for Window Timing (WT) mode (Hill et al. 2004), was used for both spectral and timing analysis. Ancillary response files for PC and WT spectra were generated with the standard XRTMKARF tool (v 0.5.1) using calibration files from CALDBv.2.3.
WT data were extracted in a rectangular region 4020 pixels along the image strip which included about 96% of the Point Spread Function (PSF). PC data were extracted from a circular region of 20 pixels radius for observing intervals with a rate lower than 0.2 counts s-1. In time periods with higher rates, the extraction region used was an annulus with an inner radius of 3 pixels and an outer radius of 20 pixels in order to take into account pile-up effects. The two regions included, assuming an average energy of 1.5 keV, 92% (circular) and 48% (annulus) of the PSF, respectively. The WT and PC backgrounds were extracted from regions far from the GRB counterpart and from any sources in the field. WT and PC spectral analysis of both GRBs was performed in the energy range keV to avoid residual background due to bright Earth contamination and dark current that are more dominant at lower energies.
3.1 GRB 050410
GRB 050410 triggered Swift twice as a result of an anomalous time-out of the triggering code (Fenimore et al. 2005). In our analysis, we consider as reference time the time of the first trigger (T0=12:14:25.36 UT).
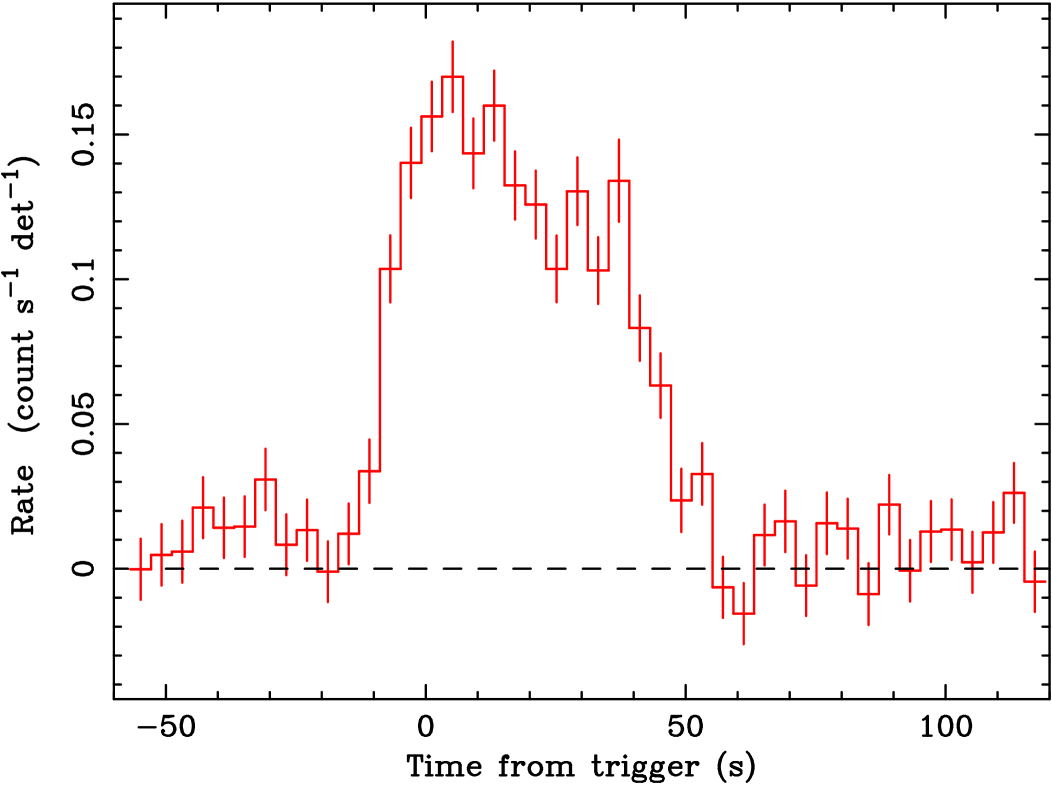
The keV light curve of the prompt emission, shown in Fig. 1, is characterised by a broad peak with T90=441 s. The burst shape can be modelled by two Gaussians of the same width (112 s), the first centered at 51 s and the second at 322 s.
The keV energy distribution of the burst, modelled with a simple power law of photon index , gave a marginally acceptable fit with a of 1.67 for 36 dof (see Table 2). Better fits were obtained using a cut-off power law or a Band model (Band et al. 1993) with the high energy photon index, , fixed to 2.3 according to the expected value (Preece et al. 2000). The best fit values of the spectral parameters are shown in Table 2. The improvement with respect to the power law fit is significant for both models, with a chance random probability of 710-5, assuming that the errors are normally distributed. The fluence in the keV energy range was (4.60.1)10-6 erg cm-2.
| GRB 050410 | GRB 050412 | |
| keV (BAT) | ||
| Power Law | ||
| 1.660.07 | 0.70.2 | |
| (dof) | 1.67 (36) | 0.55 (15) |
| Band Model with =2.3 | ||
| 0.790.09 | – | |
| (keV) | 53 | – |
| (dof) | 1.11 (35) | – |
| Cut-off Power Law | ||
| 0.80.3 | – | |
| 54 | – | |
| (dof) | 1.08 (35) | |
| keV (XRT) | ||
| Power Law | ||
| (cm-2) | 41021 | 2.211020 |
| 2.40.4 | 1.30.2 | |
| (dof) | 0.64 (13) | 1.18 (17) |
The XRT observed GRB 050410 for 10 orbits for a total exposure of 9 ks in WT mode and 71 ks in PC mode. The position of the burst, determined with astrometry solutions, was RA05h 59m 13s.94 Dec79° 36′ 117, with an uncertainty of 23 (Butler 2007). These coordinates lie outside the error circle (37 radius) of the position derived with the tool XRTCENTROID and 42 from the BAT position reported by Fenimore et al. (2005).
The GRB 050410 XRT light curve shows a clear decay with time that can be well modelled (=0.87 with 13 d.o.f.) by a single power law with a slope 1.060.04. The light curve, shown in Fig. 2, was converted to flux in the keV band using a conversion factor derived from the best fit spectral model (see below). In the same figure, the BAT light curve extrapolated to the keV energy range is also plotted. The extrapolation was obtained by multiplying the keV rate by the average rate-to-flux conversion factor for GRB 050410 derived from the Band model parameters.
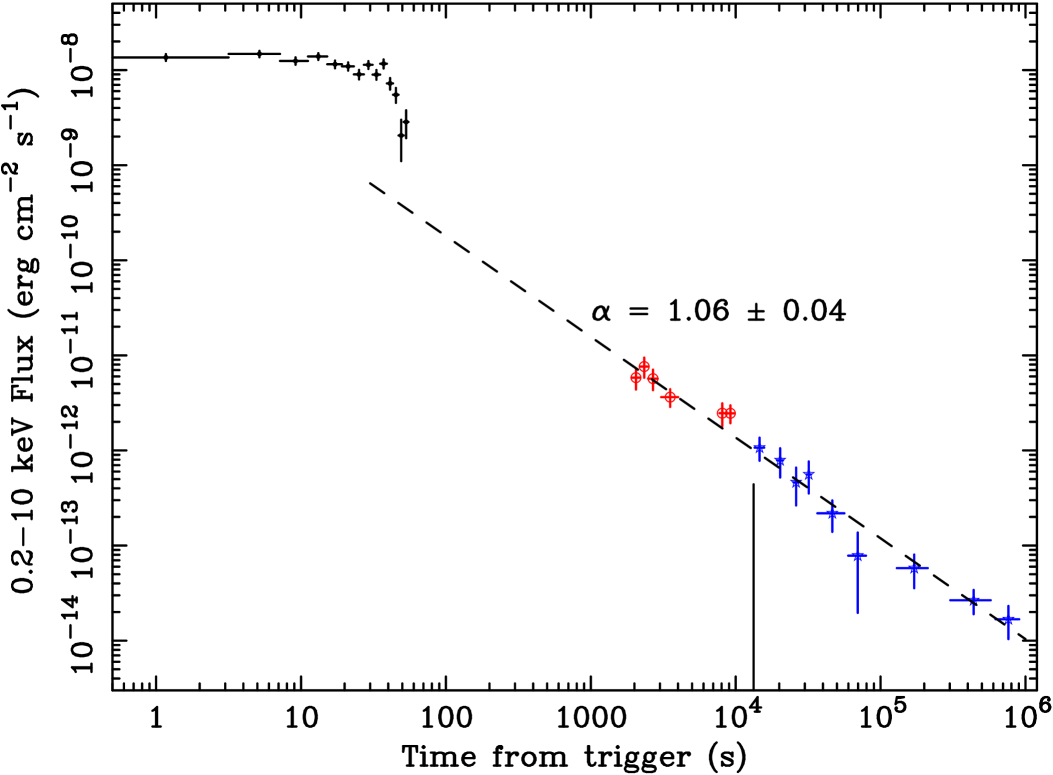
WT and PC spectra were fitted simultaneously because no spectral evolution with time was detected. The two spectra normalisations were left free to vary, thus accounting for the different average flux levels in the two observing periods. An absorbed power law reproduces well the emission ( of 0.64 for 13 d.o.f.) with the best fit parameters (see also Table 2) and =41021 cm-2. Note that the absorbing column is non-zero at the 4-sigma level, and the best-fit value of the absorbing column is 5 times larger than the Galactic one (7.531020 cm-2; Dickey & Lockman 1990).
3.2 GRB 050412
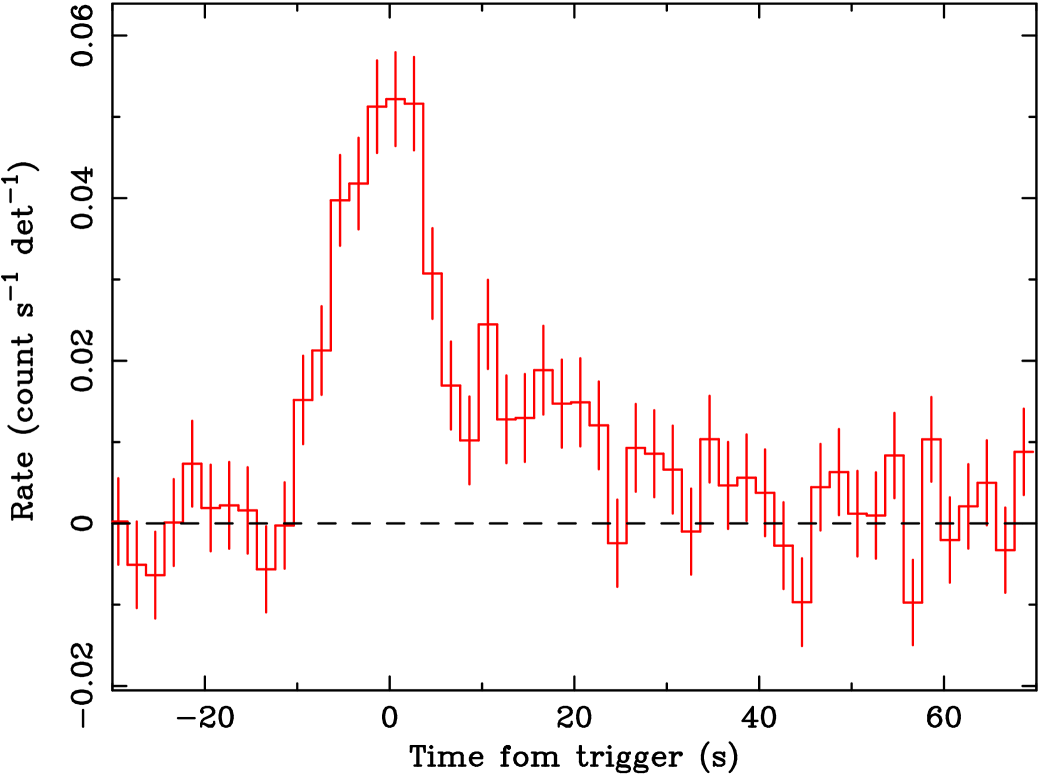
The GRB 050412 prompt emission showed a double-peaked structure with the first peak centered at 1.10.4 s from the trigger (width of 4.70.6 s), and the second fainter and wider (113 s) peak centered at 165 s (see Fig.3). The estimated T90 in the keV energy band was 271 s. The hardness ratio ( keV and keV) does not show any significant evidence of spectral variation during the burst evolution.
The keV energy distribution was well described ( for 15 d.o.f.) by a single power law with an hard photon index of . The T90 burst fluence in the keV energy range was (6.30.3) 10-7 erg cm-2. A Band model and a cut-off power law were not able to reproduce this spectrum because some of the fitting parameters are not constrained.
The XRT detected a rapidly fading source at RA12h 04m 25s.2 Dec-01° 12′ 004, with an uncertainty of 42. This position, derived with the tool XRTCENTROID, is 608 from the BAT position (Tueller et al. 2005) and it is in agreement with the refined value derived with astrometry technique (Butler 2007).
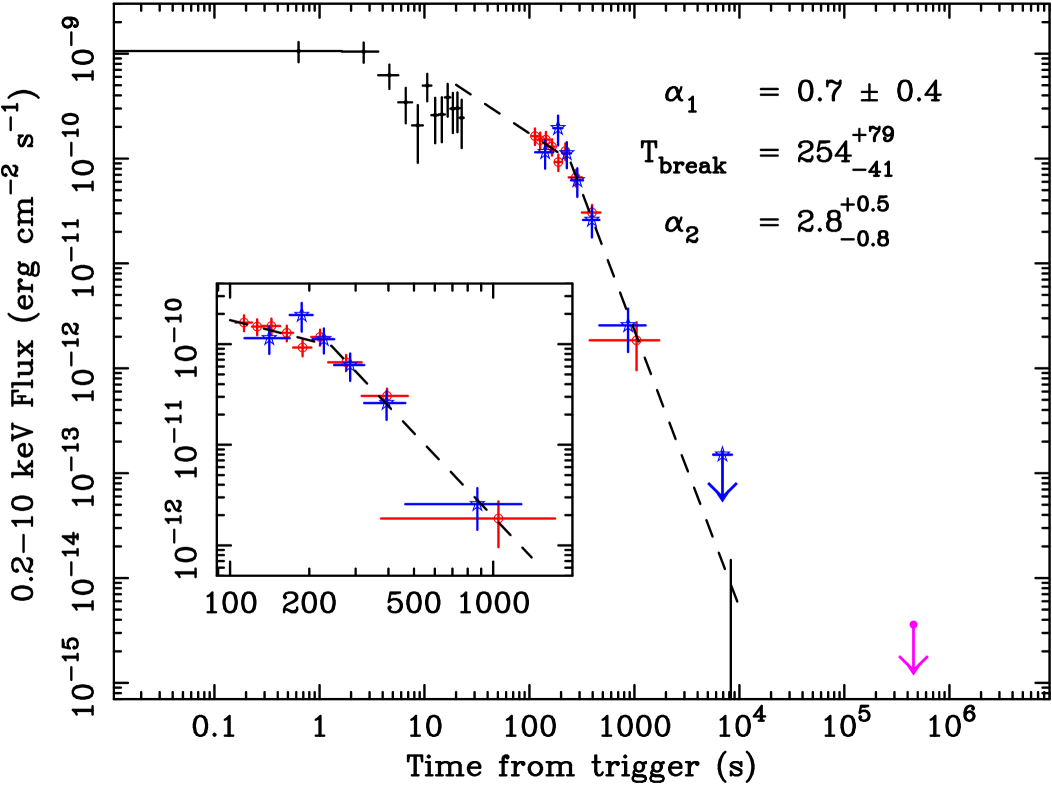
The XRT light curve is not consistent with a single power law ( with 18 d.o.f.). A better fit ( with 14 d.o.f.) can be obtained with a broken power law whose best fit parameters are: =0.70.4, =2.8 and Tbreak=254 s. The GRB 050412 light curve was converted to the keV flux with a procedure similar to the one used for GRB 050410, and plotted in Fig. 4 together with the BAT light curve extrapolated to the XRT energy range. In the same figure, the 3 upper limit obtained by Chandra is also plotted (Berger & Fox 2005). The upper limits derived from Swift observations 2 (2005-04-14) and 3 (2005-04-17) are not plotted in the figure, since they are less constraining than the Chandra one.
The first orbit of the GRB 050412 observation is affected by a continuous switching between PC and WT mode (caused by flickering pixels produced by the high CCD temperature and by the bright Earth contamination); thus the two operational mode spectra are almost contemporaneous. The WT spectrum only employed the first 1400 s of data to avoid a background flare present in the second part of the observation. WT and PC spectra were fitted simultaneously with an absorbed power-law model, leaving the normalisation free in order to take into account differences in the flux levels. The measured absorption column was consistent with the Galactic (2.211020 cm-2; Dickey & Lockman 1990) and was fixed to this value. The best fit power-law spectral index was with a reduced of 1.18 (17 d.o.f.). Results of the spectral analysis are shown in Table 2.
4 Discussion
The discussion on the results of GRB 050410 and GRB 050412 analysis is based on two main points: (i) the comparison of the X-ray afterglow light curves with other Swift results, particularly important for GRB 050412 where a very early break (250 s) followed by a steep decay =2.8 were detected; (ii) the classification of the two bursts as dark.
4.1 The X-ray light curve
The X-ray afterglow light curves of many bursts manifest a similar behaviour (O’Brien et al. 2006; Nousek et al. 2006; Willingale et al. 2006). The canonical X-ray light curve has an initial steep decay (usually interpreted as emission from the tail of the prompt GRB), followed by a flatter decay phase that can last up to 105 s (interpreted as a refreshing of the forward shock), and a final steeper decay phase with power law indices consistent with the values measured before the launch of Swift (Frontera 2003). This canonical light curve is consistent with about 60% of the Swift afterglows. In many of the non-conforming cases, the first, or the first and the second branches are missing. The lack of detection of these portions of the light curve cannot always be attributed to missing observational data. Moreover, in about half of the afterglows, late X-ray flares, probably due to continued activity of the central engine, are observed (O’Brien et al. 2006; Nousek et al. 2006; Zhang et al. 2006).
The light curve of GRB 050410, starting from about 2000 s from the trigger, shows a constant decay slope that can be interpreted as the third branch of the canonical light curve. The synchrotron radiation theory applied to the fireball model predicts that the temporal decay index, , of a GRB afterglow and the spectral slope, , are linked by relations that depend (i) on the density profile of the external medium (Meszaros & Rees 1997; Chevalier & Li 1999); (ii) on the observer’s perception of the geometry of the expansion: spherical whenever the expansion velocity corresponds to a Lorentz factor, , such that , and beamed for with being the half opening angle of the jet (Sari et al. 1999; Rhoads 1999); (iii) on the observational frequency and its relation to the typical synchrotron frequency of newly shocked electrons, , and to the cooling frequency corresponding to a synchrotron cooling time equal to the hydrodynamical expansion time (Sari et al. 1998). In particular, for fireball expansion in a uniform interstellar medium we are usually in the regime and expect and , with the energy distribution of the electrons, , greater than 2, before the jet edge effect is manifested. This relation is satisfied by GRB 050410 with a value . This value is lower than values predicted by numerical simulations (2.2-2.5), but still consistent for particle acceleration at ultraluminous shocks. From this result, we can derive a lower limit of 10 d to the time after the trigger of any jet break. The XRT light curve of GRB 050410 is therefore consistent with a pre-Swift X-ray afterglow light curve, or with the third branch of the canonical Swift afterglow light curve. The late start of XRT observations (2000 s after the trigger) might have prevented the detection of the previous branches.
According to the typical Swift afterglow behaviour, the early break in the X-ray light curve of GRB 050412 may be interpreted as the flat to steep transition corresponding to the end of the refreshing of the forward shock. However the measured spectral index =0.30.2 would imply a flat electron energy distribution with . The expected temporal slope, either for spherical expansion in a uniform medium or for a standard isotropic wind model in the and regime, is inconsistent with .
The values of (), () and () of GRB 050412 fit the closure relations corresponding to a jet break occurring in the regime for with and according to Dai & Cheng (2001). An early achromatic break has also been detected in the X-rays and optical light curve for GRB 050801 (Rykoff et al. 2006; Covino et al. 2006), while achromatic breaks usually occur at T104 s (Blustin et al. 2006; Romano et al. 2006; Soderberg et al. 2006; Bloom et al. 2003; Frail et al. 2001; Covino et al. 2006). However, in the case of GRB 050412, this explanation is very unlikely because such an early time for the temporal break would require a very small value for the jet angle ( deg) which is at variance with the beaming angle ( deg) computed, assuming a peak energy greater than 150 keV, from the Amati (2006) and Ghirlanda et al. (2004) relations, that holds for most of the bursts.
Alternatively, the first part of the XRT light curve can be considered as the last peak of the prompt emission, and the decay rate beyond 250 s can be interpreted as due to curvature effect after an instantaneous turn off of the source (Kumar & Panaitescu 2000). Within this model the relation that should be satisfied is which is in agreement with our results. After the final detection at 1 ks, the X-ray light curve may start following a typical afterglow decay without violating the later upper limits, however a drop of more than three order of magnitudes in flux within the first 104 s from the trigger and before the emergence of the afterglow is uncommon to Swift GRBs. It is then possible that GRB 050412 was a burst without afterglow (a naked burst) as GRB 050421 (Godet et al. 2006).
4.2 Darkness
GRB 050410 and GRB 050412 do not have identified optical/infrared afterglows, therefore, it is worth considering how dark these bursts are. Both bursts are located in regions with moderate or small Galactic extinction ( and for GRB 050410 and GRB 050412, respectively). The available optical upper limits for GRB 050410 are too shallow for any meaningful claim, as shown in Fig. 5 where the broad band spectral energy distribution at the time of the Misra et al. (2005) optical measurement is plotted. The comparison with the X-ray flux ( computed at 11 h from the burst) indicates that it was a rather regular burst regards to its gamma-ray to X-ray ratio (see also Roming et al. 2006). However, the 2-10 keV flux computed at 1 h (2.4 10-12 erg cm-2 s-1) and at 11 h (1.9 10-13 erg cm-2 s-1) shows that this burst has a relatively faint X-ray afterglow (see Fig.4 in Roming et al. 2006).
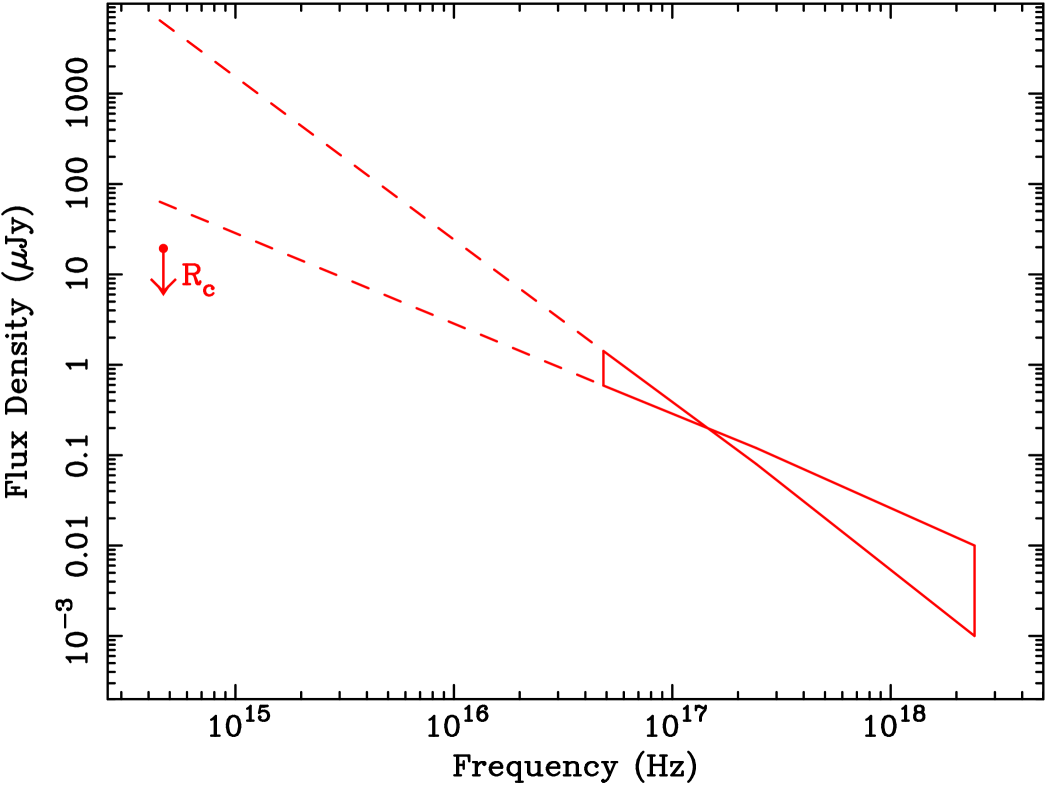
A possible interpretation of a low afterglow flux level is a low density medium (Groot et al. 1998; Frail et al. 1999; Taylor et al. 2000). Assuming that the low X-ray flux is due to a low-density circum-burst medium, we derived an estimate of the interstellar medium near the GRB under some reasonable assumptions. From the detected peak energy, , in the BAT spectrum, and using the Amati relation (Amati 2006) the values of the energy of the afterglow ( 21051 erg) and of the redshift ( 0.4) were inferred. Assuming an electron index of , taking into account the decay of the afterglow and assuming that the observing frequency is between the peak frequency and the cooling frequency , we derived cm-3. The estimate of , subject to the uncertainty on , and (which increases with and decreases with and ) is lower than the typical value of GRBs with optical afterglow ( 1 cm-3), but similar to values which have already been derived for other GRBs (Panaitescu & Kumar 2002).
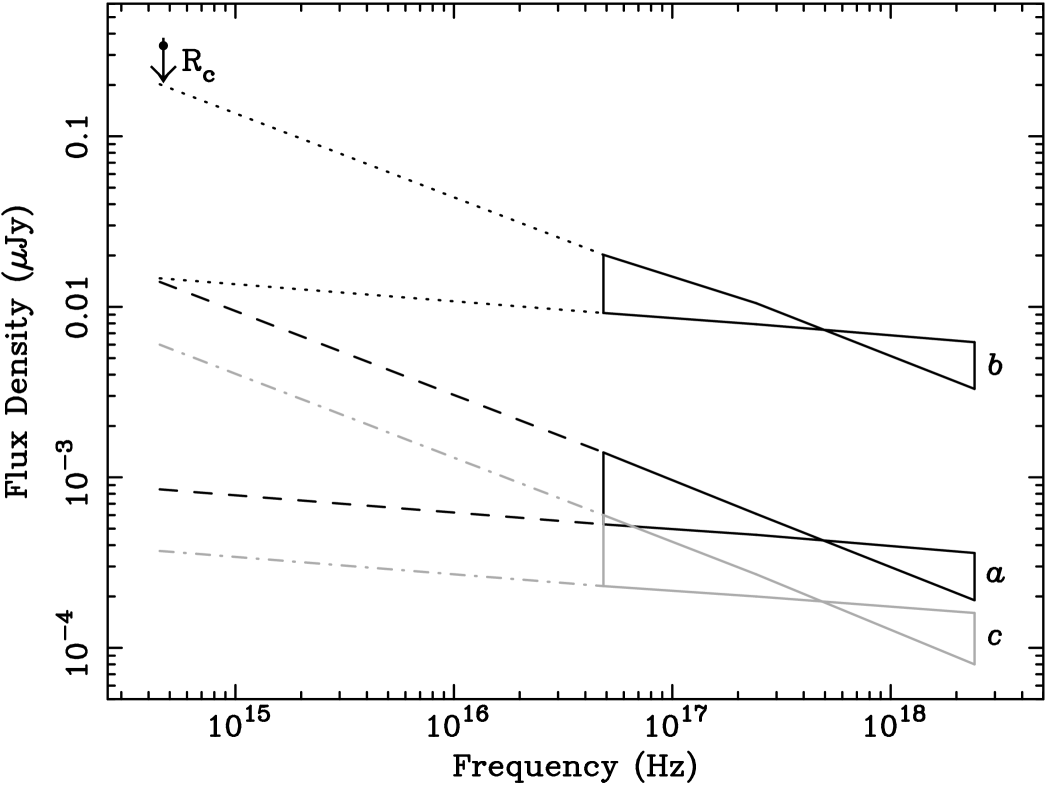
Things are considerably different in the case of GRB 050412: about 2.3 hr after the burst the optical afterglow was not detected with an upper limit of (Kosugi et al. 2005). In the Rol et al. (2005) Fig. 2 the GRB 050412 representative point would immediately classify it as a very dark burst. However, while any possible optical afterglow for this event is undoubtedly faint already at about 2 hr after the high energy event, to discuss the darkness of the burst a comparison with the detected X-ray flux is mandatory. The X-ray light curve of GRB 050412 shows a break at about 4 minutes after the burst and then a steep decay with a temporal index of about 2.8 (see Sect. 3.2). In computing the optical-to-X-ray spectral index at 11 hr after the burst,we may either assume that the optical upper limit went on fading with (as assumed in Jakobsson et al. 2004), or that the optical decay follows the X-ray light curve. In a similar way, the X-ray density flux computed at 11 hr from the burst can be evaluated from the extrapolation of the decay curve, or assuming that, at that time, the burst flux reached the level of the Chandra upper limit. The resulting optical-to-X-ray spectral index would not clearly identify this event as dark because it ranges from 0.5 to 1 depending on how the optical and X-ray flux extrapolation are performed. Of course, the brighter the extrapolated X-ray flux, the more convincing is the classification of GRB 050412 as a dark event.
Figure 6 presents the optical upper limit by Kosugi et al. (2005) at 2.3 hr from the trigger together with the X-ray spectrum computed extrapolating the XRT flux with the measured decay rate (=2.8) and assuming no spectral variation with time (see label a). In the same figure, the X-ray spectrum is also computed assuming that the flux at 2.3 hr was as high as the upper limit measured by XRT at 7 ks from the burst (see label b) and that the light curve became flat at the level of the Chandra upper limit (see label c; Berger & Fox 2005). However, we have seen in section 4.1 that the most likely interpretation of the XRT light curve of GRB 050412 is not an afterglow, but the tail of the prompt emission from curvature effect. If this is the case, the possible underlying X-ray afterglow at 2.3 hr is expected to be softer than the measured spectrum (with a photon index 2). This would make the X-ray spectra in Fig. 6 steeper, bringing the expected optical emission well above the observed upper limit, but it would not lead to a firm conclusion about the darkness of GRB 050412.
As last point, looking at Fig. 3 in Roming et al. (2006) both GRB 050410 and GRB 050412 appear fairly normal considering the X-ray flux at 1 hour compared to their prompt -ray flux.
5 Conclusion
We have presented a detailed analysis of the prompt and afterglow emission of GRB 050410 and GRB 050412 detected by Swift. For either burst no optical counterparts were detected. Results of the analysis can be summarised as follow:
-
•
The prompt emission lasted 441 s with a keV fluence of 4.60.110-6 erg cm-2 for the first burst (GRB 050410) and 271 s with a keV fluence of (6.30.3) 10-7 erg cm-2 for the second burst (GRB 050412). The keV average energy distribution of the GRB 050410 emission was fitted by a Band model with the peak energy at 53 keV and a low energy slope of 0.790.09 after fixing the high energy slope to 3. The GRB 050412 keV emission was modelled with a hard (=0.70.2) power law suggesting a peak energy above BAT energy range.
-
•
The GRB 050410 XRT light curve can be modelled with a single power law with a slope of 1.060.04. The average spectrum is reproduced by an absorbed power law with a spectral index and low energy absorption =41021 cm-2 which is higher than the galactic value.
The GRB 050412 XRT light curve follows a broken power law with the first slope =0.70.4, the break time Tbreak=254 s and the second slope =2.8. The average spectrum was fitted by a power law with a spectral index and absorbed at low energies by a column consistent with the Galactic (=2.211020 cm-2). -
•
The GRB 050410 afterglow light curve manifests the expected characteristics of the third component of the canonical Swift light curve and can be interpreted as that X-ray afterglow of a spherical fireball expanding in a uniform medium. In contrast, a rather complex phenomenology was detected in the GRB 050412 X-ray light curve because of a very early break (250 s). A possible explanation for the observed phenomenology suggests the detection of a tail of the prompt emission.
-
•
Upper limits exist for the afterglows of both bursts in the optical, and the upper limit is quite severe in the case of GRB 050412. However, neither burst can be clearly classified as a dark burst according to the definition given by Jakobsson et al. (2004). GRB 050410 has a and the suppression of the optical afterglow could be attributed to a low density of the interstellar medium surrounding the burst. For the second burst, the proper evaluation of the is quite difficult due to the ambiguity in the extrapolation of the X-ray light curve.
Acknowledgements.
This work is supported at INAF by ASI grant I/R/039/04 and by MIUR grant 2005025417, at Penn State by NASA contract NAS5-00136 and at the University of Leicester by PPARC. We gratefully acknowledge the contributions of dozens of members of the XRT and UVOT team at OAB, PSU, UL, GSFC, ASDC, and MSSL and our subcontractors, who helped make this mission possible.References
- Amati (2006) Amati, L. 2006, MNRAS, 372, 233
- Band et al. (1993) Band, D., Matteson, J., Ford, L., et al. 1993, ApJ, 413, 281
- Barthelmy et al. (2005) Barthelmy, S. D., Barbier, L. M., Cummings, J. R., et al. 2005, Space Science Reviews, 120, 143
- Beloborodov (2005) Beloborodov, A. M. 2005, ApJ, 618, L13
- Berger & Fox (2005) Berger, E. & Fox, D. B. 2005, GRB Circular Network, 3291, 1
- Berger et al. (2005) Berger, E., Morrell, N., Schmidt, B., Fox, D., & Price, P. 2005, GRB Coordinates Network, 3239, 1
- Bloom et al. (2003) Bloom, J. S., Frail, D. A., & Kulkarni, S. R. 2003, ApJ, 594, 674
- Blustin et al. (2006) Blustin, A. J., Band, D., Barthelmy, S., et al. 2006, ApJ, 637, 901
- Boyd et al. (2005) Boyd, P., Holland, S. T., Still, M., et al. 2005, GRB Circular Network, 3230, 1
- Burrows et al. (2005) Burrows, D. N., Hill, J. E., Nousek, J. A., et al. 2005, Space Science Reviews, 120, 165
- Butler (2007) Butler, N. R. 2007, AJ, 133, 1027
- Cenko & Fox (2005a) Cenko, S. B. & Fox, D. B. 2005a, GRB Coordinates Network, 3231, 1
- Cenko & Fox (2005b) Cenko, S. B. & Fox, D. B. 2005b, GRB Coordinates Network, 3242, 1
- Chevalier & Li (1999) Chevalier, R. A. & Li, Z.-Y. 1999, ApJ, 520, L29
- Covino et al. (2006) Covino, S., Malesani, D., Tagliaferri, G., et al. 2006, ArXiv Astrophysics e-prints
- Cummings et al. (2005) Cummings, J., Barbier, L., Barthelmy, S., et al. 2005, GRB Circular Network, 3237, 1
- Dai & Cheng (2001) Dai, Z. G. & Cheng, K. S. 2001, ApJ, 558, L109
- De Pasquale et al. (2003) De Pasquale, M., Piro, L., Perna, R., et al. 2003, ApJ, 592, 1018
- Dickey & Lockman (1990) Dickey, J. M. & Lockman, F. J. 1990, ARA&A, 28, 215
- Fenimore et al. (2005) Fenimore, E., Barbier, L., Barthelmy, S., et al. 2005, GRB Circular Network, 3219, 1
- Filliatre et al. (2006) Filliatre, P., Covino, S., D’Avanzo, P., et al. 2006, A&A, 448, 971
- Filliatre et al. (2005) Filliatre, P., D’Avanzo, P., Covino, S., et al. 2005, A&A, 438, 793
- Frail et al. (1999) Frail, D. A., Kulkarni, S. R., Bloom, J. S., et al. 1999, ApJ, 525, L81
- Frail et al. (2001) Frail, D. A., Kulkarni, S. R., Sari, R., et al. 2001, ApJ, 562, L55
- Frontera (2003) Frontera, F. 2003, Chinese Journal of Astronony and Astrophysics, 3, 439
- Gehrels et al. (2004) Gehrels, N., Chincarini, G., Giommi, P., et al. 2004, ApJ, 611, 1005
- Ghirlanda et al. (2004) Ghirlanda, G., Ghisellini, G., & Lazzati, D. 2004, ApJ, 616, 331
- Godet et al. (2006) Godet, O., Page, K. L., Osborne, J. P., et al. 2006, A&A, 452, 819
- Groot et al. (1998) Groot, P. J., Galama, T. J., Vreeswijk, P. M., et al. 1998, ApJ, 502, L123
- Hill et al. (2004) Hill, J. E., Burrows, D. N., Nousek, J. A., et al. 2004, in X-Ray and Gamma-Ray Instrumentation for Astronomy XIII. Edited by Flanagan, Kathryn A.; Siegmund, Oswald H. W. Proceedings of the SPIE, Volume 5165, pp. 217-231 (2004)., ed. K. A. Flanagan & O. H. W. Siegmund, 217–231
- Jakobsson et al. (2004) Jakobsson, P., Hjorth, J., Fynbo, J. P. U., et al. 2004, ApJ, 617, L21
- Kobayashi (2000) Kobayashi, S. 2000, ApJ, 545, 807
- Kobayashi et al. (2005) Kobayashi, S., Zhang, B., Meszaros, P., & Burrows, D. N. 2005, ArXiv Astrophysics e-prints astro-ph/0506157
- Kosugi et al. (2005) Kosugi, G., Kawai, N., Aoki, K., et al. 2005, GRB Circular Network, 3263, 1
- Kumar & Panaitescu (2000) Kumar, P. & Panaitescu, A. 2000, ApJ, 541, L51
- La Parola et al. (2005) La Parola, V., Mangano, V., Mineo, T., et al. 2005, GRB Circular Network, 3218, 1
- Lamb & Reichart (2000) Lamb, D. Q. & Reichart, D. E. 2000, ApJ, 536, 1
- Lazzati et al. (2002) Lazzati, D., Rossi, E., Covino, S., Ghisellini, G., & Malesani, D. 2002, A&A, 396, L5
- Mangano et al. (2005) Mangano, V., Capalbi, M., Pagani, C., et al. 2005, GRB Coordinates Network, 3253, 1
- McMahon et al. (2006) McMahon, E., Kumar, P., & Piran, T. 2006, MNRAS, 366, 575
- Meszaros & Rees (1997) Meszaros, P. & Rees, M. J. 1997, ApJ, 476, 232
- Misra et al. (2005) Misra, K., de Ugarte Postigo, A., Jelinek, M., et al. 2005, GRB Coordinates Network, 3226, 1
- Nakar & Piran (2004) Nakar, E. & Piran, T. 2004, MNRAS, 353, 647
- Nousek et al. (2006) Nousek, J. A., Kouveliotou, C., Grupe, D., et al. 2006, ApJ, 642, 389
- O’Brien et al. (2006) O’Brien, P. T., Willingale, R., Osborne, J., et al. 2006, ApJ, 647, 1213
- Ofek & Lipkin (2005) Ofek, E. O. & Lipkin, Y. 2005, GRB Coordinates Network, 3225, 1
- Panaitescu & Kumar (2002) Panaitescu, A. & Kumar, P. 2002, ApJ, 571, 779
- Preece et al. (2000) Preece, R. D., Briggs, M. S., Mallozzi, R. S., et al. 2000, ApJS, 126, 19
- Quimby et al. (2005) Quimby, R. M., Rykoff, E. S., & Schaefer, B. E. 2005, GRB Coordinates Network, 3238, 1
- Rhoads (1999) Rhoads, J. E. 1999, ApJ, 525, 737
- Rol et al. (2005) Rol, E., Wijers, R. A. M. J., Kouveliotou, C., Kaper, L., & Kaneko, Y. 2005, ApJ, 624, 868
- Romano et al. (2006) Romano, P., Moretti, A., Banat, P. L., et al. 2006, A&A, 450, 59
- Roming et al. (2005a) Roming, P., Mangano, V., Holland, S. T., et al. 2005a, GRB Circular Network, 3249, 1
- Roming et al. (2005b) Roming, P. W. A., Kennedy, T. E., Mason, K. O., et al. 2005b, Space Science Reviews, 120, 95
- Roming & Mason (2006) Roming, P. W. A. & Mason, K. O. 2006, in American Institute of Physics Conference Series, ed. S. S. Holt, N. Gehrels, & J. A. Nousek, 224–233
- Roming et al. (2006) Roming, P. W. A., Schady, P., Fox, D. B., et al. 2006, ApJ accepted (astro-ph/0509273)
- Rumyantsev et al. (2005) Rumyantsev, V., Biryukov, V., & Pozanenko, A. 2005, GRB Coordinates Network, 3229, 1
- Rykoff et al. (2006) Rykoff, E. S., Mangano, V., Yost, S. A., et al. 2006, ApJ, 638, L5
- Sari et al. (1999) Sari, R., Piran, T., & Halpern, J. P. 1999, ApJ, 519, L17
- Sari et al. (1998) Sari, R., Piran, T., & Narayan, R. 1998, ApJ, 497, L17+
- Soderberg (2005a) Soderberg, A. M. 2005a, GRB Coordinates Network, 3223, 1
- Soderberg (2005b) Soderberg, A. M. 2005b, GRB Circular Network, 3277, 1
- Soderberg et al. (2006) Soderberg, A. M., Berger, E., Kasliwal, M., et al. 2006, ApJ, 650, 261
- Taylor et al. (2000) Taylor, G. B., Bloom, J. S., Frail, D. A., et al. 2000, ApJ, 537, L17
- Taylor et al. (1998) Taylor, G. B., Frail, D. A., Kulkarni, S. R., et al. 1998, ApJ, 502, L115
- Torii (2005) Torii, K. 2005, GRB Coordinates Network, 3245, 1
- Totani (1997) Totani, T. 1997, ApJ, 486, L71
- Tueller et al. (2005) Tueller, J., Barbier, L., Barthelmy, S., et al. 2005, GRB Circular Network, 3251, 1
- Uhm & Beloborodov (2006) Uhm, Z. & Beloborodov, A. M. 2006, in American Institute of Physics Conference Series, ed. S. S. Holt, N. Gehrels, & J. A. Nousek, 189–192
- Wijers et al. (1998) Wijers, R. A. M. J., Bloom, J. S., Bagla, J. S., & Natarajan, P. 1998, MNRAS, 294, L13
- Willingale et al. (2006) Willingale, R., O’Brien, P. T., Osborne, J. P., et al. 2006, ArXiv Astrophysics e-prints
- Zhang et al. (2006) Zhang, B., Fan, Y. Z., Dyks, J., et al. 2006, ApJ, 642, 354
- Zhang & Kobayashi (2005) Zhang, B. & Kobayashi, S. 2005, ApJ, 628, 315