H.E.S.S. Observations of the Binary System PSR B1259-63/LS 2883 around the 2010/2011 Periastron Passage
Abstract
Aims. In this paper we present very high energy (VHE; GeV) data from the -ray binary system PSR B1259-63/LS 2883 taken around its periastron passage on 15th of December 2010 with the High Energy Stereoscopic System (H.E.S.S.) of Cherenkov Telescopes. We aim to search for a possible TeV counterpart of the GeV flare detected by the Fermi LAT. In addition, we aim to study the current periastron passage in the context of previous observations taken at similar orbital phases, testing the repetitive behavior of the source.
Methods. Observations at VHE were conducted with H.E.S.S. from 9th to 16th of January 2011. The total dataset amounts to h of observing time. The data taken around the 2004 periastron passage were also re-analysed with the current analysis techniques in order to extend the energy spectrum above 3 TeV to fully compare observation results from 2004 and 2011.
Results. The source is detected in the 2011 data at a significance level of revealing an averaged integral flux above 1 TeV of cm-2s-1. The differential energy spectrum follows a power-law shape with a spectral index and a flux normalisation at 1 TeV of . The measured lightcurve does not show any evidence for variability of the source on the daily scale. The re-analysis of the 2004 data yields results compatible with the published ones. The differential energy spectrum measured up to TeV is consistent with a power law with a spectral index and a flux normalisation at 1 TeV of .
Conclusions. The measured integral flux and the spectral shape of the 2011 data are compatible with the results obtained around previous periastron passages. The absence of variability in the H.E.S.S. data indicates that the GeV flare observed by Fermi LAT in the time period covered also by H.E.S.S. observations originates in a different physical scenario than the TeV emission. Additionaly, new results compared to those obtained in the observations which were performed in 2004 at a similar orbital phase, further support the hypothesis of the repetitive behavior of the source.
Key Words.:
Gamma-rays: observations – pulsars: individual (PSR B1259-63) – X-ray: binaries – Be - stars: individual (LS 2883)Mathieu de Naurois
1 Introduction
The class of very high energy (VHE; GeV) -ray binaries comprises only a handful of known objects in our Galaxy: LS 5039 (Aharonian et al. 2005a), LS I +61 303 (Albert et al. 2006), PSR B1259-63/LS 2883 (Aharonian et al. 2005b) and HESS J0632+057 (Aharonian et al. 2007), the first binary primarily discovered at TeV energies. This class can be extended by two more candidates: Cygnus X-1 (Albert et al. 2007), a stellar-mass black hole binary detected at VHEs at the 4.1 significance level, and HESS J1018-589 (HESS Collaboration et al. 2012) which shows a point-like component spatially coincident with the GeV binary 1FGL J1018.6-5856 discovered by the Fermi LAT collaboration (Abdo et al. 2010). Only for the source presented in this paper, PSR B1259-63/LS 2883, the compact companion is well identified as a pulsar, making it a unique object for the study of the interaction between pulsar and stellar winds and the emission mechanisms in such systems.
PSR B1259-63/LS 2883 was discovered in a high-frequency radio survey devoted to the detection of young, distant and short-period pulsars (Johnston et al. 1992a, b). It consists of a rapidly rotating pulsar with a spin period of ms and a spin-down luminosity of erg/s in a highly eccentric () orbit around a massive Be star. The pulsar moves around the companion with a period years (1237 days).
Latest optical observations with VLT UT2 (Negueruela et al. 2011) significantly improved the previously known parameters of the companion star LS 2883. The luminosity of the star is erg s-1. Because of its fast rotation, the star is oblate with an equatorial radius of and a polar radius of . This leads to a strong gradient of the surface temperature from at the equator to at the poles. The mass function of the system suggests a mass of the star and an orbital inclination angle for the minimal neutron star mass of . The optical observations also suggest that the system is located at the same distance as the star association Cen OB1 at kpc (Negueruela et al. 2011). The companion Be star features an equatorial disk which is believed to be inclined with respect to the pulsar’s orbital plane (Johnston et al. 1992a; Melatos et al. 1995; Negueruela et al. 2011) in a way that the pulsar crosses the disk twice in each orbit just before ( days) and just after ( days) the periastron.
Since its discovery in 1992, PSR B1259-63/LS 2883 is constantly monitored by various instruments at all energy bands. The source shows broadband emission and is visible from radio wavelengths up to the VHE regime. The properties of the radio emission differ depending on the distance between the pulsar and the star. Radio observations (Johnston et al. 1999; Connors et al. 2002; Johnston et al. 2005) show that when the pulsar is far from the periastron the observed radio emission consists only of the pulsed component, whose intensity is almost independent on the orbital position. But closer to the periastron, starting at about d, where is the time of periastron, the intensity starts to decrease up to the complete disappearance approximately at d. This is followed by an eclipse of the pulsed emission for about 35-40 days as the pulsar is behind the disk. In contrast, a transient unpulsed component appears and sharply rises to a level more than 10 times higher than the flux density of the pulsed emission far from the periastron. The unpulsed component is believed to come from synchrotron radiation generated in the shocked wind zone between the relativistic pulsar wind and the stellar disk outflow. After the disk crossing the unpulsed emission shows a slight decrease with another increase around d at the second crossing of the disk. Radio observations around the 2007 periastron passage showed extended unpulsed emission with a total projected extent of AU and the peak of the emission clearly displaced from the binary system orbit (Moldón et al. 2011). This indicates that a flow of synchrotron-emitting particles, which can travel far away from the system, can be produced in PSR B1259-63/LS 2883. The source was also monitored around the 2010 periastron passage. The pulsed radio emission was monitored with Parkes telescope revealing an eclipse of the pulsed signal lasting from d to 15 d. Radio emission from PSR B1259-63 at frequencies between 1.1 and 10 GHz was observed using the ATCA array in the period from d to d. The detected unpulsed emission around the periastron passage showed a behaviour similar to the one observed during previous observations (Abdo et al. 2011).
PSR B1259-63/LS 2883 is very well covered by X-ray observations carried out with various instruments like ROSAT (Cominsky et al. 1994), ASCA (Kaspi et al. 1995; Hirayama et al. 1999), INTEGRAL (Shaw et al. 2004) and XMM-Newton (Chernyakova et al. 2006). The periastron passage in 2007 was monitored at the same time by Suzaku, Swift, XMM-Newton and Chandra (Chernyakova et al. 2009). Observations around the 2010 periastron passage were performed by three instruments: Swift, Suzaku and XMM-Newton (Abdo et al. 2011). Observations confirmed the 1-10 keV lightcurve shape obtained in previous periastron observations, showing a rapid X-ray brightening starting at about d with a subsequent decrease closer to periastron and a second increase of the X-ray flux after periastron (Abdo et al. 2011). X-ray observations did not show any X-ray pulsed emission from the pulsar. Unpulsed non-thermal radiation from the source appeared to be variable in flux and spectral index. Similarly to radio measurements, the enhancement of the flux occurs shortly before and shortly after the periastron. Unambiguously, the enhancement of the non-thermal emission results from the interactions of the pulsar wind with the circumstellar disk close to the periastron passage.
PSR B1259-63/LS 2883 was observed by H.E.S.S. around the periastron passages in 2004 (Aharonian et al. 2005b) and 2007 (Aharonian et al. 2009), leading to a firm detection on both occasions. In 2004, PSR B1259-63/LS 2883 was observed mostly after the periastron, while in 2007 mostly before it. Therefore, the repetitive behaviour of the source, i.e. the recurrent appearance of the source near periastron at the same orbital phase, with the same flux level and spectral shape of the emission, was not precisely confirmed, since the observations covered different orbital phases. However, the similar dependence of the flux on the separation distance between the pulsar and the star for both periastron passages provides a strong hint of the repetitive behavior (Kerschhaggl 2011). PSR B1259-63/LS 2883 was not detected in observations performed far from periastron in 2005 and 2006, which comprised h and h of exposure respectively.
Observations around 2004 and 2007 periastron passages showed a variable behaviour of the source flux with time. A combined lightcurve of those two periastron passages reveals a hint of two asymmetrical peaks around periastron with a significant decrease of the flux at the periastron itself. Peaks of the TeV emission roughly coincide with the flux enhancement observed in other wavebands as well as with the eclipse of the pulsed radio emission, which indicates the position of the circumstellar disk. This coincidence suggests that the TeV emission from PSR B1259-63/LS 2883 may be connected to the interaction of the pulsar with the disk.
2 Fermi-LAT detection of a post-periastron HE flare
H.E.S.S. observations around the most recent periastron passage which took place on 15th of December 2010 were performed as part of an extended multiwavelength (MWL) campaign including also radio, optical, X-ray and, for the first time, high energy (HE; MeV) observations. This paper is dedicated for the study of the H.E.S.S. results in the context of the HE observations. The detailed study of the MWL emission from the source will be presented in the joint MWL paper which is currently in preparation.
Observations of the binary system PSR B1259-63/LS 2883 at HEs were performed using the Large Area Telescope (LAT) on board of Fermi. The data taken around the periastron passage were analysed by two independent working groups (Abdo et al. 2011; Tam et al. 2011), yielding similar results for the flaring period (see below), although there are some discrepancies related to the first detection period close to the periastron passage. Those differences do not affect however the conclusions drawn in this paper. The source was detected close to periastron with a very low photon flux above 100 MeV of about cm-2s-1. After the initial detection, the flux decreased and the source was below the detection threshold until 14th of January, d, when a spectacular flare was detected which lasted for about 7 weeks with an average flux times higher than the flux detected close to the periastron (Abdo et al. 2011). The highest day-averaged flux during the flare almost reached the estimate of the spin-down luminosity of the pulsar, which indicates a close to 100% efficiency of the conversion of the pulsar’s rotational energy into -rays. The HE emission around the periastron as a function of time significantly differs from the two-peak lightcurves observed in other wavebands. The flare is not coincident with the post-periastron peak in radio, X-rays, and VHE -rays. It is also much brighter in comparison to the first detection of GeV emission close to the periastron passage (Abdo et al. 2011; Tam et al. 2011).
3 H.E.S.S. Observations and Analysis
3.1 The H.E.S.S. Instrument
H.E.S.S. (High Energy Stereoscopic System) is an array of four 13 m diameter imaging atmospheric Cherenkov telescopes located in the Khomas Highland, Namibia at an altitude of 1800 m above sea level (Hinton 2004). The telescopes are optimized for the detection of VHE -rays in the range from 100 GeV to several tens of TeV by imaging Cherenkov light emitted by charged particles in Extensive Air Showers. The total field of view of H.E.S.S. is . The angular resolution of the system is and the average energy resolution is about . The H.E.S.S. array is capable of detecting point sources with a flux of of the Crab nebula flux at a significance level of in 25 hours when observing at low zenith angles (Aharonian et al. 2006).
3.2 Data Set and Analysis Techniques
PSR B1259-63/LS 2883 observations were scheduled to cover the post-periastron period from January to March 2011. The source was not visible for H.E.S.S. before and at the periastron passage. The observations resulted in a rather small dataset due to unfavorable weather conditions. The collected data correspond to 6 h of livetime after the standard quality selection procedure (Aharonian et al. 2006). These data were taken in five nights, namely January 9/10, 10/11, 13/14, 14/15 and 15/16. The observations were performed at a relatively high average zenith angle of 48∘ and with a mean offset angle of 0.55∘ from the test region centered at , (Wang et al. 2004).
The data were analysed using the model analysis111ParisAnalysis software version 0-8-18. technique with standard cuts (de Naurois & Rolland 2009). The test region was a priori defined as a circle with radius 0.1∘ (i.e. , where is defined as the angular distance between the -ray event and the nominal target position) which is the standard size for point-like sources. The Reflected Region Background technique was used for the background subtraction. The analysis results were cross-checked with an alternative analysis chain222H.E.S.S. Analysis Package (HAP) version 11-02-pl04. using a standard Hillas reconstruction (Aharonian et al. 2006) method for /hadron separation and an independent calibration of the raw data. Both analysis chains yielded consistent results.
[b]
| Dataset | Livetime [h] | Significance [] | [] | Flux( TeV) | |||||
|---|---|---|---|---|---|---|---|---|---|
| [ cm-2s-1] | |||||||||
| Full | 6.2 | 112 | 365 | 0.077 | 84.0 | 11.5 | |||
| Pre-flare | 2.65 | 44 | 133 | 0.076 | 33.9 | 7.4 | |||
| Flare | 3.59 | 68 | 232 | 0.077 | 50.1 | 8.5 |
3.3 Energy Spectrum
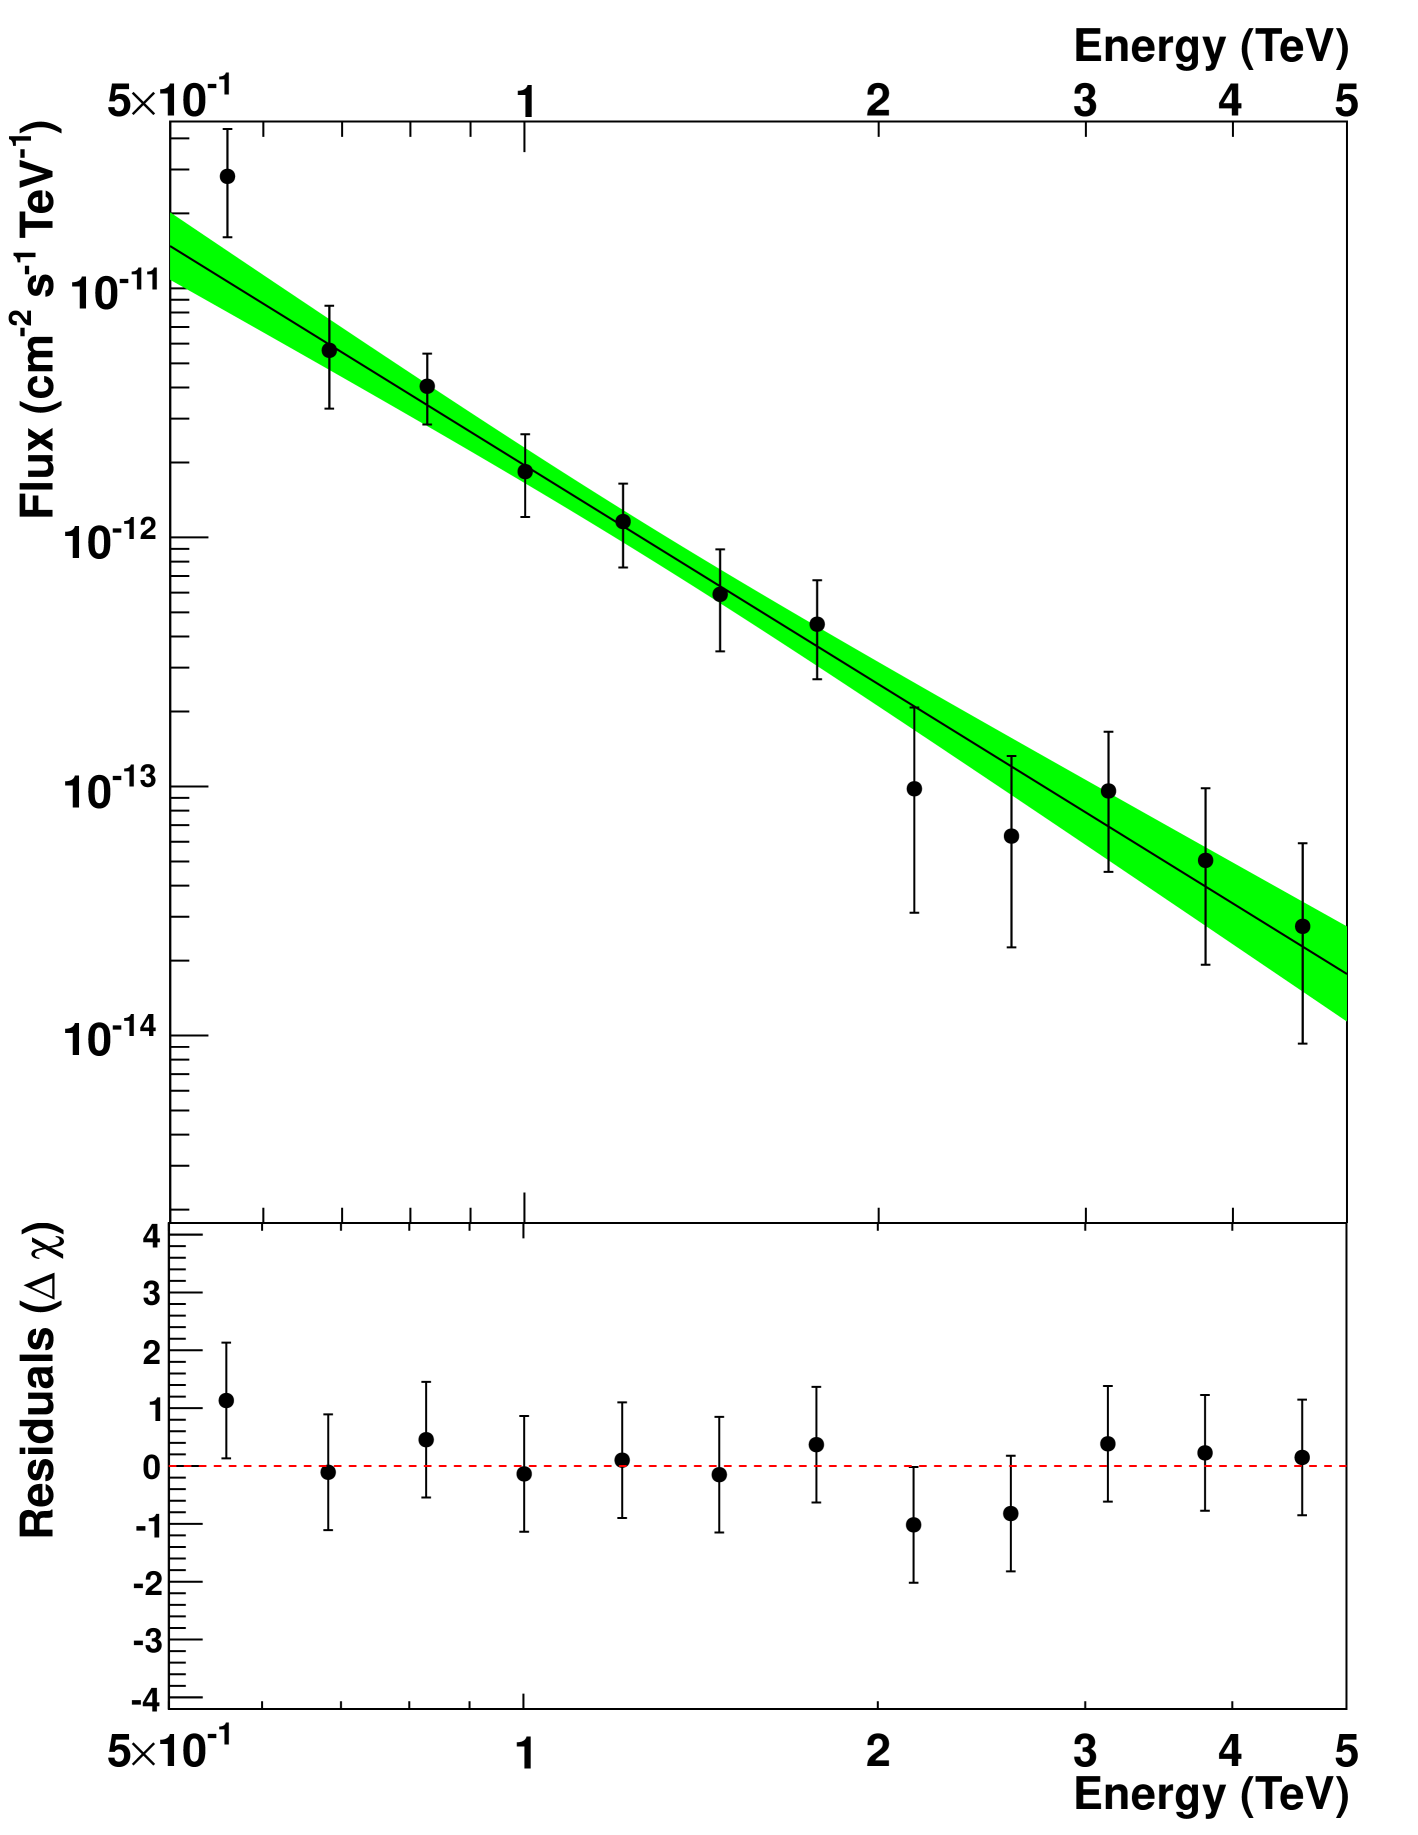
The source was detected at a 11.5 level (Li & Ma 1983) (see Table 1). A spectral analysis of the detected excess events shows that the differential energy spectrum of photons is consistent with a simple power law with a flux normalisation at 1 TeV of and a spectral index (see Fig. 1 and Table 1) with a fit probability of 0.64. The integral flux above 1 TeV averaged over the whole observation period is cm-2s-1.
3.4 Lightcurves
In order to check for variability of the source a lightcurve has been produced on a night-by-night basis assuming the photon spectral index obtained in the spectral fit (Fig. 2). The spectral index was fixed at the value obtained in the spectral analysis of the total data because of the low statistics for each individual night. The lightcurve is consistent with a constant resulting in a mean flux of cm-2s-1 (horizontal line in Fig. 2) with (probability of 0.17) yielding no evidence for variability in the 7-night observation period. For each individual night the source is detected at a statistical significance level except the last point which significance is only .
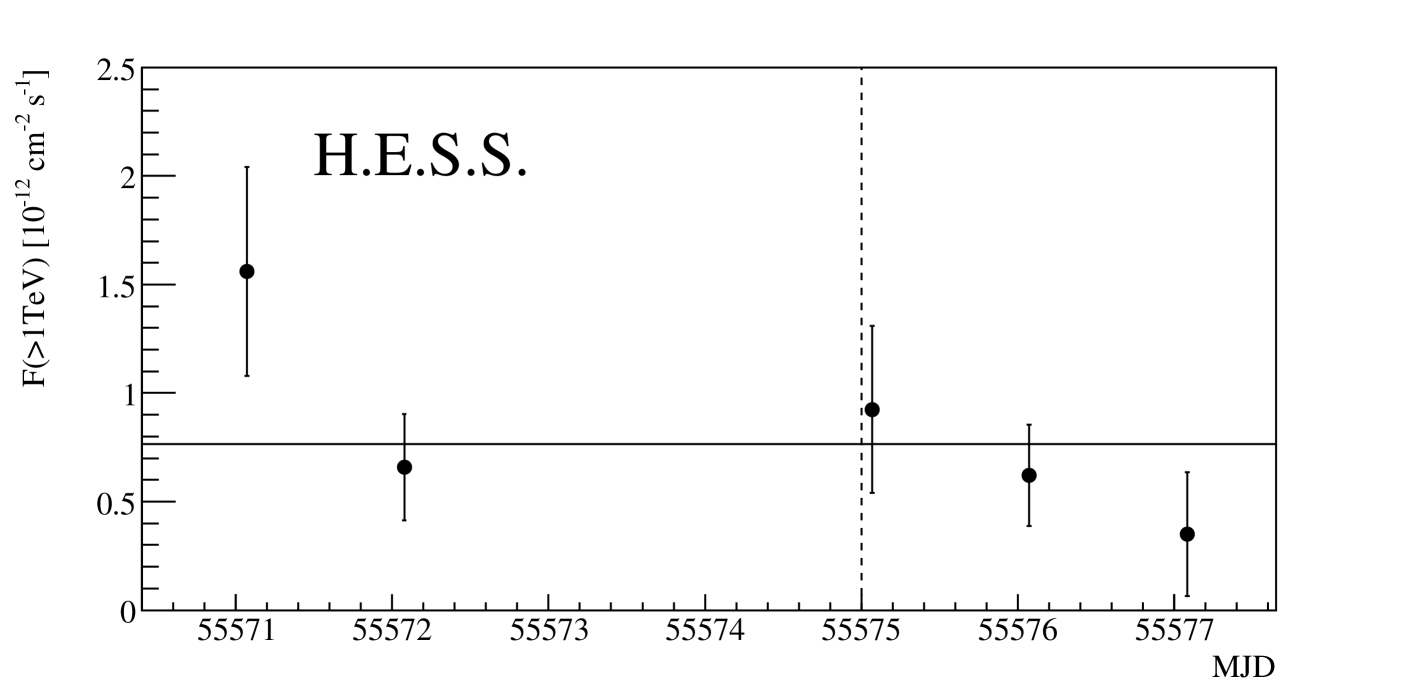
For a comparison with the GeV flare (see Section 4.2) the whole dataset was divided into two datasets: ”pre-flare” ( d to d) and ”flare” ( d to d). These two datasets were analysed independently revealing similar fluxes and significance levels (see Table 1). A spectral analysis of the two datasets shows that both spectra are consistent with a simple power law, yielding similar values of the spectral index (see Table 1). Both spectral indices are consistent with the one obtained for the total dataset. These results are discussed in Section 4.2.
3.5 Re-analysis of the 2004 Data
For the data taken around the 2004 periastron passage the energy spectrum had been measured only up to TeV (Aharonian et al. 2005b) while for the much smaller dataset of 2011 observations the spectrum was measured up to TeV and for the comparable dataset of 2007 observations up to TeV (Aharonian et al. 2009) using more advanced analysis techniques with a better understanding of weak fluxes. In order to fully compare observation results around different periastron passages (see below), the 2004 data were re-analysed with the current analysis techniques, the same as used for the analysis of the 2011 data described above. The re-analysis results are compatible with the published ones. The differential energy spectrum measured up to TeV is consistent with a power law with a spectral index and a flux normalisation at 1 TeV of . The new analysis of the 2004 data is therefore compatible with the published results when extrapolated above 3 TeV.
4 Discussion
4.1 Comparison with Previous H.E.S.S. Observations
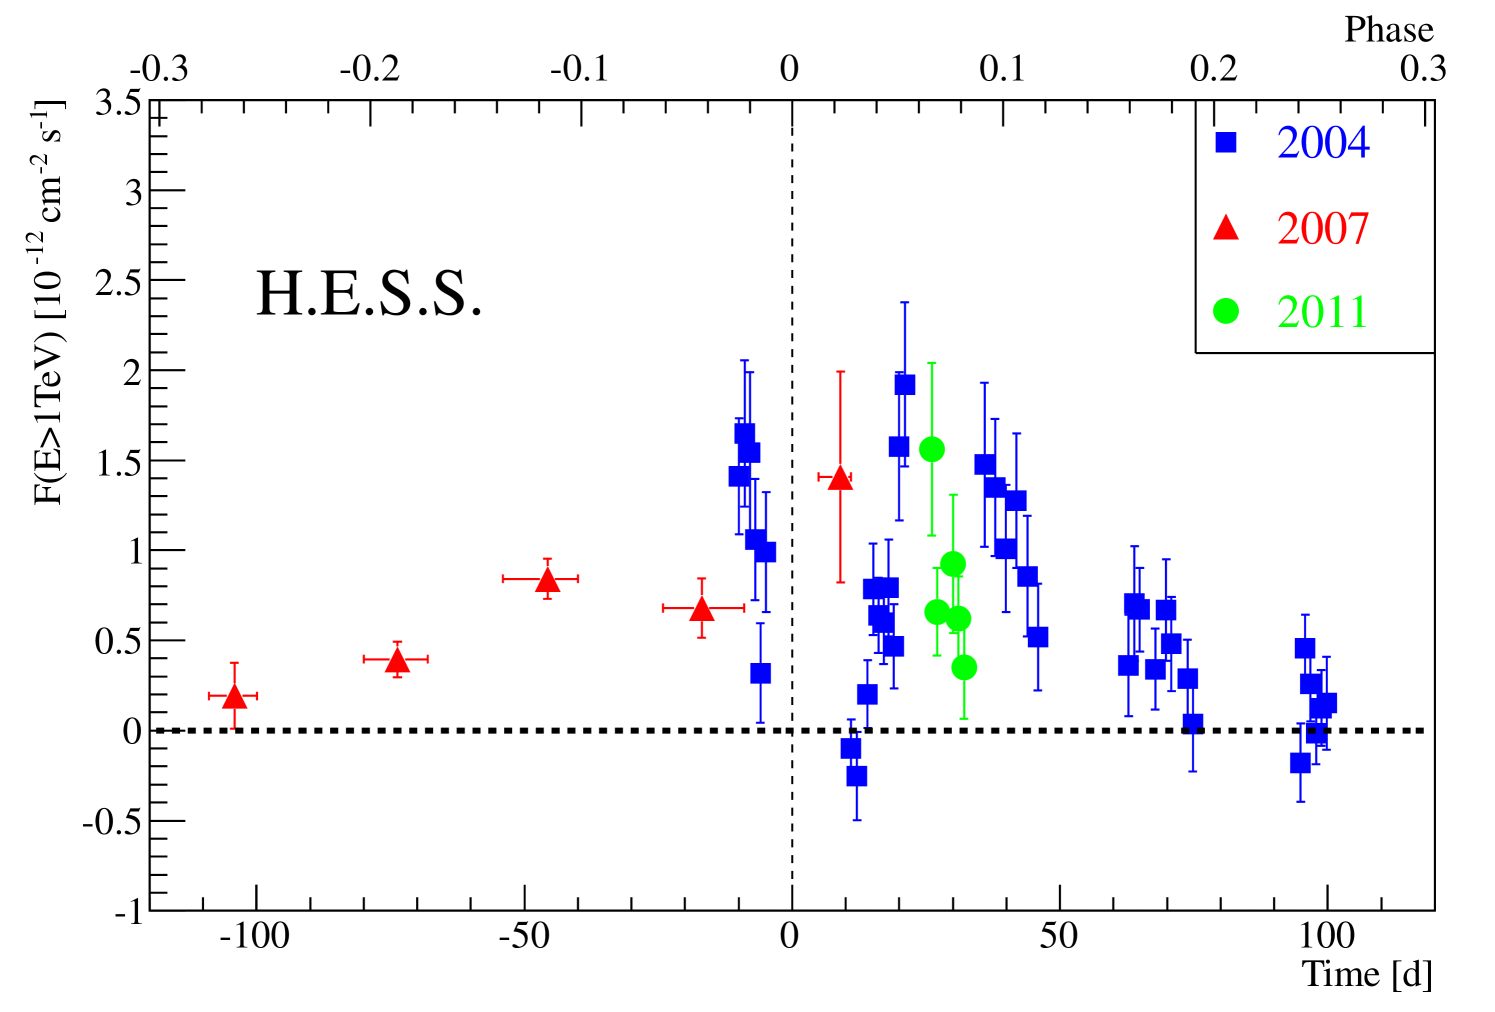
In Fig. 3, the integrated photon flux above 1 TeV as a function of time with respect to periastron (indicated by the dashed vertical line) is shown. The lightcurve compiles the data from all three periastron observation campaigns spanning from 100 days before to 100 days after the periastron. The observed flux from the 2010/2011 observation campaign is compatible with the flux detected in 2004 at the similar orbital phases. Observation periods from 2004 and 2007 were separated in time with respect to the periastron position, i.e. observations in 2004 were performed mainly after and in 2007 mainly before the periastron. Therefore, it was impossible to directly confirm the repetitive behaviour of the source by comparing observations of PSR B1259-63/LS 2883 at the same orbital phases. In this perspective, although the 2011 observations do not exactly overlap with the orbital phases of previous studies, they cover the gap in the 2004 data post-periastron lightcurve and the integrated flux follows the shape of the lightcurve yielding a stronger evidence for the repetitive behaviour of the source.
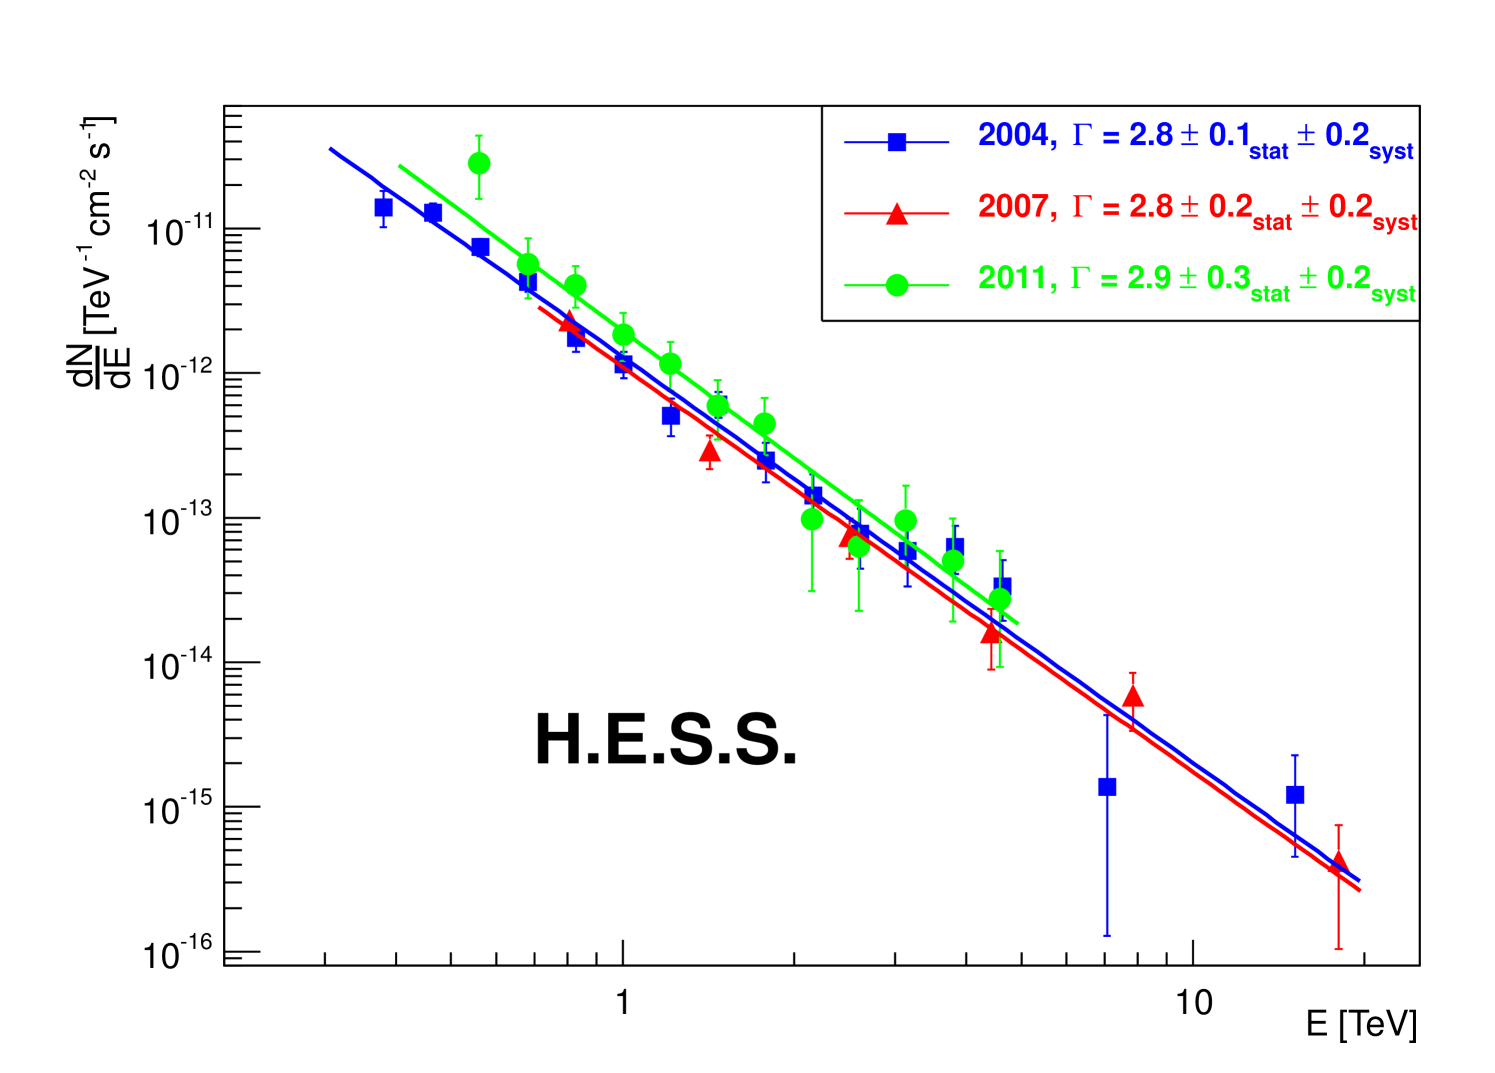
The spectral shape of the VHE -ray emission from PSR B1259-63/LS 2883 around the 2010/2011 periastron passage is similar to what was observed during previous periastron passages (Fig. 4). The photon index of inferred from the 2011 data is well compatible with previous results. The spectrum measured for the 2011 data can be resolved only up to TeV, which is explained by a very low statistics at higher energies due to a short exposure of the source.
4.2 Search for the equivalent ”GeV Flare” in the H.E.S.S. data
The absence of the flux enhancement during the GeV flare at radio and X-ray wavebands indicates that the GeV flare may be created by different physical processes from the ones responisble for the emission at other wavelengths. The VHE post-periastron data obtained with H.E.S.S. around the 2004 periastron passage do not show any evidence of a flux outburst at orbital phases at which the GeV flare is observed. However, the H.E.S.S. observations around the 2004 periastron passage do not comprise the orbital phase when the GeV flare starts. Also, in order to compare H.E.S.S. 2004 data with the GeV flare observed after the 2010 periastron passage, one has to assume that the GeV flare is a periodic phenomenon which may not be the case. The H.E.S.S. data taken between 9th and 16th of January in 2011 provide a three-day overlap in time with the GeV flare. Therefore, it is possible to directly study any flux enhancement in the VHE band on the timescale of the HE flare. In order to improve the sensitivity of the variability search the whole period of the H.E.S.S observations was divided into two time periods of almost equal length: before (”pre-flare”) and during (”flare”) the HE flare (see Section 3.4). The pre-flare and flare datasets analysis results are presented in Table 1.
In order to search for variability, the flux as a function of time was fitted with a constant resulting in a mean flux of cm-2s-1 (black horizontal dashed line in Fig. 5 (Top)). The fit has a to NDF ratio of which corresponds to a probability of 0.39, showing no indication for a flux enhancement. Note that the spectral parameters obtained by an independent fit of each of the two periods have been used here.
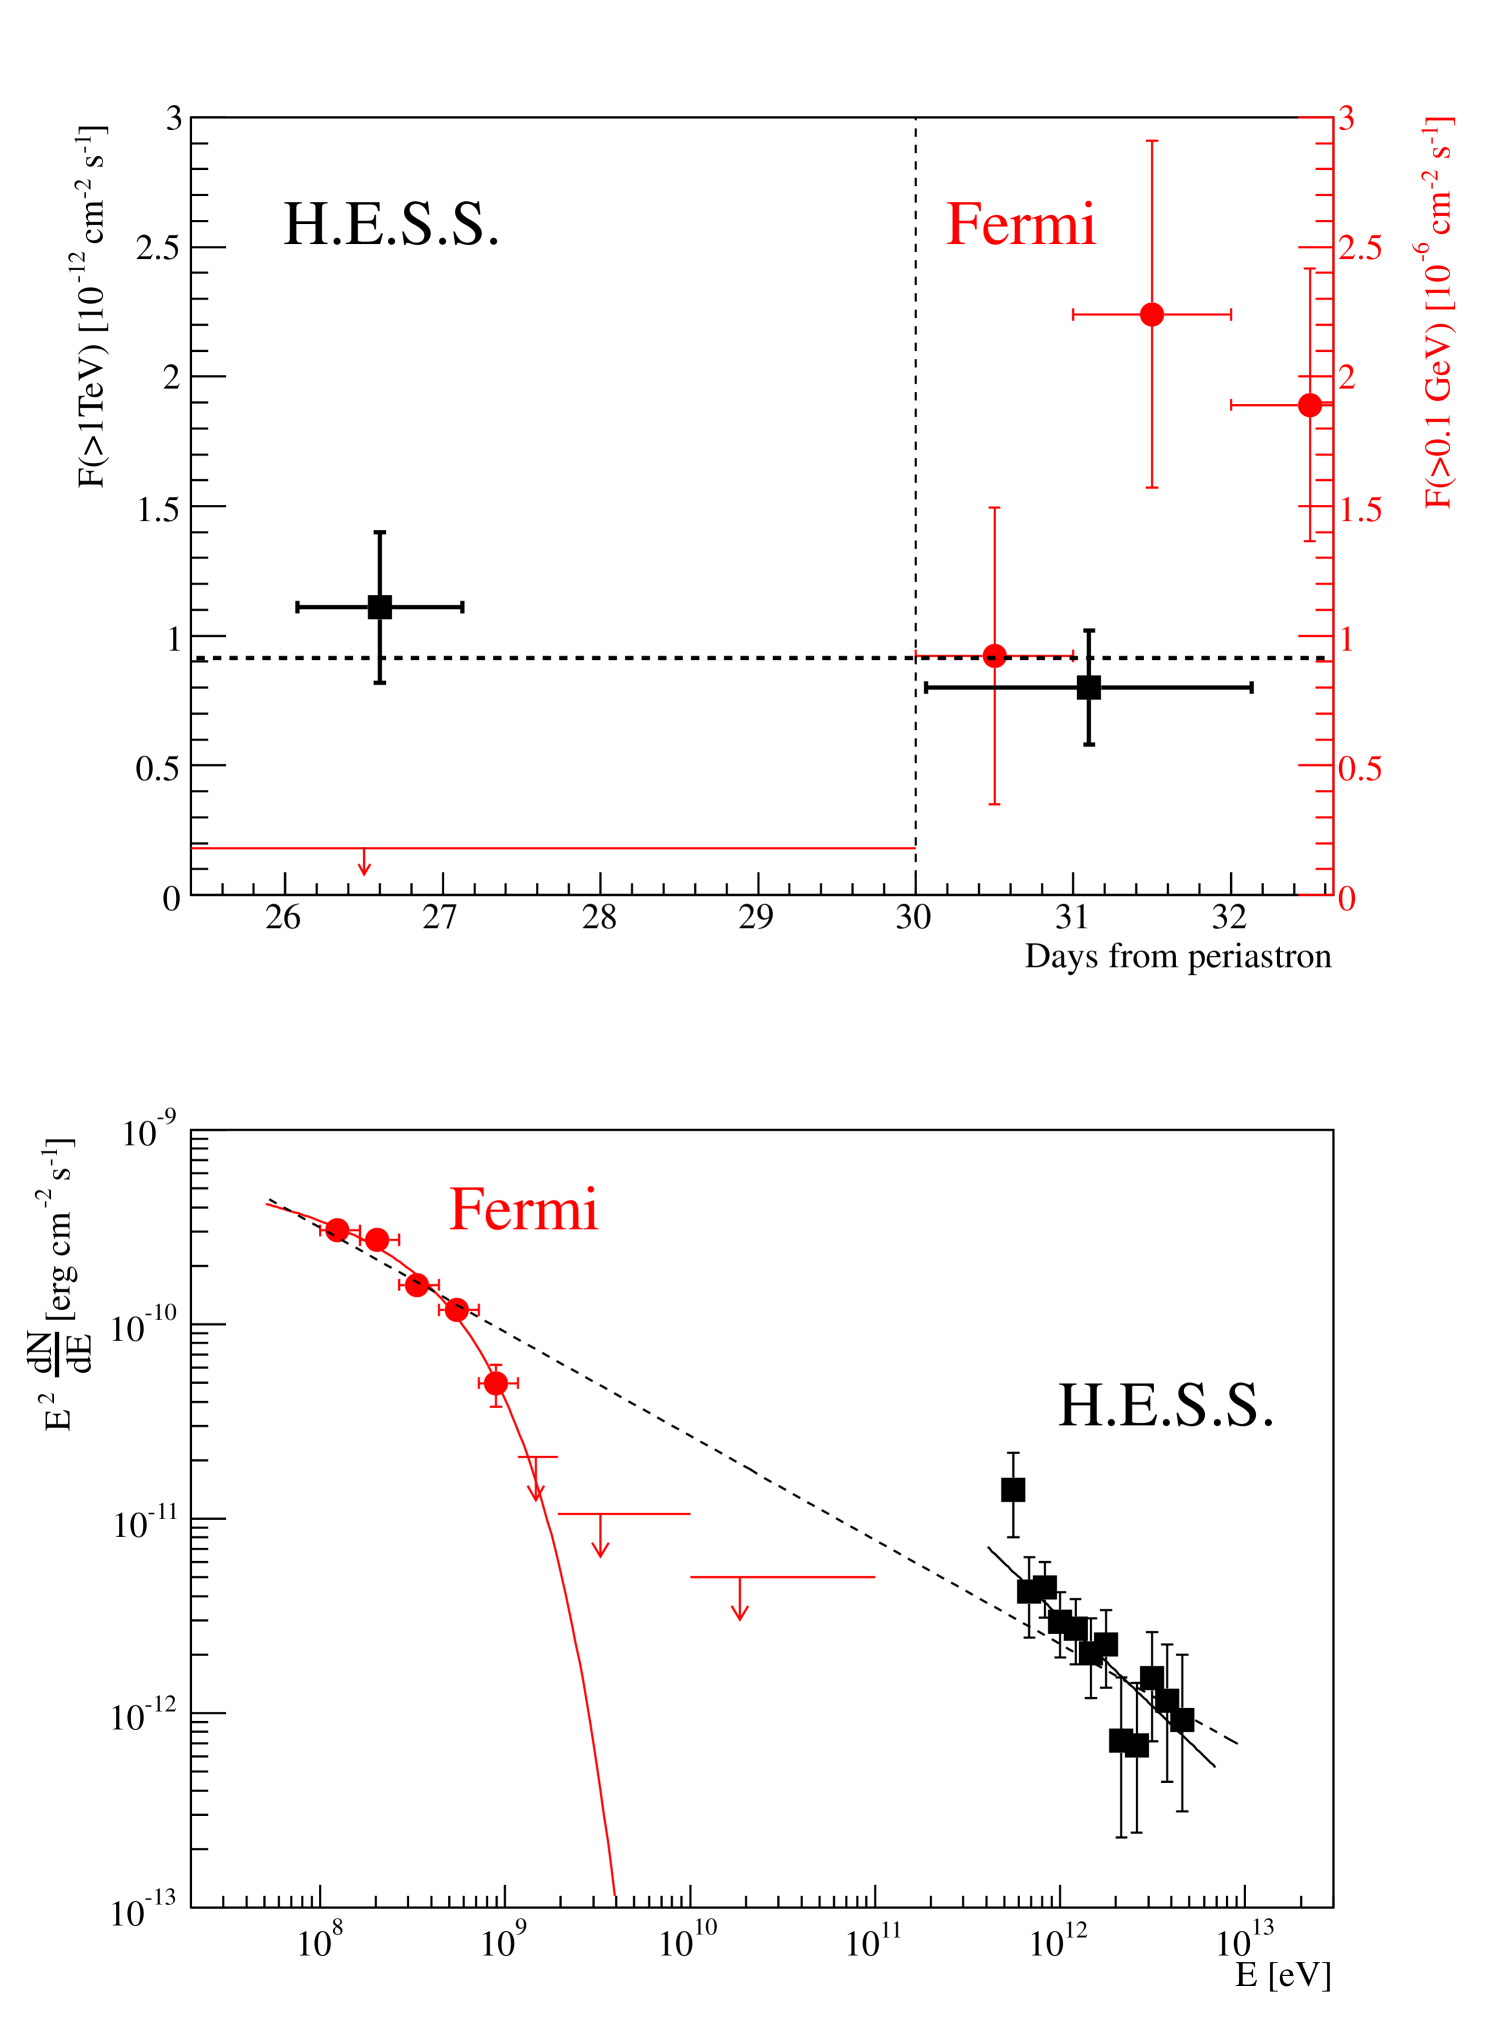
If one assumes that HE and VHE emission are created in the same scenario, i.e. the same acceleration and radiation processes and sites, then a flux enhancement of the same magnitude as observed at HEs should be also seen at VHEs. In order to investigate this hypothesis, the flare coefficient is introduced as the ratio of the fluxes during the flare period and the pre-flare period. The ratio of the HE ( GeV) flux averaged over the three days interval between and to the upper limit on the HE pre-flare emission (see Fig. 5 (Top)) yields a lower limit on the HE emission flare coefficient . An upper limit on the VHE flare coefficient can be estimated using the profile likelihood method. The likelihood function is defined as a product of two Gaussian distributions of the pre-flare and flare flux measurements and correspondingly, stating that the flare measurement varies around , where the tilde denotes the true value for a parameter. The profile likelihood is then built as a function of :
| (1) |
where the hat denotes the maximum likelihood estimate for a parameter. The variable follows a distribution with 1 degree of freedom, which allows to calculate the 99.7 % confidence level (equivalent of 3) upper limit of . The obtained upper limit is lower than the observed lower limit on .
The statistical tests presented above give two main results:
-
•
A flare of similar magnitude as observed in the HE band can be firmly rejected in the VHE band at the same orbital phase.
-
•
There is no significant difference between the pre-flare and the flare flux in the VHE band.
These two results suggest that the HE flare emission has a different nature than the VHE emission.
This conclusion is also further supported by the inconsistency of HE and VHE emission spectra (see Fig. 5 (Bottom)). The joint fit of the Fermi and H.E.S.S. data points with the simple power law (the dashed line on Fig. 5 (Bottom)) results in a fit probability of 0.004 and, hence, fails to explain the combined HE/VHE emission even ignoring Fermi upper limits which cannot be taken into account in the fit procedure. Moreover, the Fermi upper limits at GeV violate any reasonable model to explain the HE and VHE emission together. The Fermi spectrum alone is consistent with the the power law with exponential cut-off with the index , the cut-off energy of GeV and the normalisation erg cm-2 s-1. The fit probability is 0.27.
Several models have been proposed to explain the VHE emission from the source. In a hadronic scenario, the VHE -ray emission could be produced in the interaction of the ultrarelativistic pulsar wind particles with the dense equatorial disk outflow with subsequent production of pions and hence VHE -rays (Kawachi et al. 2004; Neronov & Chernyakova 2007). However, the detection of the source before the expected disk passage in 2007 put the hadronic scenario under doubt, suggesting that the VHE emission should be created at least partly by leptonic processes (Aharonian et al. 2009). Within the leptonic scenario, VHE emission from PSR B1259-63/LS 2883 is explained by the inverse Compton (IC) scattering of shock-accelerated electrons on stellar photons (Tavani & Arons 1997; Kirk et al. 1999; Dubus 2006; Khangulyan et al. 2007).
Few possible explanations for the nature of the HE flare are discussed in the literature. One of them suggested by Khangulyan et al. (2012) is based on IC scattering of the unshocked pulsar wind on the stellar and circumstellar disk photons. While the pulsar is inside the disk the IC scattering of the unshocked pulsar wind is supressed due to the high ram pressure. But right after the pulsar escapes the disk in the post-periastron phase the unshocked pulsar wind zone towards the observer increases significantly, while the density of the circumstellar disk photons is still high enough for the efficient IC scattering. Therefore, the enhancement of the HE flux is observed. This is not expected in the pre-periastron phase because the termination shock should expand towards the direction opposite to the observer. This model also predicts the difference between the HE and VHE emission, the latter expected to result from the upscattering of the stellar photons by the electrons accelerated at the termination shock between pulsar and stellar winds. Another explanation of the HE flare can be the Doppler boosting of the radiation created by the shocked pulsar wind (Bogovalov et al. 2008; Dubus et al. 2010; Kong et al. 2012). It is unclear though why the flare is not detected at other wavebands, since the Doppler boosting should enhance also X-ray and VHE -ray fluxes. This issue, however, can be resolved assuming a specific anisotropy of the pulsar wind and the difference of the emission behavior in different regions of the termination shock, the isotropic emission in the apex and the beamed emission in the tail of the shock (Kong et al. 2012). In this particular case the HE flare is explained by the Doppler boosting of the synchrotron emission. Abdo et al. (2011) suggested that the flare can also be explained by an anisotropy of the pulsar wind and/or stellar material. The anisotropy of electrons with the highest energies would cause an anisotropy of the synchrotron radiation at high energies. In this interpretation, the HE emission is produced by the synchrotron mechanism. The local increase of the stellar wind density would increase the Bremsstrahlung component which may also cause the HE flare. Regardless of which mechanism is responsible for the HE flare, the fact that it is observed only after the periastron indicates either a strong dependency of the HE emission on the geometry of the system, i.e. its configuration with respect to the direction to the observer, or some local perturbation of the stellar material. A detailed interpretation of the HE-VHE emission is beyond the scope of this paper and will be discussed in the joint MWL paper.
5 Summary
The binary system PSR B1259-63/LS 2883 was monitored by H.E.S.S. around the periastron passage on 15th of December 2010. The observed flux and spectral shape are in good agreement with what was measured during previous periastron passages. The observations were performed at similar orbital phases as around the 2004 periastron passage, strengthening the evidence for the repetitive behaviour of the source at VHEs.
H.E.S.S. observations were part of a joint MWL campaign including also radio, optical, X-ray and HE observations. A spectacular flare observed at HEs with Fermi LAT overlapped in time with the H.E.S.S. observations. A careful statistical study showed that the HE flare does not have a counterpart at VHEs, indicating that the HE and VHE emissions are produced in different physical scenarios.
Acknowledgements.
The support of the Namibian authorities and of the University of Namibia in facilitating the construction and operation of H.E.S.S. is gratefully acknowledged, as is the support by the German Ministry for Education and Research (BMBF), the Max Planck Society, the French Ministry for Research, the CNRS-IN2P3 and the Astroparticle Interdisciplinary Programme of the CNRS, the U.K. Particle Physics and Astronomy Research Council (PPARC), the IPNP of the Charles University, the South African Department of Science and Technology and National Research Foundation, and by the University of Namibia. We appreciate the excellent work of the technical support staff in Berlin, Durham, Hamburg, Heidelberg, Palaiseau, Paris, Saclay, and in Namibia in the construction and operation of the equipment.References
- Abdo et al. (2010) Abdo, A. A., Ackermann, M., Ajello, M., et al. 2010, ApJS, 188, 405
- Abdo et al. (2011) Abdo, A. A., Ackermann, M., Ajello, M., et al. 2011, ApJ, 736, L11
- Aharonian et al. (2009) Aharonian, F., Akhperjanian, A. G., Anton, G., et al. 2009, A&A, 507, 389
- Aharonian et al. (2005a) Aharonian, F., Akhperjanian, A. G., Aye, K.-M., et al. 2005a, Science, 309, 746
- Aharonian et al. (2005b) Aharonian, F., Akhperjanian, A. G., Aye, K.-M., et al. 2005b, A&A, 442, 1
- Aharonian et al. (2006) Aharonian, F., Akhperjanian, A. G., Bazer-Bachi, A. R., et al. 2006, A&A, 457, 899
- Aharonian et al. (2007) Aharonian, F. A., Akhperjanian, A. G., Bazer-Bachi, A. R., et al. 2007, A&A, 469, L1
- Albert et al. (2006) Albert, J., Aliu, E., Anderhub, H., et al. 2006, Science, 312, 1771
- Albert et al. (2007) Albert, J., Aliu, E., Anderhub, H., et al. 2007, ApJ, 665, L51
- Bogovalov et al. (2008) Bogovalov, S. V., Khangulyan, D. V., Koldoba, A. V., Ustyugova, G. V., & Aharonian, F. A. 2008, MNRAS, 387, 63
- Chernyakova et al. (2009) Chernyakova, M., Neronov, A., Aharonian, F., Uchiyama, Y., & Takahashi, T. 2009, MNRAS, 397, 2123
- Chernyakova et al. (2006) Chernyakova, M., Neronov, A., Lutovinov, A., Rodriguez, J., & Johnston, S. 2006, MNRAS, 367, 1201
- Cominsky et al. (1994) Cominsky, L., Roberts, M., & Johnston, S. 1994, ApJ, 427, 978
- Connors et al. (2002) Connors, T. W., Johnston, S., Manchester, R. N., & McConnell, D. 2002, MNRAS, 336, 1201
- de Naurois & Rolland (2009) de Naurois, M. & Rolland, L. 2009, Astroparticle Physics, 32, 231
- Dubus (2006) Dubus, G. 2006, A&A, 456, 801
- Dubus et al. (2010) Dubus, G., Cerutti, B., & Henri, G. 2010, A&A, 516, A18
- HESS Collaboration et al. (2012) HESS Collaboration, Abramowski, A., Acero, F., et al. 2012, ArXiv e-prints:1203.3215
- Hinton (2004) Hinton, J. A. 2004, New A Rev., 48, 331
- Hirayama et al. (1999) Hirayama, M., Cominsky, L. R., Kaspi, V. M., et al. 1999, ApJ, 521, 718
- Johnston et al. (2005) Johnston, S., Ball, L., Wang, N., & Manchester, R. N. 2005, MNRAS, 358, 1069
- Johnston et al. (1992a) Johnston, S., Lyne, A. G., Manchester, R. N., et al. 1992a, MNRAS, 255, 401
- Johnston et al. (1992b) Johnston, S., Manchester, R. N., Lyne, A. G., et al. 1992b, ApJ, 387, L37
- Johnston et al. (1999) Johnston, S., Manchester, R. N., McConnell, D., & Campbell-Wilson, D. 1999, MNRAS, 302, 277
- Kaspi et al. (1995) Kaspi, V. M., Tavani, M., Nagase, F., et al. 1995, ApJ, 453, 424
- Kawachi et al. (2004) Kawachi, A., Naito, T., Patterson, J. R., et al. 2004, ApJ, 607, 949
- Kerschhaggl (2011) Kerschhaggl, M. 2011, A&A, 525, A80
- Khangulyan et al. (2012) Khangulyan, D., Aharonian, F. A., Bogovalov, S. V., & Ribó, M. 2012, ApJ, 752, L17
- Khangulyan et al. (2007) Khangulyan, D., Hnatic, S., Aharonian, F., & Bogovalov, S. 2007, MNRAS, 380, 320
- Kirk et al. (1999) Kirk, J. G., Ball, L., & Skjaeraasen, O. 1999, Astroparticle Physics, 10, 31
- Kong et al. (2012) Kong, S. W., Cheng, K. S., & Huang, Y. F. 2012, ApJ, 753, 127
- Li & Ma (1983) Li, T.-P. & Ma, Y.-Q. 1983, ApJ, 272, 317
- Melatos et al. (1995) Melatos, A., Johnston, S., & Melrose, D. B. 1995, MNRAS, 275, 381
- Moldón et al. (2011) Moldón, J., Johnston, S., Ribó, M., Paredes, J. M., & Deller, A. T. 2011, ApJ, 732, L10
- Negueruela et al. (2011) Negueruela, I., Ribó, M., Herrero, A., et al. 2011, ApJ, 732, L11
- Neronov & Chernyakova (2007) Neronov, A. & Chernyakova, M. 2007, Ap&SS, 309, 253
- Shaw et al. (2004) Shaw, S. E., Chernyakova, M., Rodriguez, J., et al. 2004, A&A, 426, L33
- Tam et al. (2011) Tam, P. H. T., Huang, R. H. H., Takata, J., et al. 2011, ApJ, 736, L10
- Tavani & Arons (1997) Tavani, M. & Arons, J. 1997, ApJ, 477, 439
- Wang et al. (2004) Wang, N., Johnston, S., & Manchester, R. N. 2004, MNRAS, 351, 599