High Resolution Imaging of PHIBSS Main Sequence Galaxies in CO
Abstract
We present Karl G. Jansky Very Large Array observations of the CO transition in a sample of four main sequence galaxies. These galaxies are in the blue sequence of star-forming galaxies at their redshift, and are part of the IRAM Plateau de Bure HIgh- Blue Sequence Survey (PHIBSS) which imaged them in CO . Two galaxies are imaged here at high signal-to-noise, allowing determinations of their disk sizes, line profiles, molecular surface densities, and excitation. Using these and published measurements, we show that the CO and optical disks have similar sizes in main-sequence galaxies, and in the galaxy where we can compare CO and sizes we find these are also very similar. Assuming a Galactic CO-to-H2 conversion, we measure surface densities of M⊙ pc-2 in projection and estimate M⊙ pc-2 deprojected. Finally, our data yields velocity-integrated Rayleigh-Jeans brightness temperature line ratios that are approximately unity. In addition to the similar disk sizes, the very similar line profiles in and indicate that both transitions sample the same kinematics, implying that their emission is coextensive. We conclude that in these two main sequence galaxies there is no evidence for significant excitation gradients or a large molecular reservoir that is diffuse or cold and not involved in active star-formation. We suggest that in very actively star-forming galaxies is likely an indicator of how well mixed the star formation activity and the molecular reservoir are.
Subject headings:
galaxies: evolution, galaxies: ISM, galaxies: high-redshift, ISM: molecules1. Introduction
Galaxy formation and evolution are regulated by the interplay between the hierarchical merging of dark matter halos, the accretion of primordial and recycled gas, the transport of gas within galaxy disks, and the subsequent gravitational fragmentation, phase transition, and formation of molecular clouds. The star formation that is the end-point of this process gives rise to nucleosynthesis, and metal-enriched outflows driven by stellar winds, radiation pressure, supernovae, and AGN activity (e.g., Davé et al., 2011a, b). These mechanisms interact in complex ways, giving rise to the rich phenomenology observed in galaxies today.
Surveys at have shown that most star-forming galaxies (SFGs) populate a tight main sequence (Noeske et al., 2007; Daddi et al., 2007; Rodighiero et al., 2010), suggesting that the evolution of a typical galaxy is regulated by secular processes related to gas accretion from the cosmic web, with subsequent star formation, galactic outflows, and reaccretion of gas (e.g., Oppenheimer et al., 2010; Bouché et al., 2010; Davé et al., 2012; Lilly et al., 2013; Forbes et al., 2014). The gas accretion is provided by a combination of smooth and lumped accretion, the latter likely in the form of minor mergers (e.g., Kereš et al., 2005; Dekel et al., 2009b; Brooks et al., 2009). In this paradigm major mergers play a secondary role at forming the majority of galaxies, but are still critical for creating the most massive and the most actively star-forming galaxies. Until recently, almost all of the observations of gas in galaxies at high redshift targeted the rare “behemoths” (see Carilli & Walter, 2013), typically quasar hosts or merging galaxies bright at submillimeter wavelengths (or even merging groups of galaxies, Ivison et al., 2013). The exceptions were a few intrinsically faint but highly lensed objects, where lensing complicates the data interpretation (Baker et al., 2004; Coppin et al., 2007; Riechers et al., 2010). The increased sensitivity in the millimeter-wave regime makes it now possible to directly observe normal massive star-forming galaxies at high redshift. Indeed, high- main sequence SFGs are considerably more active in star formation than similar mass galaxies at , likely because they are richer in gas than present day blue sequence galaxies, as found by molecular gas observations (Tacconi et al., 2010, 2013; Daddi et al., 2010a, b).
Early universe molecular gas surveys usually target the mid- transitions of the CO molecule, which are accessible for in the transparent mm atmospheric windows. Additionally, for a fixed gas mass and typical conditions these transitions are more luminous and easier to detect than the ground level transition. This, however, introduces an additional source of uncertainty when converting their fluxes to H2 masses at high- (Weiss et al., 2007; Carilli & Walter, 2013). Excitation data remain scarce for high- SFGs. The lowest galaxy luminosities currently probed by high redshift CO observations correspond to the high luminosity end of the main sequence, and the data suggest their excitation is intermediate between that observed in high-z Submillimeter Galaxies (SMGs) or local Ultra-Luminous IR Galaxies (ULIRGs), and the Milky Way (Fixsen et al., 1999). Observations find CO main-beam velocity-integrated Rayleigh-Jeans brightness temperature line ratios in a handful of high- main sequence SFGs (Dannerbauer et al., 2009; Aravena et al., 2010; Riechers et al., 2010; Aravena et al., 2014). The excitation picture, however, is not clear cut. Studies of samples of local and high- luminous and ultraluminous IR galaxies also suggests a typical with very large dispersions (Harris et al., 2010; Papadopoulos et al., 2011; Ivison et al., 2011; Greve et al., 2014).
The observed in high- main sequence SFGs can be reproduced by a range of conditions. The typical conditions found in the highly idealized single-component models are K with cm-3 to K with cm-3, together with gas filling factors from to (Aravena et al., 2010). This interpretation is by no means unique, however, as realistic galaxies contain multiple components, and different transitions may not be necessarily coextensive — for example if dense warm star-forming regions were surrounded by cooler, less dense envelopes of gas (e.g. Harris et al., 2010). It is also possible to hide a significant amount of mass in a cold component that would be hard to detect (Papadopoulos et al., 2012). The inclusion of transitions reveals that, at least in some of the main sequence SFGs, the “one component” picture of the ISM is too simplistic, although the data support the idea of a somewhat lower excitation in main sequence galaxies than in SMGs (Daddi et al., 2014; Bournaud et al., 2014a). In particular, the and inferred above would produce too little, if any, emission in contrast with the observations. Better sensitivity observations of the transition, observations of transitions with , and higher spatial resolutions are necessary to definitively constrain the molecular excitation in these galaxies.
There are a handful of resolved molecular measurements of main sequence galaxies. Tacconi et al. (2010) discusses in particular observations of one SFG at a resolution of that reveal a collection of clumps with gas masses of M⊙, sizes of kpc, and surface densities M⊙ pc-2. Tacconi et al. (2013) expands on these results, determining CO sizes (mostly for objects), reaching the conclusion that the UV/optical disk size and the CO size are similar. Genzel et al. (2013) examine high-resolution observations of the galaxy EGS13011166, a disky system with massive clumps and a globally unstable gas disk. Freundlich et al. (2013) take advantage of position-velocity information to apportion the emission from four SFGs in clumps, inferring typical gas surface densities M⊙ pc-2 with a large dispersion. Aravena et al. (2014) presents a few observations of SFGs, including an earlier dataset for the galaxy BX610, one of the sources studied in this paper. In the SFG that they observe at high resolution they find clumps with masses M⊙ that make up 40% of the emission. Giant clumps are a natural consequence of the gas richness of these high- systems, which makes their disks unstable (e.g., Dekel et al., 2009a; Genzel et al., 2013; Bournaud et al., 2014b). A clumpy morphology has also been observed in the relatively rare, very gas-rich and strongly star-forming local disks (Green et al., 2014; Fisher et al., 2014).
In this work we present new, very sensitive observations of the CO transition in main sequence SFGs at redshift , during the peak of cosmic star formation. We discuss the observations and data reduction in §2. In §3 we present and discuss the results; particularly focusing on sizes, surface densities, and excitation. In §4 we summarize them and present the conclusions.
2. Observations and Reduction
We selected our sources as the brightest CO emitters at in the IRAM Plateau de Bure HIgh- Blue Sequence Survey (PHIBSS) sample (Tacconi et al., 2010, 2013). Original optical data for these objects are discussed by Erb et al. (2006). We observed the CO (J=) transition at 115.2712 GHz rest frequency in Q1700MD94, Q2343BX610, Q1700MD69, and Q1700MD174 using the Karl G. Jansky Very Large Array (Jansky VLA) in the C- and D-array configurations, with typical angular resolution of and respectively. In order to observe the redshifted CO line the observations employ the Ka-band receiver, which covers the frequency range GHz.
C-array observations were carried out between 12 October 2010 and 09 January 2011 under project 10B-106. These data were obtained during the VLA to Jansky VLA upgrade transition period, resulting in a reduced bandwidth. Each C-array observation has 0.5 MHz spectral resolution and covers a 128 MHz bandwidth centered on the redshifted frequencies of our galaxies (34.55 GHz, 35.90 GHz, 35.06 GHz, and 34.49 GHz for MD94, BX610, MD69, and MD174 respectively).
The follow up D-array data were taken between 07 February 2013 and 07 April 2013 under project 13A-115. These data have 1 MHz spectral resolution with a total of 4 GHz bandwidth coverage. The time invested is approximately 8 hours per source in C-array. The D-array follow up spent hours on MD94 and hours on BX610. Because only of the visibilities in C-array have distances k (probing size scales ), and the sources were found to be extended in the original observations, the sensitivity added by the D-array observations is very significant.
All data were processed using the Jansky VLA reduction pipeline111The Jansky VLA reduction pipeline is available for download at this url: https://science.nrao.edu/facilities/vla/data-processing/pipeline version 1.2.0 using the Common Astronomy Software Applications package (CASA) version 4.1. The fluxes employed for the flux calibrators were applied in the pipeline following the prescribed fits by Perley & Butler (2013). We visually inspected each observation after the calibration scripts were completed to flag a few remaining bad baselines. The source was then split off from each individual observation and combined into a single data set for imaging. After imaging with 50 km s-1 channel widths, we cleaned down to on a 55 box centered on the source. The image cubes span a range of km s-1 around the optical redshift of the source for MD94 () and BX610 (), while MD69 () and MD174 () were imaged over a km s-1 span because of the reduced bandwidth available in the transition period during which the C-array data were acquired. For the calculation of physical parameters we use a standard cosmology (H km s-1 Mpc-1, , , Komatsu et al., 2014).
BX610: One C-array track was not included in the imaging because of strong pattern noise (maybe due to interference or correlator problems), but this problem persists at a lower level in the remainder of the C-array data for this object. The flux and gain calibrators for BX610 were 3C48 and J2346+0930, respectively. At our observing frequency 3C48 has a flux density of mJy which was applied to our data to fix the flux scale. The resulting flux of the gain calibrator was mJy in the C-array data and mJy in the D-array data. We inserted a second calibrator in the D-array observations (J2330+110) to check the quality of the calibration including phase transfer. The recovered flux of the check calibrator is mJy, in excellent agreement with the power-law interpolation between the 2 cm and 0.7 cm fluxes listed in the VLA calibrator catalog for this object of 640 mJy. The synthesized beam sizes range from (C only, natural weighting) to (C+D, Briggs weighting with robust parameter set to 0.5, henceforth “robust weighting”) and (C+D, natural weighting). The 1 noise per 50 km s-1 channel for the robust C+D cube is 52 Jy beam-1. The high resolution data were obtained at PdBI as part of PHIBSS, and have a resolution .
MD94: Along with MD94, flux (3C286) and gain (J1645+6330) calibrators were also observed. 3C286 has a flux density of 1800 mJy at 34.55 GHz which was used to fix the flux scale of the data. The derived flux density of our gain calibrator was mJy in the C-array data and mJy in the D-array data. We also included a secondary calibrator in the observations (J1716+6836). Applying the gain solution to this object recovers mJy while the VLA calibrator catalog would lead us to expect mJy. However, given its listed fluxes this calibrator appears to be a highly variable flat spectrum source, and it is very likely that changes are due to intrinsic variability. The synthesized beam sizes range from (C only, natural weighting) to (C+D, robust weighting) and (C+D, natural weighting). The 1 noise per channel for the robust C+D cube is 58 Jy beam-1.
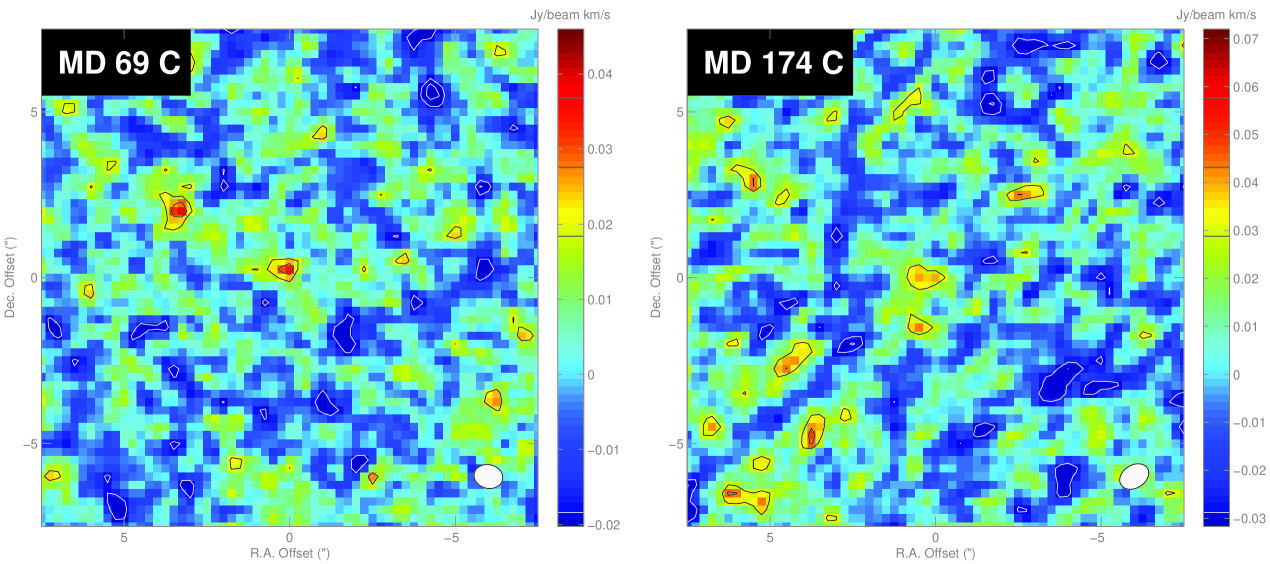
MD174 & MD69: These sources were not clearly detected in C-array observations and were not followed with D-array. Both galaxies were flux calibrated with observations of 3C286 and antenna gains were corrected with observations of J1645+6330. The resulting rms noise per 50 km s-1 channel is approximately 78 and 68 Jy beam-1 for MD174 and MD69, respectively. The integrated intensity maps of both objects show positive signal at the position of the source that, while formally close to for MD69, is hard to distinguish from many nearby noise peaks. The smoothed spectrum at the position of MD69 shows what may be a marginally significant line. The luminosities of these objects in Table 4 can be compared to their respective luminosities of and K km s-1 pc2 (Tacconi et al., 2013). The resulting ratios are consistent with our conclusions for MD94 and BX610 in §3.3, but do not add significant information.
3. Results and Discussion
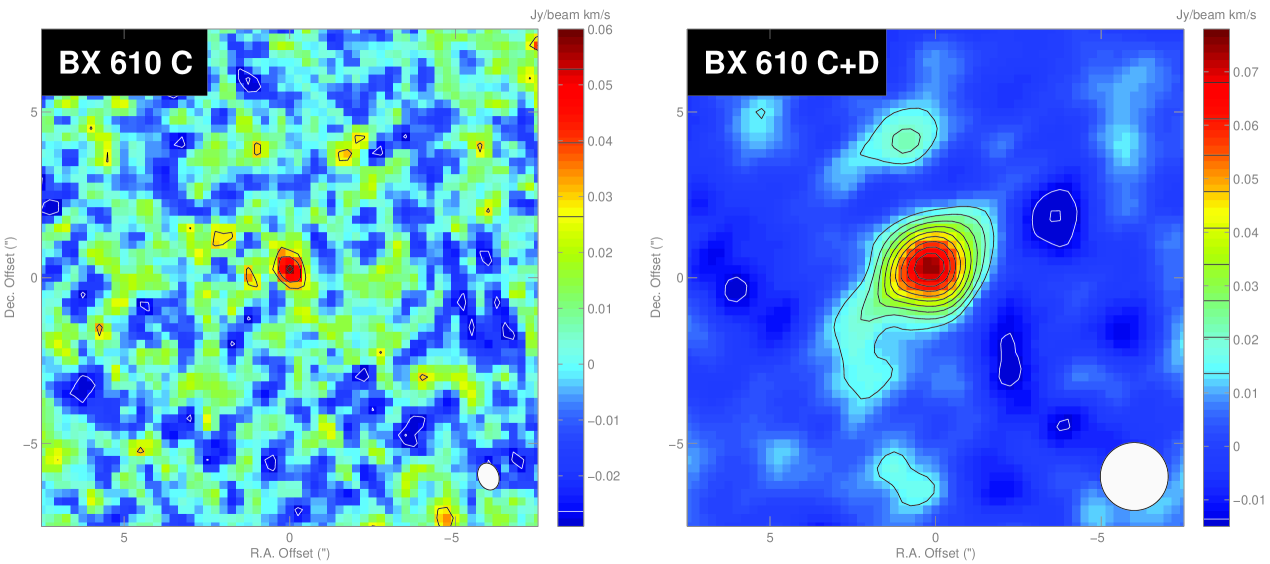
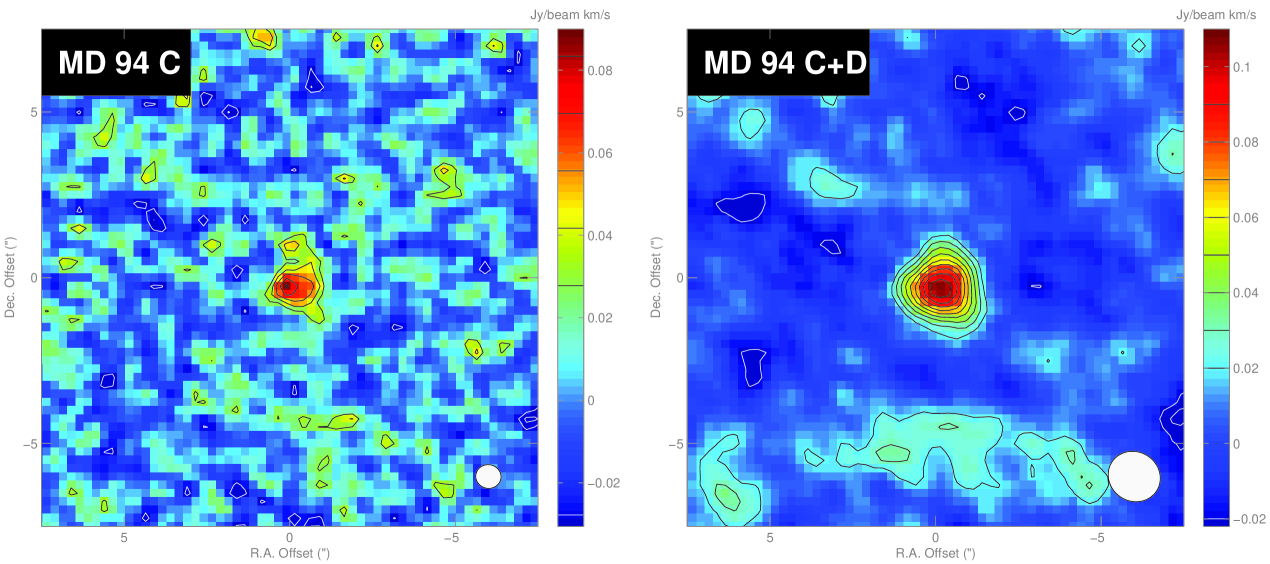
Both MD94 and BX610 are detected at good signal-to-noise, even in the C-only data (Figure 1). MD69 and MD174, which are weaker sources in the CO observations, were not clearly detected and not followed up with D array observations, therefore we focus our discussion on the previous two galaxies. Together with the earlier publication of another BX610 dataset (Aravena et al., 2014), these constitute the first CO detections of unlensed main sequence galaxies, and the first observations where measurements of the intrinsic properties of the cold CO disks of main sequence galaxies free of lensing corrections are possible at these redshifts.
Employing the parametrization of the main sequence of star-forming galaxies derived for the AEGIS and COSMOS fields by Whitaker et al. (2012), both MD94 and BX610 are very representative of the massive end of the main sequence at their redshift. Their specific star formation rates are sSFR and yr-1 respectively, which at their inferred stellar masses (M and M⊙ respectively) places them well within the main sequence 0.3 dex scatter. Both are very active star-forming galaxies, with respective SFR and M⊙ yr-1 (Tacconi et al., 2013). MD94, the most massive of the pair, displays a broad H line and is classified as an AGN (Erb et al., 2006). BX610 may contain an AGN, but not a very luminous one (Förster Schreiber et al., 2014; Newman et al., 2014; Genzel et al., 2014). It is important to keep in mind that these galaxies were selected because they are bright CO emitters, which makes it possible to target them in CO , and thus their CO properties may not be representative of the population as a whole. Our CO measurements are summarized in Table 4, and the resulting physical parameters in Table 4 together with relevant parameters from Tacconi et al. (2013).
3.1. The Size of the Molecular Disks in High- Main Sequence Galaxies
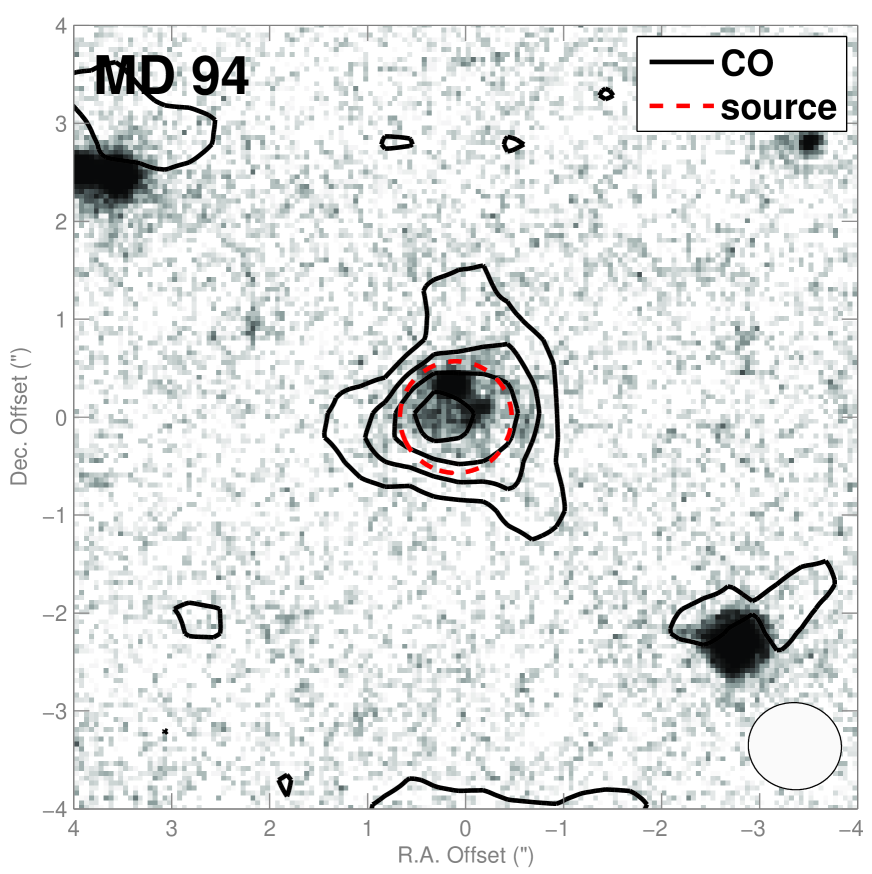
MD94 is clearly resolved in the observations (c.f., Table 4). The simple Gaussian fit (CASA imfit) yields an elongated source in the N-S direction, with deconvolved FWHM diameter (after averaging the C-only and C+D robust results) of at high significance (). With an image scale of kpc per arcsecond at this redshift, this corresponds to kpc. The residual RMS in the central region after removing the Gaussian fit is very similar to that measured in empty regions of the original image, showing that a 2D Gaussian is a good model for the source at this signal-to-noise. BX610 is clearly resolved along its major axis, with a deconvolved CO FWHM diameter of corresponding to kpc (for this source we adopt the results of the C+D robust combination, which despite the larger beam is better behaved than the C-only observation). We also did UV-plane model fitting using the uvmodelfit task in CASA, and the results are essentially identical to those from image-plane fitting.
In galaxies there is a good relation between the sizes of molecular and stellar disks (e.g., Regan et al., 2001). The CO emission is found in an approximately exponential disk with a scale-length that is , the isophotal radius of the B-band light at 25th magnitude (Young & Scoville, 1991; Young et al., 1995; Schruba et al., 2011). Consequently half of the CO emission in local disks is contained within a radius . For optical light it is usually assumed that the stellar disk scale length is (implying an effective radius containing half the optical light of ), so the stellar and molecular disks track each other very well in their exponential part.
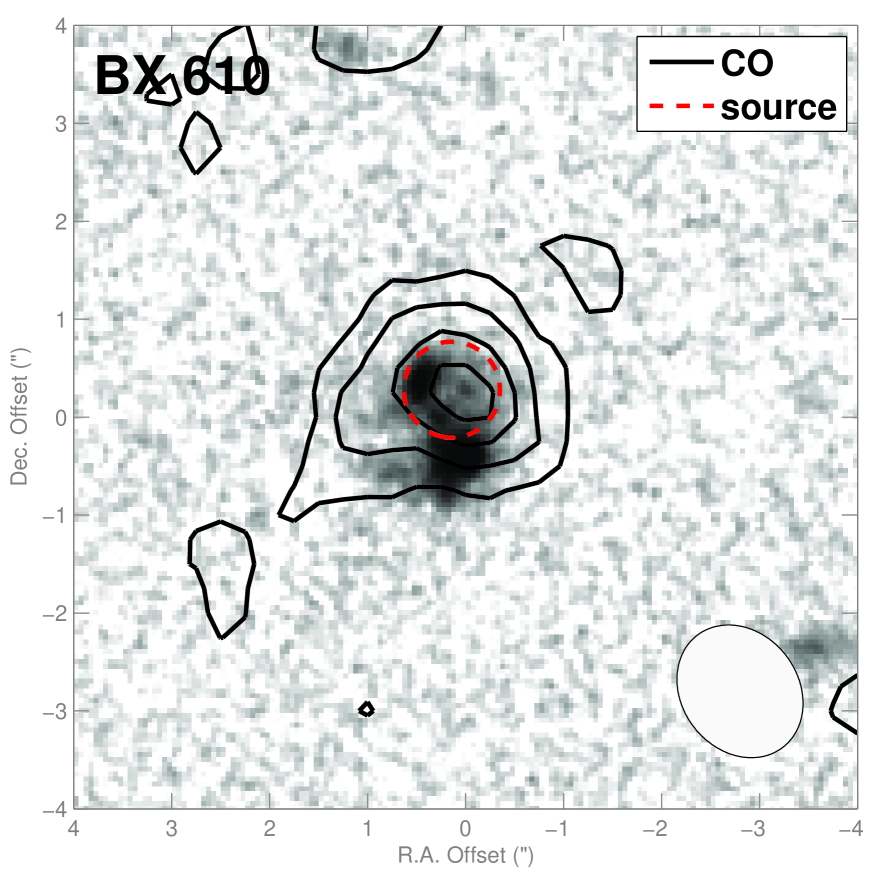
How do the CO and optical sizes relate in our high- SFGs? For a Gaussian source 50% of the flux is contained within the FWHM, therefore the measured CO radius for MD94 and BX610 is respectively and kpc. We can compare directly these numbers with near-IR NICMOS observations of BX610 (Figure 2) that sample the optical disk of that galaxy (Förster Schreiber et al., 2011). Rest-frame 5000 Å observations of BX610 yield an effective radius of kpc, which within the errors is very comparable to the we obtain. To put disk optical sizes in the context, the typical half-light optical radius of a M⊙ in the SDSS sample analyzed by Shen et al. (2003) is kpc. The existing HST observations for MD94 (Figure 2) are rest-frame 2500 Å (Peter et al., 2007), which combined with the AGN presence makes it difficult to obtain a reliable disk size (the 4.8 kpc optical radius reported by Tacconi et al., 2013, is from H). Surface photometry shows that 80% of the 2500 Å light is in an exponential component with arcseconds ( kpc) using the Fisher & Drory (2008) methodology. Converting these measurements to an optical size is, however, not straightforward even in local galaxies (which display a range of scalings, Taylor et al., 2005; Muñoz-Mateos et al., 2007), much less in the poorly characterized high- population.
It is interesting to compare our results to some other resolved measurements of high- SMGs. Bothwell et al. (2010) analyze resolved observations of intermediate excitation CO and in several such galaxies at to . Their typical CO 50% emission radii (computed as the harmonic mean of the major and minor axis) are kpc, although the observations span a range of kpc. Similar measurements are reported by Tacconi et al. (2008) and Engel et al. (2010), who find typical CO sizes kpc. Sharon et al. (2015) find lensing-corrected source sizes of kpc in and kpc in for the two components of the SMG they study. The and 4.8 kpc sizes measured here suggest that the CO disks of main sequence galaxies tend to be somewhat more extended than the region producing mid-J CO emission in SMGs at comparable redshift. On the other hand, resolved CO measurements of five SMGs by Ivison et al. (2011) find complex morphologies with radii of kpc for four of the objects (the fifth is unresolved) and a median FWHM linewidth of 540 km s-1. These SMG CO sizes and linewidths are larger than those measured for the same objects in the mid-J transitions, and also larger than the disk sizes we measure here.
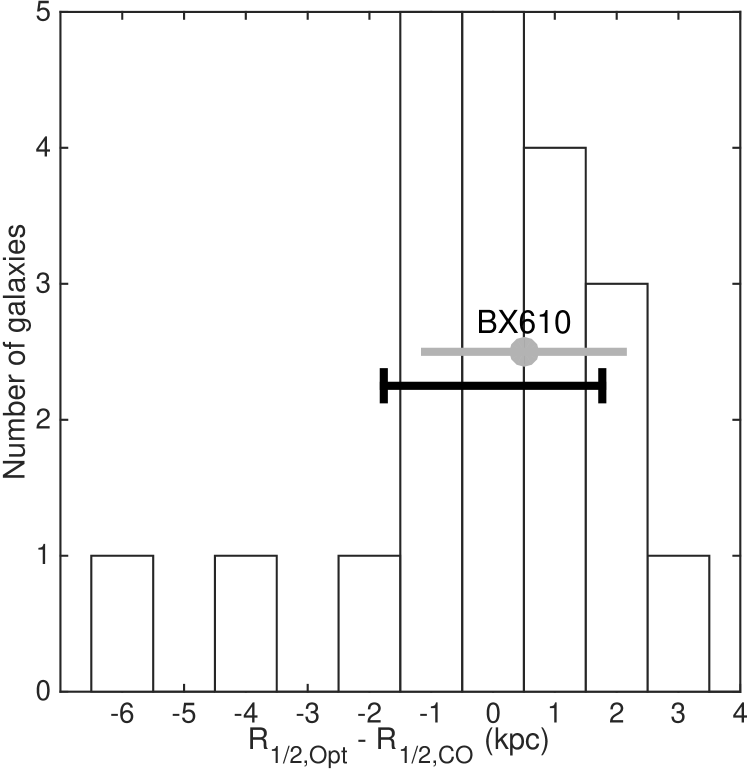
The similarity between the molecular and optical sizes in main sequence galaxies is also seen in the CO measurements reported by Tacconi et al. (2013), mostly obtained for sources (Fig. 3). These measurements suggest that main sequence galaxy disks follow a scaling between optical light and CO similar to that in local disks. The CO is not measurably more extended than the stars, as may occur if a significant amount of pre-enriched newly-arrived material is present in the disk outskirts. Such pre-enriched material is unlikely to arrive through smooth accretion; it seems much more likely that occurs through mergers, and in particular minor mergers given the placement of these galaxies on the main sequence. The fact that the scaling between CO-emitting molecular gas and the stars is similar to that observed in local disks suggests that we are not catching these main-sequence disks at an out-of-equilibrium stage. Rather, we observe them in an equilibrium situation where the established stellar population and the enriched CO-bright molecular gas that fuels the current star formation have similar radial distributions.
3.2. Molecular Masses and Surface Densities
The excellent signal-to-noise of the observations for MD94 and BX610 permits, in principle, a precise determination of their CO luminosity. Unfortunately there is a distressing level of inconsistency between the fluxes measured in the C and D configurations, particularly for MD94, with the former being higher than the latter. After detailed inspection of the data and calibrations it is not clear what to attribute these differences to. In particular, the changes in the flux measured for the sources between D and C configurations are not mirrored by changes in the flux of their respective gain calibrators which could suggest systematic problems with the flux calibration (for MD94 the change is in the opposite direction), and are not due to the phase noise as measured on the gain calibrator (which shows RMS degrees in either configuration). After application of the calibrations we also recover the expected flux for the secondary calibrator used in D-array, as noted in §2. The flux inconsistency in MD94 is at the level, which suggests that it could be simply due to noise, much higher for the C-array data. The fact that the C-array observations were obtained during a transition period for the instrument may also have had an effect on the accuracy of those fluxes. Because of these considerations we base our discussion on the fluxes from the naturally weighted combination of C+D observations, which gives preferential weighting to the D-array data and has the best signal-to-noise.
To compute the molecular masses we use Eq. 3 in Bolatto et al. (2013), which is applicable to CO , with a Galactic CO-to-H2 conversion factor. This conversion relies fundamentaly on two assumptions: 1) the molecular gas is primarily self-gravitating, and 2) the ratio between gas density, , and temperature, , is roughly similar to that in local galaxy disks (Bolatto et al., 2013, and references therein). We use M⊙ (K km s-1 pc2)-1 which includes the Helium contribution to the mass as is customary ( M⊙ (K km s-1 pc2)-1 without the Helium contribution). A number of arguments point to an approximately Galactic value of the conversion factor for main sequence high- galaxies (Tacconi et al., 2010; Daddi et al., 2010a; Genzel et al., 2012), including the similarity between the gas masses inferred from CO and from dust (Genzel et al., 2015). This is supported by detailed numerical modeling of high- galaxies, which suggests that the average in these systems is not significantly different from in local disks (Bournaud et al., 2014a). We will see in §3.3 that there are indications that the molecular gas temperature is higher in these sources than the average in GMCs in the Galaxy. It is important to remark that this does not automatically translate into a lower-than-Galactic . In a self-gravitating cloud what matters is the ratio, not just the temperature, as stated in assumption number two above. Indeed, there are indications that densities (certainly column densities) are much higher in these objects than in Galactic GMCs.
Under these assumptions, the molecular masses inferred from CO for MD94 and BX610 are and M⊙ respectively. These masses are similar to the stellar masses determined for these galaxies (Tacconi et al., 2013), resulting in molecular gas fractions of . Bolatto et al. (2013) discuss a surface density correction that is applicable if the CO-emitting gas is not self-gravitating but bound to the overall potential of the galaxy as is applicable in a merger and some galaxy centers (c.f., their Eq. 31). For our galaxies, application of this correction would amount to reducing their molecular mass by a factor of . This is consistent with what detailed modeling recovers for very turbulent starbursting mergers, but it is likely too large a correction for the galaxies presented here (by contrast modeling of very actively star-forming clumpy main sequence galaxies finds within 20% of the Galactic value Bournaud et al., 2014a).
Given the sizes we measure for the molecular emission, the molecular masses inferred for MD94 and BX610 imply corresponding average deprojected surface densities of M⊙ pc-2 () and M⊙ pc-2 () assuming the disk size is that of the deconvolved major axis and the measured elongation is due to projection effects ( M⊙ pc-2 in projection). The surface density found for BX610 is approximately the typical M⊙ pc-2 inferred by Freundlich et al. (2013) using position-velocity information in four galaxies, as well as spatially-resolved measurements in galaxies (Tacconi et al., 2010; Genzel et al., 2013). MD94, on the other hand, exhibits higher deprojected disk surface densities than BX610 mostly as a consequence of its smaller inferred inclination, that place it at the upper end of the Freundlich et al. measurements. We note that these “deprojected” estimates are very tentative and, although more physically interesting than projected quantities, also considerably more uncertain because of the poor knowledge of the geometry. In particular, using the H-derived inclination of BX610 (see next paragraph) would result in a deprojected M⊙ pc-2.
We can also extract size and velocity information from the data cubes themselves, and obtain dynamical mass estimates. We use GalPak3D, a Bayesian multiparameter Markov Chain Monte Carlo fitter for 3D galaxy data that takes into account the effects of instrumental resolution (Bouché et al., 2015), to fit the robust C+D cubes for MD94 and BX610. The process requires a starting set of assumptions (source center, size, inclination, velocity dispersion, etc), that are then used to produce a 3D model that is compared to the data to compute a reduced figure-of-merit which is then minimized. All resulting estimates are extremely tentative given the resolution and signal-to-noise of the data (Figure 4). The reduced resulting from the minimization are 1.15 and 1.05 for MD94 and BX610 respectively, showing that the model is a good fit to the data. The minimum, however, is shallow, showing that the models are not unique. BX610 is fit by a (thick) rotating disk with a maximum velocity of km s-1 and intrinsic dispersion km s-1, inclination of , and radius . These parameters are comparable to those obtained from the analysis of its H kinematics (Cresci et al., 2009, Table 2), although both the rotational velocity and radius are lower (the latter is also lower than the radius we obtain from the integrated intensity map), and the inclination is higher. The resulting dynamical mass computed as using the more robust kpc estimate from Table 4 is M⊙, lower than found by Cresci et al. (2009) and too low compared to the inferred baryonic mass M⊙. This is, however, entirely attributable to the inclination found in the CO fit. If we instead use the H- derived inclination () we correct to km s-1, resulting in M⊙ in excellent agreement with the estimate of the baryonic mass (we do not expect dark matter to make a significant contribution inside ). MD94, on the other hand, is fit as a dispersion-dominated system ( km s-1 and km s-1 with ). The corresponding dynamical mass is M⊙, too low to accommodate even the stellar mass. Unfortunately there are no H kinematics to compare with, and the example of BX610 highlights the uncertainties of the analysis.
An interesting local comparison may be provided by the starbursting region of the nearby galaxy NGC253, which has 50% of its CO emission within an area of pc in projected size with a luminosity L K km s-1 pc2 (Leroy et al., 2014, Table 5). That region of NGC253 has a star formation rate SFR M⊙ yr-1, while MD94 and BX610 have inferred integrated SFR and M⊙ yr-1 respectively (Tacconi et al., 2013). About NGC253-like complexes filling of the area of these main sequence disks would be compatible with our CO luminosity and surface brightness, while simultaneously fueling the observed star formation activity. This conceptual “picture” of an agglomeration of starburst-like regions also fits the excitation as we discuss in the next section. Note, however, that there is no deep physical significance to the inferred beam filling area other than the fact that it reproduces the observed integrated surface brightness.
3.3. The Excitation of CO
The Cosmic Microwave Background (CMB) has a temperature of K at , which sets an effective floor for the physical temperature of the cold molecular gas (see e.g., da Cunha et al., 2013). In terms of the Rayleigh-Jeans brightness temperature (radiation temperature) measured by the interferometer, the CMB presents a background that lowers the contrast. Thus even for optically thick, thermalized emission the observed Rayleigh-Jeans brightness temperature is systematically lower than the excitation temperature, , and vanishes when in the rest frame (see Eq. 6 in Bolatto et al., 2013, which is applicable to the rest frame). The fact that we see relatively bright CO and emission already says that K.
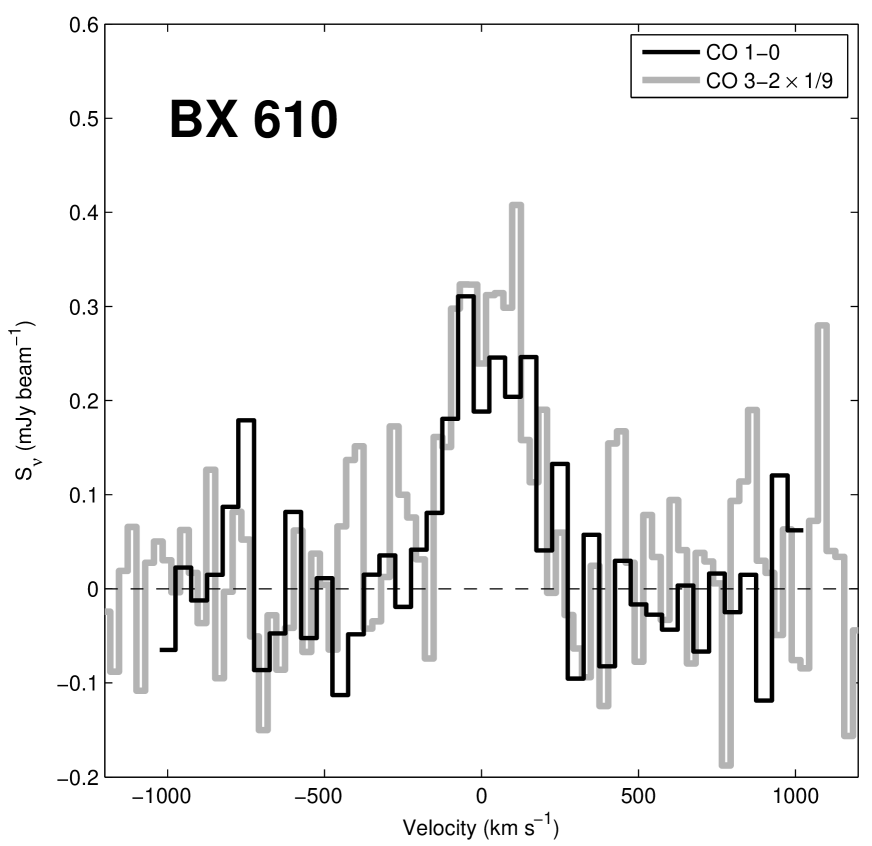
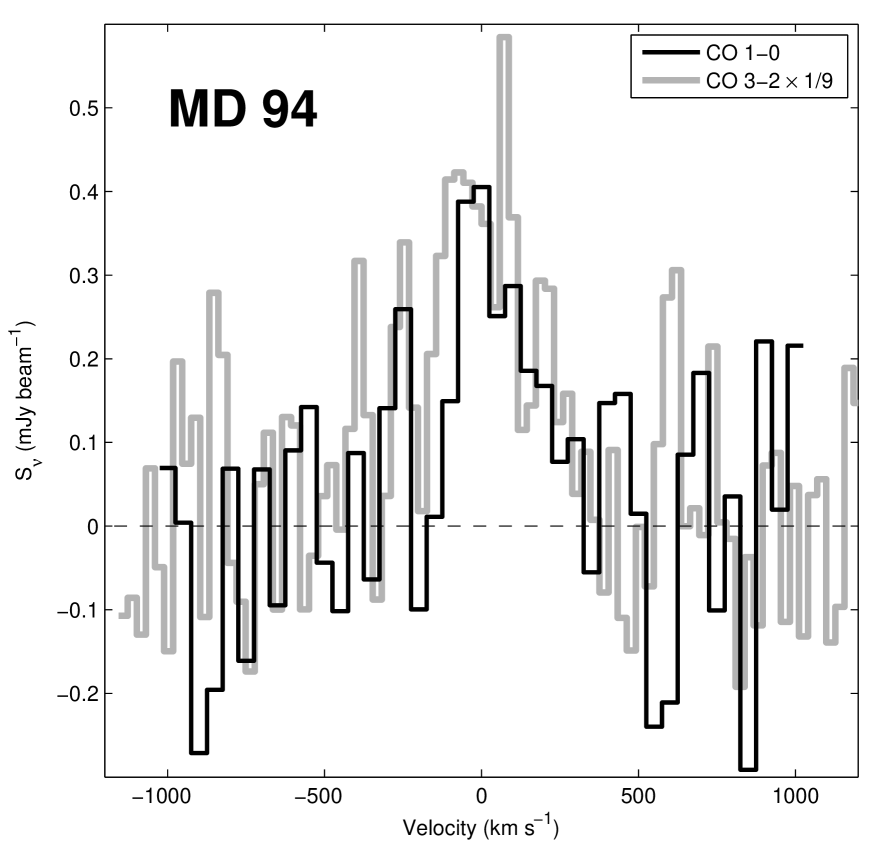
The effect of the CMB on the ratio of two transitions is small unless the excitation temperature of the emission is very low. The integrated flux ratio between the and transitions is for MD94 and for BX610. Converting to ratios in brightness temperature units requires dividing by the ratio of upper level quantum numbers, , resulting in and for MD94 and BX610 respectively. These data have much better signal-to-noise in CO than observations used by Aravena et al. (2014) to measure in BX610, and the we obtain is at the upper boundary of the previous measurement.
Under the assumption of coextensive emission, these integrated numbers suggest that the of the and transitions are very similar, and both transitions arise from optically thick warm gas (that is, gas with excitation and kinetic temperature significantly higher than the K energy necessary to collisionally jump from to the level, where is Boltzmann’s constant).
The data strongly suggest that the emission in CO and is coextensive in these objects. The source sizes are very similar in both CO transitions in BX610, where the measured sizes of the CO emission for the and transitions are the same within the uncertainties ( kpc for , kpc for ). Moreover, the spectral shape of the emission is very similar for both transitions in MD94 and BX610, within the uncertainties associated with the noise (Figure 5). The respective linewidths in CO (CO ) from Single Gaussian fitting are () km s-1 and () km s-1 respectively (the difference in the case of MD94 is driven by the blue side of the spectrum, where the fit to incorporates as line a wider range of velocities resulting in a shift of the centroid). Averaging these results yields a typical on average for these two sources. This suggests that, within our ability to quantify them with the present data, no dramatic excitation gradients are present, as both transitions sample the same gas kinematics. This is in contrast with what may be the situation in SMGs, where Ivison et al. (2011) find a measurably larger typical linewidth for the CO in comparison to , suggesting the colder gas is more extended. Note, however, that this is a subtle effect in the SMG sample, and so it could go undetected in our data.
These results point to a molecular gas excitation that is high and uniform in MD94 and BX610, up to the level. Given the widespread molecular emission, the large average gas surface densities, and the inferred SFRs, this should not be surprising. The excitation requirements for the transition are not particularly stringent: K, and an effective critical density cm-3, making the ratio a rather blunt indicator of excitation. By comparison, the average relation for dust temperature along the main sequence predicts K for these objects (Genzel et al., 2015, Table 5), which can be taken as a proxy for the gas temperature in dense environments and certainly meets the requirement for excitation to . The measured values show that there is not a large reservoir of cold and/or diffuse low excitation molecular gas, bright in CO but not apparent in , present in these sources.
In a study using a library of galaxy simulations, Narayanan & Krumholz (2014) make the case for the link between and CO line ratios in galaxies. They show that in moderately active star-forming galaxies ( M⊙ yr-1 kpc-2) the molecular gas has average temperatures larger than the energy of the level, and given its large typical optical depth it is very easy to excite this transition through collisions and radiative trapping. In particular, they parametrize the expected line ratios as a function of . Using their Eq. 19 and the M⊙ yr-1 kpc-2 measured for our galaxies, we would expect , very similar to what we measure.
Interestingly, our results are also consistent with the measured for CO in the central regions of NGC253 (Bradford et al., 2003). Another point of comparison is provided by the nearby Seyfert NGC1068. There the line ratio averages to in the starburst ring, but with a large range of values correlated with the local star formation activity measured in Paschen : in regions with low SFR, and in regions with high SFR (Garcia-Burillo et al., 2014). The compact circumnuclear disk region, heavily influenced by the AGN, shows .
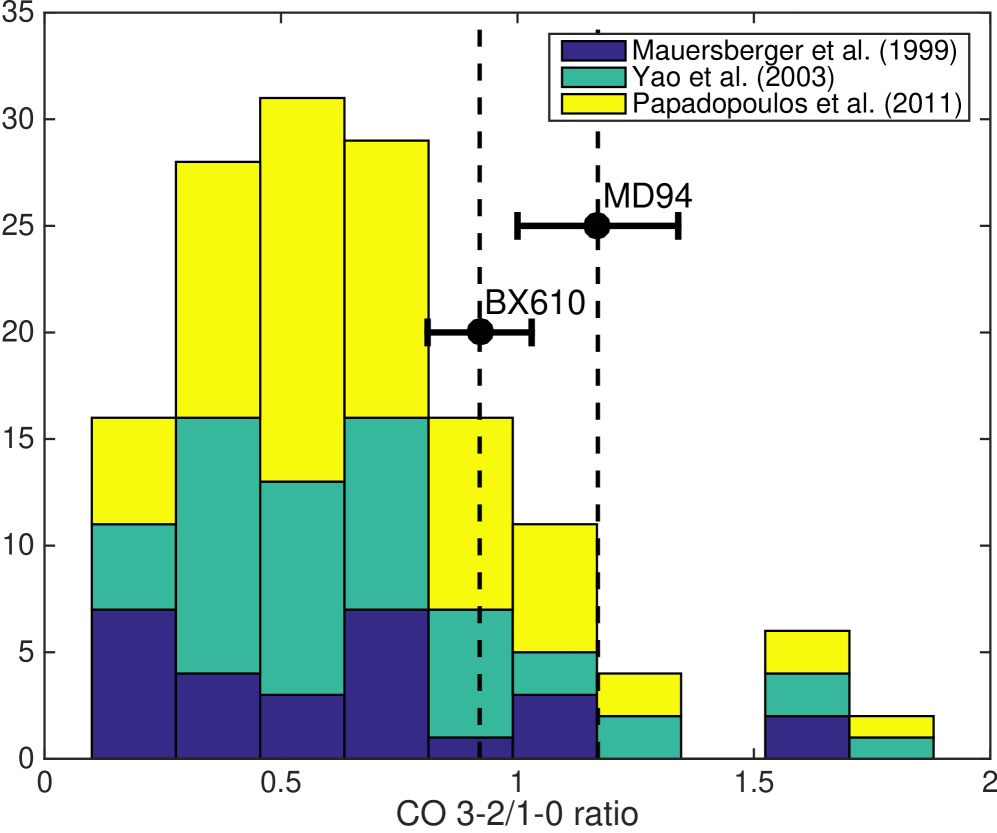
Actively star-forming galaxies span a range of , and although a typical value is there exist several local examples with (Figure 6; Mauersberger et al., 1999; Yao et al., 2003; Papadopoulos et al., 2011). There has been a tendency to attribute the high measured in some high- sources to the presence of a strong AGN (e.g., Riechers et al., 2011). Nonetheless, it is clear now that at least some high- sources display high ratios with no clear AGN activity (Sharon et al., 2013, 2015). That is certainly the case also in the NGC253 starburst, where no strong AGN is detected, and in the starburst ring of NGC1068 where the influence of the AGN is negligible. It is more likely that is not so much acting as an indicator of overall density and temperature, but rather showing how well mixed the star formation activity (which provides the bulk of the gas heating) and the molecular reservoir are. Galaxies where part of the molecular reservoir is quiescent (thus cold and/or diffuse) will show lower , while galaxies where most of the molecular gas in experiencing star formation will exhibit higher ratios.
4. Summary and Conclusions
We present and discuss CO observations of four main sequence star forming galaxies at that are part of the PHIBSS sample. These observations image and resolve two of these galaxies, MD94 and BX610, with very good signal-to-noise. These galaxies are representative of the luminous and massive end of the main sequence at their redshift. The reader should keep in mind that because they were selected on the basis of their CO flux, however, it is unclear whether they are representative of the CO properties of the wider main-sequence population. We use these data to study three aspects of these galaxies:
-
1.
We clearly resolve their molecular disks in CO , finding half-light CO radii of and 4.1 kpc respectively. We find that the molecular and optical disk of BX610 have half-light sizes that agree within the errors, while MD94 lacks high resolution rest-frame optical observations to compare with. This agrees with the conclusions of Tacconi et al. (2013), derived using CO measurements. It is also similar to the observations on local disks where both CO and optical light have very similar length scales (Young & Scoville, 1991; Schruba et al., 2011), suggesting that in these main sequence objects we are already observing an equilibrium configuration between the established stellar population and the CO-bright molecular gas fueling star formation. We also observe that the CO molecular disk sizes we measure in these main-sequence galaxies are more extended than those typically obtained for mid-J CO emission in SMGs at similar redshifts.
-
2.
We measure molecular masses very similar to the stellar masses of these galaxies, and gas surface densities that are M⊙ pc-2 deprojected, assuming that the CO-to-H2 conversion factor is similar to the Milky Way (which is supported in general for main sequence galaxies, e.g., Genzel et al., 2015). The CO surface brightness is similar to what would be produced by complexes like that in the center of NGC253 filling of the area of these disks. This “picture” of a collection of NGC253-like starburst complexes is also consistent with the observed SFR and excitation.
-
3.
Comparison of our observations with data yields ratios that are approximately unity. This, together with the fact that we measure very similar line profiles and disk sizes in both transitions suggests that these sources do not have a large excitation gradient or a significant reservoir of cold or low density molecular gas. Because it is relatively easy to populate the level of CO in star-forming gas (where star formation supplies the heating needed to raise the gas temperature, e.g., Narayanan & Krumholz, 2014), we suggest that may act as an indicator of how well-mixed the star formation activity is with the entire molecular reservoir.
.
| Dataset | Position (J2000)ddDeconvolved source FWHM diameters from 2D Gaussian fitting using imfit. | eeIn a beam, in the integrated intensity map. | ddDeconvolved source FWHM diameters from 2D Gaussian fitting using imfit. | L | Deconvolved source sized,fd,ffootnotemark: | ||||
|---|---|---|---|---|---|---|---|---|---|
| Major | Minor | P.A. | |||||||
| RA | Dec | (mJy km s-1) | (mJy km s-1) | (1010 K km s-1 pc2) | () | () | () | ||
| BX610 C | 14aaIntegrated over km s-1. | aaIntegrated over km s-1. | |||||||
| BX610 C+D | 7aaIntegrated over km s-1. | aaIntegrated over km s-1. | |||||||
| BX610 CO 3-2 | 40aaIntegrated over km s-1. | aaIntegrated over km s-1. | |||||||
| MD94 C | 14bbIntegrated between km s-1 and km s-1 with respect to . | bbIntegrated between km s-1 and km s-1 with respect to . | |||||||
| MD94 C+D | 10bbIntegrated between km s-1 and km s-1 with respect to . | bbIntegrated between km s-1 and km s-1 with respect to . | |||||||
| MD94 CO 3-2 | 170bbIntegrated between km s-1 and km s-1 with respect to . | bbIntegrated between km s-1 and km s-1 with respect to . | |||||||
| MD69 C | 10aaIntegrated over km s-1. | aaIntegrated over km s-1. | |||||||
| MD174 C | 40ccIntegrated over km s-1, the width of the emission. Limits are . | ccIntegrated over km s-1, the width of the emission. Limits are . | ccIntegrated over km s-1, the width of the emission. Limits are . | ||||||
.
| Galaxy | Stellar MassaaFrom Tacconi et al. (2013). | SFRaaFrom Tacconi et al. (2013). | Molecular MassbbAssuming a CO-to-H2 conversion M⊙ (K km s-1 pc2)-1 which includes the 1.36 Helium correction factor. | DiametersccMajor and minor diameter enclosing 50% of CO emission computed using imfit. | ddL resolved integrated intensity, projected on the sky. | b,eb,efootnotemark: | |||||
|---|---|---|---|---|---|---|---|---|---|---|---|
| (1011 M⊙) | ( M⊙ yr-1) | (1011 M⊙) | (kpc) | (kpc) | ( K km s-1) | ( M⊙ pc-2) | |||||
| BX610 | |||||||||||
| MD94ffFor C+D, reported for robust Briggs weighting | |||||||||||
References
- Aravena et al. (2010) Aravena, M., Carilli, C., Daddi, E., et al. 2010, ApJ, 718, 177
- Aravena et al. (2014) Aravena, M., Hodge, J. A., Wagg, J., et al. 2014, MNRAS, 442, 558
- Baker et al. (2004) Baker, A. J., Tacconi, L. J., Genzel, R., Lehnert, M. D., & Lutz, D. 2004, ApJ, 604, 125
- Bolatto et al. (2013) Bolatto, A. D., Wolfire, M., & Leroy, A. K. 2013, ARA&A, 51, 207
- Bothwell et al. (2010) Bothwell, M. S., Chapman, S. C., Tacconi, L., et al. 2010, MNRAS, 405, 219
- Bouché et al. (2015) Bouché, N., Carfantan, H., Schroetter, I., Michel-Dansac, L., & Contini, T. 2015, arXiv.org, 6586
- Bouché et al. (2010) Bouché, N., Dekel, A., Genzel, R., et al. 2010, ApJ, 718, 1001
- Bournaud et al. (2014a) Bournaud, F., Daddi, E., Weiss, A., et al. 2014a, arXiv.org, 8157
- Bournaud et al. (2014b) Bournaud, F., Perret, V., Renaud, F., et al. 2014b, ApJ, 780, 57
- Bradford et al. (2003) Bradford, C. M., Nikola, T., Stacey, G. J., et al. 2003, ApJ, 586, 891
- Brooks et al. (2009) Brooks, A. M., Governato, F., Quinn, T., Brook, C. B., & Wadsley, J. 2009, ApJ, 694, 396
- Carilli & Walter (2013) Carilli, C. L., & Walter, F. 2013, ARA&A, 51, 105
- Coppin et al. (2007) Coppin, K. E. K., Swinbank, A. M., Neri, R., et al. 2007, ApJ, 665, 936
- Cresci et al. (2009) Cresci, G., Hicks, E. K. S., Genzel, R., et al. 2009, ApJ, 697, 115
- da Cunha et al. (2013) da Cunha, E., Groves, B., Walter, F., et al. 2013, ApJ, 766, 13
- Daddi et al. (2007) Daddi, E., Dickinson, M., Morrison, G., et al. 2007, ApJ, 670, 156
- Daddi et al. (2010a) Daddi, E., Bournaud, F., Walter, F., et al. 2010a, ApJ, 713, 686
- Daddi et al. (2010b) Daddi, E., Elbaz, D., —. 2010b, ApJLetters, 714, L118
- Daddi et al. (2014) Daddi, E., Dannerbauer, H., Liu, D., et al. 2014, arXiv.org, 8158
- Dannerbauer et al. (2009) Dannerbauer, H., Daddi, E., Riechers, D. A., et al. 2009, ApJLetters, 698, L178
- Davé et al. (2011a) Davé, R., Finlator, K., & Oppenheimer, B. D. 2011a, MNRAS, 416, 1354
- Davé et al. (2012) —. 2012, MNRAS, 421, 98
- Davé et al. (2011b) Davé, R., Oppenheimer, B. D., & Finlator, K. 2011b, MNRAS, 415, 11
- Dekel et al. (2009a) Dekel, A., Sari, R., & Ceverino, D. 2009a, ApJ, 703, 785
- Dekel et al. (2009b) Dekel, A., Birnboim, Y., Engel, G., et al. 2009b, Nature, 457, 451
- Engel et al. (2010) Engel, H., Tacconi, L. J., Davies, R. I., et al. 2010, ApJ, 724, 233
- Erb et al. (2006) Erb, D. K., Steidel, C. C., Shapley, A. E., et al. 2006, ApJ, 646, 107
- Fisher & Drory (2008) Fisher, D. B., & Drory, N. 2008, AJ, 136, 773
- Fisher et al. (2014) Fisher, D. B., Glazebrook, K., Bolatto, A., et al. 2014, ApJLetters, 790, L30
- Fixsen et al. (1999) Fixsen, D. J., Bennett, C. L., & Mather, J. C. 1999, ApJ, 526, 207
- Forbes et al. (2014) Forbes, J. C., Krumholz, M. R., Burkert, A., & Dekel, A. 2014, MNRAS, 438, 1552
- Förster Schreiber et al. (2011) Förster Schreiber, N. M., Shapley, A. E., Erb, D. K., et al. 2011, ApJ, 731, 65
- Förster Schreiber et al. (2014) Förster Schreiber, N. M., Genzel, R., Newman, S. F., et al. 2014, ApJ, 787, 38
- Freundlich et al. (2013) Freundlich, J., Combes, F., Tacconi, L. J., et al. 2013, A&A, 553, A130
- Garcia-Burillo et al. (2014) Garcia-Burillo, S., Combes, F., Usero, A., et al. 2014, A&A, 567, A125
- Genzel et al. (2012) Genzel, R., Tacconi, L. J., Combes, F., et al. 2012, ApJ, 746, 69
- Genzel et al. (2013) Genzel, R., Tacconi, L. J., Kurk, J., et al. 2013, ApJ, 773, 68
- Genzel et al. (2014) Genzel, R., Förster Schreiber, N. M., Rosario, D., et al. 2014, ApJ, 796, 7
- Genzel et al. (2015) Genzel, R., Tacconi, L. J., Lutz, D., et al. 2015, ApJ, 800, 20
- Green et al. (2014) Green, A. W., Glazebrook, K., McGregor, P. J., et al. 2014, MNRAS, 437, 1070
- Greve et al. (2014) Greve, T. R., Leonidaki, I., Xilouris, E. M., et al. 2014, ApJ, 794, 142
- Harris et al. (2010) Harris, A. I., Baker, A. J., Zonak, S. G., et al. 2010, ApJ, 723, 1139
- Ivison et al. (2011) Ivison, R. J., Papadopoulos, P. P., Smail, I., et al. 2011, MNRAS, 412, 1913
- Ivison et al. (2013) Ivison, R. J., Swinbank, A. M., Smail, I., et al. 2013, ApJ, 772, 137
- Kereš et al. (2005) Kereš, D., Katz, N., Weinberg, D. H., & Davé, R. 2005, MNRAS, 363, 2
- Komatsu et al. (2014) Komatsu, E., Bennett, C. L., Barnes, C., et al. 2014, Progress of Theoretical and Experimental Physics, 2014, 06B102
- Leroy et al. (2014) Leroy, A. K., Bolatto, A. D., Ostriker, E. C., et al. 2014, arXiv.org, 2836
- Lilly et al. (2013) Lilly, S. J., Carollo, C. M., Pipino, A., Renzini, A., & Peng, Y. 2013, ApJ, 772, 119
- Mauersberger et al. (1999) Mauersberger, R., Henkel, C., Walsh, W., & Schulz, A. 1999, A&A, 341, 256
- Muñoz-Mateos et al. (2007) Muñoz-Mateos, J. C., Gil de Paz, A., Boissier, S., et al. 2007, ApJ, 658, 1006
- Narayanan & Krumholz (2014) Narayanan, D., & Krumholz, M. R. 2014, MNRAS, 442, 1411
- Newman et al. (2014) Newman, S. F., Buschkamp, P., Genzel, R., et al. 2014, ApJ, 781, 21
- Noeske et al. (2007) Noeske, K. G., Weiner, B. J., Faber, S. M., et al. 2007, ApJ, 660, L43
- Oppenheimer et al. (2010) Oppenheimer, B. D., Davé, R., Kereš, D., et al. 2010, MNRAS, 406, 2325
- Papadopoulos et al. (2012) Papadopoulos, P. P., van der Werf, P., Xilouris, E., Isaak, K. G., & Gao, Y. 2012, ApJ, 751, 10
- Papadopoulos et al. (2011) Papadopoulos, P. P., van der Werf, P., Xilouris, E. M., et al. 2011, arXiv.org, 4176
- Perley & Butler (2013) Perley, R. A., & Butler, B. J. 2013, ApJS, 204, 19
- Peter et al. (2007) Peter, A. H. G., Shapley, A. E., Law, D. R., et al. 2007, ApJ, 668, 23
- Regan et al. (2001) Regan, M. W., Thornley, M. D., Helfer, T. T., et al. 2001, ApJ, 561, 218
- Riechers et al. (2010) Riechers, D. A., Carilli, C. L., Walter, F., & Momjian, E. 2010, ApJLetters, 724, L153
- Riechers et al. (2011) Riechers, D. A., Carilli, C. L., Maddalena, R. J., et al. 2011, ApJLetters, 739, L32
- Rodighiero et al. (2010) Rodighiero, G., Cimatti, A., Gruppioni, C., et al. 2010, A&A, 518, L25
- Schruba et al. (2011) Schruba, A., Leroy, A. K., Walter, F., et al. 2011, AJ, 142, 37
- Sharon et al. (2015) Sharon, C. E., Baker, A. J., Harris, A. I., et al. 2015, ApJ, 798, 133
- Sharon et al. (2013) Sharon, C. E., Baker, A. J., Harris, A. I., & Thomson, A. P. 2013, ApJ, 765, 6
- Shen et al. (2003) Shen, S., Mo, H. J., White, S. D. M., et al. 2003, Monthly Notice of the Royal Astronomical Society, 343, 978
- Tacconi et al. (2008) Tacconi, L. J., Genzel, R., Smail, I., et al. 2008, ApJ, 680, 246
- Tacconi et al. (2010) Tacconi, L. J., Genzel, R., Neri, R., et al. 2010, Nature, 463, 781
- Tacconi et al. (2013) Tacconi, L. J., Neri, R., Genzel, R., et al. 2013, ApJ, 768, 74
- Taylor et al. (2005) Taylor, V. A., Jansen, R. A., Windhorst, R. A., Odewahn, S. C., & Hibbard, J. E. 2005, ApJ, 630, 784
- Weiss et al. (2007) Weiss, A., Downes, D., Walter, F., & Henkel, C. 2007, From Z-Machines to ALMA: (Sub)Millimeter Spectroscopy of Galaxies ASP Conference Series, 375, 25
- Whitaker et al. (2012) Whitaker, K. E., van Dokkum, P. G., Brammer, G., & Franx, M. 2012, ApJLetters, 754, L29
- Yao et al. (2003) Yao, L., Seaquist, E. R., Kuno, N., & Dunne, L. 2003, ApJ, 588, 771
- Young & Scoville (1991) Young, J. S., & Scoville, N. Z. 1991, ARA&A, 29, 581
- Young et al. (1995) Young, J. S., Xie, S., Tacconi, L., et al. 1995, ApJSupplement Series, 98, 219