Highly reddened type Ia supernova SN 2004ab: another case of anomalous extinction
Abstract
We present optical photometric and spectroscopic results of supernova SN 2004ab, a highly reddened normal type Ia supernova. The total reddening is estimated as = 1.70 0.05 mag. The intrinsic decline rate parameter, is 1.27 0.05, and -band absolute magnitude at maximum is 19.31 0.25 mag. The host galaxy NGC 5054 is found to exhibit anomalous extinction with very low value of = 1.41 0.06 in the direction of SN 2004ab. Peak bolometric luminosity is derived as = 43.10 0.07 erg s-1. The photospheric velocity measured from absorption minimum of Si ii 6355 line shows a velocity gradient of = 90 km s-1 d-1, indicating that SN 2004ab is a member of the high velocity gradient (HVG) subgroup. The ratio of strength of Si ii 5972 and 6355 absorption lines, (Si ii) is estimated as 0.37, while their pseudo equivalent widths suggest that SN 2004ab belongs to broad line (BL) type subgroup.
keywords:
supernovae: general – supernovae: individual: SN 2004ab – galaxies: individual: NGC 5054 – techniques: photometric – techniques: spectroscopic1 Introduction
The correlation of absolute magnitude of type Ia supernovae (SNe Ia) with their observed properties such as the decline in -band magnitude from its peak to 15 days after peak (Phillips, 1993; Phillips et al., 1999), stretch parameter (Perlmutter et al., 1997), shape of the light curve (Riess, Press & Kirshner, 1996), colour (Reindl et al., 2005; Wang et al., 2006) and spectroscopic parameters (Nugent et al., 1995; Benetti et al., 2005) have made SNe Ia very important astronomical events, as they provide means to calibrate the luminosity at maximum. Further, the high luminosities of SNe Ia enable us to see them at very far distances in the universe and use them as a standard candle for distance estimation.
The observed properties and theoretical investigations suggest that SNe Ia are a result of the explosion of a Carbon-Oxygen white dwarf (WD, Hoyle & Fowler 1960) that gains mass via accretion in a binary system or due to merging with another WD. The binary companion may be a main sequence/red giant star (single-degenerate scenario; Whelan & Iben 1973) or another WD (double-degenerate scenario; Iben & Tutukov 1984; Webbink 1984). As the mass of the WD reaches close to Chandrasekhar limit (Chandrasekhar, 1931), an instability sets in, leading to thermonuclear runaway fusion reaction disrupting the WD. However, the exact nature of the progenitor and explosion scenario are still debated (Maoz, Mannucci & Nelemans, 2014) and need to be addressed properly for use of SNe Ia in precision cosmology (Howell, 2011).
An estimate of the reddening suffered by SNe Ia and to correct for it is very important for using them as distance indicators. Though majority of SN host galaxies show extinction properties similar to that of Milky Way, consistent with total to selective extinction ratio of = 3.1, this value is found to be significantly lower in the direction of SNe Ia in many host galaxies (Krisciunas et al., 2006; Elias-Rosa et al., 2006; Krisciunas et al., 2007; Wang et al., 2008; Folatelli et al., 2010; Amanullah et al., 2014). Departure of from that of Galactic value is generally referred as non-standard extinction. Several studies suggest that non-standard extinction with lower than 3.1 is shown mostly by SNe Ia which are significantly reddened (Jha, Riess & Kirshner 2007; Folatelli et al. 2010; Chotard et al. 2011; Mandel et al. 2011; Scolnic et al. 2014).
The reddening of SNe Ia arises from at least two different sources: the first one, causing small amount of reddening seen in most SNe Ia is consistent with the properties of interstellar dust in the Milky Way, while the second source responsible for reddening in the highly-extincted objects is characterised by an unusually low value of (Phillips, 2012). Wang (2005) and Goobar (2008) suggest that low value of could result from multiple scattering of light due to dust in the circumstellar medium (CSM). It is shown by Goobar (2008) and Amanullah et al. (2014) that extinction properties of highly-reddened objects with low value of follow a power law.
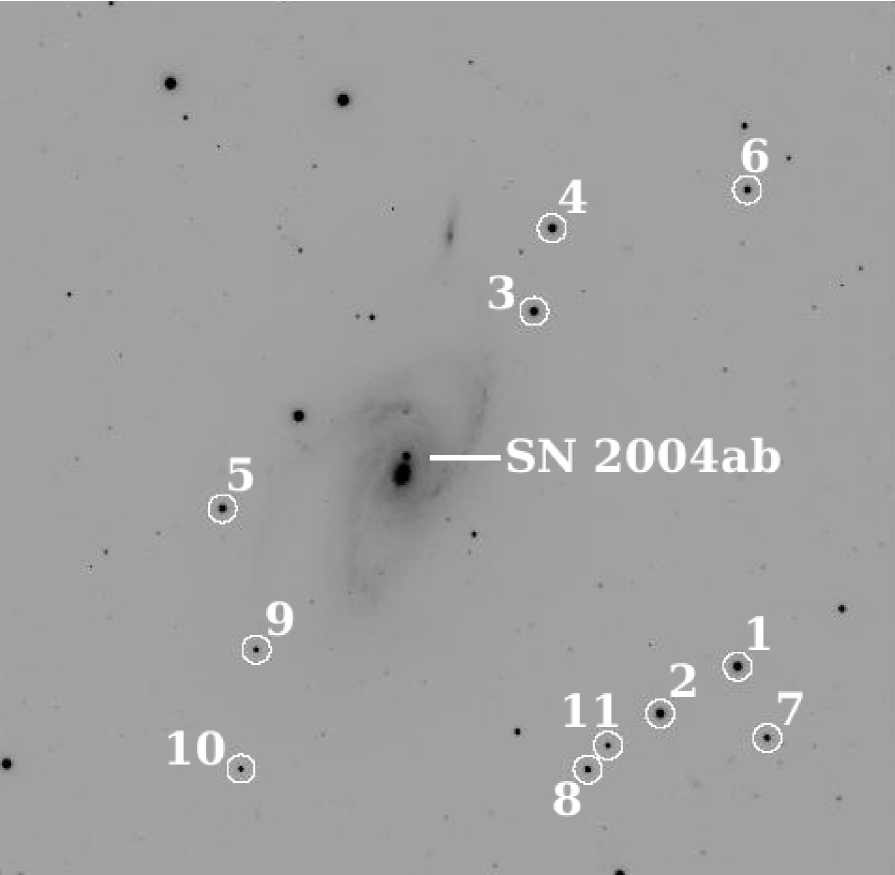
In this paper, we present optical photometric and medium-resolution spectroscopic analysis of a highly reddened type Ia supernova SN 2004ab. It was discovered on 2004 February 21.98 (ut), at 2 arcsec west and 11 arcsec north (refer Fig. 1) of the center of NGC 5054 (Monard & Vanmunster, 2004). NGC 5054 is an SA(s)bc type galaxy at a redshift of = 0.0058 (Pisano et al., 2011, source NED). SN 2004ab was classified as a type Ia supernova on February 24 and suggested to be a highly reddened supernova, caught about one week after maximum light. The expansion velocity measured using absorption minimum of Si ii 6355 was 10400 km s-1 (Matheson et al., 2004).
The paper is organized as follows. Section 2 describes the observation and data reduction techniques. Photometric results are presented in Section 3. Anomalous extinction of host galaxy NGC 5054 is discussed in Section 4. Absolute and bolometric luminosities are estimated in Section 5. Spectroscopic results are presented in Section 6. The paper is summarized in Section 7.
2 OBSERVATIONS AND DATA REDUCTION
2.1 Imaging
Observations of SN 2004ab were carried out using the Himalaya Faint Object Spectrograph Camera (HFOSC) attached to the 2-m Himalayan Chandra Telescope (HCT) of Indian Astronomical Observatory (IAO), Hanle, India. HFOSC is equipped with a 2K4K pixels, SITe CCD chip. The central 2K2K pixels of the chip with a field of view of 10 10 arcmin2, at a plate scale of 0.296 arcsec pixel-1 was used for imaging observations. The HFOSC CCD has gain of 1.22 electron ADU-1 and readout noise of 4.87 electrons.
The photometric monitoring of SN 2004ab began on 2004 February 24 and continued till 2004 June 22 in Bessell’s , , and filters. Landolt (1992) standard star fields were observed on 2004 February 24 (PG0918+029, PG0942-029, SA101, SA104), March 01 (PG0918+029, PG1047+003, PG1323-086, PG1530+057), March 10 (PG0918+029, PG0942-029, PG1047+003, PG1323-086) and May 11 (PG1633+099, PG1657+078, SA107) under photometric conditions. These fields were used to estimate the atmospheric extinction and transformation co-efficients, and to calibrate a sequence of secondary standards in the supernova field. Standard fields were monitored in the airmass range 1.1–2.0 for estimting atmospheric extinction whereas for determining transformation co-efficients we restricted to airmass range of 1.1–1.4.
The CCD images were processed using standard iraf111iraf is distributed by the National Optical Astronomy Observatories, which are operated by the Association of Universities for Research in Astronomy, Inc., under cooperative agreement with the National Science Foundation routines. The images were bias corrected with a median combined master bias frame obtained using all the bias frames taken throughout the night. Flat-field correction was done using the median combined normalized flat-field images of the twilight sky in different bands. Cosmic ray hits were removed from the flat-field corrected images.
Aperture photometry was performed on the stars of Landolt standard fields using DAOPHOT package of iraf. Bright stars in the Landolt standard field were used to determine the aperture growth curve and compute aperture corrections by measuring the magnitude difference at an aperture radius 3-4 times the full width half maximum (FWHM) and at an aperture close to the FWHM of the stellar profile. Magnitudes of Landolt standard stars were obtained by applying the aperture corrections to the magnitude determined at a radius (close to the FWHM) that maximized the signal-to-noise (S/N) ratio. The nightly extinction co-efficients in different bands were determined. The observed magnitudes of the Landolt standards were corrected for atmospheric extinction using the estimated nightly extinction co-efficients. Finally, the corrected magnitudes of Landolt standards were used to derive the colour terms and photometric zero points on each night.
We selected a sequence of stars in the field of SN 2004ab (marked in Fig. 1) to use as secondary standards. Aperture photometry, as discussed above, was performed on these stars on the nights when Landolt standard stars were obeserved. Magnitudes of this sequence of stars were determined by applying aperture corrections computed using bright stars in the field of SN 2004ab. The observed magnitudes were extinction corrected using the nightly extinction co-efficients. The extinction corrected magnitudes were then calibrated using colour terms and zero points obtained using observations of Landolt standards.
The average magnitudes of the sequence of secondary standards in the field of SN 2004ab are given in Table 1. The errors associated with magnitudes of secondary standards are the standard deviation of the magnitudes obtained on the four calibration nights. These secondary standards were used to calibrate the supernova magnitude obtained on other nights.
SN 2004ab occurred close to the nucleus of the host galaxy, in a region with very high and highly varying background (refer Fig. 1). The contamination of galaxy background prohibits proper estimation of supernova magnitude. Hence, template subtraction method was used to subtract the galaxy background. The template frames were prepared from the multiple deep exposures of host galaxy NGC 5054, obtained with the same instrumental setup and under good seeing condition on 2005 May 28. Template frames were subtracted from the supernova frames of respective bands. This leaves behind only the supernova. Magnitudes of the supernova and secondary standards were extracted by aperture photometry with a smaller aperture radius ( FWHM). The aperture correction, determined using bright stars in the supernova field was applied to the extracted magnitudes of supernova and secondary standards. The nightly zero-points, determined from the observed and calibrated magnitudes of secondary standards and average of derived colour terms for four nights, were used to calibrate the supernova magnitudes. As the reddening in the direction of SN 2004ab is high (refer Section 4), effect of second order extinction was taken into account in all the calibration process. The derived supernova magnitudes are listed in Table 2. The final error in the supernova magnitudes was estimated by adding in quadrature the photometric error at an aperture with maximum S/N ratio (i.e. photometric error computed by iraf), error in aperture correction, and the error associated with nightly photometric zero-points.
| ID | B | V | R | I |
|---|---|---|---|---|
| 1 | 14.773 0.033 | 14.055 0.017 | 13.637 0.017 | 13.246 0.005 |
| 2 | 15.144 0.035 | 14.227 0.016 | 13.667 0.015 | 13.111 0.009 |
| 3 | 14.875 0.032 | 14.241 0.013 | 13.851 0.018 | 13.475 0.010 |
| 4 | 15.175 0.031 | 14.347 0.013 | 13.867 0.016 | 13.421 0.017 |
| 5 | 15.343 0.034 | 14.693 0.020 | 14.290 0.023 | 13.921 0.024 |
| 6 | 16.044 0.024 | 15.226 0.010 | 14.753 0.012 | 14.306 0.011 |
| 7 | 15.954 0.037 | 15.372 0.017 | 15.001 0.016 | 14.627 0.004 |
| 8 | 17.518 0.048 | 16.082 0.013 | 15.119 0.017 | 14.139 0.011 |
| 9 | 16.916 0.021 | 16.326 0.017 | 15.953 0.014 | 15.581 0.024 |
| 10 | 17.106 0.022 | 16.456 0.015 | 16.047 0.023 | 15.665 0.008 |
| 11 | 17.640 0.058 | 16.557 0.014 | 15.873 0.016 | 15.278 0.003 |
| Date | JDa | Phaseb | B | V | R | I |
|---|---|---|---|---|---|---|
| 24/02/2004 | 3060.44 | 3.62 | 16.867 0.008 | 15.154 0.006 | 14.461 0.011 | 14.100 0.014 |
| 25/02/2004 | 3061.49 | 4.67 | 16.880 0.011 | 15.133 0.007 | 14.450 0.012 | 14.100 0.016 |
| 26/02/2004 | 3062.41 | 5.59 | 16.958 0.011 | 15.161 0.014 | 14.479 0.011 | 14.122 0.008 |
| 27/02/2004 | 3063.38 | 6.56 | 17.031 0.009 | 15.213 0.009 | 14.532 0.006 | 14.166 0.017 |
| 28/02/2004 | 3064.35 | 7.53 | 17.078 0.007 | 15.219 0.008 | 14.586 0.004 | 14.210 0.013 |
| 29/02/2004 | 3065.40 | 8.58 | 17.167 0.008 | 15.246 0.005 | 14.638 0.005 | 14.235 0.011 |
| 01/03/2004 | 3066.42 | 9.60 | 17.269 0.009 | 15.349 0.008 | 14.739 0.010 | 14.330 0.010 |
| 04/03/2004 | 3069.39 | 12.57 | 17.528 0.032 | 15.512 0.011 | 14.890 0.013 | |
| 10/03/2004 | 3075.39 | 18.57 | 18.315 0.043 | 15.906 0.017 | 15.048 0.011 | 14.340 0.018 |
| 14/03/2004 | 3079.28 | 22.46 | 18.726 0.026 | 16.079 0.010 | 15.079 0.017 | 14.229 0.020 |
| 16/03/2004 | 3081.33 | 24.51 | 18.903 0.033 | 16.189 0.014 | 15.155 0.013 | 14.274 0.017 |
| 03/04/2004 | 3099.26 | 42.44 | 19.772 0.066 | 17.157 0.016 | 16.226 0.014 | 15.302 0.014 |
| 15/04/2004 | 3111.26 | 54.44 | 17.532 0.009 | 16.629 0.009 | 15.852 0.010 | |
| 24/04/2004 | 3120.31 | 63.49 | 17.752 0.013 | 16.890 0.017 | 16.195 0.025 | |
| 05/05/2004 | 3131.22 | 74.40 | 18.014 0.017 | 17.262 0.017 | 16.634 0.025 | |
| 11/05/2004 | 3137.23 | 80.41 | 18.147 0.022 | 17.427 0.019 | 16.879 0.026 | |
| 22/05/2004 | 3148.12 | 91.30 | 18.493 0.021 | 17.905 0.028 | 17.225 0.022 | |
| a2450000+; bObserved phase in days with respect to the epoch of band maximum: JD = 245 3056.82 | ||||||
2.2 Spectroscopy
Spectroscopic observations of SN 2004ab were carried out from 2004, February 24 to May 05 on 11 occassions. Spectra were obtained using Gr#7 (wavelength range 3500–7800 Å) and Gr#8 (wavelength range 5200–9250 Å) of HFOSC at a spectral resolution of 7 Å. Log of spectroscopic observations is given in Table 3. Spectrophotometric standard stars Feige 34, Feige 66, BD +33∘ 2642, HZ 44 and Wolf 1346 were observed for flux calibration. All the spectral data were processed in a standard manner using various tasks of iraf. One-dimensional spectra were extracted using the optimal extraction method. The dispersion solutions obtained using arc lamp spectra of FeNe and FeAr were used to wavelength calibrate the supernova spectra. Wavelength calibrated spectra were cross checked using bright night sky emission lines and wherever required, small shifts were applied. Spectrophotometric standard stars observed with broader slit on the same night or nearby nights were used to correct for the instrumental response and atmospheric extinction using average spectroscopic extinction curve for the site. The spectra obtained in Gr#7 (blue region) and Gr#8 (red region) were combined by scaling one of the spectra to the weighted mean of the other in the overlapping region, to get a single spectrum covering blue to red region. We performed bandpass spectrophotometry of the spectra using the transmissions curves of filters available with the HFOSC. The photometric flux obtained using available photometry is compared with the spectroscopic flux within a given bandpass, and the scale factor was determined in each band. A cubic spline curve going through the scale factor in each band was fit and the spectra were scaled using this curve to match photometric and spectroscopic fluxes. This way the combined spectra were brought to an absolute flux scale. The spectra were then dereddened and corrected for the redshift of the host galaxy NGC 5054, using = 0.0058 (Pisano et al., 2011, source NED).
3 Photometric results
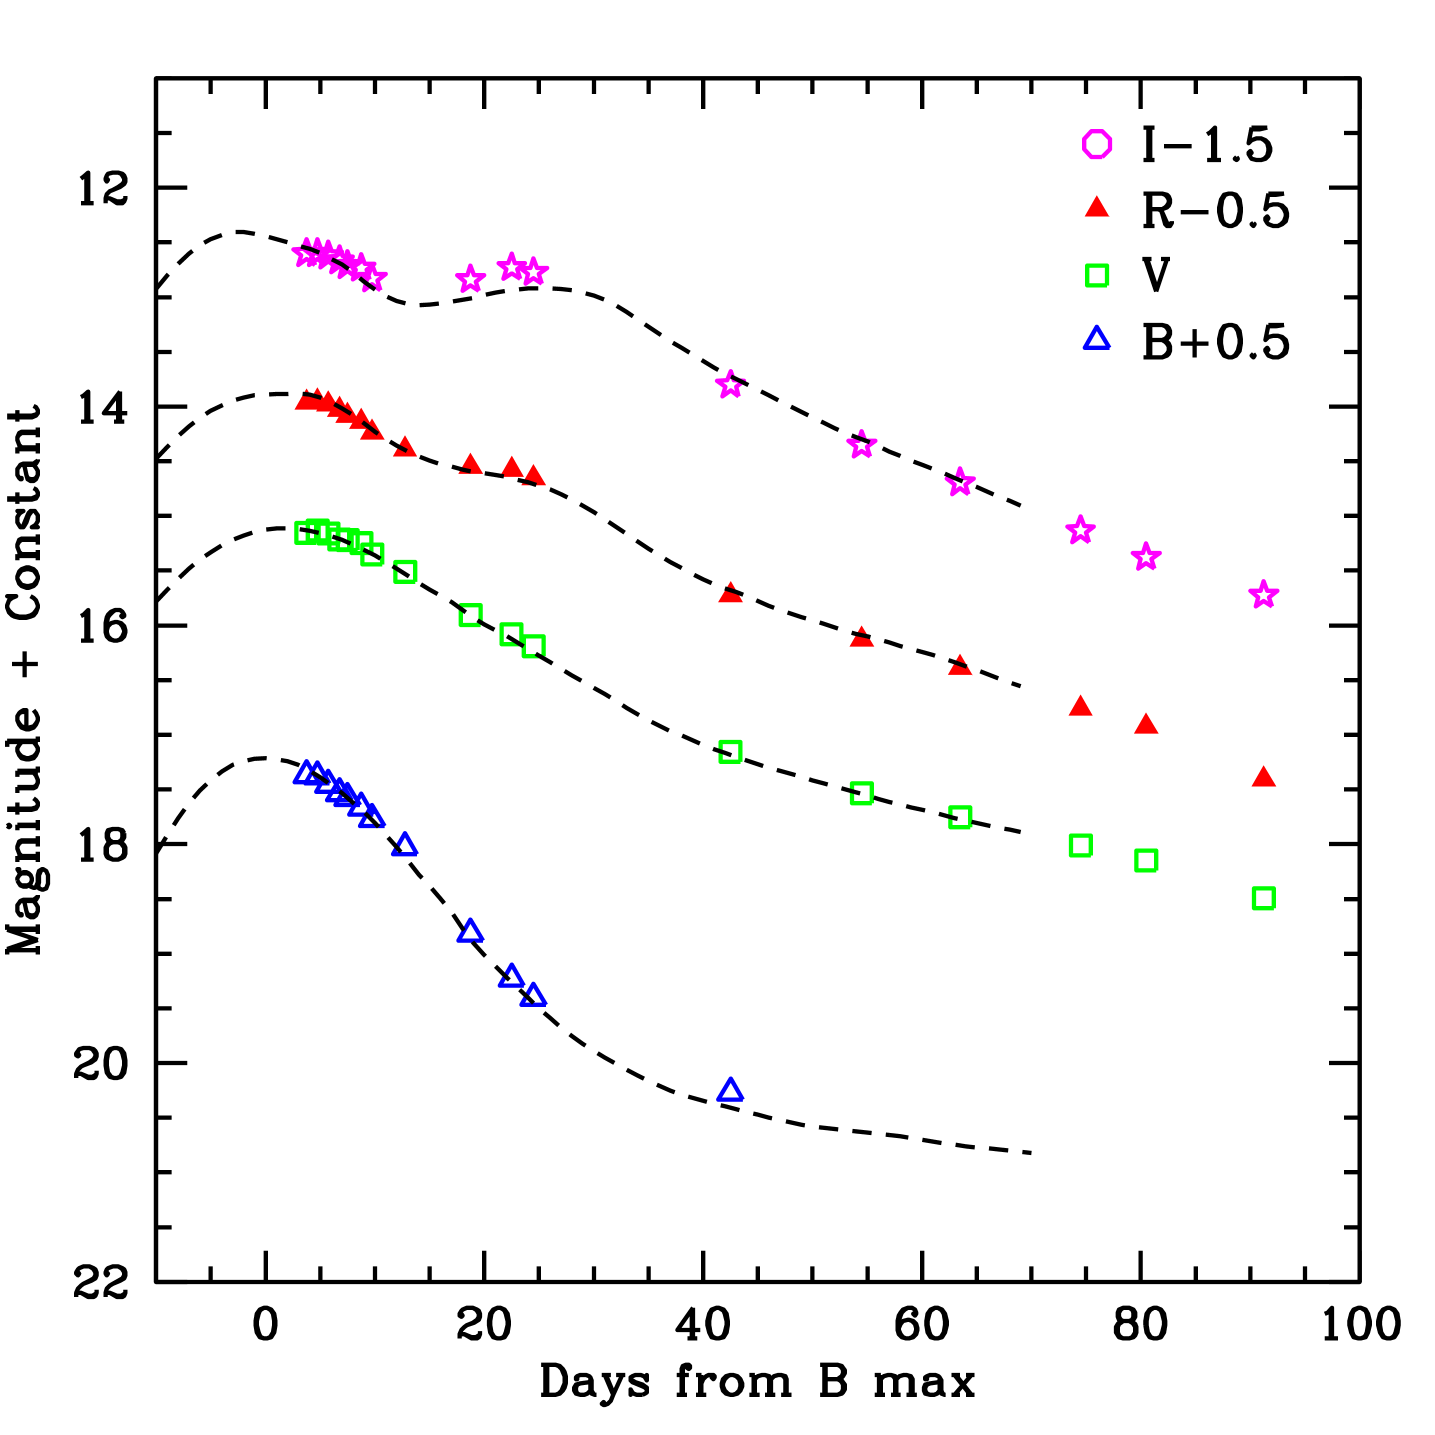
The light curves of SN 2004ab are presented in Fig. 2. SN 2004ab was discovered post-maximum and our monitoring started 3 d after the discovery. To determine the date of maximum and brightness at maximum, we used the SNooPy (Burns et al., 2011) software package, developed by the Carnegie Supernova Project (CSP), for analysing light curves of SNe Ia.
The best matching templates to the observed light curves of SN 2004ab, generated using SNooPy are shown in Fig. 2 alongwith the observed light curves. The date of maximum and peak brightness in different bands, obtained using template fit are listed in Table 4. The maximum in , and band occurred +1.5, +2.8 and 2 d, relative to band maximum. This is in accordance with the observed trend in normal SNe Ia, where maximum in band precedes and in and band follows maximum in band. The maximum brightness in , , and band is estimated as 16.71, 15.11, 14.38 and 13.90 magnitudes, respectively. Similar to normal SNe Ia, SN 2004ab also shows a shoulder in band and a pronounced secondary maximum in band. The secondary maximum in band is 0.5 mag fainter with respect to first maximum and occurred after 25 d.
| Date | JDa | Phaseb | Range (Å) |
| 24/02/2004 | 3060.50 | 3.68 | 3500–7800 |
| 25/02/2004 | 3061.50 | 4.68 | 3500–7800 |
| 26/02/2004 | 3062.43 | 5.61 | 3500–7800 |
| 28/02/2004 | 3064.37 | 7.55 | 3500–7800; 5200–9250 |
| 29/02/2004 | 3065.35 | 8.53 | 3500–7800; 5200–9250 |
| 04/03/2004 | 3069.36 | 12.54 | 3500–7800; 5200–9250 |
| 08/03/2004 | 3073.46 | 16.64 | 3500–7800; 5200–9250 |
| 14/03/2004 | 3079.33 | 22.51 | 3500–7800; 5200–9250 |
| 03/04/2004 | 3099.33 | 42.51 | 3500–7800; 5200–9250 |
| 26/04/2004 | 3122.20 | 65.38 | 3500–7800; 5200–9250 |
| 05/05/2004 | 3131.25 | 74.43 | 3500–7800; 5200–9250 |
| a2450000+; bin days relative to band maximum. | |||
The decline rate parameter, for SN 2004ab is estimated as 1.17. Decline rate parameters and rate of light curve decline during the late phase (40–90 d) in bands estimated by least square fit to the observed data are listed in Table 4. Phillips et al. (1999) have shown that reddening acts to decrease the decline rate. Hence, the measured decline rate parameter needs to be corrected for reddening. The observed decline rate parameter translates to the intrinsic decline rate parameter = 1.27, after correcting for reddening (refer Section 4) using the updated relation by Folatelli et al. (2010).
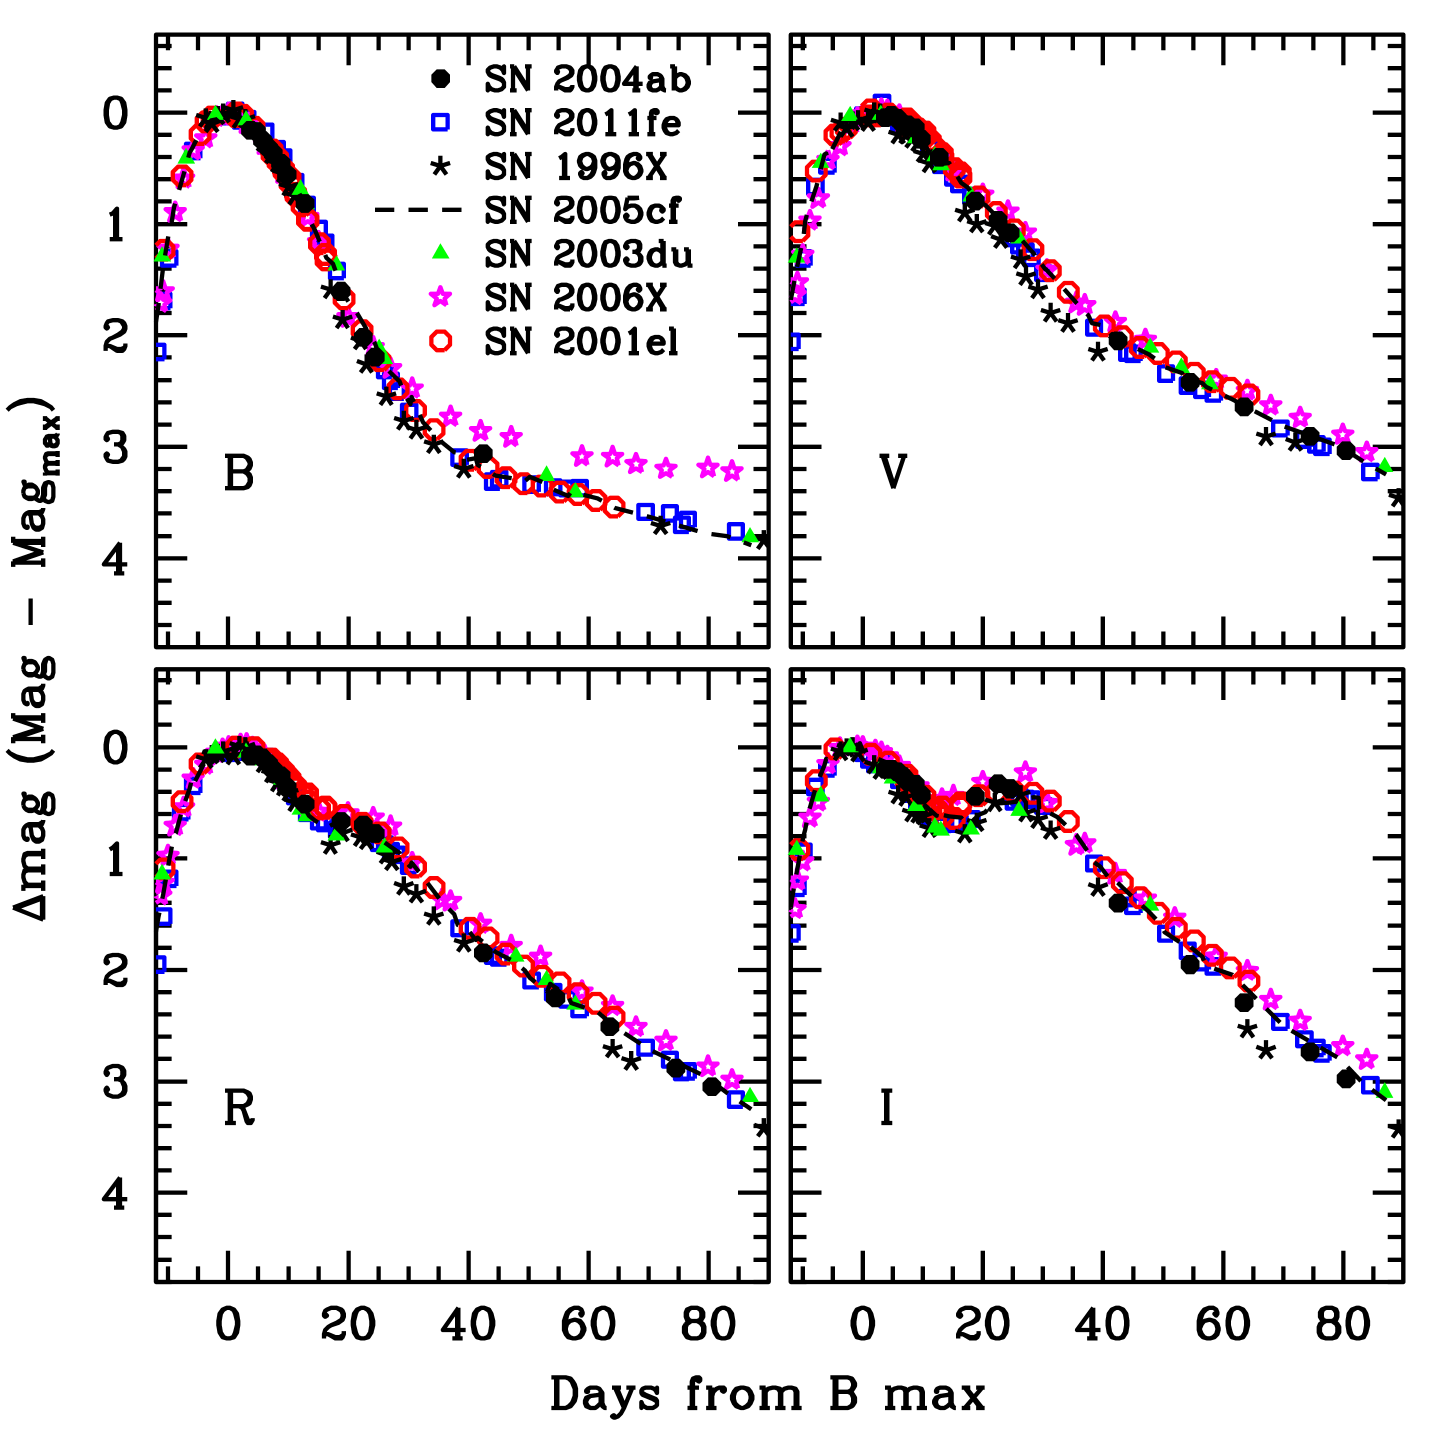
In Fig. 3, the light curves of SN 2004ab are compared with those of SN 1996X ( =1.31; Salvo et al. 2001), SN 2001el ( = 1.13; Krisciunas et al. 2003), SN 2003du ( = 1.04; Anupama, Sahu & Jose 2005; Stanishev et al. 2007), SN 2005cf ( = 1.12; Pastorello et al. 2007b; Wang et al. 2009b) and SN 2006X ( =1.31; Wang et al. 2008), SN 2011fe ( = 1.07; Vinkó et al. 2012; Richmond & Smith 2012). All the light curves have been shifted to match their peak magnitude in the respective bands and to the epoch of band maximum. The band light curve of SN 2004ab closely resembles those of SN 2001el, SN 2003du, SN 2005cf and SN 2011fe (till 25 d). In and band, the light curve of SN 2004ab is similar to those of SN 2003du, SN 2005cf and SN 2011fe. The early phase light curve of SN 2004ab in band looks similar to that of SN 2001el. After secondary maximum, SN 2004ab is fainter than SN 2001el. Light curve of SN 2004ab is wider than SN 1996X in all the bands.
| Band | JD (max)a | Decline Ratec | ||||
| Total | during 40–90 d | |||||
| 3056.8 0.5 | 16.71 0.05 | 4.15 0.19 | 19.31 0.25 | 1.17 0.05 | - | |
| 3058.3 0.5 | 15.11 0.04 | 2.51 0.11 | 19.28 0.19 | 0.64 0.04 | 2.645 | |
| 3059.6 0.5 | 14.38 0.05 | 1.82 0.08 | 19.31 0.18 | 0.70 0.05 | 3.352 | |
| 3054.8 0.5 | 13.90 0.05 | 1.00 0.04 | 18.97 0.16 | 0.66 0.05 | 3.950 | |
| a245 0000+; bFor = 31.87 and = 1.41 | ||||||
| cIn unit of mag (100 d)-1 and epoch is relative to band maximum. | ||||||
4 Anomalous extinction of host galaxy towards SN 2004ab
SN 2004ab occurred very close to the nucleus of the host galaxy NGC 5054. Hence, a substantial amount of reddening due to ISM within the host galaxy is expected. The spectra of SN 2004ab show strong narrow Na i D absorption lines (refer Section 6) at the rest frame of host galaxy with an average equivalent width (EW) of 3.3 Å. Matheson et al. (2004) also reported similar EW of narrow Na i D lines. The measured EW gives reddening of = 0.53 and 1.68 mag, on using the two relations of Turatto, Benetti & Cappellaro (2003) between EW of Na i D lines and .
Reddening suffered by SN 2004ab is also estimated using various photometric methods. The relations between the observed SN colour at maximum and (Phillips et al., 1999; Altavilla et al., 2004) give total reddening of 1.65 mag. The relation of Wang et al. (2006) between the colour measured at 12 d after the band maximum (referred as ) and decline rate parameter gives as 1.66 mag. The method of Reindl et al. (2005) gives total reddening of 1.60 mag at maximum and 1.70 mag at 35 d after maximum. Average of all the reddening values derived using photometric methods is 1.65 0.04 mag.
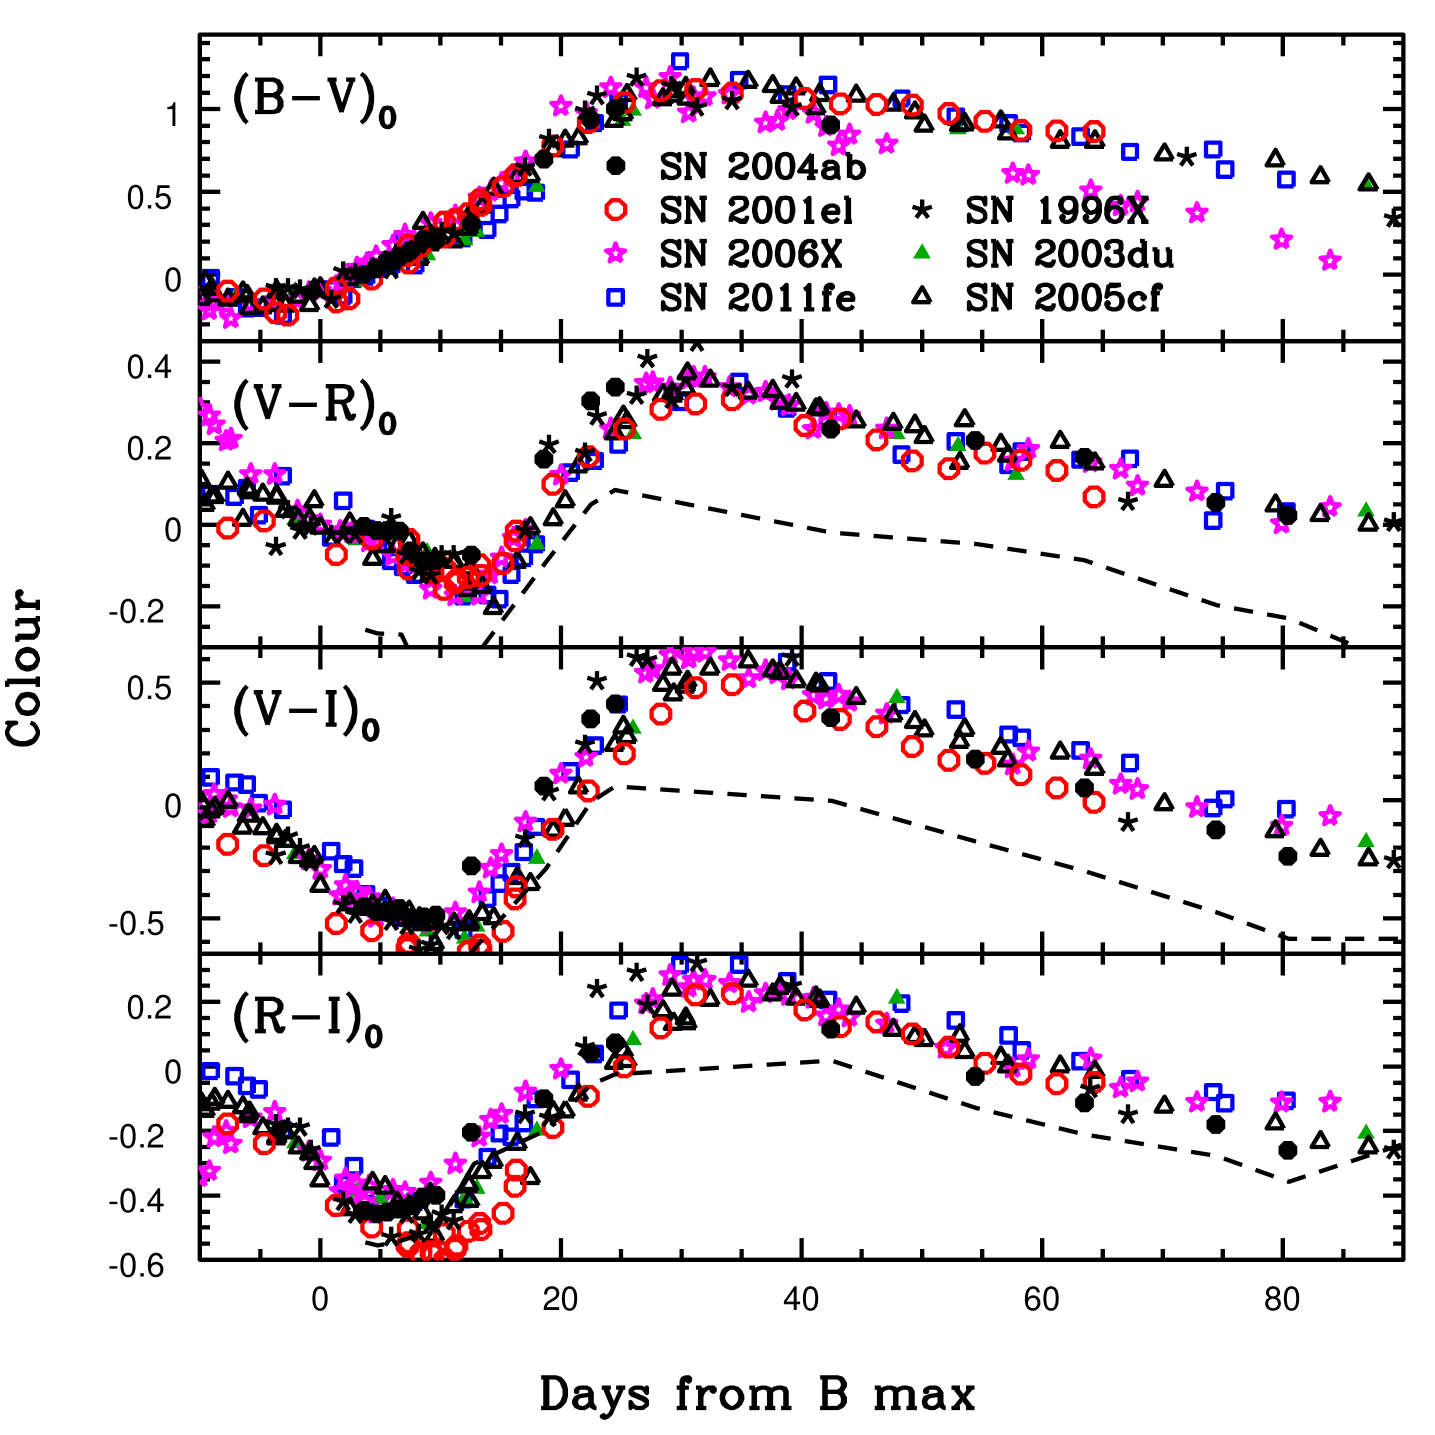
Contribution of reddening due to ISM within our Galaxy is = 0.07 (Schlegel, Finkbeiner & Davis, 1998; Schlafly & Finkbeiner, 2011). As an alternative method to estimate reddening suffered by SN 2004ab, we compared the observed colour of SN 2004ab with reddening corrected colour curves of well studied SNe Ia (refer Fig. 4). The colour curves are dereddened using the reddening values mentioned in the respective references. The colour curve of SN 2004ab was then shifted to match with the colour curves of other SNe used in comparison. A minimization was used to estimate the offset between colour curve of SN 2004ab and those of other SNe. After shifting the colour curve of SN 2004ab by 1.70 0.05 mag, it matches well with those of other SNe (refer Fig. 4). This value of colour excess is consistent with the derived using photometric and spectroscopic methods. For further analysis we have used = 1.70 mag as total reddening for SN 2004ab.
From the colour excess , the extinction in band is estimated using the following relation,
| (1) |
where is the ratio of total-to-selective extinction. Using the standard Galactic value of = 3.1 and the estimated value of = 1.70 mag, the above relation gives total extinction in band as = 5.27 mag.
NGC 5054, the host galaxy of SN 2004ab, has a radial velocity corrected for local group infall onto Virgo cluster of 1704 km s-1 (LEDA database). Assuming = 72 km s-1 Mpc-1 (Freedman et al., 2001), we derived distance modulus of = 31.87 0.15 mag for NGC 5054. This leads to band peak absolute magnitude of SN 2004ab, = 22.03 0.15 mag, making it brighter by more than 2 magnitudes than the normal SNe Ia. This indicates that = 3.1 is not applicable to the host galaxy component of extinction for SN 2004ab.
4.1 Estimation of using photometry
Several studies have suggested lower values of than its canonical value of 3.1 towards SNe Ia in their host galaxies (Elias-Rosa et al., 2006; Krisciunas et al., 2006, 2007; Wang et al., 2008; Folatelli et al., 2010; Amanullah et al., 2014). This indicates that the extinction properties of dust in the host galaxies, towards SNe Ia is different from those of Milky Way. The lower value of is an indicator of smaller dust grains compared to that of the Milky Way. This type of dust is generally referred as non-standard dust and the reddening resulting from it as non-standard reddening. The extinction due to dust in our Galaxy is explained with the model of Cardelli, Clayton & Mathis (1989) commonly known as CCM model. Extinction in this model is parametrized by the following relation,
| (2) |
where , and are wavelength-dependent co-efficients. Krisciunas et al. (2006) have suggested that the co-efficients of reddening model for host galaxies of SNe Ia, should be derived from SED of SNe rather than from the SED of normal stars. They have derived values of and for bands using type Ia spectral template of Nugent, Kim & Perlmutter (2002). To estimate towards SN 2004ab in the host galaxy, we used dereddened colour curves of well studied SNe Ia. The reddening corrected , , and colour curves of these SNe are plotted in Fig. 4.
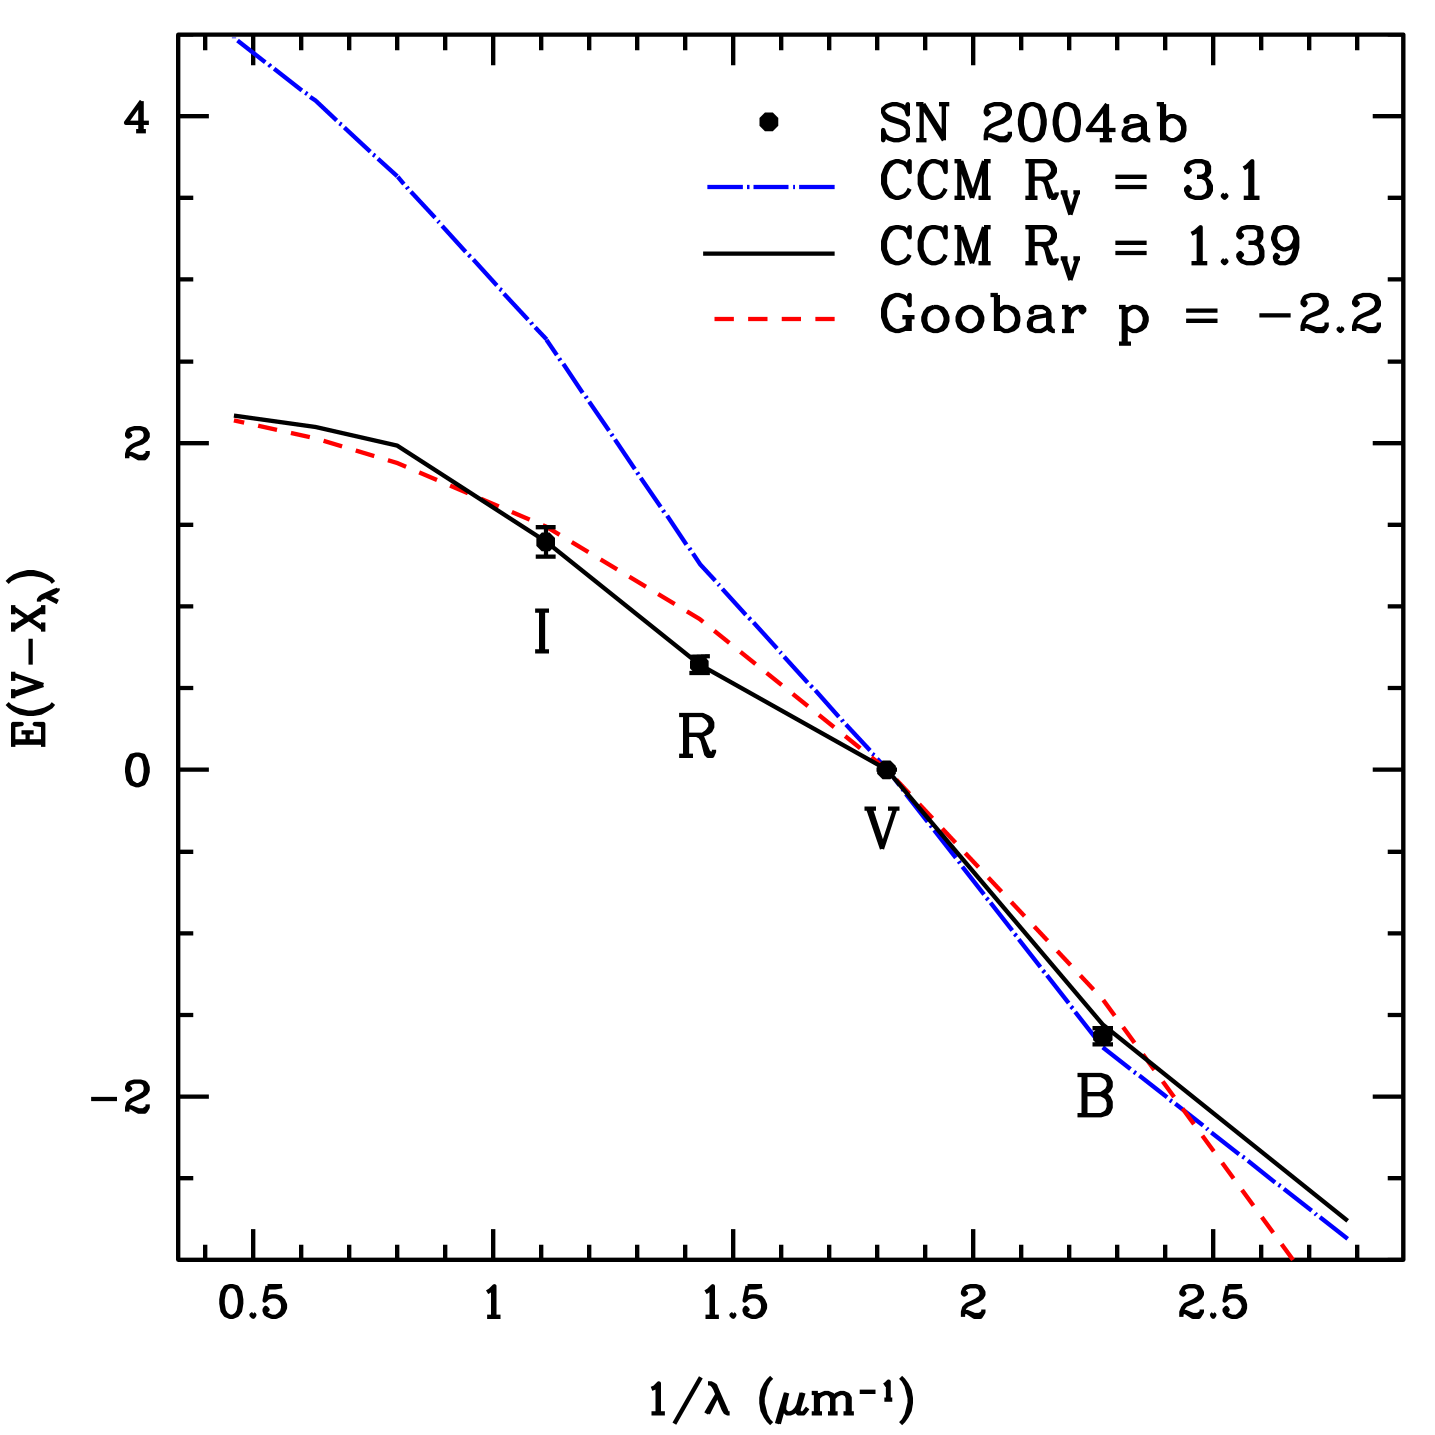
The colour curves of SN 2004ab are first corrected for the Galactic extinction of = 0.07 mag, and then for = 1.63 using CCM extinction law with varying . A minimization was used to estimate the value of using which the dereddened , and colour curves of SN 2004ab match with those of well studied SNe Ia. It is found that with = 1.39 0.05 and values of , as derived by Krisciunas et al. (2006), the dereddened colour curves of SN 2004ab match well with colour curves of normal SNe Ia used in comparison. Using this analysis we derived = 0.64 0.06 mag, = 1.39 0.09 mag and = 0.75 0.07 mag. The values of and from Cardelli et al. (1989) give poor fit (shown by dashed lines in Fig. 4). The derived value of = 1.39 towards SN 2004ab in the host galaxy is smaller than the canonical value of = 3.1 for Milky Way. There are many host galaxies showing smaller value of towards SNe Ia, some of them are listed in Table LABEL:tab04ab_Rv.
Alternative to CCM, the extinction model with power-law of type = (, expected from the multiple scattering of light due to a dusty CSM is proposed (Goobar, 2008; Amanullah et al., 2014). The multiple scattering of photons by circumstellar dust steepens the effective extinction law. The measured colour excess of SN 2004ab is fit with this power law. A reasonably good fit is achieved for . The fit is shown in Fig. 5 along with the CCM model with = 1.39 and = 3.1.
4.2 Spectroscopic view of extinction
The anomalous extinction of SN 2004ab is also verified using spectroscopic method described by Elias-Rosa et al. (2006). In this method optical Spectral Energy Distribution (SED) of a reddened SN is compared with those of unreddened reference SNe Ia, at similar epochs. For this, SN 1994D (Patat et al., 1996) and SN 1996X (Salvo et al., 2001), having similar decline rate parameters are selected as reference objects. All the spectra are dereddened for Galactic extinction and redshift corrected. After this, the reference spectra were scaled to the distance of SN 2004ab. Extinction as a function of wavelength is derived using the formula
| (3) |
where and are the observed fluxes of SN 2004ab and the reference SN scaled to the distance of SN 2004ab, respectively. The extinction curve is obtained by normalizing the derived extinction at the band effective wavelength. We used three pairs of SN 1994D–2004ab and two pairs of SN 1996X–2004ab, a total five pairs of spectra for the analysis. To derive the value of , we fit CCM model to extinction curves of SN 2004ab. Three examples of fit are shown in Fig. 6. It is clear that CCM model with = 3.1 deviates for SN 2004ab, whereas the model extinction curve with lower value of ( 1.4) fits the derived extinction curve reasonably well. The best fit values of are also listed in Fig. 6. The derived extinction curve is also consistent with the Fitzpatrick parametrization (Fitzpatrick, 1999) of extinction curve with 1.4.
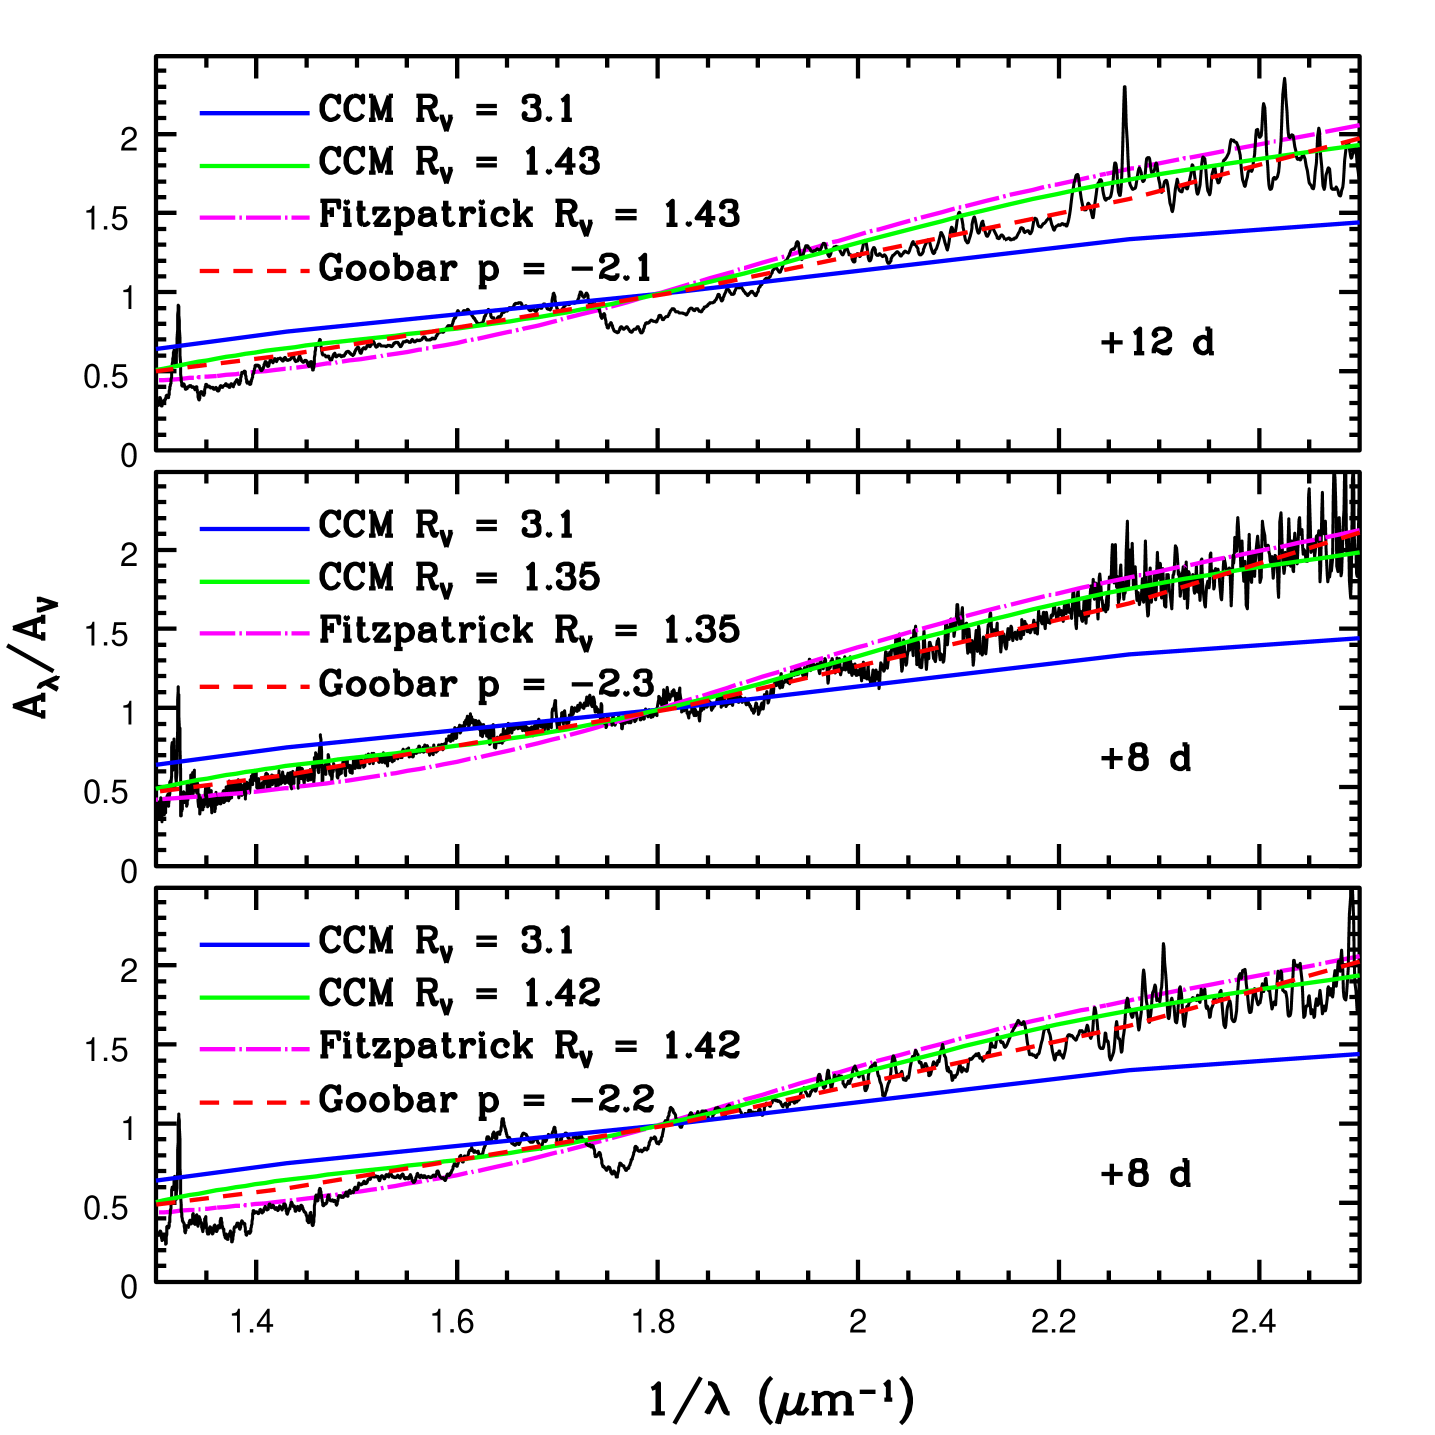
An attempt is made to fit the derived extinction curve of SN 2004ab with power law extinction model, = ( of Goobar (2008). The best fit model extinction curves and corresponding values of the power law index are shown in Fig. 6. From the analysis of five pairs of spectra we estimate mean value of = 1.41 0.03, which is similar to that derived from photometric method. Combining the results obtained from spectroscopic (five pairs of spectra) and photometric methods, we derive = 1.41 0.06. This value of is used in further analysis.
| SN | Host Galaxy | Reference | |||
|---|---|---|---|---|---|
| 1999cl | NGC 4501 | 1.29 0.08 | 1.24 0.07 | 1.55 0.08 | Krisciunas et al. (2006) |
| 2001el | NGC 1448 | 1.15 0.04 | 0.21 0.05 | 2.15 0.23 | Krisciunas et al. (2003) |
| 2003cg | NGC 3169 | 1.25 0.05 | 1.33 0.11 | 1.80 0.19 | Elias-Rosa et al. (2006) |
| 2005A | NGC 958 | 1.34 0.03 | 1.11 0.07 | 1.68 0.10 | Folatelli et al. (2010) |
| 2006X | NGC 4321 | 1.31 0.05 | 1.42 0.04 | 1.48 0.06 | Wang et al. (2008) |
| 2014J | M82 | 1.08 0.03 | 1.37 0.03 | 1.40 0.10 | Amanullah et al. (2014) |
| Srivastav et al. (2016) | |||||
| 2004ab | NGC 5054 | 1.27 0.05 | 1.63 0.05 | 1.41 0.06 | This work |
5 Absolute and bolometric luminosity
The total extinction suffered by SN 2004ab in bands are derived (using = 1.41) as 4.15 0.19, 2.51 0.11, 1.82 0.08 and 1.00 0.04 mag, respectively. Using these values and distance modulus of = 31.87 mag, the peak absolute magnitudes in different bands are calculated and listed in Table 4.
Alternatively, peak absolute magnitudes can also be estimated using empirical Luminosity decline rate relation. Peak absolute magnitudes of type Ia SNe are known to correlate with (Phillips et al., 1999). Using the calibration by Folatelli et al. (2010), we derived band peak absolute magnitude of SN 2004ab as 19.24 0.20 mag, consistent with the value given in Table 4.
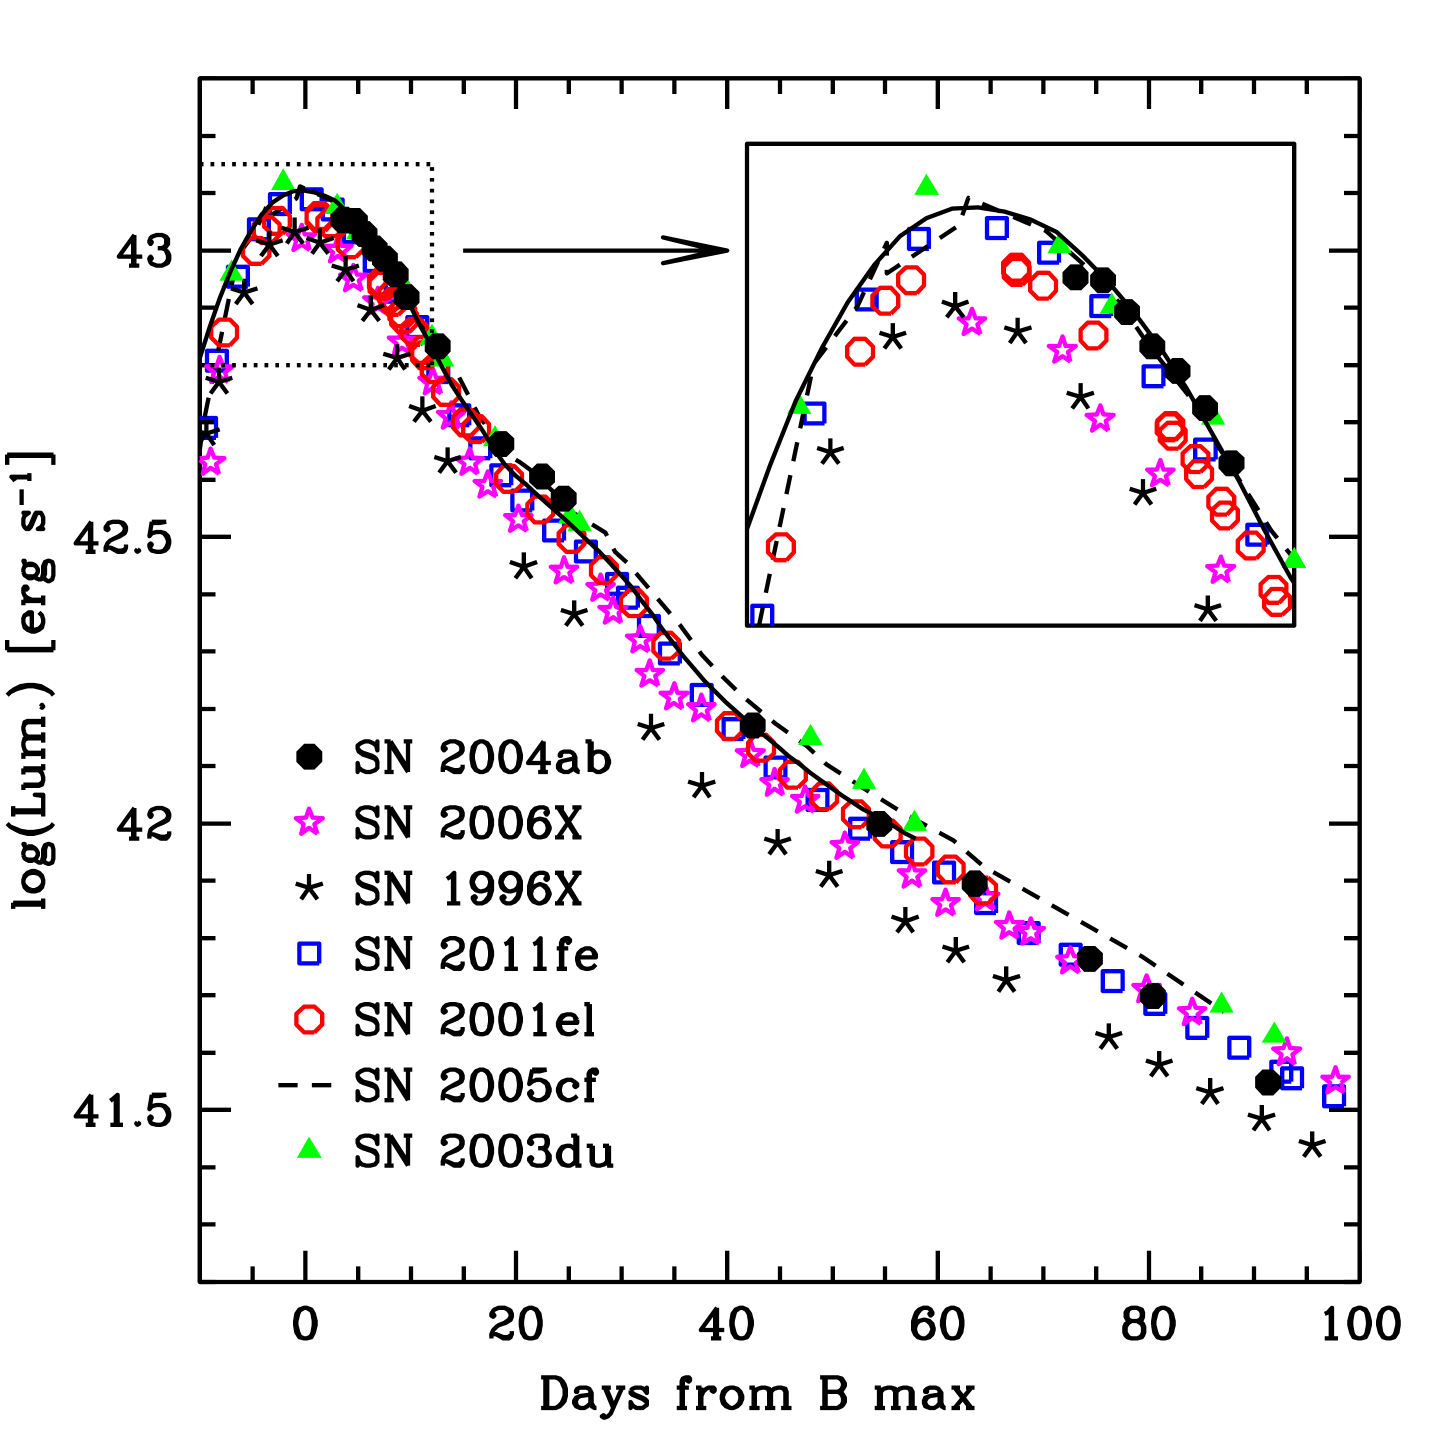
The bolometric flux of SN 2004ab was obtained using the observed magnitudes listed in Table 2. The magnitudes were corrected for total extinction. The extinction corrected magnitudes were converted to flux using the zero points from Bessell, Castelli & Plez (1998). A distance modulus of = 31.87 0.15 mag was used to estimate the bolometric luminosity. Since SN 2004ab was observed in bands, to account for the missing fluxes, we applied correction as described by Wang et al. (2009b). The quasi-bolometric light curve of SN 2004ab is plotted in Fig. 7 and compared with those of other SNe Ia. The bolometric light curve of SN 2004ab is similar to those of SN 2001el and SN 2011fe. The peak bolometric luminosity of SN 2004ab is estimated as = 43.10 0.07 erg s-1.
.
5.1 Mass of Nickel synthesized
The mass of 56Ni synthesized in the explosion of SN 2004ab is estimated using the Arnett’s rule (Arnett, 1982). SN 2004ab was discovered on 2004 February 21.98. It was not detected on 2004 February 1.15 upto a limiting mag of 18 mag (Monard & Vanmunster, 2004). The bolometric light curve peaked on 2004 February 21.32. This indicates that the rise time 20 d for SN 2004ab. The rise time of SNe Ia is found to correlate with . Brighter SNe with smaller have longer rise time and fainter SNe with larger have smaller rise time. The spectroscopically normal SNe Ia have typical rise time of 18–19.5 d (Riess et al., 1999; Conley et al., 2006; Ganeshalingam, Li & Filippenko, 2011). Post-maximum decline rate and rise time relation of Pskovskii (1984) gives = 19 d for SN 2004ab. Using = 19 d, peak bolometric luminosity of = 43.10 erg s-1 and = 1.2 (Branch, 1992), the mass of 56Ni synthesized in the explosion of SN 2004ab is estimated as M = 0.53 0.08 M⊙.
6 Spectroscopic results
6.1 Spectral evolution
We obtained 11 spectra of SN 2004ab spanning from +3.7 to +74.4 d with respect to band maximum. The details of observations are given in Table 3. Spectral evolution of SN 2004ab from +3.7 to +22.5 d is presented in Fig. 8 and from +42.5 to +74.4 d in Fig. 9. All the spectra have been corrected for reddening (using = 1.41) as discussed in Section 4 and redshift of = 0.0058.
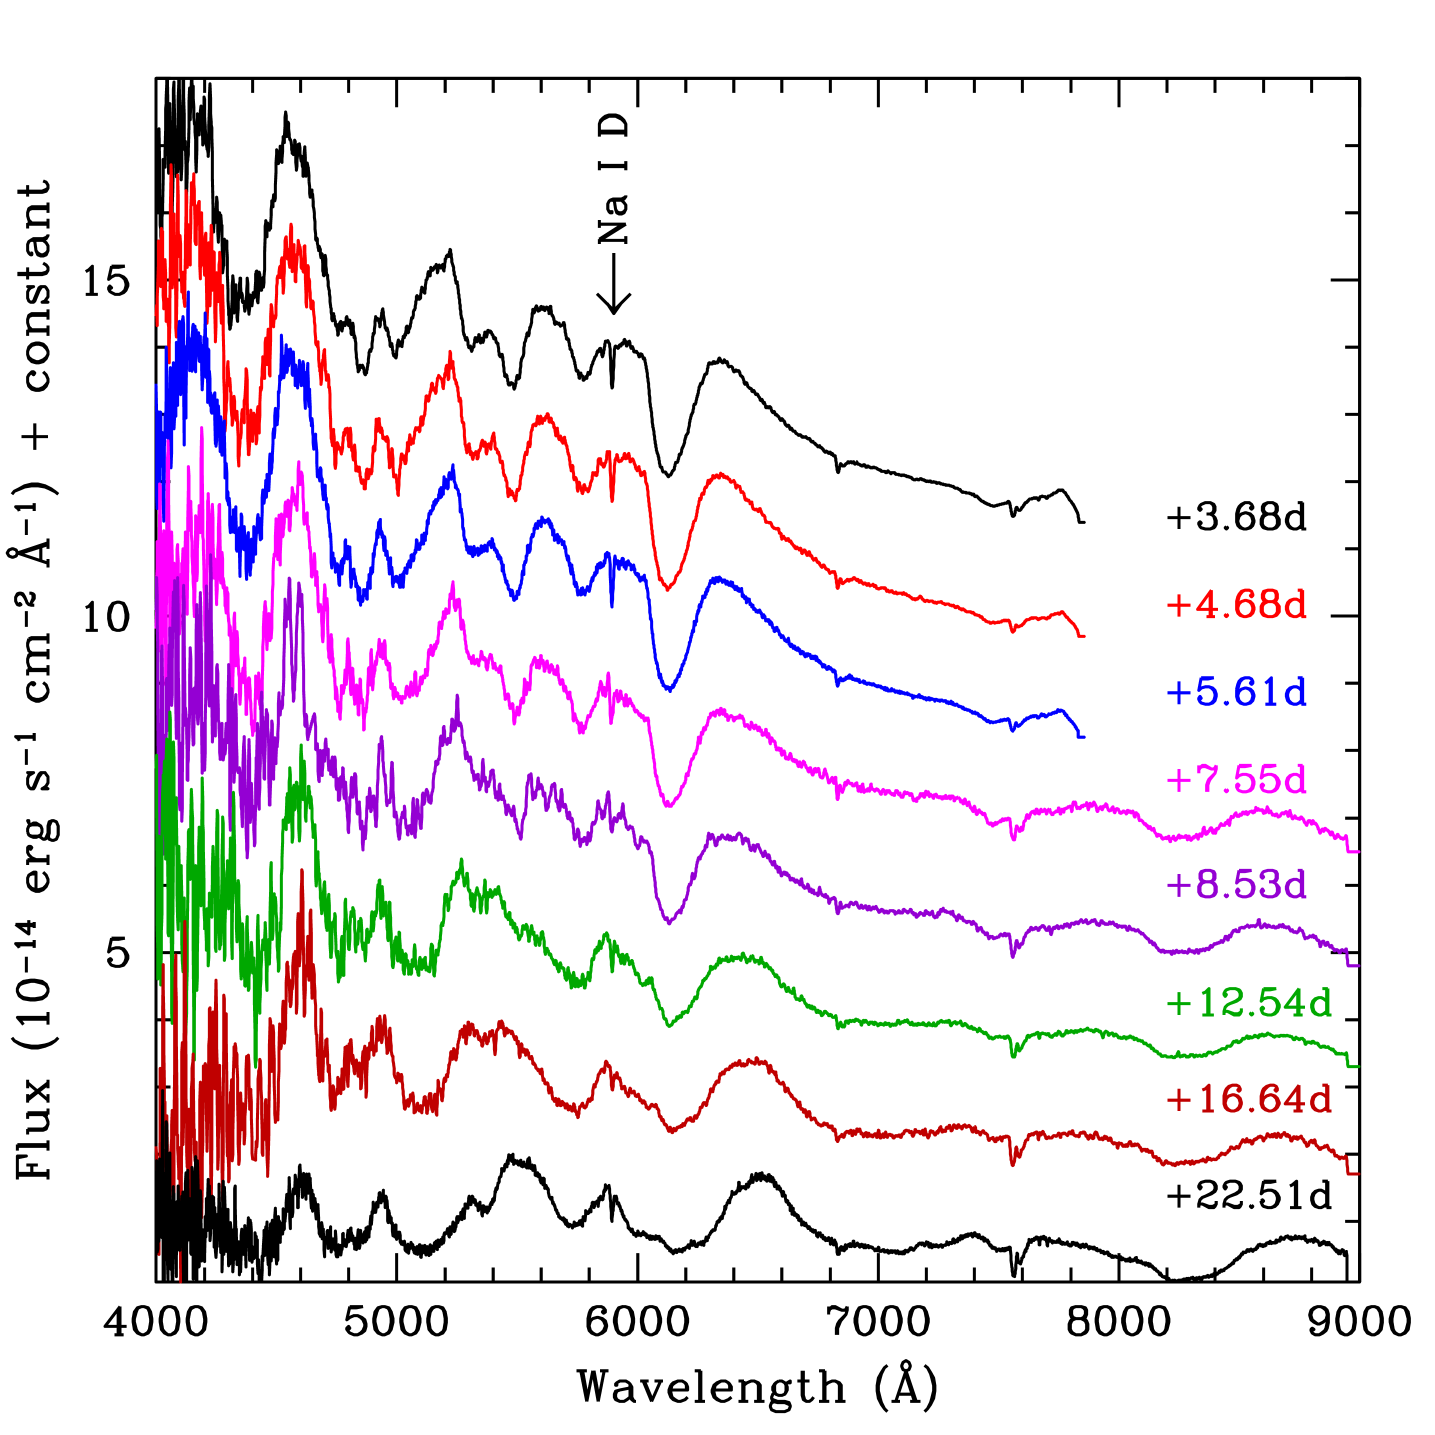
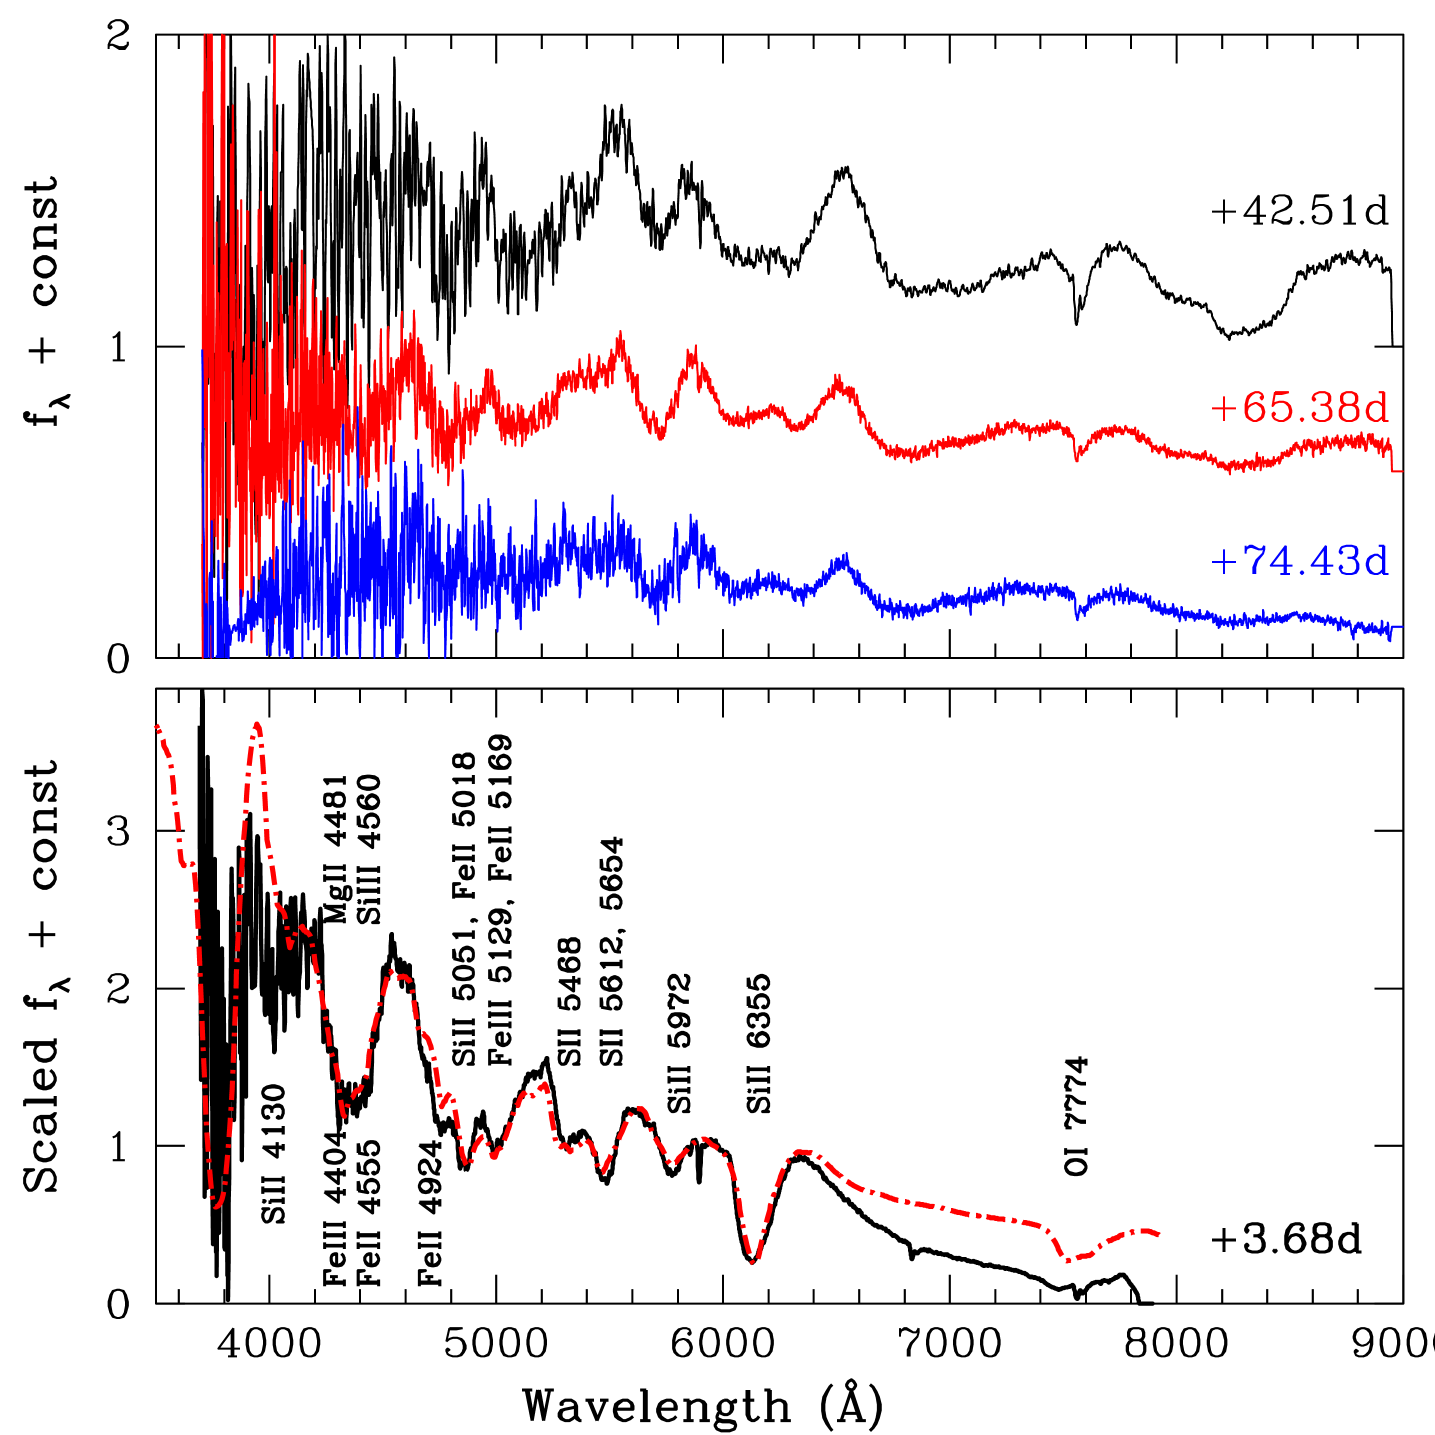
The first spectrum of SN 2004ab obtained on +3.7 d, shows features seen in normal SNe Ia. The Fe iii 4404, Mg ii 4481, Fe ii 4555, and Si iii 4560 lines are blended giving a broad and deep profile in the region 4200–4600 Å. During subsequent evolution, lines due to Fe iii, Si iii weaken and the profile narrows down. Features of Fe ii 4924, 5018, Si ii 5051, Fe iii 5129 and Fe ii 5169 are clearly visible in the 4600–5200 Å spectral region. The ‘W’-shaped S ii 5654, 5468, Si ii 5972 and Si ii 6355 characteristics of normal SNe Ia are strong in the spectrum of SN 2004ab. The strong narrow feature seen between Si ii 5972 and Si ii 6355 is due to Na i D from host galaxy, indicating the high reddening within SN host. The overall appearance of the first three spectra corresponding to +3.7, +4.7 and +5.6 d is identical. The spectrum obtained on +7.6 d also covers the red region, where O i and Ca ii NIR triplet are clearly seen. The ‘W’-shaped S ii lines are getting weaker. By +12.5 d, most of the Fe ii lines have become stronger and S ii feature is hardly visible. In the spectrum of +22.5 d, the Fe ii lines are well developed, the Si ii 6355 is getting replaced by a broad absorption profile due to increased contamination of Fe ii lines.
Spectrum at +42.5 d, shown in Fig. 9 is dominated by strong Fe ii 4924, 5018, 5169, 5536, Na i, and Ca ii NIR triplet. Spectral appearance of the next two spectra obtained at +65.4 and +74.4 d is similar except for the weakening of Ca ii NIR triplet.
The spectrum of SN 2004ab at +3.7 d is fit with the synthetic spectrum generated using the syn++ code (Thomas, Nugent & Meza, 2011) and shown in Fig. 9. The best fit to the observed spectrum is achieved at photospheric velocity of 10700 km s-1 and blackbody temperature of 14000 K. To reproduce the observed features, ions of O i, Na i, Mg ii, Si ii, Si iii, S ii, Ca ii, Fe ii and Fe iii, each at an excitation temperature of 7000 K were included in the synthetic spectrum. Optical depths of each absorption feature was set to decrease exponentially with velocity, keeping e-folding velocity at 1000 km s-1. The identified features are marked in the spectrum.
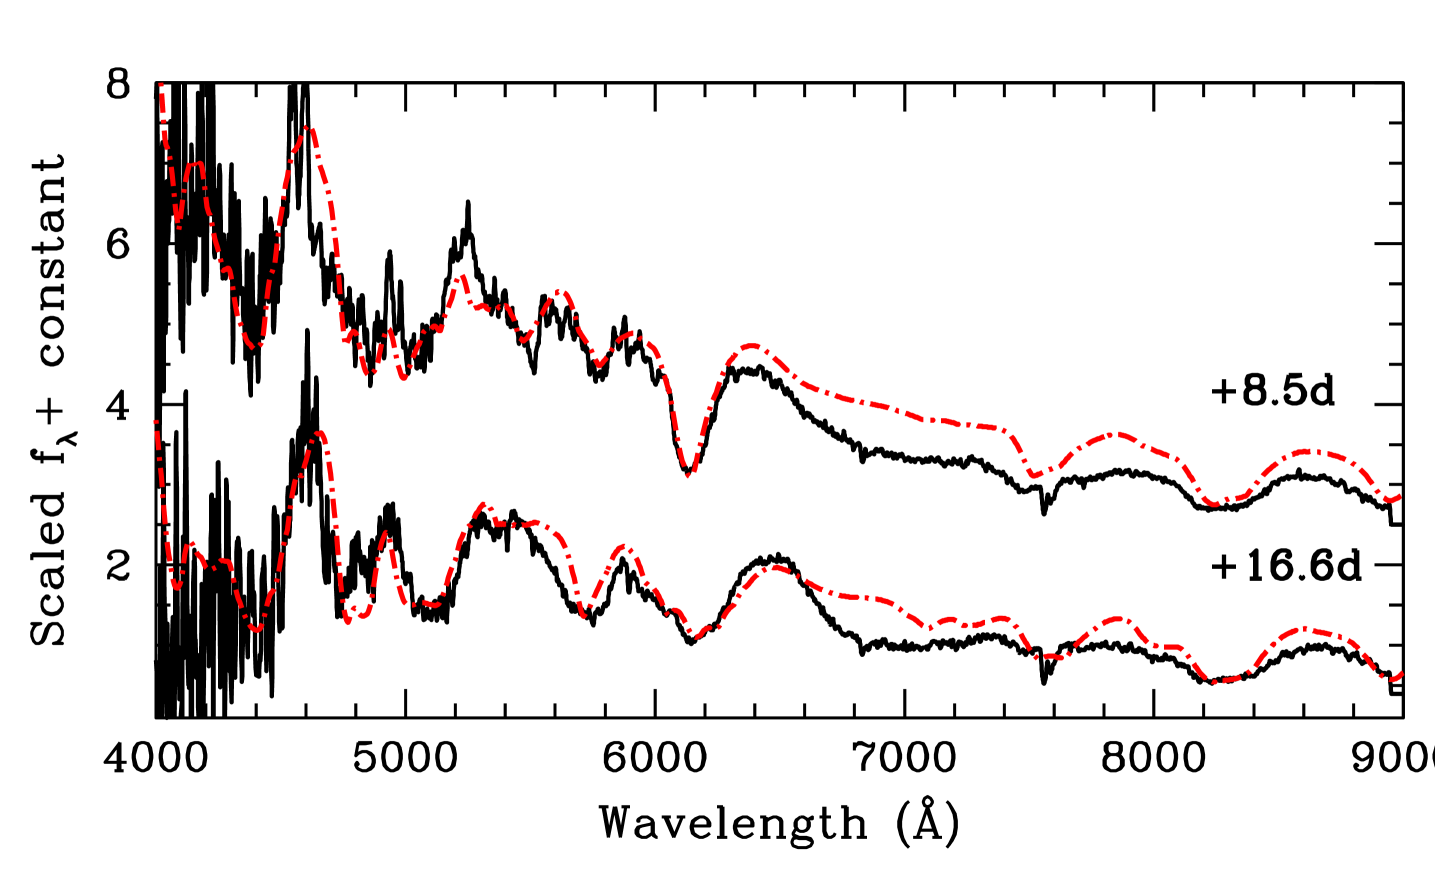
The synthetic spectra at +8.5 and +16.6 d are also generated and displayed in Fig. 10 along with the observed spectra. The best fit for spectrum at +8.5 d is obtained using photospheric velocity of 10500 km s-1 and blackbody temperature of 13000 K. The ions included to reproduce the synthetic spectrum are same as that of +3.7 d. For spectrum at +16.6 d, photospheric velocity is set to 9500 km s-1 and blackbody temperature at 10000 K. The synthetic spectrum includes ions of O i, Na i, Mg ii, Si ii, Ca ii and Fe ii.
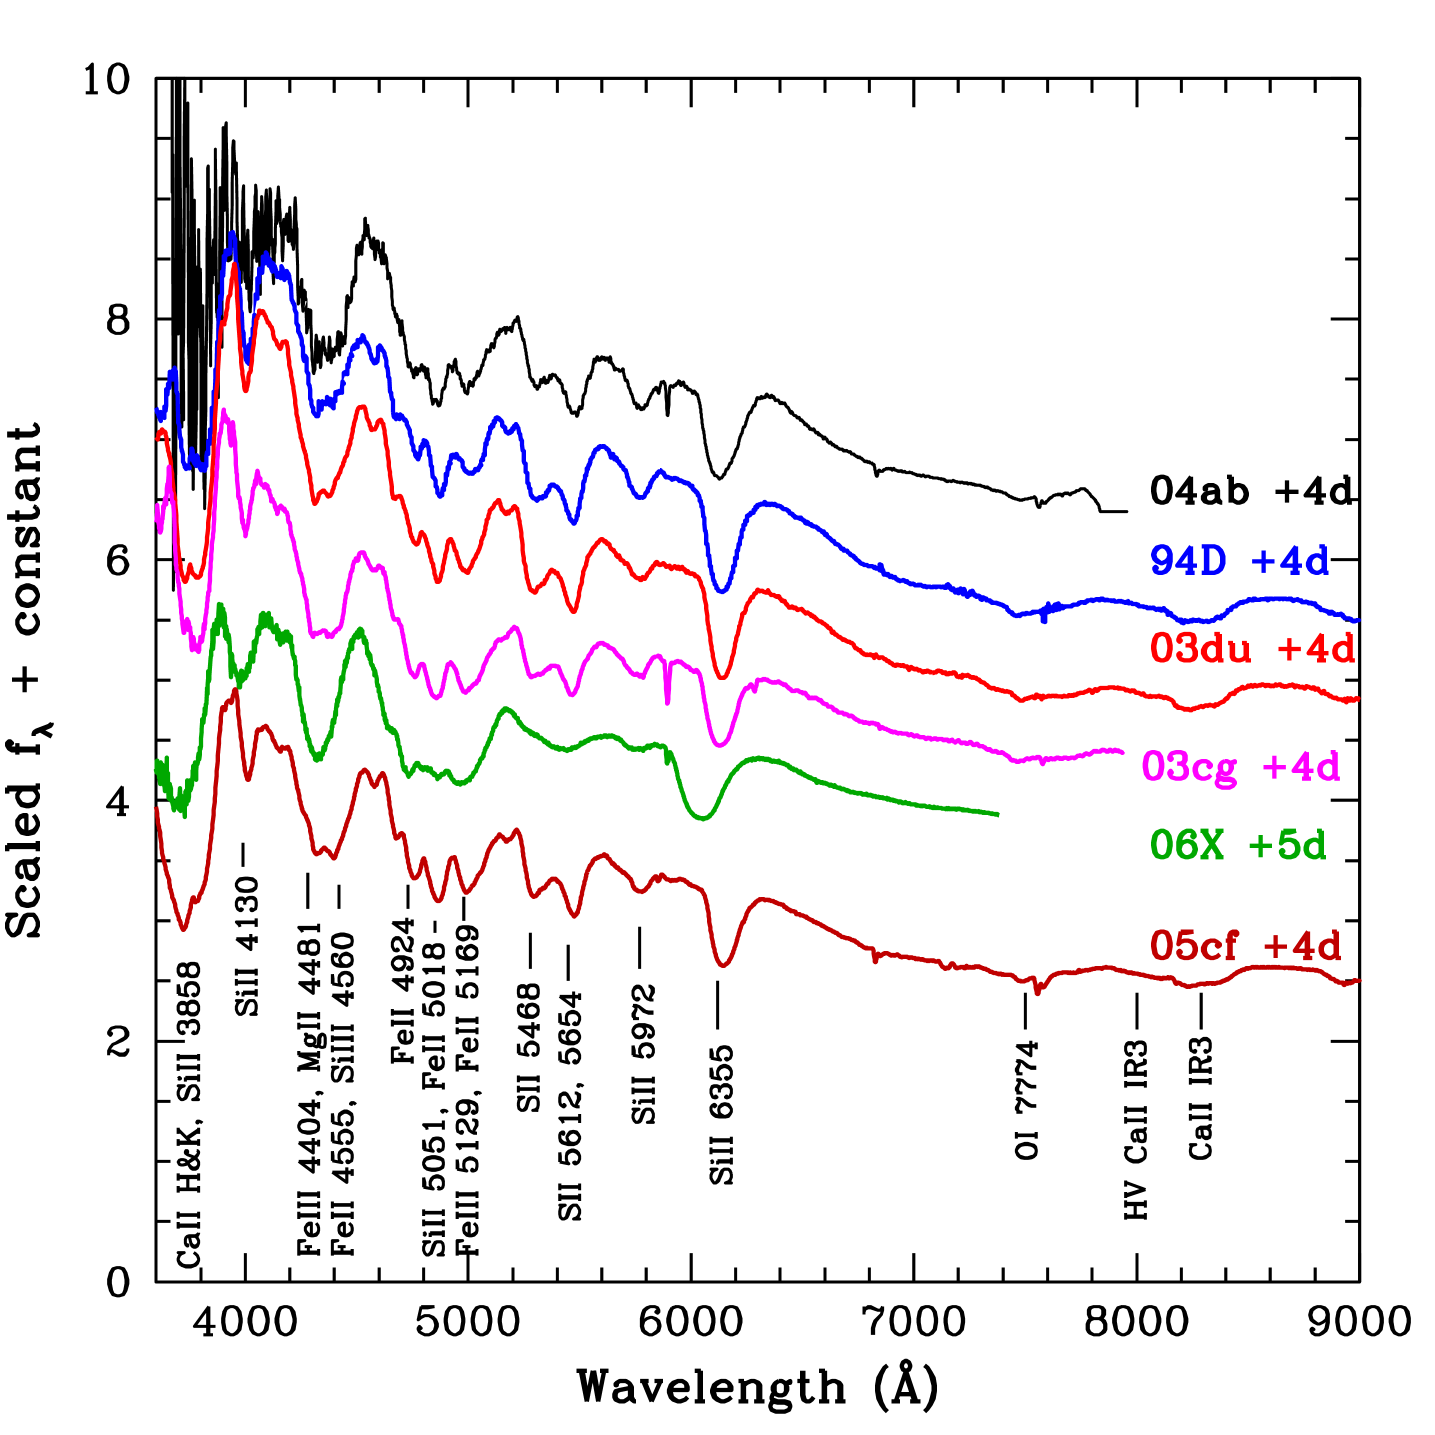
In Fig. 11, spectrum of SN 2004ab at +4 d is compared with those of SN 1994D (Patat et al., 1996), SN 2003du (Anupama et al., 2005), SN 2003cg (Elias-Rosa et al., 2006), SN 2006X (Wang et al., 2008), and SN 2005cf (Garavini et al., 2007; Wang et al., 2009b) at similar epochs. The comparison spectra are obtained from SUSPECT222http://www.nhn.ou.edu/~suspect/ and WISeREP333http://www.weizmann.ac.il/astrophysics/wiserep/ Supernova Spectrum Archives.
Spectrum of SN 2004ab is similar to those of other SNe in comparison. Though, SN 2006X was a highly reddened SN similar to SN 2004ab, it had larger expansion velocity and hence most of the features are blended. The extreme blue region of the SN 2004ab spectrum is a bit noisy. However, Ca ii H&K, Si ii 3858, Si ii 4130 features are clearly visible.
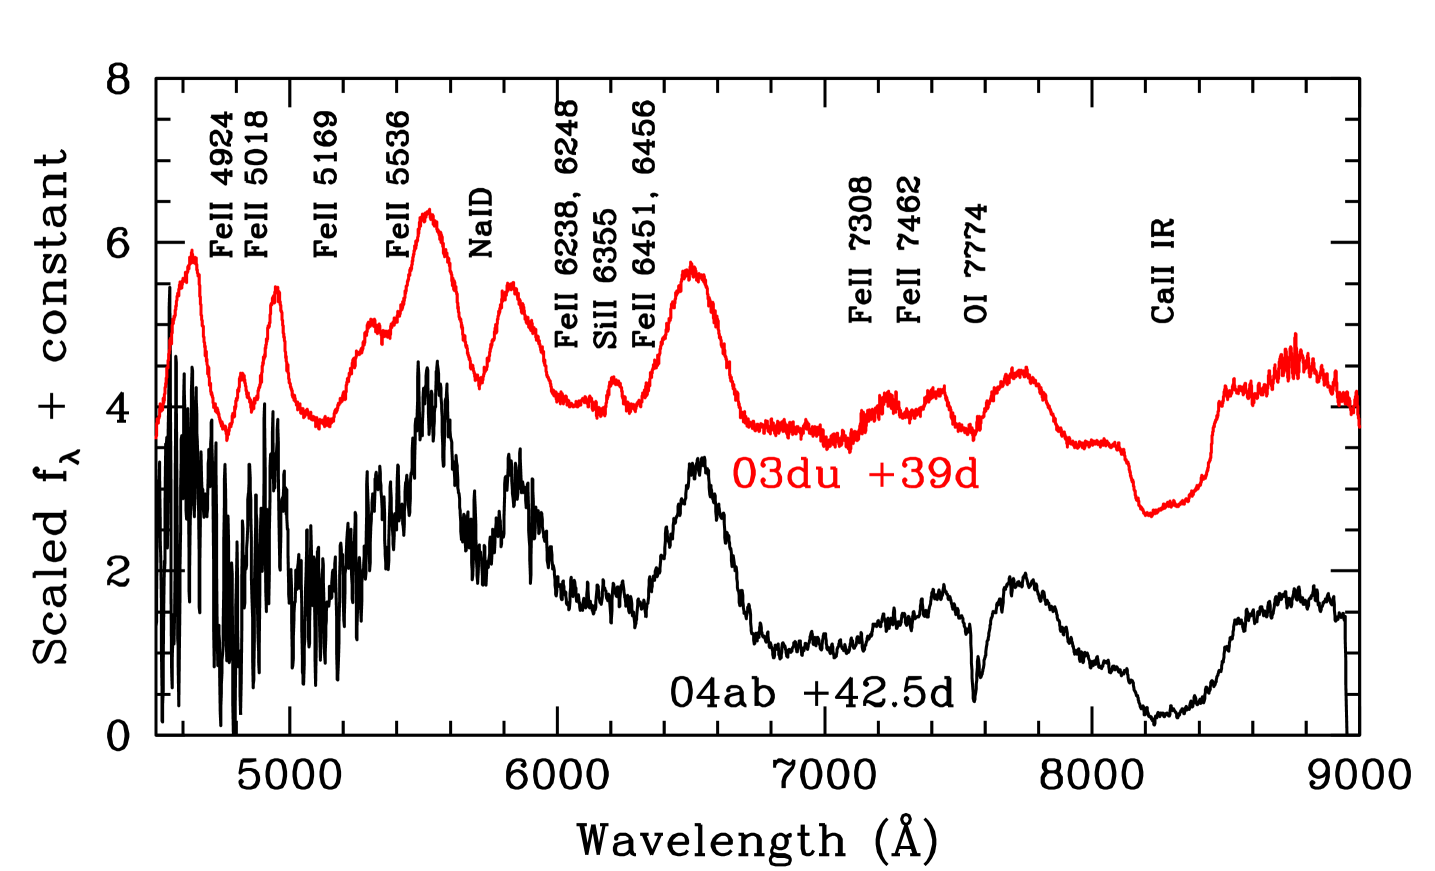
The spectrum of SN 2004ab at +42.5 d is compared with that of SN 2003du in Fig. 12. It is clear that spectrum of SN 2004ab is very similar to that of SN 2003du. Spectra of both the SNe are characterized by strong Fe ii lines. Other features like Na i and Ca ii NIR triplet are very strong and similar in the spectra of SN 2004ab and SN 2003du. The overall spectral evolution of SN 2004ab is very similar to those of normal SNe Ia.
6.2 Expansion Velocity
Photospheric velocity measured from Si ii 6355 absorption line in the spectra of SN 2004ab is plotted in Fig. 13 and compared with those of other SNe Ia. SN 2004ab was discovered late, hence, there is no early phase velocity information for this supernova. At +3.7 d, SN 2004ab has photospheric velocity of 10800 km s-1, similar to SN 2002er, SN 2003cg and SN 2003du, but higher than SN 1994D, SN 2005cf and lower than the high velocity SNe Ia SN 2002bo and SN 2006X. One week after band maximum, the velocity of SN 2004ab reduces to 10500 km s-1, and after two weeks it becomes 9000 km s-1. At the last data point, which corresponds to +42.5 d, the velocity of Si ii 6355 absorption line is 8500 km s-1.
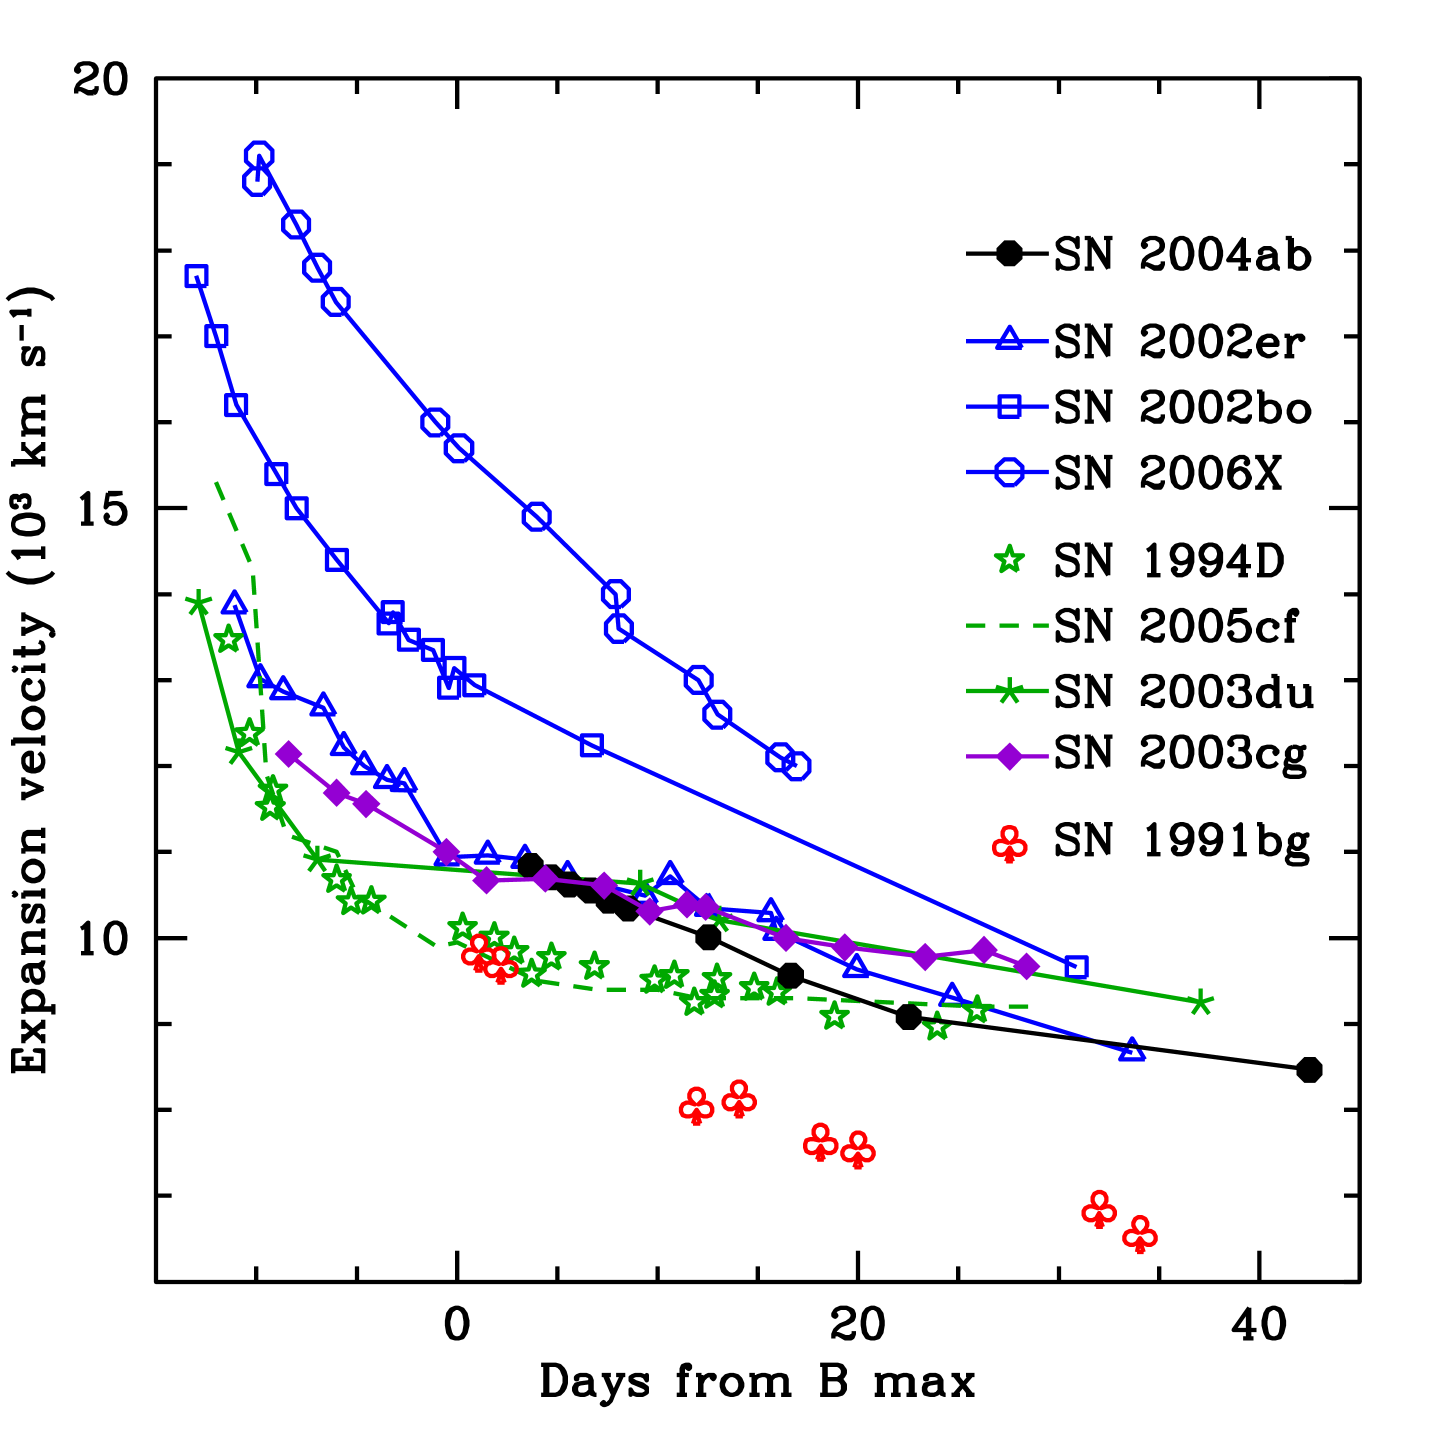
The expansion velocity of normal SNe Ia shows rapid temporal evolution during pre-maximum phase, and after band maximum expansion velocity changes slowly. From Fig. 13, it is clear that SN 2004ab follows a trend similar to that of SN 2002er. The velocity evolution of both SNe are very similar.
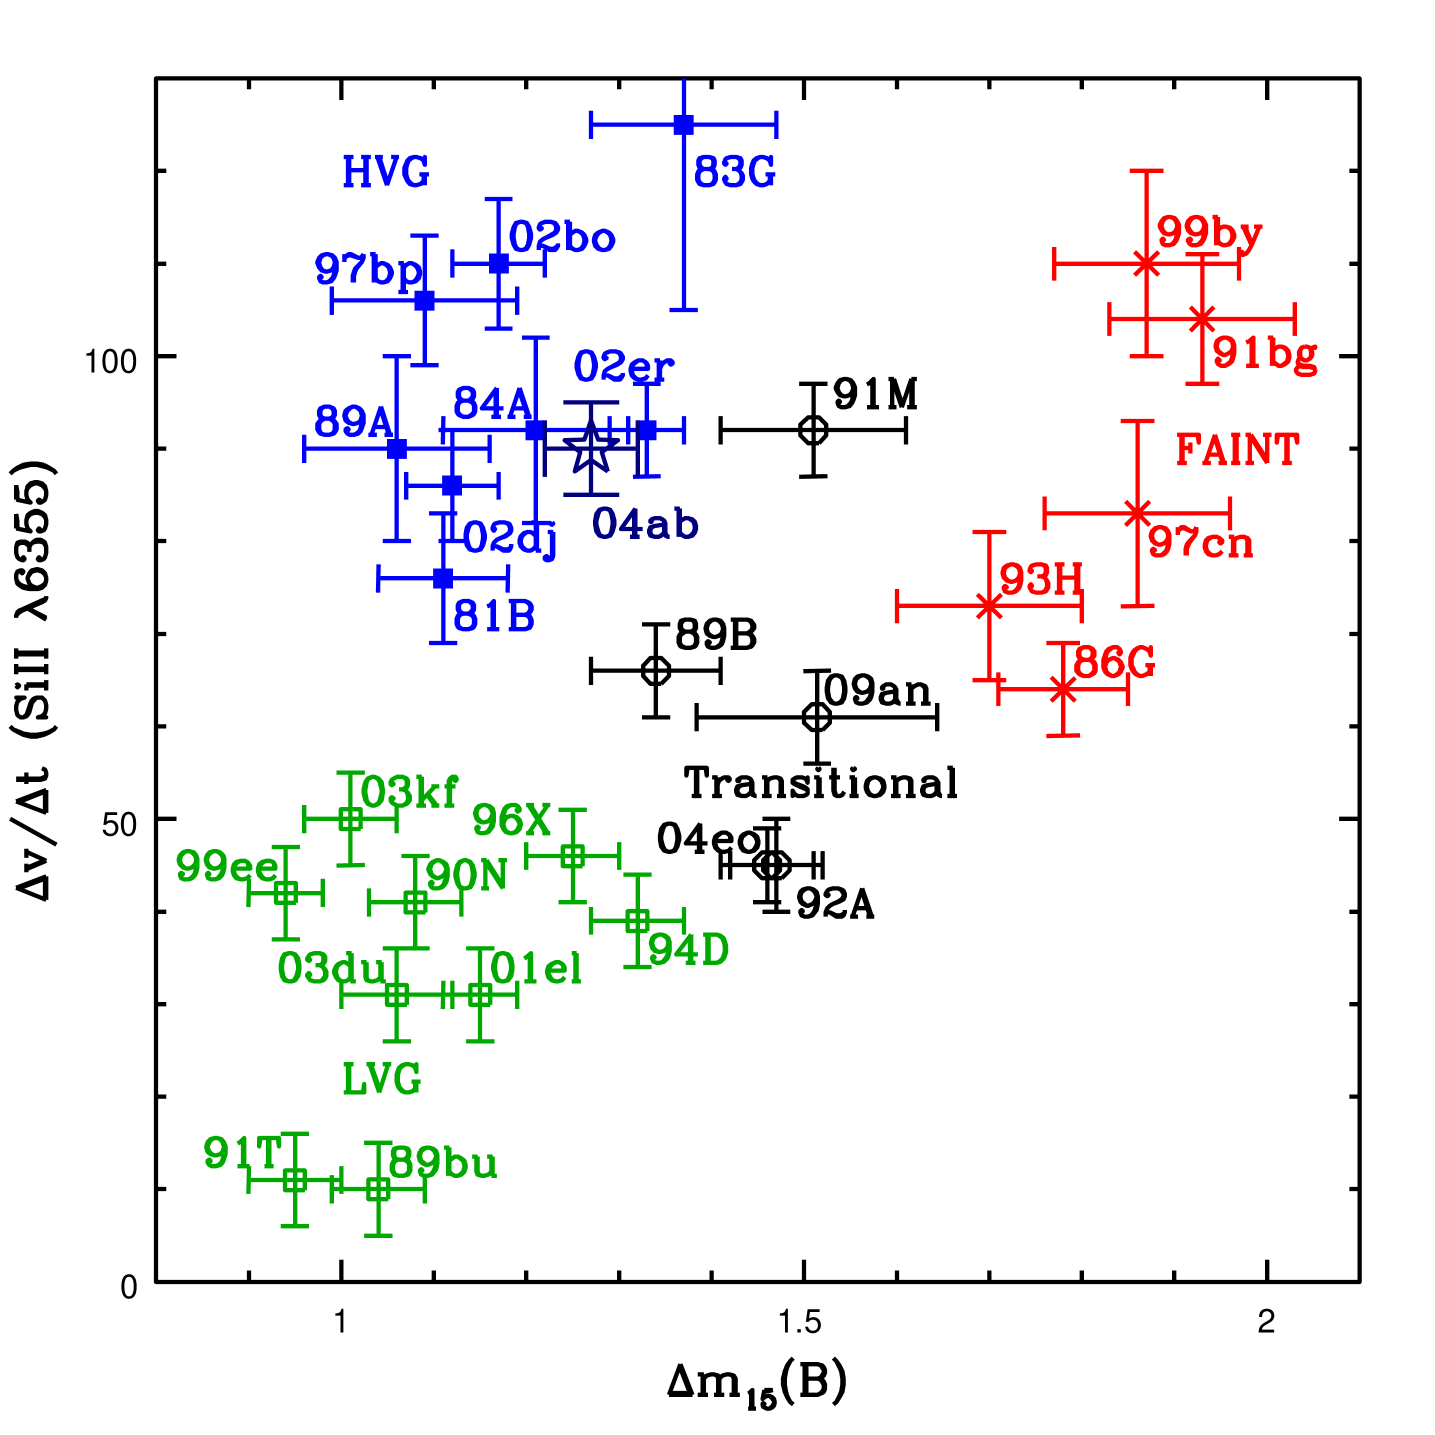
6.3 Spectroscopic parameter
Based on the gradient of velocity evolution of the Si ii 6355 line, Benetti et al. (2005) grouped SNe Ia into three different subclasses. The SNe showing very slow velocity evolution and hence low velocity gradients in the post maximum phase are termed as Low Velocity Gradient (LVG; velocity gradient 60 – 70 km s-1 d-1) events. SN 1994D, SN 2003du, SN 2005cf fall in this subgroup. On the other hand SNe like SN 2002er, SN 2002bo and SN 2006X having high velocity gradients are called High Velocity Gradient (HVG) events. LVG includes luminous and normal SNe Ia, while HVG group has average luminosity. SN 1991bg–like under luminous SNe show a high velocity gradient, and are grouped under Faint subclass. The measured velocity gradient of SN 2004ab is 90 km s-1 d-1, which falls in the HVG subclass. The classification scheme of Benetti et al. (2005) is shown in Fig. 14 and the position of SN 2004ab is marked in it. SN 2004ab occupies place near SN 2002er in the clustered region of HVG. The average luminosity of SN 2004ab is also consistent with its belonging to HVG group.
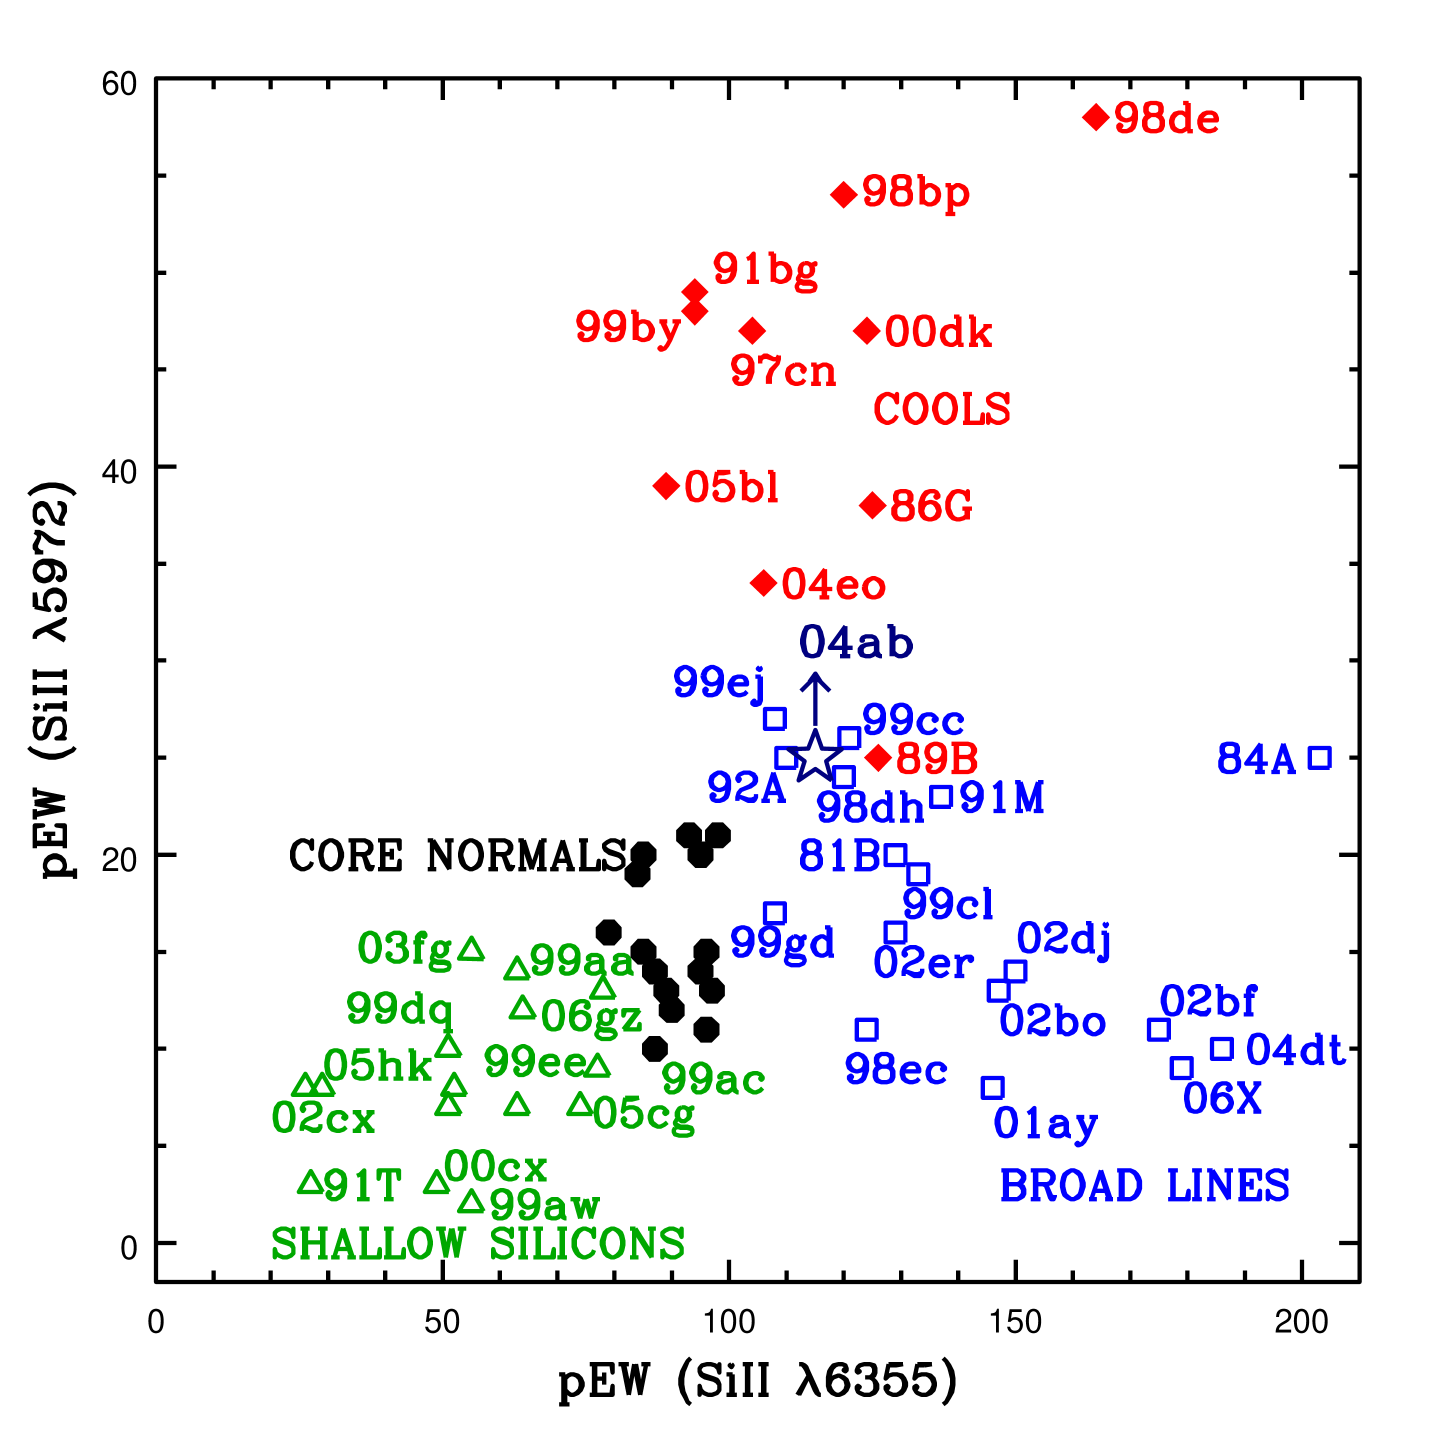
Branch et al. (2006) introduced another method of classifying SNe Ia spectroscopically using the pseudo-EWs of Si ii 5972 (W(5750)) and Si ii 6355 (W(6100)) lines in the spectrum around band maximum. In a plot between W(5750) and W(6100) the SNe are distributed in four regions of shallow silicon (SS; SN 1991T–like), core normal (CN; SN 2003du–like), broad line (BL; SN 2002bo–like) and cool (CL; SN 1991bg–like). The classification scheme of Branch et al. (2006) is shown in Fig. 15 with position of SN 2004ab marked. It falls in the region occupied by BL objects. The HVG objects have properties overlapping with the BL group. This is also applicable for SN 2004ab.
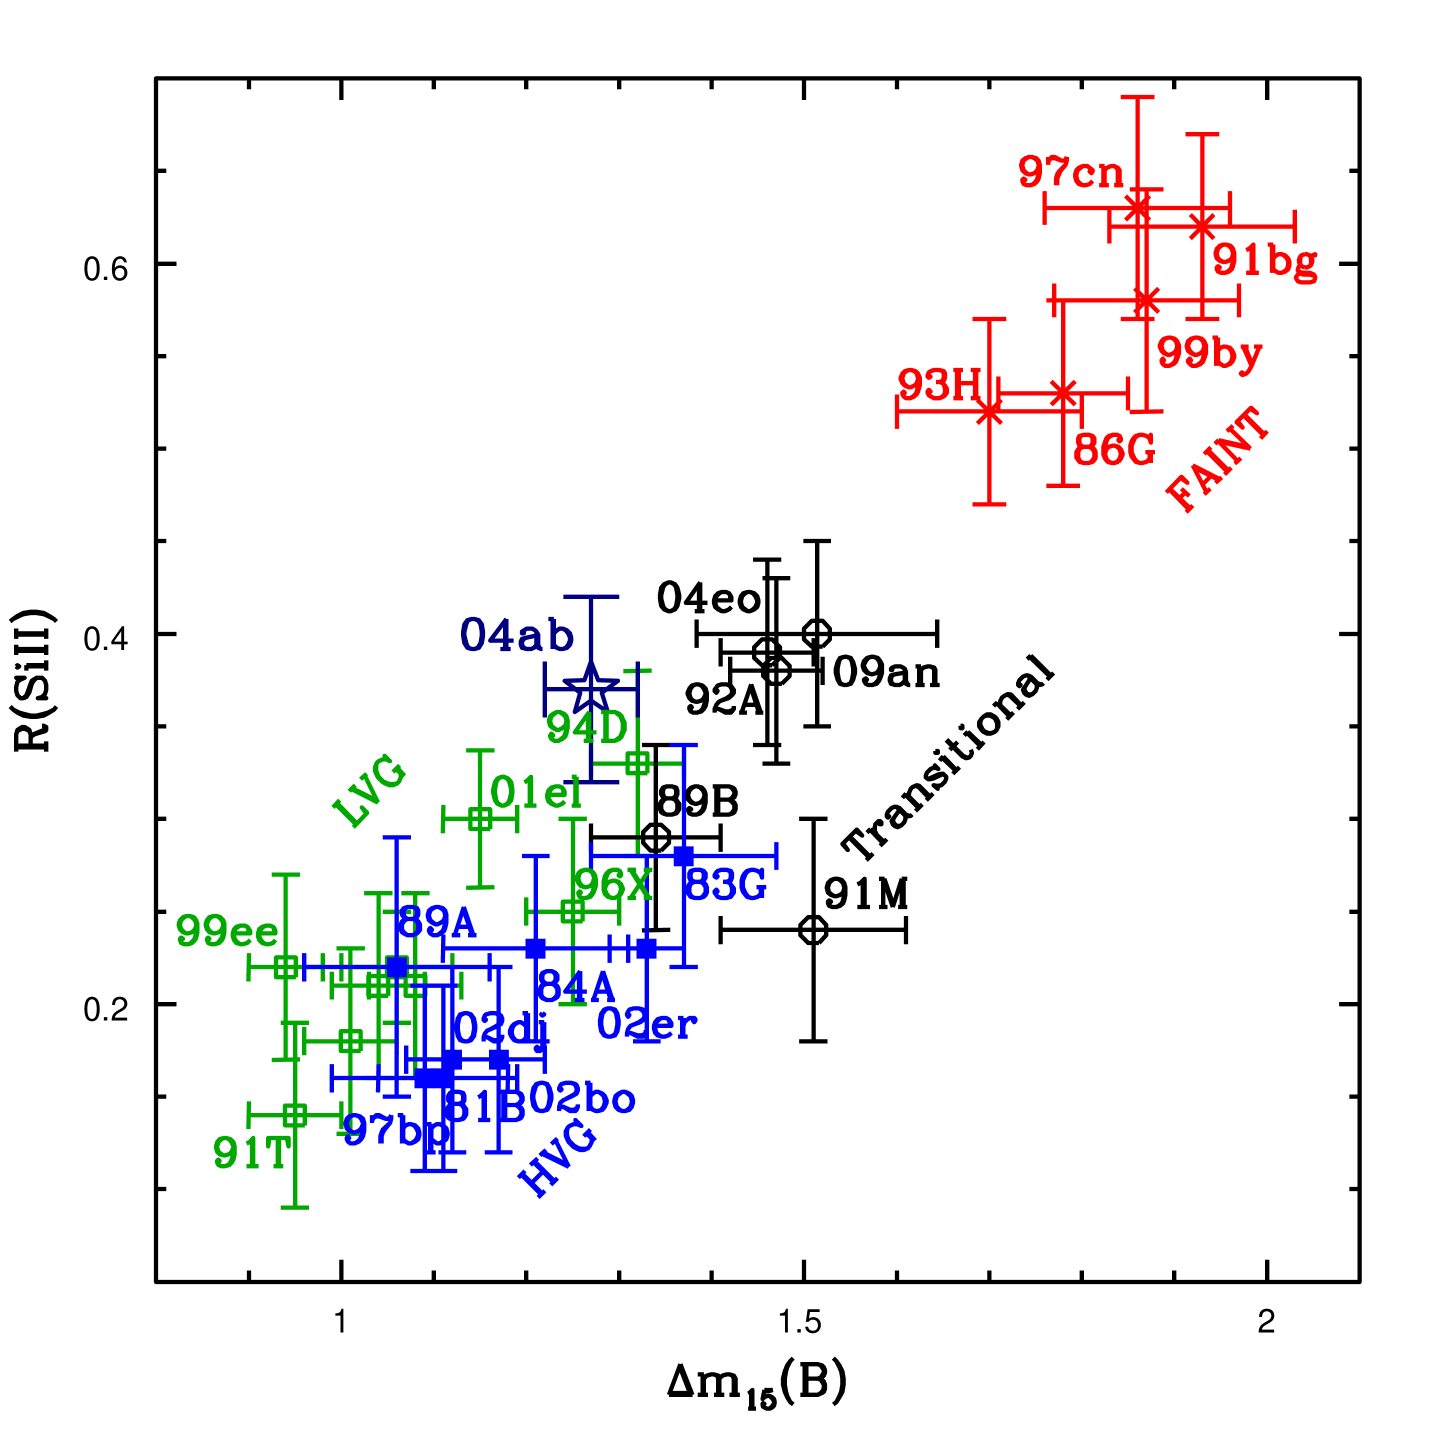
The strength ratio of Si ii 5972 and Si ii 6355 lines is correlated with the luminosity of SNe Ia (Nugent et al., 1995; Benetti et al., 2005). The value of (Si ii) is found to be smaller for luminous objects and larger for fast declining, fainter and cooler objects. We measured the line strength ratio, (Si ii) for SN 2004ab as 0.37 and plotted against in Fig. 16 alongwith other SNe Ia from Benetti et al. (2005); Pastorello et al. (2007a); Sahu, Anupama & Anto (2013). SN 2004ab occupies position near SN 1994D within the diagonal strip of Fig. 16.
Using the expansion velocity estimated from Si ii line in the spectrum close to maximum light, Wang et al. (2009a) grouped SNe Ia into two classes: those having high velocity (HV), 11800 km s-1 and others having normal velocity (NV), with an average of = 10600 km s-1. Since, SN 2004ab was discovered late, our first spectrum was obtained 3.7 d after maximum light. Hence, exact value of velocity at maximum light could not be determined. However, from the observed trend in velocity evolution (refer Fig. 13), it is inferred that at maximum light it would have a velocity of 11000 km s-1, hence can be considered as NV type. Wang et al. (2009a) found that is lower (1.6) for HV as compared to NV (2.4) subgroup in their sample. However, Foley & Kasen (2011) found that after excluding highly reddened SNe having from the sample of Wang et al. (2009a), both NV and HV subgroups are consistent with same value of = 2.5. SN 2004ab seems to be a normal velocity SN and shows very low value of = 1.45.
Velocity evolution and gradient of SN 2004ab matches well with that of SN 2002er (refer Fig. 13 and 14). Both SNe show high gradient in their velocities. However, there is no similarity in the line strength ratio, (Si ii) of these two SNe. The (Si ii) of SN 2004ab is higher than that of SN 2002er. The (Si ii) value of SN 2004ab is more like LVG SNe, while SN 2002er follows other HVG SNe. This is because, the Si ii 5972 line is stronger in SN 2004ab compared to SN 2002er. Many HVG SNe overlap with the BL type and this is also true for SN 2004ab. But unlike most other BLs, which have strong Si ii 6355 line and relatively weaker Si ii 5972, SN 2004ab has stronger Si ii 5972 line and weaker Si ii 6355 line.
7 Summary
Optical photometric and spectroscopic analyses of SN 2004ab are presented. SN 2004ab is a highly reddened normal type Ia supernova with = 1.70 mag. The intrinsic decline rate parameter of SN 2004ab is = 1.27. The photospheric velocity evolution measured from Si ii 6355, absorption line is similar to that of SN 2002er. The Si ii 6355 velocity gradient is estimated as = 90 km s-1 d-1 indicating that SN 2004ab is a member of HVG subgroup. The pseudo-EWs of Si ii 5972 and 6355 absorption lines suggest that SN 2004ab is a BL type. The line strength ratio (Si ii) is 0.37, higher than those of other BLs having similar . This is due to higher strength of Si ii 5972 in SN 2004ab. Using CCM model, the ratio of total-to-selective extinction for host galaxy NGC 5054, in the direction of SN 2004ab, is derived as = 1.41, which is much lower than that of Milky Way. The derived extinction is also consistent with power law extinction model = ( with . SN 2004ab peaked at an absolute magnitude of = 19.31 0.25 mag. Peak bolometric luminosity of = 43.10 0.07 erg s-1 suggests that 0.53 0.08 M⊙ of 56Ni was synthesized in this explosion. Though, SN 2004ab is a highly reddened supernova, its absolute luminosity, after correcting for extinction using non standard extinction law, is similar to a normal SN Ia and follows the empirical Luminosity decline rate relation.
Acknowledgements
We thank the anonymous referee for going through the draft carefully and providing constructive suggestions. NKC is thankful to the Director and Dean of IIA, Bangalore for local hospitality and facilities provided. We are thankful to Ramya S. and Jessy J. for their assistance during the observations and to Shubham Srivastav for help in fitting the light curves using SNooPy code. All the observers of the 2-m HCT (IAO-IIA), who kindly provided part of their observing time for supernova observations, are thankfully acknowledged. This work has made use of the NASA/IPAC Extragalactic Database (NED) which is operated by Jet Propulsion Laboratory, California Institute of Technology, under contract with the National Aeronautics and Space Administration. We have also made use of the Lyon-Meudon Extragalactic Database (LEDA), supplied by the LEDA team at the Centre de Recherche Astronomique de Lyon, Observatoire de Lyon. We acknowledge use of the SNooPy software package developed by the Carnegie Supernova Project (CSP) and the Online Supernova Spectrum Archive (SUSPECT) initiated and maintained at the Homer L. Dodge Department of Physics and Astronomy, University of Oklahoma.
References
- Altavilla et al. (2004) Altavilla G. et al., 2004, MNRAS, 349, 1344
- Amanullah et al. (2014) Amanullah R. et al., 2014, ApJ, 788, L21
- Anupama et al. (2005) Anupama G. C., Sahu D. K., Jose J., 2005, A&A, 429, 667
- Arnett (1982) Arnett W. D., 1982, ApJ, 253, 785
- Benetti et al. (2005) Benetti S. et al., 2005, ApJ, 623, 1011
- Bessell et al. (1998) Bessell M. S., Castelli F., Plez B., 1998, A&A, 337, 321
- Branch (1992) Branch D., 1992, ApJ, 392, 35
- Branch et al. (2006) Branch D. et al., 2006, PASP, 118, 560
- Burns et al. (2011) Burns C. R. et al., 2011, AJ, 141, 19
- Cardelli et al. (1989) Cardelli J. A., Clayton G. C., Mathis J. S., 1989, ApJ, 345, 245
- Chandrasekhar (1931) Chandrasekhar S., 1931, ApJ, 74, 81
- Chotard et al. (2011) Chotard N. et al., 2011, A&A, 529, L4
- Conley et al. (2006) Conley A. et al., 2006, AJ, 132, 1707
- Elias-Rosa et al. (2006) Elias-Rosa N. et al., 2006, MNRAS, 369, 1880
- Fitzpatrick (1999) Fitzpatrick E. L., 1999, PASP, 111, 63
- Folatelli et al. (2010) Folatelli G. et al., 2010, AJ, 139, 120
- Foley & Kasen (2011) Foley R. J., Kasen D., 2011, ApJ, 729, 55
- Freedman et al. (2001) Freedman W. L. et al., 2001, ApJ, 553, 47
- Ganeshalingam et al. (2011) Ganeshalingam M., Li W., Filippenko A. V., 2011, MNRAS, 416, 2607
- Garavini et al. (2007) Garavini G. et al., 2007, A&A, 471, 527
- Goobar (2008) Goobar A., 2008, ApJ, 686, L103
- Howell (2011) Howell D. A., 2011, Nature Communications, 2, 350
- Hoyle & Fowler (1960) Hoyle F., Fowler W. A., 1960, ApJ, 132, 565
- Iben & Tutukov (1984) Iben Jr. I., Tutukov A. V., 1984, ApJS, 54, 335
- Jha et al. (2007) Jha S., Riess A. G., Kirshner R. P., 2007, ApJ, 659, 122
- Krisciunas et al. (2006) Krisciunas K., Prieto J. L., Garnavich P. M., Riley J. L. G., Rest A., Stubbs C., McMillan R., 2006, AJ, 131, 1639
- Krisciunas et al. (2003) Krisciunas K. et al., 2003, AJ, 125, 166
- Krisciunas et al. (2007) Krisciunas K. et al., 2007, AJ, 133, 58
- Landolt (1992) Landolt A. U., 1992, AJ, 104, 340
- Mandel et al. (2011) Mandel K. S., Narayan G., Kirshner R. P., 2011, ApJ, 731, 120
- Maoz et al. (2014) Maoz D., Mannucci F., Nelemans G., 2014, ARA&A, 52, 107
- Matheson et al. (2004) Matheson T., Challis P., Kirshner R., Berlind P., Huchra J., 2004, IAU Circ., 8293, 2
- Monard & Vanmunster (2004) Monard L. A. G., Vanmunster T., 2004, Central Bureau Electronic Telegrams, 61, 1
- Nugent et al. (1995) Nugent P., Phillips M., Baron E., Branch D., Hauschildt P., 1995, ApJ, 455, L147
- Nugent et al. (2002) Nugent P., Kim A., Perlmutter S., 2002, PASP, 114, 803
- Pastorello et al. (2007a) Pastorello A. et al., 2007a, MNRAS, 377, 1531
- Pastorello et al. (2007b) Pastorello A. et al., 2007b, MNRAS, 376, 1301
- Patat et al. (1996) Patat F., Benetti S., Cappellaro E., Danziger I. J., della Valle M., Mazzali P. A., Turatto M., 1996, MNRAS, 278, 111
- Perlmutter et al. (1997) Perlmutter S. et al., 1997, ApJ, 483, 565
- Phillips (1993) Phillips M. M., 1993, ApJ, 413, L105
- Phillips (2012) Phillips M. M., 2012, PASA, 29, 434
- Phillips et al. (1999) Phillips M. M., Lira P., Suntzeff N. B., Schommer R. A., Hamuy M., Maza J., 1999, AJ, 118, 1766
- Pisano et al. (2011) Pisano D. J., Barnes D. G., Staveley-Smith L., Gibson B. K., Kilborn V. A., Freeman K. C., 2011, ApJS, 197, 28
- Pskovskii (1984) Pskovskii Y. P., 1984, Sv A, 28, 658
- Reindl et al. (2005) Reindl B., Tammann G. A., Sandage A., Saha A., 2005, ApJ, 624, 532
- Richmond & Smith (2012) Richmond M. W., Smith H. A., 2012, Journal of the American Association of Variable Star Observers (JAAVSO), 40, 872
- Riess et al. (1996) Riess A. G., Press W. H., Kirshner R. P., 1996, ApJ, 473, 88
- Riess et al. (1999) Riess A. G. et al., 1999, AJ, 118, 2675
- Sahu et al. (2013) Sahu D. K., Anupama G. C., Anto P., 2013, MNRAS, 430, 869
- Salvo et al. (2001) Salvo M. E., Cappellaro E., Mazzali P. A., Benetti S., Danziger I. J., Patat F., Turatto M., 2001, MNRAS, 321, 254
- Schlafly & Finkbeiner (2011) Schlafly E. F., Finkbeiner D. P., 2011, ApJ, 737, 103
- Schlegel et al. (1998) Schlegel D. J., Finkbeiner D. P., Davis M., 1998, ApJ, 500, 525
- Scolnic et al. (2014) Scolnic D. M., Riess A. G., Foley R. J., Rest A., Rodney S. A., Brout D. J., Jones D. O., 2014, ApJ, 780, 37
- Srivastav et al. (2016) Srivastav S., Ninan J. P., Kumar B., Anupama G. C., Sahu D. K., Ojha D. K., Prabhu T. P., 2016, MNRAS, 457, 1000
- Stanishev et al. (2007) Stanishev V. et al., 2007, A&A, 469, 645
- Thomas et al. (2011) Thomas R. C., Nugent P. E., Meza J. C., 2011, PASP, 123, 237
- Turatto et al. (2003) Turatto M., Benetti S., Cappellaro E., 2003, in W. Hillebrandt, B. Leibundgut, eds, Proc. ESO/MPA/MPE Workshop, From Twilight to Highlight: The Physics of Supernovae. Springer, Berlin, p. 200
- Vinkó et al. (2012) Vinkó J. et al., 2012, A&A, 546, A12
- Wang (2005) Wang L., 2005, ApJ, 635, L33
- Wang et al. (2006) Wang X., Wang L., Pain R., Zhou X., Li Z., 2006, ApJ, 645, 488
- Wang et al. (2008) Wang X. et al., 2008, ApJ, 675, 626
- Wang et al. (2009a) Wang X. et al., 2009a, ApJ, 699, L139
- Wang et al. (2009b) Wang X. et al., 2009b, ApJ, 697, 380
- Webbink (1984) Webbink R. F., 1984, ApJ, 277, 355
- Whelan & Iben (1973) Whelan J., Iben Jr. I., 1973, ApJ, 186, 1007