HIghMass – High HI Mass, HI-rich Galaxies at z0
Sample Definition, Optical and H Imaging, and Star Formation Properties
Abstract
We present first results of the study of a set of exceptional HI sources identified in the 40% ALFALFA extragalactic HI survey catalog as being both HI massive () and having high gas fractions for their stellar masses: the HIghMass galaxy sample. We analyze UV- and optical-broadband and H images to understand the nature of their relatively underluminous disks in optical and to test whether their high gas fractions can be tracked to higher dark matter halo spin parameters or late gas accretion. Estimates of their star formation rates (SFRs) based on SED-fitting agree within uncertainties with the H luminosity inferred current massive SFRs. The HII region luminosity functions, parameterized as , have standard slopes at the luminous end (). The global SFRs demonstrate that the HIghMass galaxies exhibit active ongoing star formation (SF) with moderate SF efficiency, but relative to normal spirals, a lower integrated SFR in the past. Because the SF activity in these systems is spread throughout their extended disks, they have overall lower SFR surface densities and lower surface brightness in the optical bands. Relative to normal disk galaxies, the majority of HIghMass galaxies have higher H equivalent widths and are bluer in their outer disks, implying an inside-out disk growth scenario. Downbending double exponential disks are more frequent than upbending disks among the gas-rich galaxies, suggesting that SF thresholds exist in the downbending disks, probably as a result of concentrated gas distribution.
1 Introduction
While the scenario that galaxies evolve through mergers and gas condensation at the center of dark matter (DM) halos is now widely accepted (Springel et al., 2006), the detailed processes of gas acquisition and galaxy assembly remain largely unknown. The amount of cold gas in a galaxy reflects the complex interplay between processes that either replenish it, such as cooling and accretion or mergers with gas-rich galaxies; or deplete it, such as environmental effects, star formation (SF), and feedback from massive stars and active galactic nuclei (AGNs). In the “downsizing” scenario of galaxy evolution (Cowie et al., 1996), massive galaxies are most efficient in consuming their gas reservoirs at earlier times. Very massive galaxies with a substantial supply of cold gas are thus expected to be rare locally. However, the recently-completed Arecibo Legacy Fast ALFA (ALFALFA) extragalactic HI survey (Giovanelli et al., 2005; Haynes et al., 2011), with its significant volume sensitivity, detects thousands of massive HI disks with , comparable to the massive HI disks detected at (Catinella et al., 2008). Understanding the rare, local high HI mass population is important because they represent the present day counterparts of the populations which are likely to dominate future studies of HI in galaxies at higher with the next generation of radio telescopes, e.g., the Square Kilometre Array (SKA). The HIghMass study will establish the local standard of such HI massive disks to be used as the benchmark in the investigations into evolutionary trends with redshift by the future HI surveys.
Selected examples of very massive but gas-rich galaxies have been studied in recent years, with most belonging to the extreme category of low surface brightness (LSB) galaxies known as the “crouching giants” (Disney & Phillipps, 1987) or “Malin 1 cousins”. Malin 1 itself is both massive and gas-rich (Lelli et al., 2010), as are other members of the class. For instance, NGC 765 is shown to have one of the highest HI-to-optical luminosity ratios and one of the largest known HI disks, with (Portas et al., 2010). Moreover, UGC 8802 included in the GALEX-Arecibo-SDSS (GASS) survey of massive galaxies (Catinella et al., 2010) is found to have , but a low and remarkably evenly distributed star formation rate (SFR) surface density (Moran et al., 2010). The extremely high ratio of current SFR to existing stellar mass () surface density in the outer disk implies that all of its stars must have formed within the past 1 Gyr.
Because it provides the first full census of HI-bearing objects over a cosmologically significant volume in the local Universe, the ALFALFA survey is most effective in detecting these rare massive and gas-rich systems (Huang et al., 2012b), and enables, for the first time, their systematic study as an exceptional local population. Hence, our study focuses on the most HI massive and high HI gas fraction () disks detected in the ALFALFA survey, hereafter identified as the “HIghMass” sample.
The presence of massive HI disks in the local Universe remains a puzzle, implying unusual physical conditions of gas depletion and/or supply. On the one hand, the higher-than-average HI gas fraction found in the HIghMass galaxies may result from association with underluminous stellar disks, i.e., the galaxies may have experienced an arrested stage of evolution in the past and are thus “star-poor”. Theoretical models predict that galaxies in high spin parameter (, characterizing the mass-normalized angular momentum) DM halos have unusually extended gaseous disks with large disk scale lengths and low surface densities (e.g. Mo et al., 1998; Boissier & Prantzos, 2000; Kravtsov, 2013). As a result, the gas infall and consumption times are so long that a phase of significant SF would never have been reached (Li et al., 2012).
Although their total HI masses are high, the classical LSB galaxies are indeed found to have low HI surface densities. SF is an extremely inefficient process in such diffuse disks, e.g., Malin 1 (Bothun et al., 1987; Impey & Bothun, 1997), in agreement with the expectation of canonical star formation laws (SFLs) and the observed Kennicutt-Schmidt (K-S) relation. The slowly rising rotation curves found in the Malin-type galaxies imply that they are dominated kinematically by DM, and their DM halos are less concentrated with larger s (Pickering et al., 1997). Giant LSB galaxies are observed to have a large amount of angular momentum in their disks, in agreement with the formation of LSB galaxies as predicted by recent hydrodynamic simulations (Kim & Lee, 2013). This scenario is also consistent with the small DM perturbations found commonly in cosmological low density regions with late formation (Mo et al., 1994).
In contrast to the explanation of a depressed star formation history, the exceptionally high may be attributed to the late accretion of cold gas, leaving the galaxies with “too much gas”. Rather than hot accretion (post-shock cooling from a quasi-spherical halo), cold accretion (clouds, streams, filaments) is theoretically considered as an important aspect in the process of galaxy formation at high , and is perhaps still occuring in low-mass galaxies and in low-density regions today (Kereš et al., 2005; Croton et al., 2006). The models that assume a slowly evolving equilibrium between gas inflow, outflow, and SF can well reproduce the observed evolution of the SF sequence, the Tully-Fisher relation, and other scaling relations (e.g., Bouché et al., 2010; Fraternali & Tomassetti, 2012), etc. In the local Universe, it is possible to detect the emission from the diffuse infalling structures with sensitive HI observations, e.g., extra-planar HI, HI tails and filaments (Sancisi et al., 2008). While in a canonical picture, gas cooling from the virial temperature spends a considerable amount of time in the galactic halo so that it has the same specific angular momentum as the underlying DM, high-resolution cosmological hydrodynamic simulations suggest that gas accreted in cold mode enters a galaxy halo along filaments with more specific angular momentum than the DM, with the gas well characterized by at the time of accretion (Stewart et al., 2013). The resulting disks of cool gas are dense enough to form HI and can thus help to explain the frequency of observed extended UV disks (Lemonias et al., 2011) and extended, warped, or lopsided HI disks (Sancisi et al., 2008). Such newly accreted gas may be retarded in producing SF if it is stable against contraction and stays in the low surface density outer disk where HI dominates over H2. On the other hand, it has been suggested that the presence of a bar may induce radial gas flows which actually trigger SF (Martin & Roy, 1994).
To unravel the origin and current evolutionary state of the High HI mass, HI-rich galaxies at , we began a campaign in 2009 to gather multi-wavelength data for a volume-limited sample of 34 galaxies selected from ALFALFA by their high HI mass and high gas-to-stellar mass ratio (for their stellar mass). The complete HIghMass dataset will eventually enable the understanding of the gaseous, stellar, and DM components of these exceptional systems. This paper is the first in a series that presents a summary of the project definition and optical properties of the full sample, including the SF as probed by the H narrowband images and the stellar population as seen in the SDSS images. We present the sample, observing status, and basic physical properties of our targets relative to other H or ALFALFA-related surveys in Section 2. Details of the H and R-band observations, together with the catalogs of optical data are given in Section 3. SFRs are calculated in multiple ways and are compared against each other in Section 4. Section 5 introduces optical characteristics of the HIghMass galaxies, e.g., their HII region luminosity functions (LFs). Their SF and stellar disk properties relative to the general ALFALFA population, as well as the distribution of host halos inferred from the optical data are discussed in Section 6. We summarize the main results and prospective future works in Section 7. Image reduction, photometry processing, internal and external data quality checks are described for the H and SDSS bands in Appendix A and B, respectively.
Throughout this paper, we adopt a reduced Hubble constant and a Chabrier (2003) IMF.
2 Sample
2.1 Sample Selection and Program Overview
The ALFALFA survey achieves its spectral mapping via a drift scan technique with the Arecibo L-band feed array (ALFA) on the Arecibo 305 m antenna (Giovanelli et al., 2005). The final 3-D spectral cubes yield a median HI centroiding accuracy of 20′′ (dependent on signal-to-noise ratio) and a resolution of . In addition to properties of the detected HI signals, ALFALFA survey catalogs also include, where applicable, an assignment of the most probable optical counterpart (OC) to each HI source. The HIghMass sample galaxies have been selected from the 2011 ALFALFA catalog, .40 (Haynes et al., 2011), covering 40% of the final survey area and including 16,000 high-quality detections. For the area of overlap, the .40 catalog included crossmatches of the OCs to the SDSS Data Release 7 (Abazajian et al., 2009).
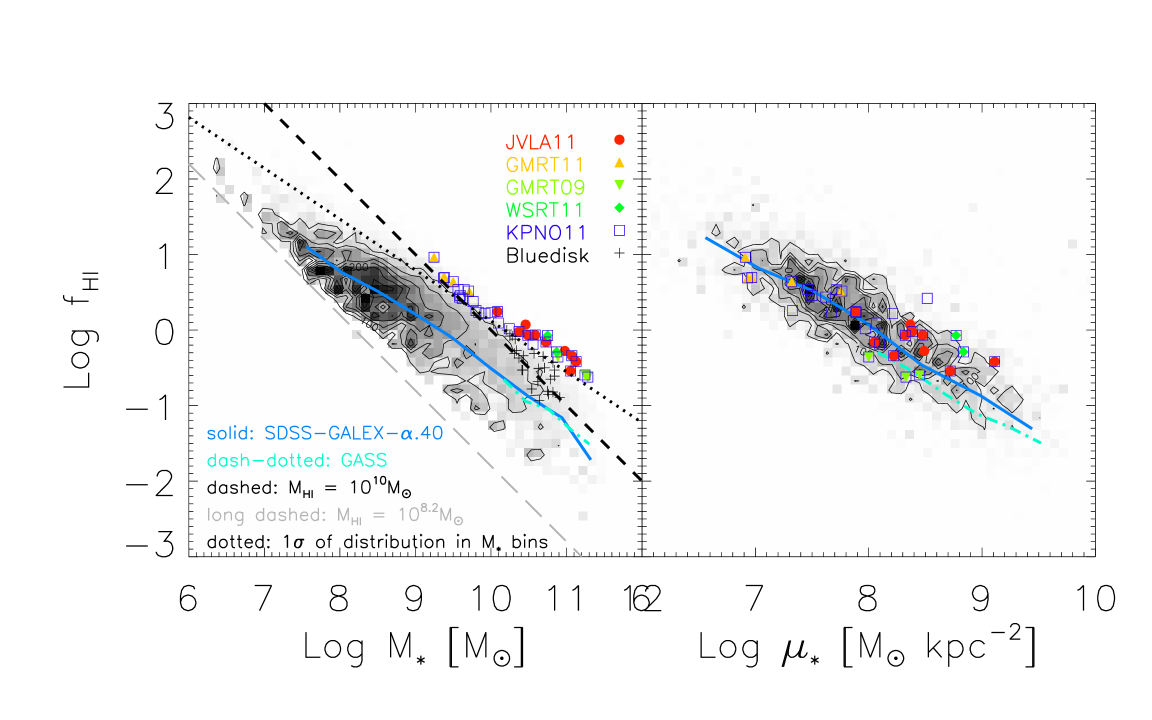
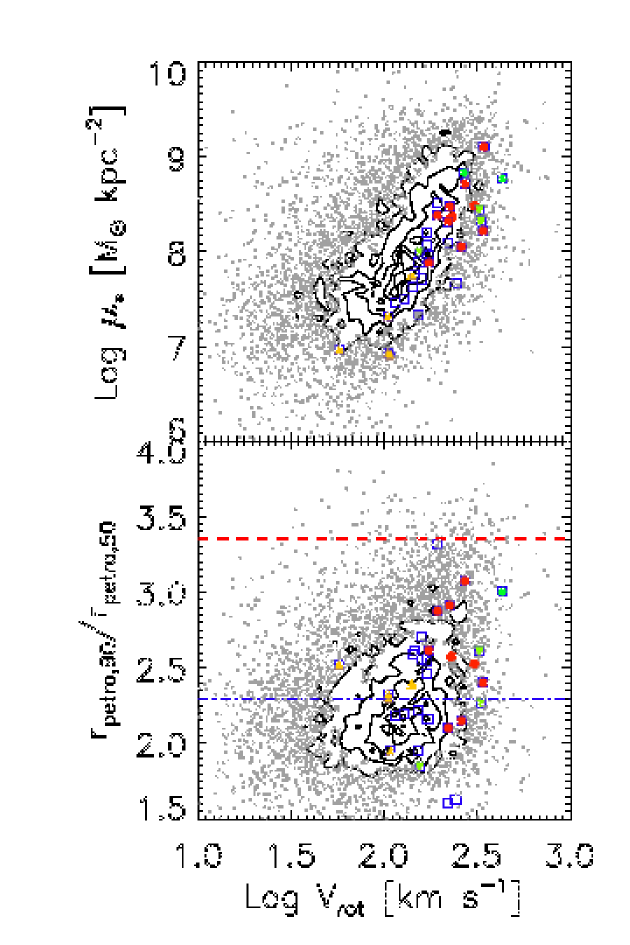
Because of the high sensitivity of the Arecibo telescope, the .40 catalog includes over 2800 galaxies with . Among these, the HIghMass sample selects the most gas-rich, relative to their stellar mass. To derive , we estimate by spectral energy distribution (SED) fitting to seven GALEX-SDSS bands (Huang et al., 2012a, b). Similar to Figure 2(c) of Huang et al. (2012b), the left panel of Fig. 1 shows the vs. diagram for the SDSS-GALEX-.40 sample, but weighted by the values, where is the overlapped survey sky volume and is the maximum distance at which an HI source can be detected by ALFALFA. Relatively HI-poor galaxies are observable in a smaller than the total survey volume, so that they are assigned a higher weight above unity. This approach corrects for the ALFALFA survey incompleteness (Haynes et al., 2011) in order to mimic the scaling relations derived from a volume limited sample (Huang et al., 2012b). It is similar to what was applied in Baldry et al. (2004), accounting for the fact galaxies of a given absolute magnitude can be observed only within a certain redshift range. Black contours and grayscales represent the SDSS-GALEX-.40 common sample. The sharp lower edge of the general distribution arises because only the galaxies with weights below 60, or equivalently with , are included. The gray long dashed line in Fig. 1 shows the approximate lower limit of . The solid blue curve illustrates the weighted running average defined by the SDSS-GALEX-.40 galaxies, in agreement with the result derived from the GASS survey at (Catinella et al., 2013, final data release, cyan dash-dotted line). The decreasing trend of with confirms the expectation that massive galaxies are mostly gas poor. The hint of a bimodal distribution as driven by the higher portion of gas-poor galaxies at the high stellar mass end will be more prominent if the ALFALFA detections with higher weights (i.e., the HI poor galaxies with detected only nearby) are included in this plot. The bimodal distribution is consistent with the bimodal distribution in an optical color-magnitude diagram, as well as the fact that the relative number of red galaxies increases among massive galaxies with .
As an HI-selected population, galaxies detected by ALFALFA are strongly biased towards gas-rich systems with the HIghMass galaxies being the extreme cases. The black lines in Fig. 1 corresponds to the selection criteria of HIghMass galaxies: (i) has an , lying above the dashed line; and (ii) has an more than than 1 above the running average in a given bin, lying above the dotted line. These selection criteria are partly motivated by the semi-analytic model prediction in Boissier & Prantzos (2000) that those galaxies which reside in high- DM halos have preferentially higher gas fractions at fixed circular velocity. To avoid unreliable measures, we visually inspected these galaxies to eliminate cases in which the HI fluxes suffer from confusion in the ALFA beam or those in which the SDSS magnitudes suffer from significant shredding or blending. The final HIghMass program sample consists of 34 galaxies, listed in Table 1. Different subsets are observed in our comprehensive multiwavelength observing programs, accounting for the technical feasibility. For instance, targets close to bright stars were avoided in our GALEX program (GI-6; Haynes PI); targets close to strong continuum sources or with low HI fluxes were avoided in the HI synthesis mapping conducted with the Jansky Very Large Array (JVLA), the Giant Meterwave Radio Telescope (GMRT) and the Westerbork Synthesis Radio Telescope (WSRT).
The 34 HIghMass galaxies are shown superposed on the ALFALFA population as colored symbols in Fig. 1 with separate symbols identifying the galaxies included in our HI synthesis program (20 filled symbols) and those with narrowband H imaging (31 open squares: KPNO11). Most of these objects are also included in other multiwavelength programs with other facilities (GALEX, Isaac Newton Telescope, warm-Spitzer, Herschel, IRAM 30-m, CARMA, SMA). The ranges between 0.24 and 9.2, with 20/34 having . Because ALFALFA does not provide the angular resolution needed to resolve the HI disks, we have obtained HI synthesis maps of 20 objects which could be feasibly mapped with existing HI synthesis instruments, including eight observed with the GMRT (in 2009; Chengalur PI; downward triangles in Fig. 1; and in 2011; Adams PI; upward triangles), two with the WSRT (in 2011; Haynes PI; diamonds), and last ten with the JVLA (in 2011; Haynes PI; circles). By mapping the distribution and velocity of the HI gas, these observations will yield clues on the origin and nature of the HIghMass galaxies via the constraints on their DM halos placed by gas dynamics (Hallenbeck et al., 2014). In addition, recent accretion of intergalactic medium (IGM) or minor mergers of faint companions may leave signatures in the HI morphology or velocity fields.
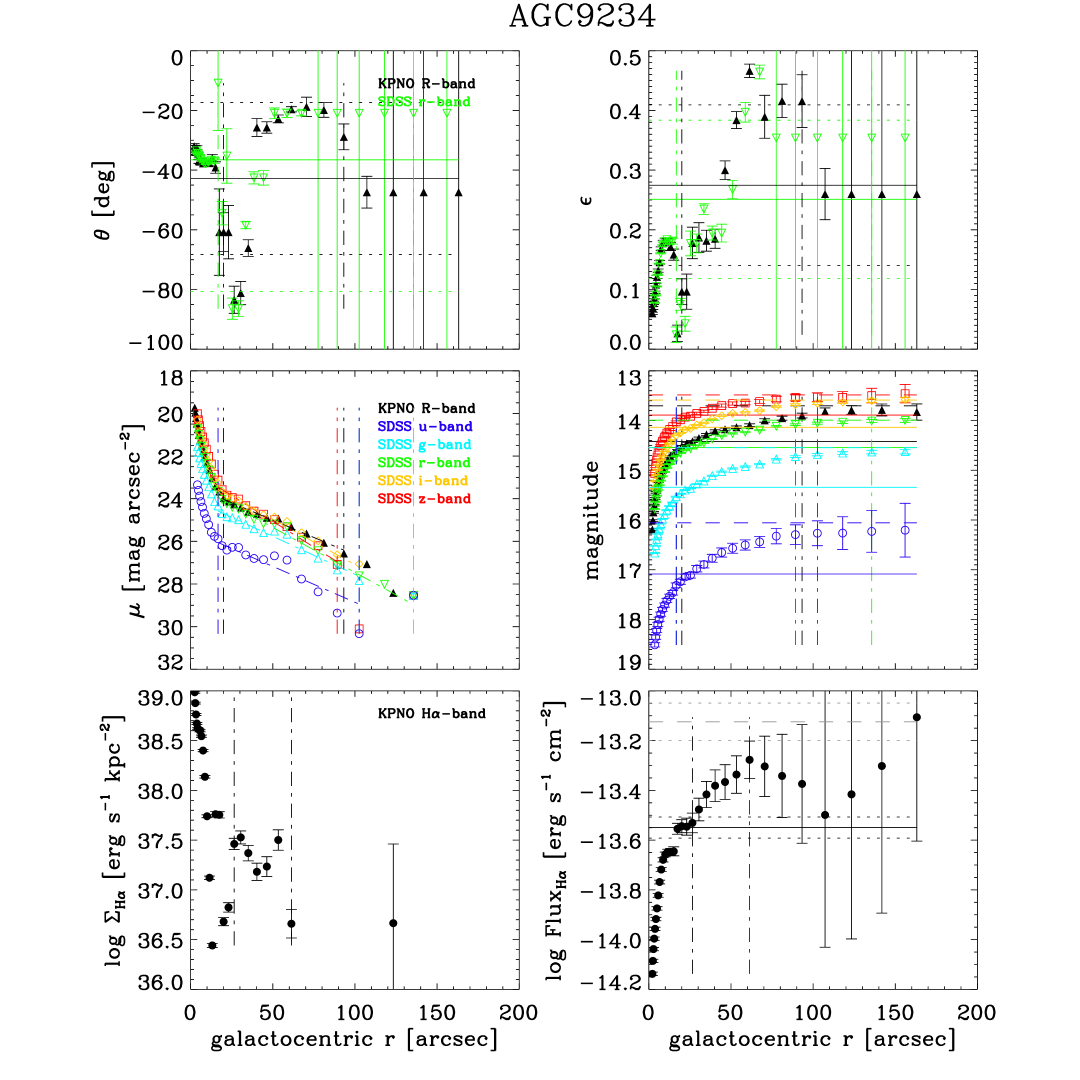
The HIghMass sample was also targeted for medium-depth observations (1200 sec) with the GALEX satellite, but only NUV observations were obtained because of the early failure of the GALEX FUV detector. However, existing GALEX archival data give insight into the intriguing behavior in some of the HIghMass galaxies. GALEX images reveal that SF in more gas-rich galaxies often extends much farther in radius than had previously been appreciated (Thilker et al., 2007). Whereas only two faint loose spiral arms are seen in optical images of UGC 9234 in the HIghMass sample, an extended UV disk hosting irregular and patchy SF is clearly evident, indicative of recent gas inflow and disk regrowth. It is known that the extent of the UV disk (normalized to the optical size) is strongly correlated to the integrated , as expected if that the amount of HI regulates the growth of SF disk in the outskirt of galaxies (Cortese et al., 2012). In combination with the resolved HI column density maps, dust maps available from Herschel observations, insights into the underlying stellar population from Spitzer, and CO fluxes from the IRAM 30-m telescope for significant subsets of the HIghMass sample, future work with the resolved SF measures derived from both UV photometry and H imaging will address the questions concerning the gas-SF interplay. We will study the HI-to-H2 transition and the empirical K-S relation in more detail to explore how such massive HI disks can exist without having converted the bulk of gas into stars yet.
The right panel of Fig. 1 illustrates the trend of HI mass fraction as a function of stellar mass surface density, for the ALFALFA population (contours and grayscale) with the HIghMass galaxies identified individually as in the left panel. Catinella et al. (2010) found to be one of the optical-derived quantities that can be used to predict accurately the in galaxies, in addition to the NUV color, or the specific SFR defined as SSFR SFR/. We follow Catinella et al. (2013) to define for the parent SDSS-GALEX-.40 sample, where is the radius containing 50 percent of the Petrosian flux in z-band measured by the SDSS pipeline. No inclination correction is applied to obtain face-on values because the Petrosian flux is determined within circular apertures by the standard procedure. However, we have reprocessed the photometry on the SDSS images with elliptical apertures (see Appendix B), so that for the HIghMass galaxies, where is the minor-to-major axial ratio. The running average as determined by our SDSS-GALEX-.40 sample (blue solid line) lies slightly above the GASS result (cyan dash-dotted line, Catinella et al., 2013). This small discrepency can be easily explained by the fact that the ALFALFA survey extends to a lower range while the at fixed is overall higher for less massive galaxies (Catinella et al., 2010). In comparison with the parent ALFALFA sample, the HIghMass galaxies have extraordinarily high at given , but overall lower (see Section 6). In an vs. diagram, because the value generally increases with decreasing for the overall population, the HIghMass galaxies are not outliers in the right panel of Fig. 1, i.e., they follow the global scaling relation between and .
2.2 Basic Physical Properties of the HIghMass galaxies
Table 1 presents the existing data for selected observations and basic properties for the full sample of 34 HIghMass galaxies. Columns are as follows:
-
•
Col(1): ALFALFA catalog identifier (also known as the AGC number).
-
•
Col(2): Other name resolution by NED; same as AGC numbers in the UGC cases.
-
•
Col(3) and (4): J2000 position of the OC assigned to the HI source, in degrees.
-
•
Col(5): Galaxy morphology classification according to NED. The presence of a strong bar is denoted by ‘B’ based on the the data release for Galaxy Zoo 2 (Willett et al., 2013).
-
•
Col(6): The HI line width , in km s-1, taken from the .40 catalog (Haynes et al., 2011).
-
•
Col(7): The HI disk rotational velocity , in km s-1, taken to be the deprojected using the axial ratio of the optical disk to correct for inclination (see Section 6).
-
•
Col(8): The systemic heliocentric recessional velocity , in km s-1.
-
•
Col(9): The adopted distance in Mpc, taken from the .40 catalog (Haynes et al., 2011).
-
•
Col(10): The logarithm of the and its error, in , taken from the .40 catalog (Haynes et al., 2011).
-
•
Col(11): Type of archival GALEX images used in Section 4, AIS = all sky imaging survey; MIS = medium imaging survey; DIS = deep imaging survey; GII = guest invited investigation; null if outside of footprint.
-
•
Col(12): Source of H images, K = our KPNO 2011 run; K* = KPNO 2012 run by Angie Van Sistine; G = GOLDmine data (Gavazzi et al., 2003); null if too far away.
-
•
Col(13): Code for our HI synthesis mapping programs as discussed in Section 2.1.
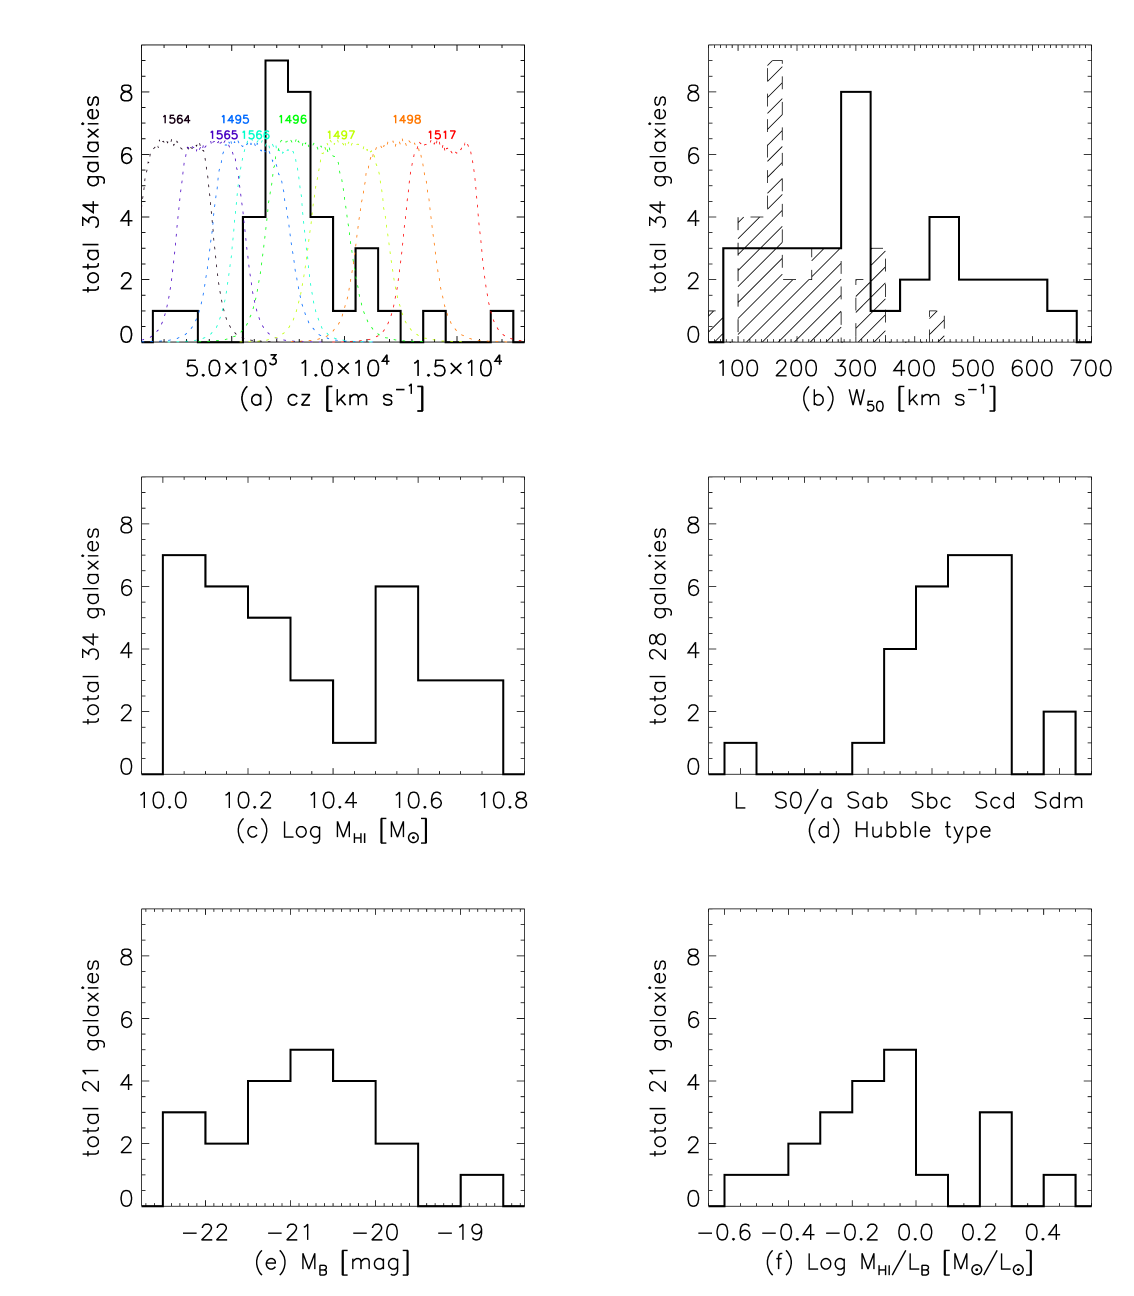
Histograms in panel (a)-(d) of Fig. 2 show, respectively, the distributions of the heliocentric recessional velocity, observed HI line width, logarithm of the , and NED morphology classification in the Third Reference Catalog (RC3) system (de Vaucouleurs et al., 1991, available for 28 galaxies). Adopting an intrinsic axial ratio of , the inclination is inferred by . The rotational velocity of the HI disk, , is thus estimated by . The resulting values, overlaid in Panel (b) by the filled histogram, are large, consistent with their status as HI massive disk galaxies (see Panel c). The only early type galaxy in the sample, UGC 4599, is a face on S0 galaxy with an outer ring where active star forming regions are found. The total asymptotic magnitudes in the B band are available from RC3 for 21 galaxies, ranging from 15.73 mag to 12.60 mag, with a median of 14.35 mag. The final two panels in Fig. 2 show the RC3 B-band absolute magnitude and logarithm of the , assuming for the sun. These B-band magnitudes are systematically brighter than our reprocessed SDSS magnitudes (measured inside elliptical Petrosian apertures, see Appendix B), but the differences are within the uncertainty. The final set of 34 HIghMass galaxies span a range of colors, morphologies, luminosities, , and SFRs (see Section 4).
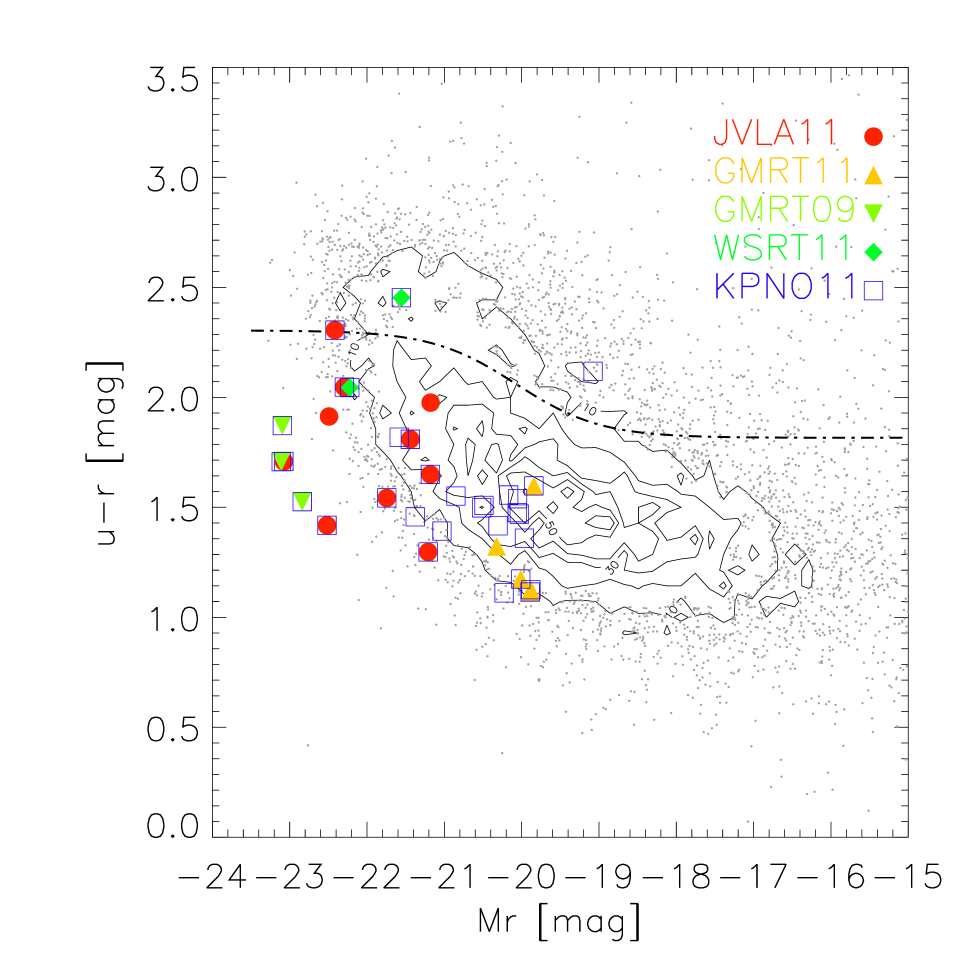
Fig. 3 illustrates the unweighted distribution of the parent .40-SDSS sample (contours and points) on an optical color-magnitude diagram; the HIghMass galaxies are superposed with the same colored symbols as in Fig. 1. The approximate dividing line which separates the “red sequence” from the “blue cloud” as presented by Baldry et al. (2004) is shown as the dash-dotted curve. In this plot, the SDSS magnitudes of the parent sample are the DR8 pipeline values, but those of the HIghMass galaxies are our reprocessed measurements (see Appendix B). The vast majority of the galaxies in the .40-SDSS population are found in the blue cloud region. Similarly, most of the HIghMass galaxies, especially the GMRT09 and JVLA11 targets, are exceptionally blue given their high luminosities. Only three HIghMass galaxies lie in the red sequence above the division, UGC 6066, UGC 9234, and UGC 4599. UGC 6066 is an edge-on red spiral and UGC 4599 is an S0 galaxy; they have the earliest morphological types in the HIghMass sample. Although the stellar light in both UGC 9234 and UGC 4599 is dominated by red central regions, the first galaxy has two loose arms and the second one has an outer ring, both being blue and LSB features along which multiple star-forming regions are identified in our continuum-subtracted H images (see Appendix A). The huge HI reservoirs in both of these red galaxies are apparently involved in the current re-growth of the outer features. Future work will investigate the star formation histories of these systems exploiting other multiwavelength datasets.
2.3 HIghMass in the Context of other Surveys
In recent years, a number of other surveys have amassed a significant body of H imaging data on selected populations of star-forming galaxies, including the GOLDmine survey of the Virgo cluster and Coma superclusters (Gavazzi et al., 2003). Out of the HIghMass galaxies, UGC 7686 happens to be a background galaxy in the Virgo direction so that is imaged by the GOLDmine survey. However, the ALFALFA galaxies are biased against cluster environments (Martin et al., 2012). Another ALFALFA-related H program, H3 (Gavazzi et al., 2012), is in fact lacking in objects with , because of the well-known cluster HI deficiency and the relatively small volume sampled.
The galaxies in the HIghMass program can be most easily distinguished from very local surveys, e.g, the survey of 52 dwarf-dominated galaxies in the local volume (Karachentsev & Kaisin, 2010), the surveys of 140 local irregulars by Hunter and collaborators (Hunter & Elmegreen, 2004), or the 11 Mpc H UV Galaxy Survey (11HUGS; Kennicutt et al., 2008), by its inclusion of massive and luminous galaxies which are too rare to be included in surveys of such limited volume. Note that Hunter & Elmegreen (2004) have used 74 spiral galaxies spanning the range of morphologies from Sab to Sd as compiled by Kennicutt (1983) for comparison. However, the distribution of that Sab-Sd sample peaks around , which is significantly HI poorer than our galaxies with similar Hubble types (see Fig. 2f). Instead, the less massive blue compact dwarfs (BCDs) in Hunter & Elmegreen (2004) have comparable values to our galaxies (see Fig. 4 in their paper). This can be understood as a result of the general increasing trend of with decreasing .
Most H surveys covering the complete morphological spectrum have also been limited to distances of less than 30 Mpc, including the SIRTF Nearby Galaxies Survey (SINGS; Kennicutt et al., 2003), the H Galaxy Survey sampling 334 galaxies (HGS; James et al., 2004), and the JCMT Nearby Galaxies Legacy Survey of 156 nearby galaxies (NGLS; Sánchez-Gallego et al., 2012). Similar to ours, the sample of the last survey has been HI flux selected in order to avoid an SFR-driven selection while ensuring that the galaxies have a rich ISM. The Hubble-type distributions of spirals from these surveys are similar, peaking around Sc; in fact, the HIghMass sample has a larger fraction of galaxies with later types, consistent with the well-known correlation between high and late-type morphology. However, even a volume out to 30 Mpc contains few truly massive HI disks, with only a handful of galaxies of found in those surveys.
An exception is the Survey for Ionization in Neutral-Gas Galaxies (SINGG; Meurer et al., 2006), consisting of 468 galaxies selected from the HI Parkes All-Sky Survey (HIPASS; Meyer et al., 2004). All of their targets are detected in H, confirming that non star-forming galaxies with are very rare. SINGG includes galaxies as distant as 80 Mpc, although the majority still have km s-1. By comparison, only one of the HIghMass galaxies, UGC 4599 has km s-1, whereas our median 7660 km s-1 (100 Mpc). While SINGG Release 1 (Meurer et al., 2006) includes 13 HIPASS sources with and 3 more with (none with ), multiple galaxies luminous in H are found to be associated with a single HI source for 9/16 of them. In contrast, we have dropped targets with massive companions to minimize such kind of confusion. As a result, the HIghMass galaxies, being extremely HI massive, are underrepresented by even the SINGG sample.
In addition, there are several H surveys of particular galaxy types. Analysis of Interstellar Medium of Isolated Galaxies (AMIGA; Verdes-Montenegro et al., 2005) compiles 206 galaxies from the Catalog of Isolated Galaxies (CIG; Karachentseva, 1973). Only UGC 5711 in our sample is included in the CIG. Schombert et al. (2011) present a recent H imaging survey for a large sample of LSB galaxies. Although the optical color of their galaxies are blue, being comparable to the dwarf galaxies and gas-rich irregulars, their SSFRs are a factor of ten less than other galaxies of the same baryonic mass (Schombert et al., 2011). In contrast, the HIghMass galaxies exhibit healthy ongoing SF globally (see Section 6), neither do they belong exclusively to the isolated population.
The vs. correlation obtained by the GASS survey (Catinella et al., 2010) is illustrated along with the ALFALFA population in Fig. 1. The parent sample of GASS is defined by the intersection of the footprints of the SDSS primary spectroscopic survey, the projected GALEX medium imaging survey (MIS) and the ALFALFA region. Further selection criteria include a stellar mass cut () and a redshift cut (). The final GASS targets are randomly drawn from this parent sample in a manner which balances the distribution across , but any sources already detected by ALFALFA are not re-observed. By design, the less massive objects with but high gas fractions are not probed by the GASS. Above this cutoff, HIghMass galaxies fall within the extreme tail of the distribution in each bin, which are likely to be excluded statistically from the GASS target list. Given the and measurements, there is only one galaxy, UGC 8802, lying above the dotted line in our Fig. 1, out of the 250 galaxies in total from the GASS final data release (Catinella et al., 2013). This galaxy meets all our selection criteria. Lying north of Dec., it is outside of the footprint of the .40 catalog, but has comparable physical properties to the HIghMass galaxies, e.g., low and evenly distributed SFR surface density, strong color gradient, and extremely high SSFR in the outer disk (Moran et al., 2010).
Finally, motivated by the study of GASS galaxies, a project entitled “Bluedisk” has been devoted to obtaining HI maps of 25 nearby galaxies predicted to have unusually high (Wang et al., 2013). The sample is selected from the SDSS DR7 MPA/JHU catalogue, using the follow criteria: , , Dec. , with high signal-to-noise ratio (S/N) NUV detection in the GALEX imaging survey, and have high relative to the average trend as predicted from measurements of , NUV color, and color gradient of the galaxy. Given their final measurements of and , however, only one target with the lowest among their “gas-rich” sample (see black crosses in Fig. 1) sits above the dotted line, denoting one of the selection criteria of the HIghMass galaxies. Again, the HIghMass sample is more extreme than the “Bluedisk” galaxies.
In summary, because of their rarity, the HIghMass galaxies form a unique sample of exceptionally gas-rich massive HI disks and their study will benefit future HI surveys of their higher redshift counterparts which are likely to dominate the planned deep field surveys by the SKA and its pathfinders. The expected number of resolved detections peaks in the HI mass bin of (Duffy et al., 2012), for both the ASKAP WALLABY survey (out to , with a mean redshift of 0.05 at S/N = 6) and the DINGO DEEP survey (out to , with a mean redshift of 0.12 at S/N = 6). Therefore, the HighMass galaxies are representative of this class of object, in terms of HI mass. Meanwhile, there is an ongoing study of 53 SDSS-selected galaxies at , using 400 hr Arecibo telescope time (Catinella & Cortese, in prep). Those HI bearers at are found to be HI-rich, blue, and of low stellar mass surface densities, sharing similar properties with the HIghMass galaxies (see below). Preliminary analysis shows that the stellar massive HIghMass galaxies align with those HI detections in the vs. plot (Fig. 1), and can be their low redshift analogues (private communication). The HIghMass galaxies will be studied along with the HI bearers to further illustrate this (Catinella & Cortese, in prep).
3 Observations and Optical Data
3.1 H and R-band Observations
All of the H and R imaging reported hereafter was obtained in Feb–Mar 2011 over 5 nights (2 other nights were lost to bad weather), using the T2KB detector on the 2.1-m telescope at KPNO. The CCD has a pixel scale of 0.43′′ pixel-1 and a chip size of 2048 2048, so that all our targets can be easily imaged by a single pointing. The detector was used in the 3.1 ADU-1 gain mode. The standard R filter is used to provide broadband imaging along with continuum subtraction for the narrowband images. Due to the wide spread of , a series of eight H filters are used, in ascending central wavelength, kp1564, kp1565, kp1495, kp1566, kp1496, kp1497, kp1498, and kp1517. Their bandpasses are superimposed on the velocity histograms in Fig. 2(a) by dotted lines in colors, with peak transmission . The H filter for each source is selected to be the one whose central wavelength best matches the of HI line; in all cases, the FWHM of the filters () are sufficient to cover the velocity width of the HI line. However, in most cases, the [NII]6548 and [NII]6584 are also contained within the filter bandpass. For the sake of clarity, while we will correct for this contamination when we calculate the SFR from the H luminosity in Section 4, we generically refer to H as the total detected H+[NII] flux in this section. Because of the lack of an appropriate H filter, the most distant HIghMass galaxy UGC 8797 could not be observed. Two other HIghMass galaxies UGC 12506 (the lone ALFALFA fall sky target, an image of which has been kindly provided to us by A. van Sistine and J. Salzer) and UGC 7686 (which had an extant H image from the GOLDmine) were also not observed in this run.
We utilized an observing mode consisting of three H exposures (15 min each) and two or three R band exposures (3 min each). Calibration frames included afternoon bias and dome flat fields. Observations of galaxies were bracketed by standard star exposures of both spectrophotometric standards HD19445, HD84937, and BD +26 2606 (Oke & Gunn, 1983), and Landolt (1992) standards (in both R and I bands yielding the color term), at regular intervals throughout the night to calibrate the flux zero points. Galaxies requiring the same H filter were grouped into observations on the same nights to minimize standard star exposures. There were three clear nights under photometric conditions; on these the standard stars were imaged and then galaxy frames taken on the other non-photometric nights were calibrated by bootstrapping to the photometric frames. The smoothed images (see Appendix A) have an average seeing of . Unfortunately, none of the images of UGC 4599 were taken on photometric nights and a very bright star near UGC 190277 causes serious bleeding on the CCD. As a result, the final H measurements to be presented are for 29 HIghMass galaxies. Unsurprisingly, H emission is detected in all of our targets as HI-selected galaxies.
3.2 H and R-band Photometry Catalog
Details of the image reduction, continuum subtraction, surface photometry, and external checks of the H data quality can be found in Appendix A. Here we present the H and R-band measurements from our KPNO images of 29 HIghMass galaxies in Table 2. The [NII] and extinction corrections are applied only when calculating SFRs in this work; hence any H EW values and line fluxes here are in fact for H+[NII], uncorrected for internal or Galactic extinction, but corrected for continuum over-subtraction (see Appendix A). However, we have checked that none of these corrections affect the qualitative results to be addressed. Columns are as follows:
-
•
Col(1): The ALFALFA catalog identifier (also known as the AGC number).
-
•
Col(2): KPNO H filter used in our observing run.
-
•
Col(3): , the position angle (measured eastward from North) and its associated error, measured on the R-band image, in units of degrees.
-
•
Col(4): , the ellipticity and its associated error measured on the R-band image, defined as .
-
•
Col(5): , the disk surface brightness extrapolated to the galaxy center as measured on the R-band image, in units of mag arcsec-2, and not corrected for inclination (see Section 5).
-
•
Col(6): , the disk scale length measured on the R-band image, in units of arcsec.
-
•
Col(7): , the disk scale length of the outer disk (see Section 5); the value is null if only a single disk is fit.
-
•
Col(8): , the semi-major axis of the ellipse that encompasses 50% of the R-band Petrosian flux, in units of arcsec.
-
•
Col(9): , the semi-major axis of the ellipse that encompassess 90% of the R-band Petrosian flux, in units of arcsec.
-
•
Col(10): , the major axis of the ellipse defined by the R-band isophote of 25 mag arcsec-2, in units of arcsec.
-
•
Col(11): , the R-band magnitude and its associated error in the Johnson-Cousins system; with or without superscription if the magnitudes are measured as mag8 (the magnitude extrapolated to 8) or the Petrosian magnitude. See Appendix A for the definitions of the two types of global magnitudes and validation of their consistency. These magnitudes are not corrected for internal or Galactic extinction.
-
•
Col(12): Logarithm of the line flux of H+[NII] and its associated error, in units of erg s-1 cm-2; with (without) superscription if measured as mag8 (Petrosian magnitude).
-
•
Col(13): Equivalent width (EW) of the H+[NII] lines and its associated error, in units of Å. See Appendix A for details of its derivation.
-
•
Col(14): Logarithm of the SFR derived from the H luminosity (see Section 4), in units of yr-1, with all corrections applied.
3.3 SDSS photometry Catalog
In addition to our own broadband R magnitudes, we use public SDSS images to provide magnitudes at its filter bands. However, because of their relatively large size, low surface brightness and patchy nature, we use our own photometric analysis of the SDSS magnitudes rather than relying on the standard SDSS pipeline which is not optimized for systems of these characteristics. Details of the photometry reprocessing, an internal comparison with the KPNO measurements, and external checks of data quality (including a comparison with the SDSS pipeline derived values) can be found in Appendix B. Here we present our SDSS measurements for all 34 HIghMass galaxies, along with the SED fitting derived quantities to these five bands in Table 3. All magnitudes are in the AB system. Columns are as follows:
-
•
Col(1): The ALFALFA catalog identifier (also known as the AGC number).
-
•
Col(2)-Col(6): Magnitudes and their associated errors in the five SDSS bands, respectively; with (without) superscription if measured as mag8 (Petrosian magnitude) and not corrected for internal or Galactic extinction.
- •
-
•
Col(8): , the r-band face-on surface brightness at the half light radius, in units of mag arcsec-2 (see Section 5).
-
•
Col(9): , the r-band internal extinction and its associated error, derived by SED fitting using the five SDSS bands (prior distribution applied; Huang et al., 2012b), in units of mag.
-
•
Col(10): , the final r-band absolute magnitude after applying all corrections. We adopt the measurements by DIRBE (Schlegel et al., 1998) to account for foreground reddening, and the internal extinction is corrected given the .
-
•
Col(11): Logarithm of the stellar mass and its associated error, derived by SED fitting, in units of (see Section 4).
-
•
Col(12): Logarithm of the stellar mass surface density in units of kpc-2 (see Section 2.1); the value is null if the radius containing 50 percent of the Petrosian flux in z-band is undetermined.
-
•
Col(13): Logarithm of SFR and its associated error, derived by SED fitting, in units of yr-1 with all corrections applied (see Section 4).
- •
4 Calculation of SFRs
4.1 SFRs from SED fitting, SFR(SED)
Through a coincidence of dust and stellar population evolution physics, the dust-age-metallicity degeneracy actually helps in the estimate of from optical colors (Taylor et al., 2011). While H is recognized as an instantaneous indicator sensitive to SF activity over the timescale of 10 Myr, images obtained in the SDSS u-band respond to variations in the SFR over 100-500 Myr. Our future study of the Spitzer IRAC imaging will trace the low-mass star population which dominates the mass budget in galaxies, so as to better constrain the . In this section, we make use of the photometry derived in Appendix B to perform SED fitting to the five SDSS bands in order to obtain the and SFR estimates.
Further details of the method and fitting quality for the .40–SDSS (DR7) sample are found in Salim et al. (2007) and Huang et al. (2012a). We use the Bruzual & Charlot (2003) stellar population synthesis code to construct the model SEDs, adopting a Chabrier (2003) IMF. Random bursts are allowed to be superimposed on a continuous star formation history (SFH). We correct the observed magnitudes for Galactic reddening and implicitly apply -corrections by convolving the redshifted model SEDs with SDSS bandpasses in the rest frame. The full likelihood distributions of parameters are derived following a Bayesian approach, so that the errors due to model degeneracies are properly characterized by the width of the resulting probability density functions. In addition, the Gaussian prior distribution of the effective optical depth in the V band, , is applied, accounting for the fact that the extinction depends not only on the inclination but also on the luminosity of galaxy (Giovanelli et al., 1997). As a result, the fitting-derived internal extinction is improved (Huang et al., 2012b), in terms of both systematic and random uncertainties. Although dust has little effect on the estimates, the uncertainty of the extinction correction can be the dominant term in the estimate of the SFR from optical or UV SFR indicators, e.g., H. Approximately half of the starlight emitted in the optical and UV is absorbed by interstellar dust and re-radiated at infrared wavelengths (Kennicutt & Evans, 2012), so that it is important to assume a prior distribution to better constrain the extinction. Our SED fitting-derived measures of , SFR(SED), and are given in Table 3. We also follow the same fitting procedure as for the .40–SDSS (DR8) sample, yielding physical quantities of the general population to be presented together with the HIghMass galaxies in Section 6.
4.2 SFRs from , SFR(H)
H emission traces stars with masses greater than and hence provides a measure of very recent massive SF. In addition to the need to assume an IMF to extrapolate the number of high mass stars (relevant for most SFR indicators), H-based SFRs need large and uncertain extinction corrections (like UV and other blue indicators, e.g., [OII] and H). Central AGN may also contribute to the observed H line emission (like [OII], [OIII], radio, and IR indicators). The specific drawbacks of H-based SFRs is contamination in most of the filters used in the observations by the [NII]6548 and 6584 lines. In general, the largest systematic errors are dust attenuation and sensitivity to the population of the upper IMF in regions with low absolute SFRs (Kennicutt & Evans, 2012). Given their integrated SFRs, the incomplete IMF sampling has no impact on the HIghMass galaxies, and, the uncertainties in the internal extinction corrections to the H fluxes dominate over photometric errors as the main error in the derived SFRs.
We derive the SFR from the H luminosity adopting a recent H calibration in Kennicutt & Evans (2012),
| (1) |
Here, the last term converts a Kroupa IMF used in their work to a Chabrier (2003) IMF used by us (Bell et al., 2003). We note that the correction for stellar absorption underlying the H emission is already taken care of by the continuum subtraction (Kennicutt et al., 2008). In addition to the (1) continuum over-subtraction and (2) Galactic extinction corrections explained in Appendix A, the following corrections are applied on the observed :
(3) [NII] contamination: Although SDSS spectra are available for 33/34 of the HIghMass galaxies, they are limited by the small aperture (3 arcsec) of the fibers, covering only the nuclear regions in the majority. Additionally, according to the BPT diagram (Brinchmann et al., 2004), there are five AGNs, two low S/N LINERs, and two composite galaxies with both AGN and SF contributions among our sample. The nuclear [NII]/H ratios are most likely to deviate from the overall values. Alternatively, we adopt the scaling relation between [NII]/H and given by Kennicutt et al. (2008),
where comes from the combined SDSS magnitudes, assuming as in Kennicutt et al. (2008). Despite a large scatter, we have confirmed this relation to be systematically consistent with the SDSS flux measurements, excluding the AGNs. We further adopt a line ratio [NII]6584/[NII] to exclude the [NII]6584 contribution in five galaxies because it falls outside of the H filter.
(4) Dust extinction correction: We make use of the continuum extinction given by the SED fitting and assume a constant ratio between the nebular line and stellar continuum extinctions at the same wavelength, (Calzetti et al., 2000). Due to the same concern raised by the small fiber aperture, we choose here not to rely on the Balmer decrement derived from the SDSS spectra in order to infer . Use of the Balmer decrement may lead to an underestimate of the extinction because lines of sight with low extinction are more heavily weighted within the beam (Kennicutt & Evans, 2012), or an overestimate of the extinction induced by the fact that the disk central regions are less transparent (Giovanelli et al., 1994). In the future, we plan to explore this issue further with long-slit optical spectroscopy and Herschel data.
The final SFR(H) values with these corrections applied are presented in the last column of Table 2. The SFR(H)s for the HIghMass galaxies range from 0.34 to 21 , with a median value of 2.5 , significantly higher than the median SFR found by the other H surveys, e.g., 11HUGS, HGS, or SINGG. The difference cannot be attributed to the different corrections we applied because a comparison of the distributions (only continuum over-subtraction corrected and Galactic extinction corrected) show as well that the HIghMass galaxies tend towards high . This result is in contrast with previous understanding that HI-selected galaxies have somewhat lower and SFRs (Sánchez-Gallego et al., 2012), but agree with the finding in Huang et al. (2012b) that the HI-rich galaxies have, on average, higher SFRs at fixed .
4.3 SFR(SED) vs. SFR(H)
Fig. 4 shows the comparison of the values of the SFR derived from the SEDs, SFR(SED), and from the H luminosity, SFR(H)s, for the HIghMass galaxies. For the majority, the two quantities are in rough agreement within the uncertainties. Therefore, the standard calibration of the H SFR indicator, assuming a Chabrier (2003) IMF, is applicable to our galaxies. However, for a few sources, the SFRs derived from SED-fitting result in much lower values by almost a factor of ten. In such cases, huge error bars on the SFR(SED)s result from broad probability density functions of the SFR estimates, suggesting that the SFR(H) values represent the more realistic result. We further assess this conclusion by referring to the GALEX archive for NUV measurements; note that FUV measures which would also be useful are available for a smaller subset. With a poorer resolution ( arcsec FWHM) and a larger impact from dust extinction, the NUV images are less valuable for the purpose of tracing SFRs than our high quality H data, but we can use them here to judge the relative reliability of SFR(SED) and SFR(H). Excluding the shredded pipeline NUV magnitudes, we apply corrections for Galactic extinction, internal extinction (self-consistent values given by the SED fitting), and -corrections. The end result is that the inferred SFRs from the final NUV luminosity, adopting a Kennicutt & Evans (2012) calibration, reach better agreement with the higher values of SFR(H) than with the SFR(SED)s.
In summary, we have double checked the robustness of the SFR(SED)s and SFR(H)s, adopting a conservative error analysis to conclude that the H-derived SFRs provide more reliable measures of the SFR in those cases where the two approaches differ. We conclude that there is no evidence that the exceptional gas fractions of the HIghMass galaxies result from abnormal levels of SF at least among the massive stars. We can also rule out a significant decaying or rising SF history in the last 10 Myr relative to the last 100-500 Myr.
5 Optical Characteristics of the HIghMass galaxies
In this section, we examine the characteristics of the HIghMass galaxies as a class by studying their detailed optical properties relative to other samples of galaxies. We first take a look at the global EWHα+[NII] values and then inspect various radial profiles. The HII region LFs of six HIghMass galaxies are also presented. Intriguing features indicative of unusual behavior in their gas accumulation and SF, are identified in some systems as discussed below.
5.1 H Properties
5.1.1 The Birth Parameter b
In order to understand the EWHα+[NII] distribution of the HIghMass galaxies, we have to account for the potential variation of EW with luminosity, considering the different luminosity ranges probed by other H surveys. A number of works have shown controversial results regarding this issue: a weakly declining trend of EW with brighter was seen in Jansen et al. (2000) and Lee et al. (2007), in contrast to the conclusions of others who found no significant trend between the two quantities (James et al., 2004; Sánchez-Gallego et al., 2012). We investigated this issue in the HIghMass galaxies and found no significant correlation between the two. Thus we can directly compare the EWHα+[NII] distribution with the other surveys.
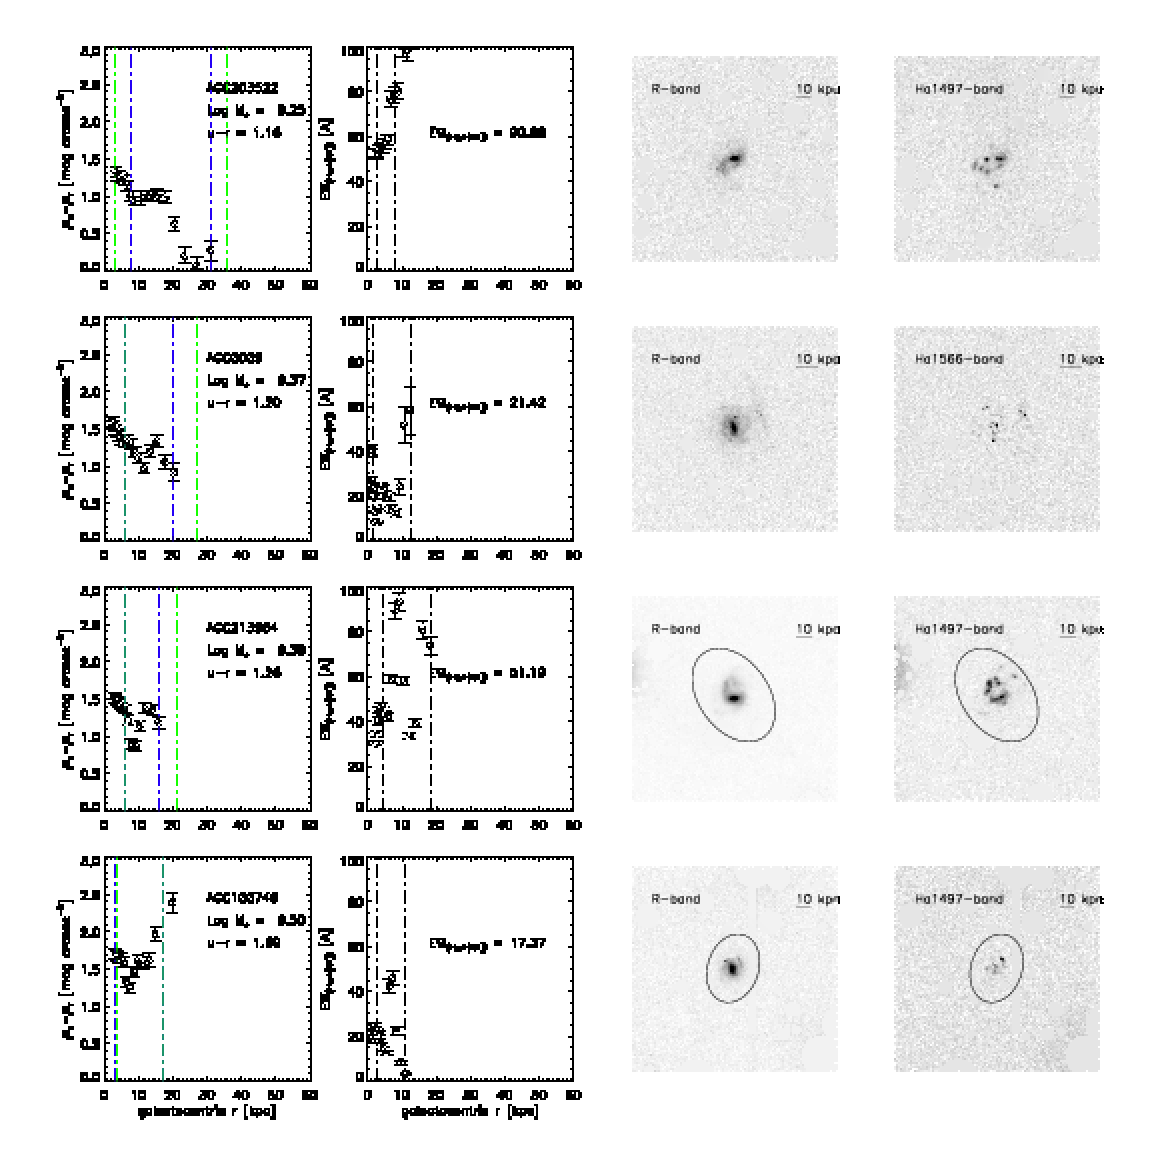
The H EW is related to the ratio of current SF to the past-averaged level, i.e., the “birth parameter” (see also Section 6). For instance, the EW distribution of galaxies included in the SINGG is centered and peaked at , indicating a (Meurer et al., 2006). In the luminosity range of , Lee et al. (2007) obtained ( 15 Å); . The EWs of the NGLS galaxies, also being HI selected, range from 1 to 880 with a median value of 27 . For the later-type spirals (Sc-Sm), Kennicutt (1983) and James et al. (2004) obtain slightly higher average EWs: 29 and 35 , respectively. By comparison, the HIghMass galaxies have () and the average is 30 . In fact, our average is nominally higher than most of the others (except for James et al., 2004), although not significant given the dispersion. The galaxy with the lowest in our sample, AGC 203522, has the highest EW (90.66 ), so that can be classified as a starburst galaxy. This rules out the hypothesis that the high values in the HIghMass galaxies result from gas being inhibited from converting into stars at the present epoch. Either past SF has been suppressed, perhaps due to the high value of the DM halo, or the galaxy has undergone recent gas accretion, giving it a fresh supply of gas and enhancing the star formation rate. Based on the initial examination of the HI synthesis mapping data for two representative HIghMass galaxies, UGC 9037 and UGC 12506, Hallenbeck et al. (2014) find that both explanations may be applicable.
5.1.2 The Radial Distribution of SFR Surface Density
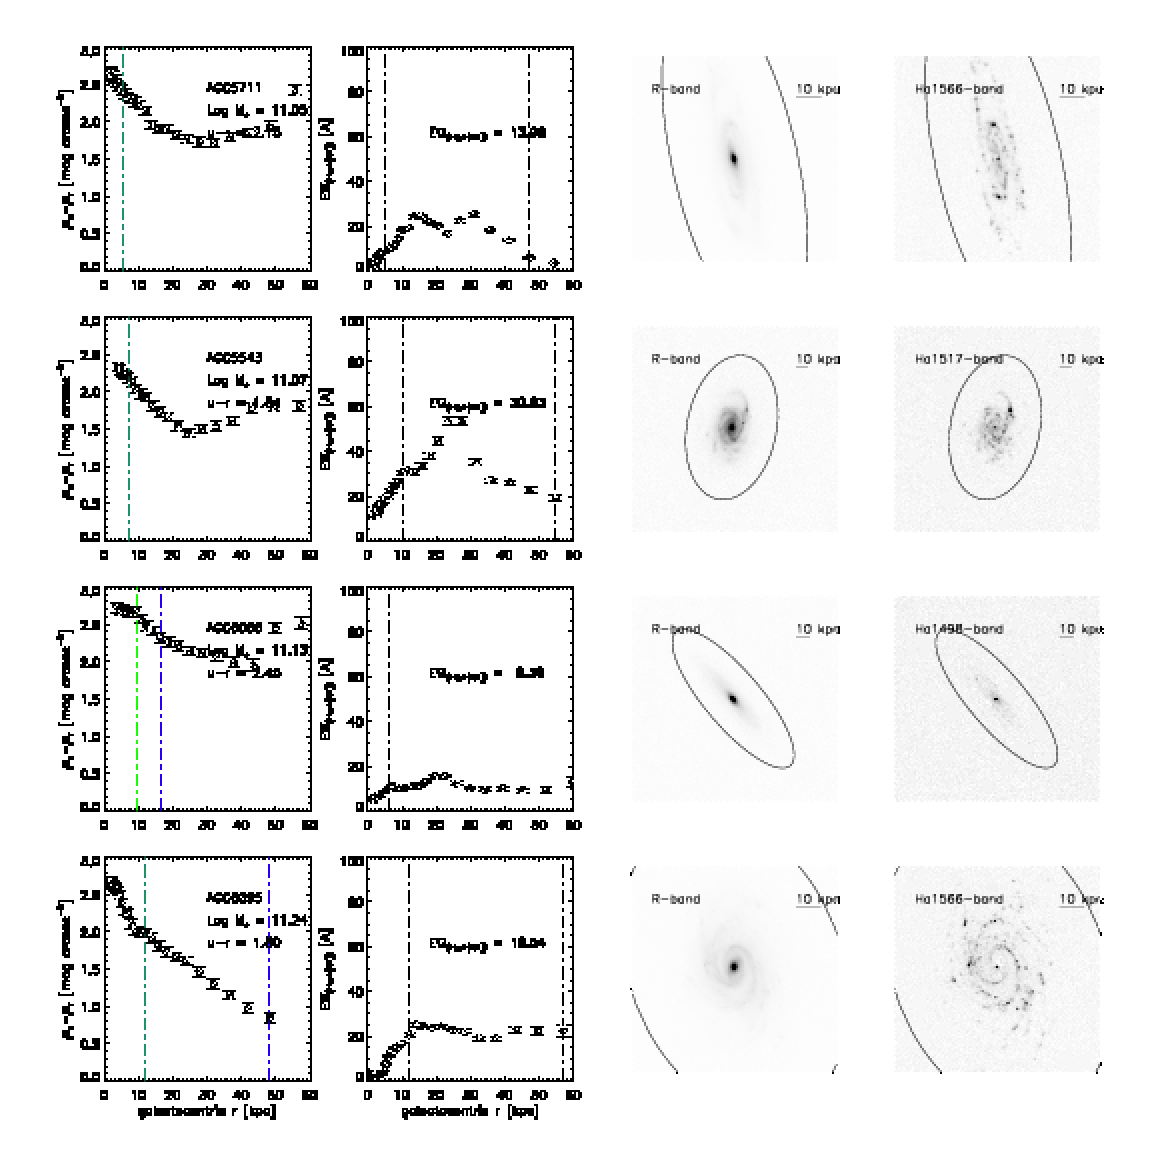
As discussed in Appendix A, we use the continuum-subtracted H images to construct azimuthally-averaged radial profiles of the surface brightness for each galaxy. These radial profiles are expected to be less smooth than the starlight since they represent a shorter-lived evolutionary stage. Here we convert them to for our future studies of the SF threshold and associated K-S relation. In addition to the global corrections applied to the total discussed in Section 4, including Galactic extinction, and [NII] contamination corrections, we follow Leroy et al. (2008) to deproject the by a factor of , where is the inclination of the disk. We do not apply a spatially-resolved internal extinction correction in order to be able to compare with other authors who use H (vs. IR) emission to characterize unobscured (vs. obscured) SF, separately. Deriving the radial profile of internal extinction is beyond the scope of this work but will be part of our future work using Balmer decrements from long-slit optical spectroscopy.
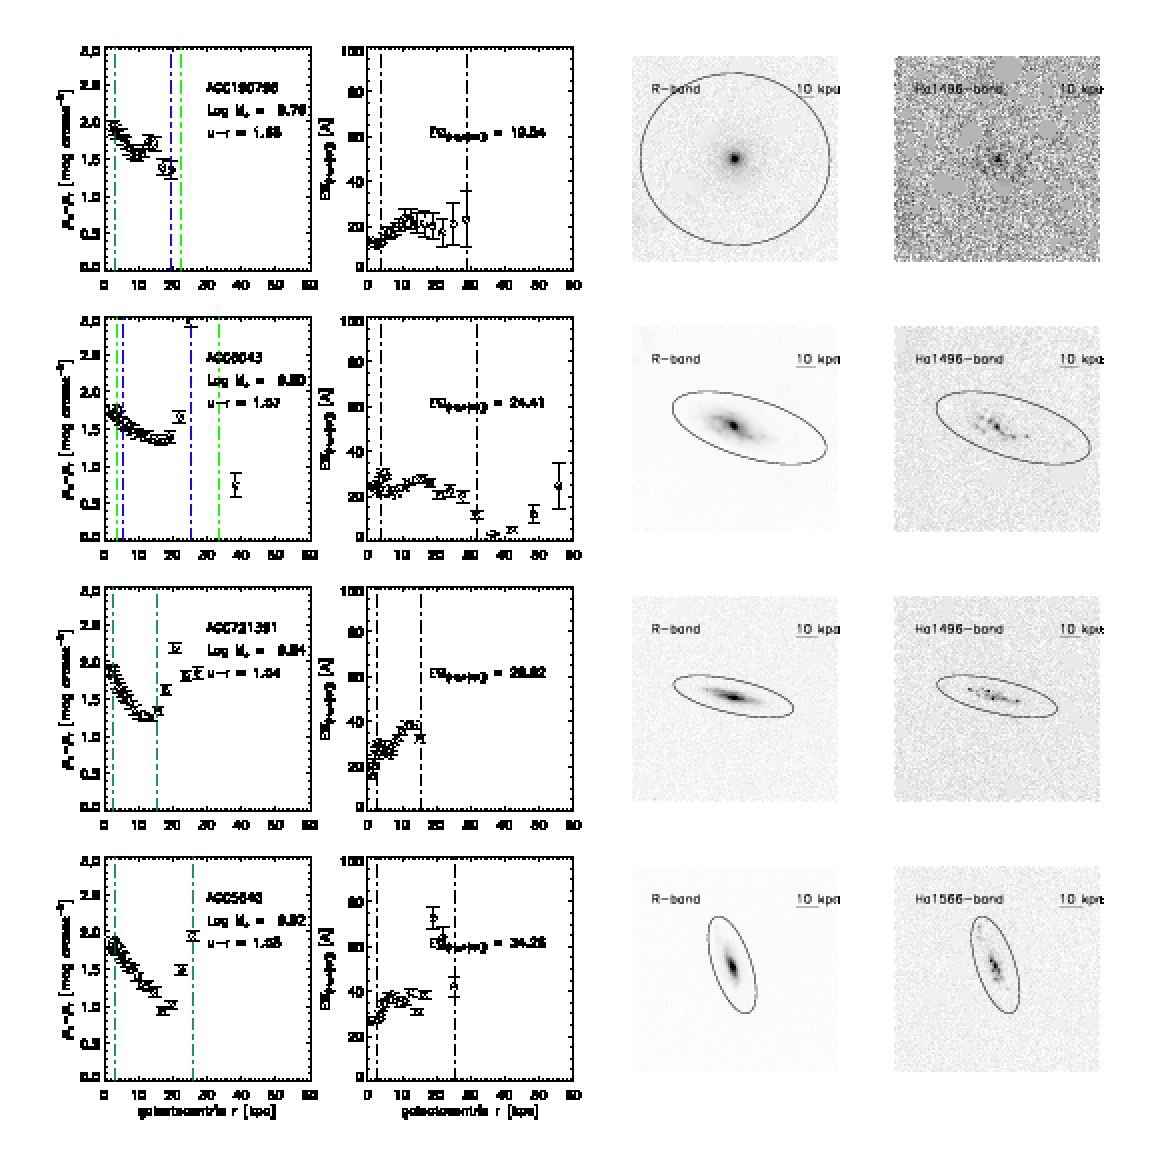
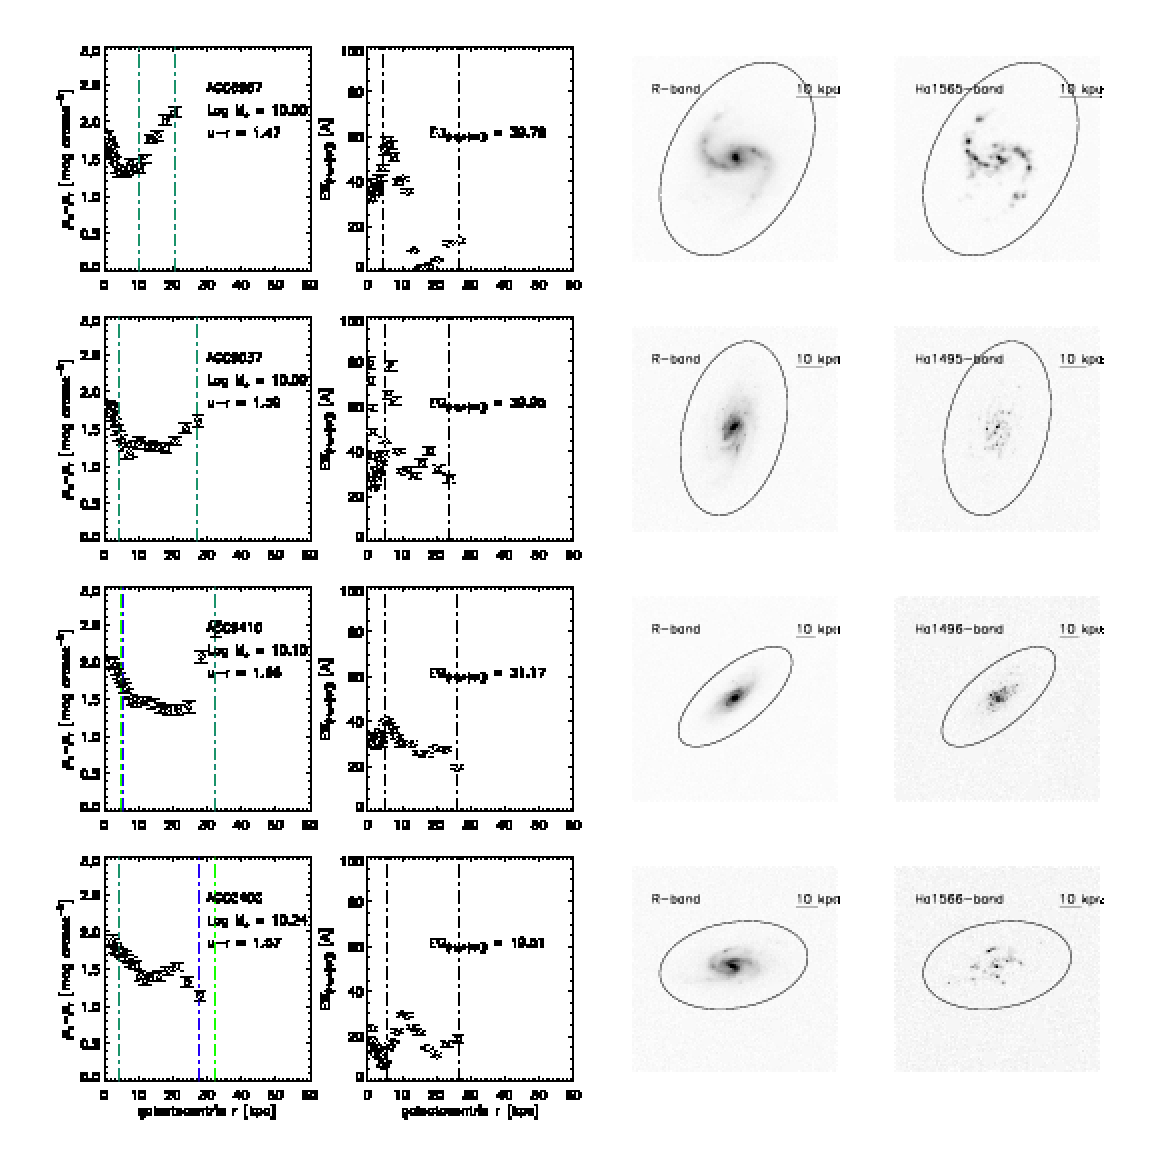
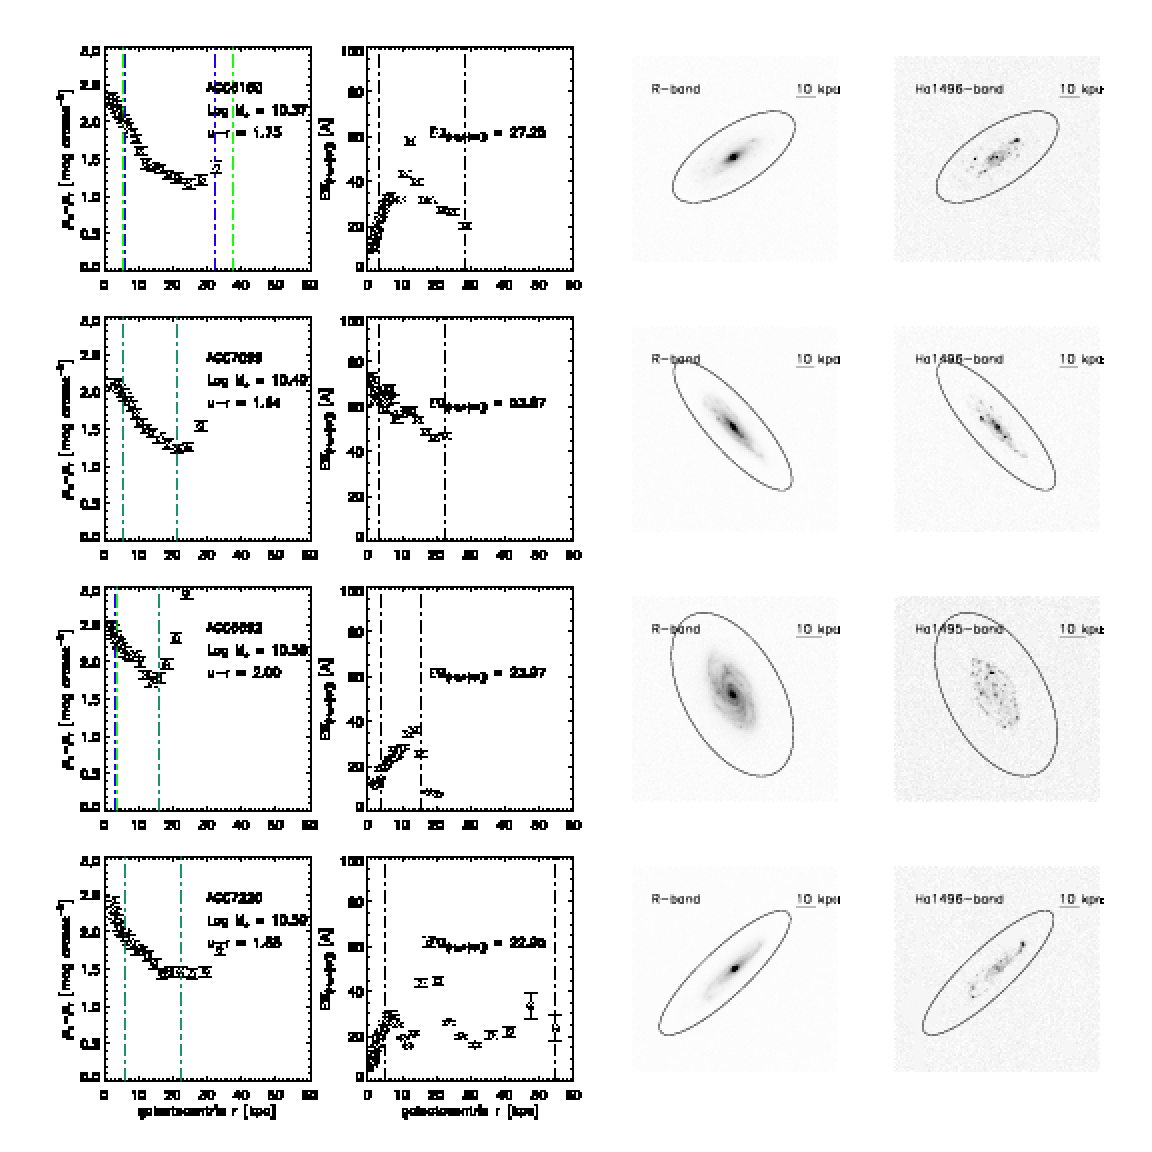
We present the radial profiles of 29 HIghMass galaxies in Fig. 5, in order of ascending integrated SFR(H), with galactocentric radius normalized by . The vertical dash-dotted lines mark the inner and outer edges of the assumed disk regions (see Appendix A). Previous works show that the typical value of the SFR25 defined as the integrated SFR normalized by the area , is 10 yr-1 among irregular galaxies (Im) (Hunter & Elmegreen, 2004). Typical spirals reach this between 0.35 and 0.81, the average being 0.5 (Kennicutt, 1989). In terms of , the Im galaxies more closely resemble the outer parts of spirals. The HIghMass galaxies have overall a lower SFR25 relative to the Sab-Sd galaxies in Kennicutt (1989), but, marginally, a higher SFR25 relative to the Im galaxies in Hunter & Elmegreen (2004). This result is consistent with the earlier finding that the galaxies with higher ratios of gas relative to their luminosity or total baryonic mass have lower (Hunter & Elmegreen, 2004). In fact, the drops below 10 yr-1 within 0.35 in nine of the 29 HIghMass galaxies (see Fig. 5). Compared to a subset of the SINGS galaxies that are dominated by HI over H2 (Bigiel et al., 2008; Leroy et al., 2008), most being late-type spirals or dwarf irregulars, the HIghMass galaxies have, on average, slightly higher . However, many of the massive spirals in the SINGS with H2 dominated centers have significantly higher than those found here. Furthermore, although it was found that most of the SF activity takes place in the Im galaxies within 3 (Hunter & Elmegreen, 2004), H emission is traceable beyond that radius in most of the HIghMass galaxies, and in some, to as far as 6, e.g., UGC 6043, UGC 6967 (LSB galaxy), UGC 5648, and AGC 248881.
Although the HIghMass galaxies have high integrated s, s (absolute value), and EWs (vigorous current SF relative to the past), the SF activity in them is spread throughout the disks and, conversely, centrally concentrated intense SF is uncommon.
5.1.3 EWHα+[NII] Radial Profiles
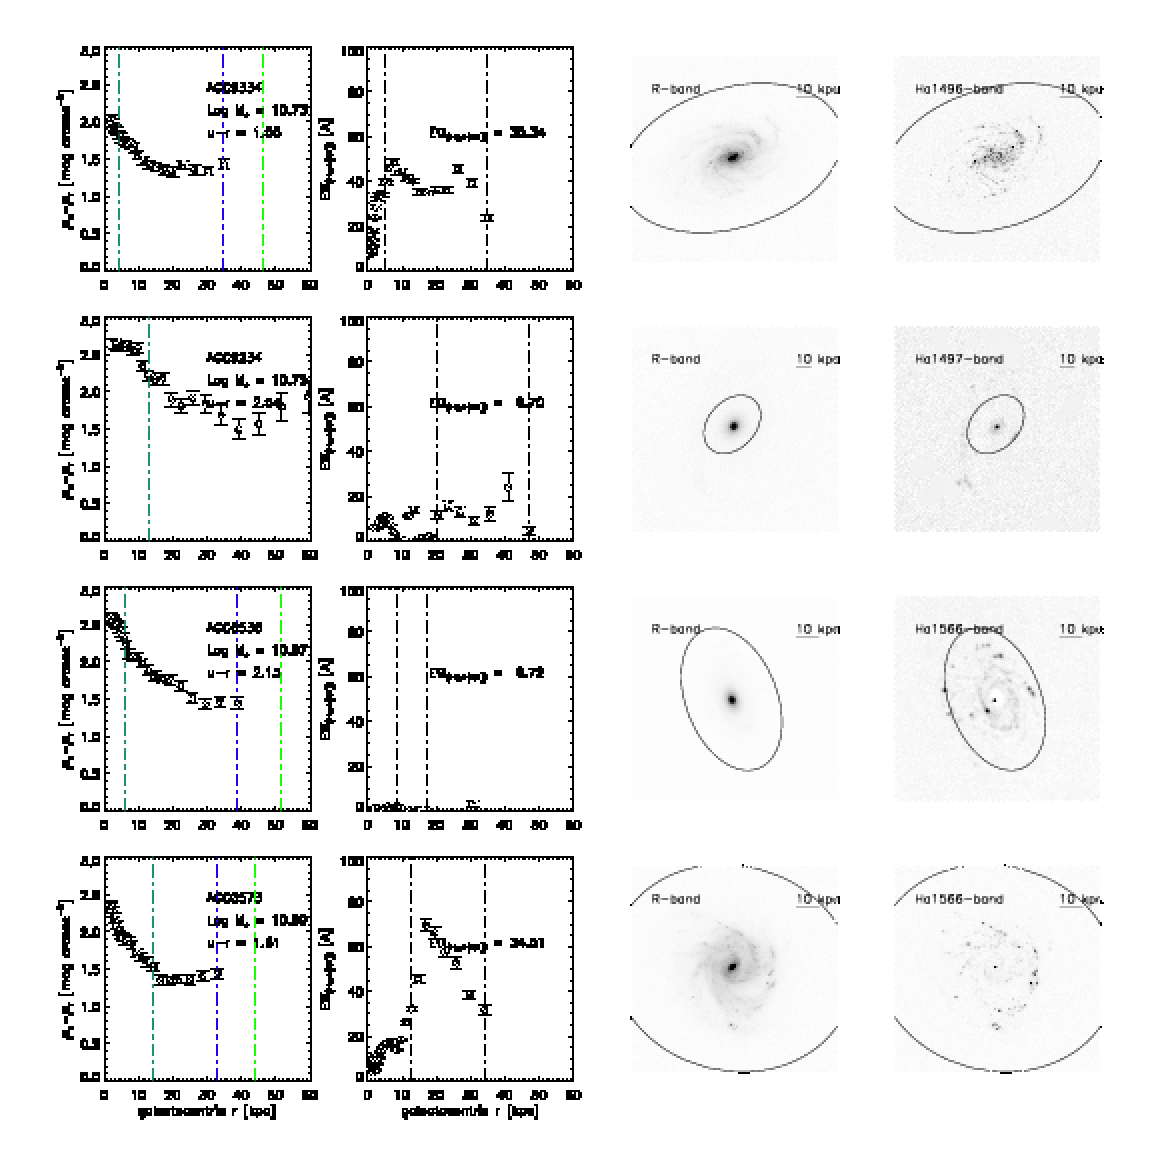
We use the same set of tilted rings to measure the and radial profiles, yielding the EWHα+[NII] radial profiles as presented for all of the 29 KPNO targets in Appendix A. Comparable EW profiles are shown in James et al. (2004), among which the centrally-concentrated SF, characterized by a central peak in the EW curve and a decline with radius, is quite common. Similarly, the EWs of BCDs are most often found to drop steeply with radius, implying that the SF has migrated to the center within the last Gyr (Hunter & Elmegreen, 2004). Only two HIghMass galaxies exhibit prominent central EW peaks: UGC 9023 and UGC 9037, both likely members of the poor cluster Zw1400+0949 (Giovanelli & Haynes, 1985). According to the BPT diagram derived from their SDSS spectra, AGN activity makes little contribution to the line emission in their nuclear regions. The cluster environment may play a role in the inwards gas driven and subsequently the enhanced nuclear SF. Our JVLA maps of UGC 9037 show strong evidence of inward streaming motions and may suggest the inflow of recently accreted gas (Hallenbeck et al., 2014).
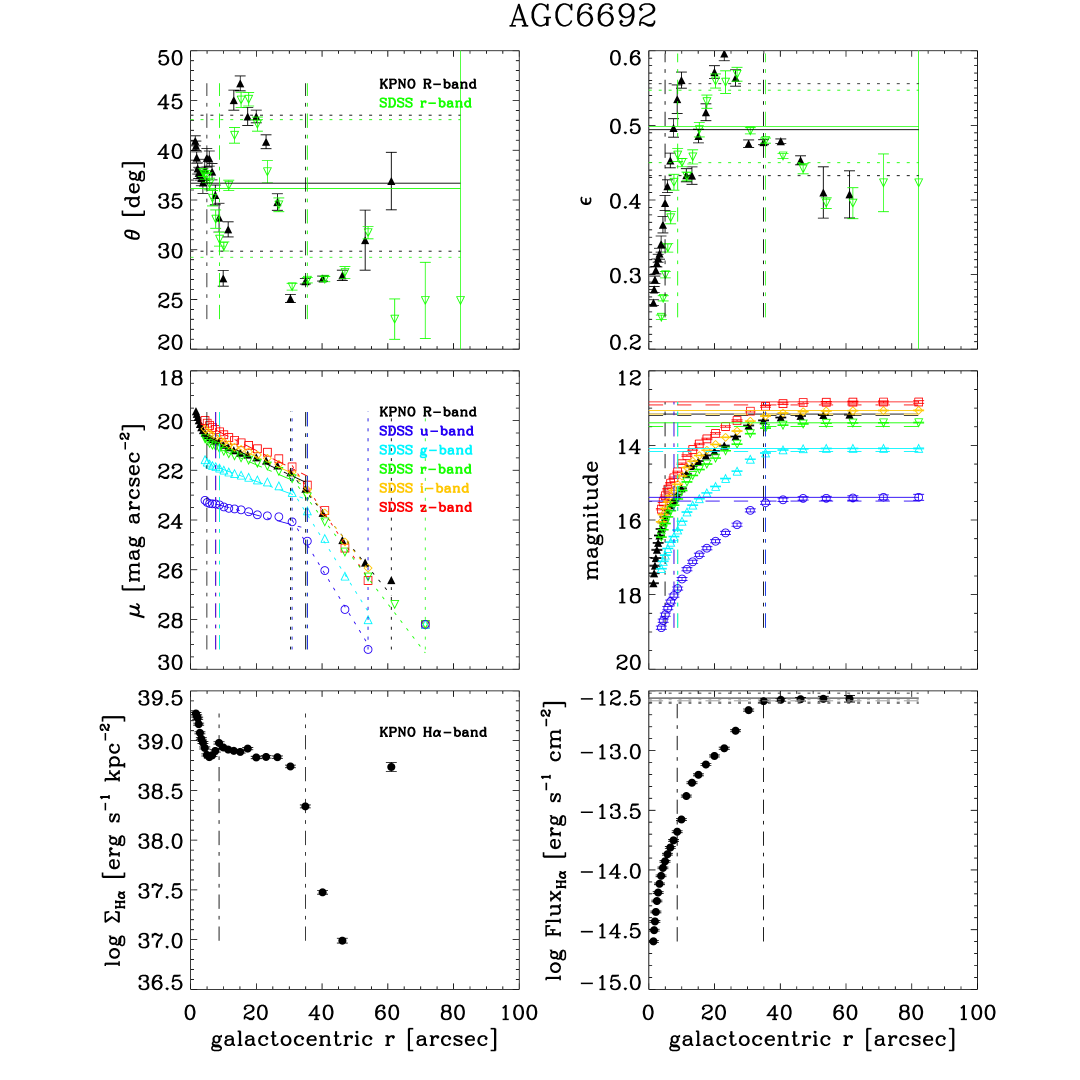
On the other hand, most HIghMass galaxies have higher EWs in the outer regions of their disks, implying younger outer disks relative to the older central bulges dominated by the optical continuum emission. Such strong variation of the EWs prompts a caveat of a widely-used method to correct for the aperture effect when using nuclear emission line strengths to infer global SFRs, i.e., scaling the SDSS nuclear SFRs by the ratio of the nuclear and the overall broadband luminosities (e.g., Hopkins et al., 2003). In particular, the EW profiles rise almost monotonically in AGC 203522, AGC 726428, AGC 721391, and UGC 6692; the stellar population becomes increasingly dominated by young stars with radius. A similar behavior of the EW is found in UGC 8802 (Moran et al., 2010), consistent with a scenario of inside-out disk growth as such the SF activity migrates outwards.
James et al. (2004) suggest a relationship between moderately enhanced SFRs and the presence of bars; the five galaxies with the highest SFRs in their sample are all barred. A characteristic structure of the radial EW profile is always found in barred galaxies: a strong central peak, followed by a broad dip at intermediate radius (a SF “desert” in the region swept out by the bar), and a gentle outermost rise to the plateau level at 15-30 (substantial SF in HII regions scattered around the disk). However, Masters et al. (2012) have shown that the bar fraction is significantly lower among gas-rich disk galaxies than gas-poor ones. According to the morphology classifications of Galaxy Zoo 2 (Willett et al., 2013), only two HIghMass galaxies have strong bars (UGC 8089 and UGC 8408), and additional 10 are very likely to have weak bars. In fact, UGC 8089 and UGC 8408 both have relatively low SFRs and only weak central peaks are seen in their EW profiles. It appears then that bars have not left clear imprints in the SF activity of the HIghMass galaxies.
5.1.4 HII Region Luminosity Function
Other useful measures of the state of massive star formation in galaxies consider the properties of the luminosity distribution of their HII regions: the brightest HII region or the HII region LF. The brightest HII regions have and are brighter on average in galaxies with later Hubble types, indicating a physical change in the HII region populations (Kennicutt, 1988). Notably, Kennicutt et al. (1989) analyzed 30 galaxies with Hubble type ranging from Sb to Irr and found that the differential HII LFs can be parameterized as for luminosities . Both the normalization and shape of the LF change systematically with Hubble type (Caldwell et al., 1991; Helmboldt et al., 2005).
Kennicutt et al. (1989) also found that a subsample ( of the total) of the galaxies is better described by a double power-law LF with a break in the slope at . Oey & Clarke (1998) suggest that the break at an H luminosity of occurs around the luminosity contributed by a single star at the upper mass limit of the Salpeter IMF (100 , ), and they refer to the regions ionized by rich clusters with good stellar statistics as “saturated” (). The LF is predicted to fall off more steeply beyond . Therefore, to characterize the shapes of the LFs tracing the distribution of masses for rich clusters full sampling IMF, Helmboldt et al. (2005) fit a power law only to . However, the hypothesis that the break in slope has a physical nature rather than being an observational artifact has been under suspicion for a long time (Liu et al., 2013). Blending due to limited spatial resolution can induce catalog incompleteness in crowded environments. As a result, the observed LF at the faint end is artificially flattened and the turnover point of the LF is shifted to higher (Thilker et al., 2000; Helmboldt et al., 2005). Specifically, experiments of degrading the resolution to 200–400 pc causes a significant turnover of the LF at the faint end but the shape of the upper LF is still preserved. Beyond a resolution of 300–500 pc, however, the blending affects the entire LF and causes a spurious increase in the luminosities of the first-ranked HII regions (Kennicutt et al., 1989).
Previous studies of the HII LF are mostly restricted to galaxies within 40 Mpc, and care here must be taken to account for blending in crowded regions. Therefore, we will fit a power law only to the upper LF, which is less vulnerable to blending, in hope to characterize the regions ionized by rich clusters in a “saturated” regime, following Helmboldt et al. (2005). Most of the HIghMass galaxies lie sufficiently distant that limits in resolution prohibit the determination of a robust HII region LF. We examined the HII regions of the six HIghMass galaxies with the best linear resolutions. At distances of 88.5 Mpc to 110.3 Mpc, the final resolutions (corresponding to the PSF FWHM of the frame with the worst seeing; see Appendix A) amount to 534–630 pc at their distances. Although some star forming complexes are measured to have sizes of 820–1080 pc (Caldwell et al., 1991), the common star forming complexes in nearby galaxies (with diameters of 100–200 pc) will be unresolved by our dataset, and the trend at the faint end of the LF will not be accessible. Furthermore, the luminosities of the first-ranked HII regions will have to be interpreted with care.
In order to extract the HII regions from these six galaxies, we make use of the IDL program “HIIphot” (Thilker et al., 2000). Three combined images per galaxy are supplied to the program so that the noise level is estimated: a net H image after continuum subtraction, an R-band image as ‘OFF’ frame, and an H image before continuum subtraction as ‘ON’ frame. HIIphot has a robust and automatic algorithm to identify HII region seeds and then grow the HII regions from these seeds until it meets another HII region or reaches a given emission measure (EM) gradient. This approach provides the most substantial benefit during analysis of highly resolved systems, but is sufficiently general to work well also for distant galaxies (Thilker et al., 2000). The diffuse ionized gas contribution is determined and subtracted as a background contribution by the program, and both luminosities and S/Ns of the identified regions are measured. The emission line surface brightness is given in units of rayleighs, defined as 1, and EM = 2.78 for an assumed electron temperature K (Meurer et al., 2006). We incorporated the corrections into our calibration for Galactic extinction, continuum oversubtraction, and [NII] contamination (calculated in Section 4) but not for internal dust extinction, to be consistent with other similar HII LF studies.
HII LFs of the six HIghMass galaxies are presented in Fig. 6. We adopt the convention to bin the number counts in luminosity logarithmically instead of linearly, i.e., , or equivalently . Only the HII regions detected with S/N 5 are plotted, following the detection limit as recommended by Thilker et al. (2000). The vertical dotted line in each panel shows the corresponding luminosity to the 5 detection limit derived from a fit to the well-defined luminosity vs. S/N correlation. The 5 detection limits range from 37.92 to 38.20, lying well below the slope break luminosity of , reaffirming that we have the sensitivity to trace the shape of the upper LF. The dashed line in each panel is the best-fit power law, with the value listed in the upper right corner.
The linear resolutions of the six H images used here are already in a regime for which Kennicutt et al. (1989) conclude that blending affects the entire LF and spuriously increases the luminosities of the first-ranked HII regions. No attempt is made to address the existence of the slope break or the behavior at the faint end. In fact, the LFs drop significantly at the faint end as expected for the case of moderate resolution (Kennicutt et al., 1989; Thilker et al., 2000), also being consistent with the adopted 5 detection limit. The fit to a power law is performed only to points above the apparent turnover point (which itself is likely to be an observational artifact) toward the bright end. Perhaps surprisingly, our values are still in excellent agreement with the result of Kennicutt et al. (1989): in that work (converted to logarithmic binning) relative to an average of 0.96 and a median of 1 in this work. Errors in the values are given in the upper right corners of all panels in Fig. 6, ranging from 0.08 to 0.33. We confirm the statement in Thilker et al. (2000) and Kennicutt et al. (1989) that the slope of the LF above the low-luminosity turnover was rather insensitive to the “upward contamination” potentially brought about by the blending. The somewhat unexpected agreement of LF slope indicates that the HII regions in these galaxies are not particularly crowded but rather, are sparsely distributed throughout the disks so that blending is alleviated at least partly. It is also consistent with our previous suggestion that the HIghMass galaxies exhibit lower overall .
For the majority, a power law fit can easily characterize the bright end of the HII LF. The only exception, UGC 9037, is unusual among the HIghMass galaxies in that it has centrally concentrated SF and, as demonstrated by Hallenbeck et al. (2014), shows evidence from the HI synthesis mapping of inwards streaming motion of gas in its central regions. The blending of HII regions in its nucleus is likely the cause of its peculiar LF shape with multiple gaps (see Fig. 6), so that the fitting for value fails. Alternatively, its distinctive HII LF may be due to intrinsically different physical properties of the HII regions situated in its galactic nucleus, in the circumnuclear region and its more extended disk (Kennicutt et al., 1989).
In contrast to the more robust values of determined by detailed studies which include hundreds of HII regions per galaxy, we hesitate to draw here any strong conclusion about the luminosity of the first-ranked HII regions. We note only that the six HIghMass galaxies studied here show values of the first-ranked HII regions from 39.2 to 40.1, within the range derived in Kennicutt et al. (1989). In contrast to the LFs for Sa galaxies which are very steep with few or no regions having (Caldwell et al., 1991), most of our LFs extend well beyond that. The one with the faintest first-ranked HII region, UGC 9023, also has the lowest normalization as well as the steepest bright end slope of LF. It happens to be the only galaxy among these six which is included in our list of LSB galaxies (see below), suggesting a possible correlation between the surface brightness of the host galaxy and the luminosity of the first-ranked HII region (Helmboldt et al., 2005). Most importantly, the bright end shape of the HII LF, as characterized by , demonstrates no evidence of any abnormal luminosity distribution of the star forming regions in this “saturated” regime, as might have been invoked to explain their higher than average gas fraction.
5.2 Broadband Properties
5.2.1 LSB Galaxies in the HIghMass sample
The correlation between gas richness, LSB disks, and high halos are predicted by both semi-analytical models and hydrodynamic simulations of galaxy formation (e.g., Mo et al., 1998; Boissier & Prantzos, 2000; Fu et al., 2010; Kim & Lee, 2013; Kravtsov, 2013). A first question that arises is whether the HIghMass galaxies are just newly-identified members of the class of giant LSB galaxies typified by Malin 1. Indeed, with log and (Lelli et al., 2010), Malin 1 meets the selection critera of the HIghMass sample, but its distance places it outside the volume sampled by ALFALFA, i.e., its HI emission is redshifted below the frequency range covered by the ALFALFA bandpass. Among the HIghMass galaxies, three - UGC 6536, AGC 190796 (Malin-like), and UGC 6967 - have been part of previous studies of LSB galaxies (Bothun et al., 1985; Schombert et al., 1992; Sprayberry et al., 1995). The overall lower of the HIghMass galaxies is already indicative of the low surface brightness in optical. Here we use the broadband images to estimate two different widely-used measures of surface brightness to evaluate which of the HIghMass galaxies may belong to the LSB class.
The first test uses the effective surface brightness, , defined as the face-on surface brightness at the half light radius, . We correct the R-band for Galactic extinction and convert it to the AB magnitude system, to be consistent with the SINGG calculation. First, the cumulative histogram of demonstrates that the HIghMass galaxies have, on average, lower surface brightness than the SINGG galaxies as shown in Fig. 15 of Meurer et al. (2006). We also use the SDSS photometry to calculate , shown as the distribution of points along the -axis in Fig. 7. Using a low redshift sample of galaxies selected from the SDSS spectroscopic sample which is itself biased against LSB galaxies at low luminosity, Blanton et al. (2005) identify LSB galaxies as those with fainter than 23.5 mag arcsec-2 (the vertical dashed line in Fig. 7). By that criterion, 11/34 HIghMass galaxies would be classified as LSB galaxies (see Table 3): AGC 188749 (marginally), AGC 190796, AGC 190277, AGC 203522, UGC 6043, AGC 213964, UGC 7220 (marginally), UGC 7686, UGC 8089, UGC 9023, and UGC 12506 whereas UGC 6536 and UGC 6967, identified as LSB earlier, would not be. The classification of LSB by this single measure seems insufficient.
Since the values can be easily affected by the bulge component, a fairer estimate uses a property of the disk itself, specifically the disk surface brightness interpolated to the center, . Using as the measure of surface brightness, LSB galaxies are those which have central disk surface brightnesses substantially below the canonical Freeman value for normal disks. As for , an inclination correction is applied to give a face-on value of . It should be noted that the two quantities and measured in the same band assuming a perfect exponential light profile should be related by . For comparison with the study of LSB galaxies in Schombert et al. (2011), we use the combined SDSS magnitudes to characterize , , plotted on the -axis in Fig. 7. Compared to the central surface brightness of the LSB galaxies in Schombert et al. (2011), the values of the HIghMass galaxies are brighter in general. The majority of HIghMass galaxies (28/34) have fainter than the Freeman value (21.65 mag arcsec-2; Freeman, 1970). Adopting a standard cutoff of 23 mag arcsec-2, four HIghMass galaxies fall in the category of extreme LSB galaxies: UGC 190277, UGC 6066, UGC 9234, and UGC 12506, all of which fall below the horizontal dashed line in Fig. 7. Of these, UGC 6066 and UGC 9234 do not appear among the LSB systems identified by the criteron above. Due to the presence of both prominent bulges and extended outer disks in these galaxies, their is significantly brighter than the in the same band.
Perhaps not surprisingly given the general association of ALFALFA and star-forming populations (Huang et al., 2012b), the HIghMass galaxies have on average lower surface brightness relative to the galaxies included in optically-selected samples, but they do not in general meet the surface brightness criteria of extreme LSB galaxies. As a class, the HIghMass galaxies are not “crouching giants”.
5.2.2 Broken Exponential Disks
The structural properties of the outer disks must be intimately linked to the mechanisms involved in the growing and shaping of the host galaxies. For example, in a study of nearby late-type spirals selected from the SDSS, Pohlen & Trujillo (2006) found that of their surface brightness profiles are better described as broken exponential rather than single exponential disks. About 60% of these galaxies show a break in the exponential profile between 1.5 – 4.5 followed by a downbending (steeper slope) in the outermost regions. Another show a clear break between 4 – 6, followed by an upbending (shallower slope) outer region. Quite intriguingly, the shape of the profiles correlates with Hubble type. Downbending breaks are more frequent in later Hubble types, while the fraction of upbending breaks rises towards earlier types.
In fact, among the relatively HI poor BCDs, most of the broken exponential disks show upbending (Huang et al., 2012a). In contrast, the HIghMass galaxies are selected to be the most HI-rich sources among the massive galaxies, most of which have late Hubble types. As discussed in the appendices, if a significant change in slope exists in the light profile, we mark the inner and outer disk regions and fit two exponential functions to each portion individually. Among the 29 HIghMass galaxies in Table 2, seven show broken exponential disks in the R-band. As expected, the majority of them have steeper outer disks: AGC 203522, AGC 721391, UGC 6692, UGC 7220, UGC 7899, and UGC 9023, with the only upbending optical disk occurring in UGC 6043. In agreement with the results in Pohlen & Trujillo (2006), the downward breaks occure at 2 – 3 (2.5 on average) in the six downbending disks, in contrast to UGC 6043 at 5. In addition, double disks are evident in the SDSS images of two HIghMass galaxies UGC 8797 and UGC 7686 (not included as KPNO targets), both being downbending. We find an interesting coincidence of three overlapping sources in this list of downbending disks and the list of four disks with radially rising H EW profiles identified earlier: AGC 203522, AGC 721391, and UGC 6692. Hunter et al. (2010) suggest that the upbending profiles may be explained as a result of shrinking of the size of the actively star-forming disks in BCDs, perhaps due to gas removal in the outer disks. The shallower outer profiles trace the underlying old stellar population, while the steeper inner profiles are dominated by the centrally concentrated and intense regions of recent SF. Our results altogether suggest a correlation between the gas-richness, a downbending outer profile, and active outer disk growth.
Although we have confirmed that the downbending breaks are more frequent in late-type disks with high in which the SF is migrating outwards, the origin of this downbending remains a puzzle, and even seems to be contrary to the presence of an actively forming outer disk. Two downbending features were differentiated in Martín-Navarro et al. (2012): an innermost ‘transition’ radius at and a second characteristic radius, or ‘truncation’ radius, close to the outermost optical extent . Those authors propose that such a ‘transition’ might be related to a threshold in the SF, while ‘truncations’ more likely reflect a real drop in the stellar mass density of the disk associated with the maximum angular momentum of the stars (Martín-Navarro et al., 2012). Similarly, Roškar et al. (2008) claimed that the transition corresponds to a rapid dropoff in the SFR associated with a drop in the cool gas surface density. An inspection of the six downbending HIghMass galaxies shows that the changes in slope all happen within , with an average of , implying a threshold in SF rather than a truncation of the stellar disk. In fact, most of the HIghMass galaxies have H emission traceable to and beyond (Fig. 5), except for UGC 721391, UGC 6692, UGC 7899, and UGC 9023. This matches very well with the list of downbending disks. Therefore, we conclude that the inner transition is related to a threshold in the SF as proposed by Martín-Navarro et al. (2012). It will be interesting to see if these H truncations are also visible in the FUV, because stochasticity may lead H to show signs of knees and turnoffs while the FUV remains smooth (Boissier et al., 2007).
Overall, there are a handful of downbending double exponential disks in the HIghMass sample. Although their disks are growing inside-out at the current epoch, SF thresholds also exist. The SF threshold is nearly always explained as the result of a gas surface density dropoff or of global dynamic stability (Leroy et al., 2008). On that basis, we would predict, for example, that UGC 7220 has a relatively compact distribution of its HI gas; we will test this with our HI synthesis mapping data.
5.2.3 Disk Color Gradients
If galaxies indeed grow from the inside out, stars should be younger on average in the outer parts, leading to radial color gradients. Such trends have been previously reported, for example for the SINGS galaxies (Muñoz-Mateos et al., 2011), as well as in the HI-rich massive GASS galaxy, UGC 8802 (Moran et al., 2010).
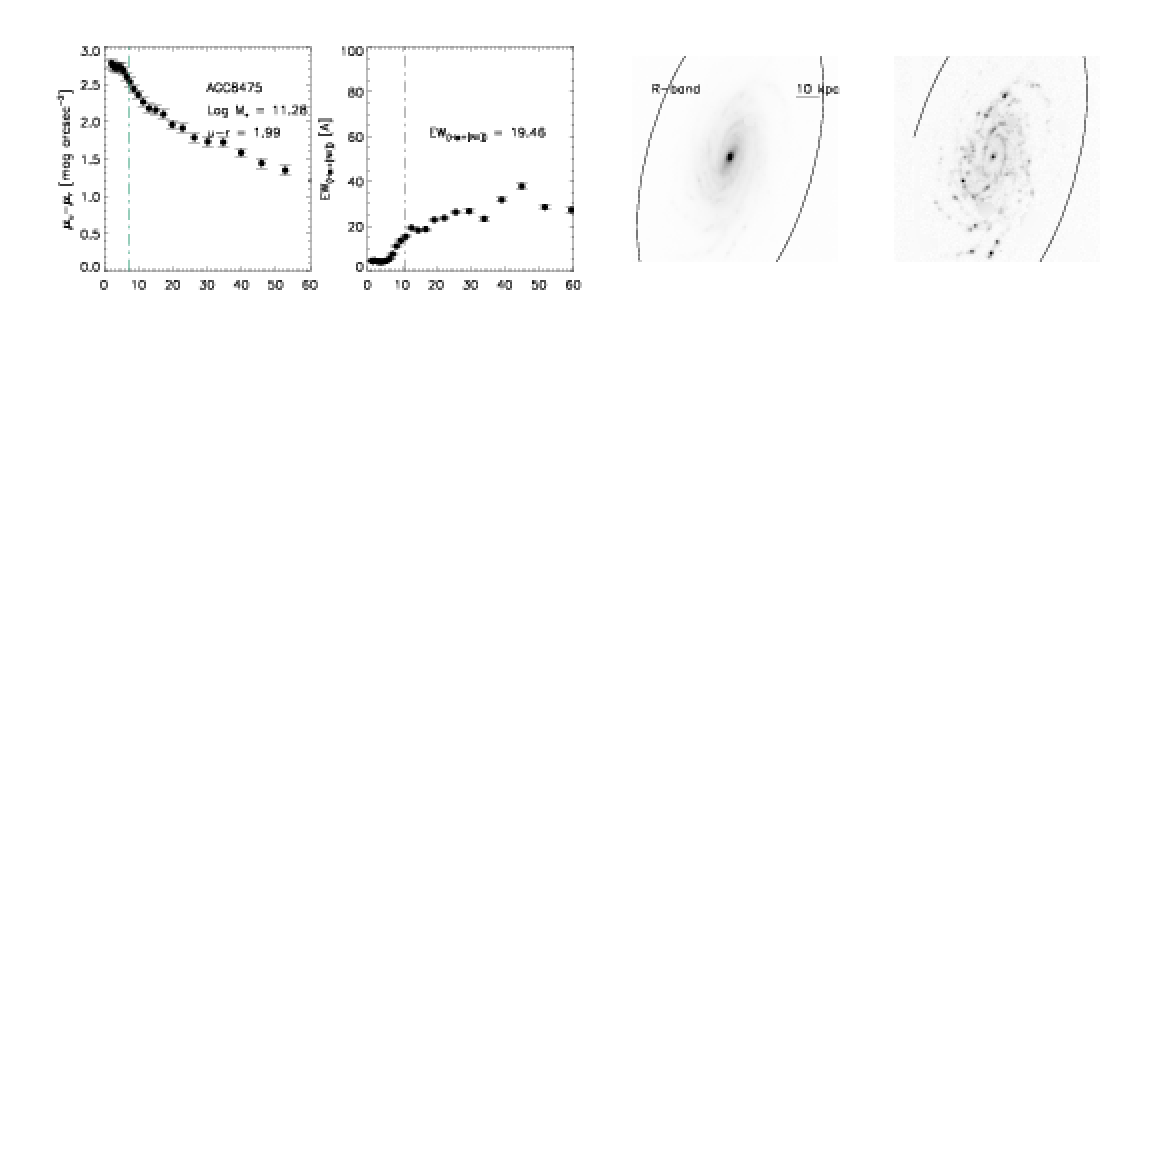
The surface brightness profiles of the 29 KPNO targets are presented in Appendix A. Indeed, most of them exhibit strong color gradients. While many still have relatively red centers, typical for their luminosities, the colors become continuously bluer throughout the disks (e.g., UGC 8475), in a way that does not simply reflect the color differences between the bulge and disk components. Relative to the color maps of the LSB galaxies presented in Schombert et al. (2011), the HIghMass galaxies demonstrate systematic trends becoming clearly bluer in their outer disks.
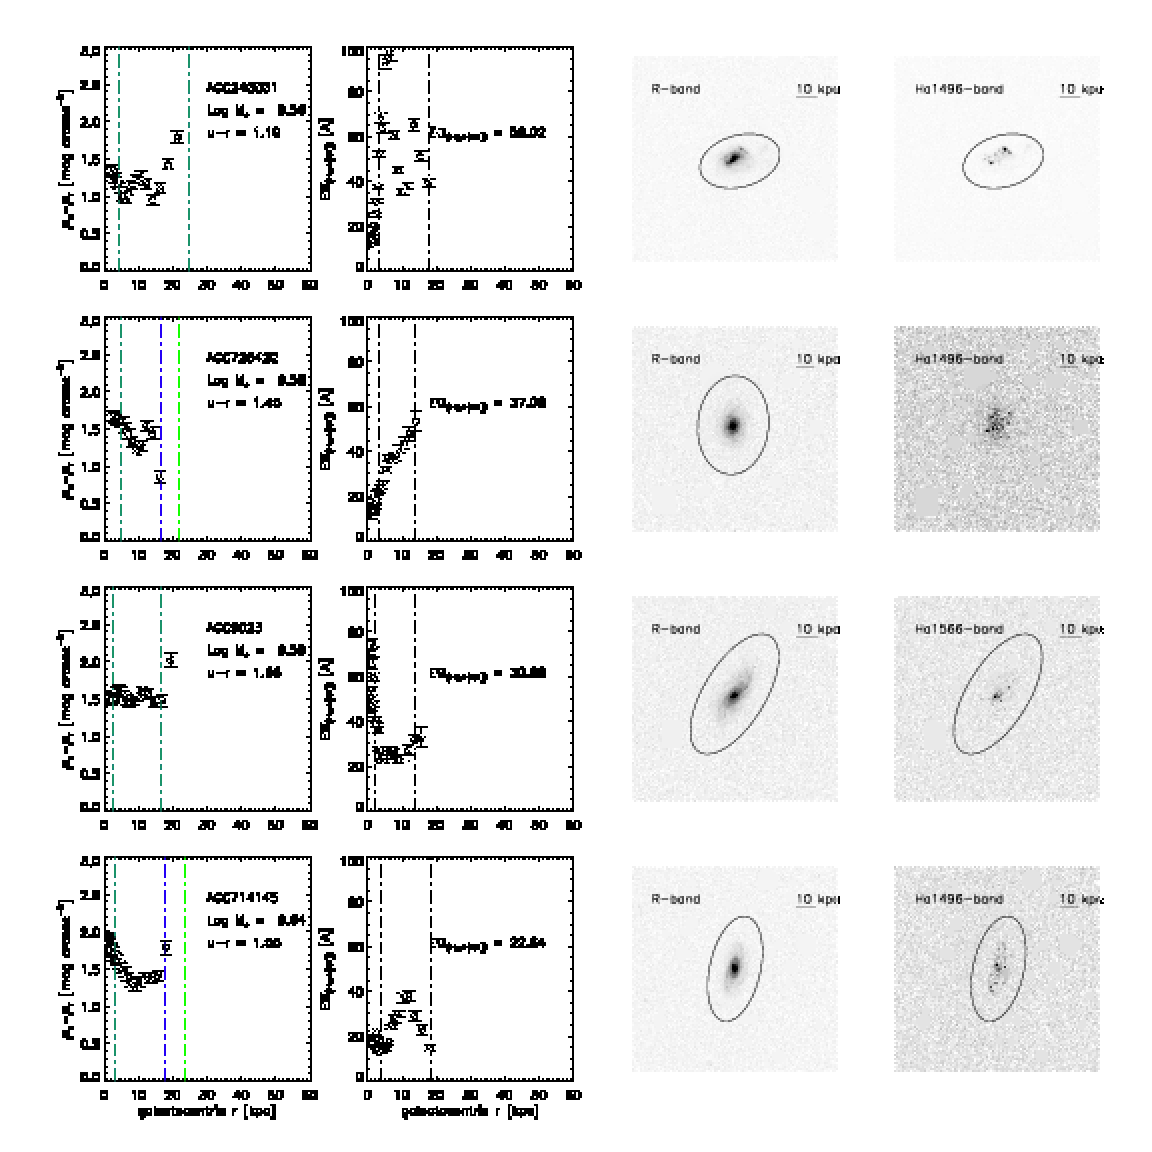
Measuring age gradients in disks from color profiles is not straightforward, since the radial decrease in the internal extinction and metallicity also conspire to yield bluer colors at larger radius (Muñoz-Mateos et al., 2011). In the case of our observations, because the H lines lie within the wavelength range of the R filter, differential reddening should have less impact on the H EW gradients than on the optical color gradients. We present the H EW profiles in Appendix A. A comparison between the EW and color profiles of the HIghMass galaxies shows evidence of an anti-correlation between the EWs and the colors. Globally, bluer galaxies have overall higher EWs (e.g., AGC 203522) and vice versa. Within a galaxy, the reddening trend of color as a function of radius is always associated with the declining EW (e.g., AGC 188749) and vice versa (e.g., AGC 726428). The overall trend in most of the HIghMass galaxies of lower central H EWs supports the inference of older central regions relative to the disks, in agreement with the scenario of inside-out disk formation.
Nevertheless, reverse reddening trends in the outermost regions are observed in a number of galaxies, leading to the ‘U’-shape color profiles in, e.g., AGC 714145, UGC 6168, UGC 5711, UGC 5543, etc. Their EW profiles appear to have ‘’ shapes correspondingly. Simulations show that such features may result from a combination of a drop in the SFR (seeded by warps in the gaseous disk, the radial distribution of angular momentum, misalignment between the rotation of the inflowing gas and the disk, etc.) and radial stellar migration, which would populate the outskirts of disk with old stars formed further in Muñoz-Mateos et al. (2011).
6 HIghMass Galaxies in the Context of the ALFALFA Parent Sample
As a population, HI-selected galaxies are among the least-clustered population known (Martin et al., 2012), and, as illustrated in Fig. 3, in the great majority, they are star-forming, blue-cloud galaxies. Overall, ALFALFA-detected galaxies are less evolved and have overall higher SFR and SSFR at a given but lower star formation efficiency (SFE) and extinction, relative to an optically-selected sample (Huang et al., 2012b). The HIghMass galaxies are identified within the highest HI mass subset of the ALFALFA population because of their exceptional gas richness for their stellar mass. In this section, we examine whether and in what ways besides their high gas fraction the HIghMass galaxies differ from the overall HI-selected population detected by the ALFALFA survey.
6.1 HIghMass Galaxies on the SF Sequence
On an SFR vs. diagram, star forming galaxies form a narrow band, the so-called “main sequence” of SF; an even tighter correlation has been identified on a similar SSFR vs. plot (e.g. Salim et al., 2007). appears to be the crucial quantity governing the SF along this sequence. In the absence of mergers or other events that trigger a starburst, it has been suggested that blue galaxies on the SF sequence evolve towards higher and and lower SSFRs. In this scenario, the tightness of the SF sequence, with an rms scatter of less than 0.3 dex, indicates that the SF of “main sequence” galaxies is not driven mainly by merger-induced starbursts but rather by a continuous mass-dependent process that is gradually declining with time, e.g., smooth gas accretion (Bouché et al., 2010). Huang et al. (2012b) have previously presented the results for the ALFALFA parent population, confirming the expectations that SFRs generally increase but SSFRs decrease with increasing stellar mass.
Whereas the SF sequence reflects directly the relationship between the accretion rate and the halo mass (Bouché et al., 2010), the DM halo should play a more fundamental role than the stellar mass in the regulation of disk growth. For this reason, we examine the SF behavior of the ALFALFA sample overall, and the HIghMass galaxies in particular, as a function of the disk rotational velocity, , taken to be the deprojected HI line width using the axial ratio of the optical disk to correct for inclination. Within some scaling factor that accounts for the (unknown) extent of the HI disk, we expect to provide a measure of the dynamical mass of the DM halo, more reliable for example than alone, in order to characterize the overall gravitational effect leading to material infall and thus SF. This expectation is particularly justified here since in 20/34 of the HIghMass galaxies. We could also derive the dynamical masses () from the values of and the optical disk size, but because the axial ratios are less vulnerable to shredding by the SDSS DR8 pipeline relative to the disk size measurements (see Appendix B), we choose to present the results simply using rather than . We note however that the qualitative results to be drawn from this analysis will not be altered if any of , , or is used instead of .
Fig. 8 shows the parameter space occupied by the HIghMass galaxies (colored symbols) as compared to that by the general ALFALFA population (black contours and gray dots). The -axis is in all panels with -axes showing SFR, SSFR, and SFE, respectively from top to bottom. In order to make the plots here, we adopt SFR(H)s for the HIghMass sample if available, but use SFR(SED)s otherwise. Note that our parent sample here is defined by galaxies included in that .40 catalog and with SDSS photometry from the SDSS/DR8.
In the SFR vs. diagram (top panel), the HIghMass galaxies in general lie slightly above the running average as defined by the ALFALFA galaxies. The only extreme outlier beneath the SF sequence is the only early type galaxy in our sample, UGC 4599, having an SFR of 0.01 yr-1 in the center region (the outer ring is excluded from the Petrosian aperture because of the existence of the central bulge, see Appendix). This happens to be the only KPNO target without standard star frames bracketed, so that the estimate of the SFR comes from SED fitting. However, there are SF regions situating along the outer ring of this galaxy as evident in the continuum-subtracted H image (uncalibrated). Recent work by Finkelman & Brosch (2011) derived the SFR within the entire ring to be 0.04 from GALEX UV flux. Those authors concluded that both a merger between two HI-rich galaxies and the cold accretion of gas from the IGM can account for the observed properties of this galaxy, as well as the huge amount of HI detected. It is very possible that the SFR(SED) value obtained in the current work is an underestimate in this relatively red galaxy (see discussion in Section 4). Except for UGC 4599, the current SFRs range from 0.34 (UGC 8089, a LSB galaxy with low ) to 21 (UGC 8475, a well-developed spiral), and have a median of 2.5 yr-1, in rough agreement with the range derived from Sc galaxies but higher than that of the Sa galaxies in Caldwell et al. (1991). Again, we emphasize that the majority of the HIghMass galaxies are not crouching giants. Instead of being quiescent objects like Malin 1, most have blue outer disks and exhibit healthy onging SF, as gauged by their via this standard scaling relation. Although they have slightly lower surface brightnesses, they are different from the extreme LSB galaxies which typically have lower SSFRs by a factor of ten than other galaxies of the same baryonic mass (Schombert et al., 2011).
In the middle panel, the upward deviation of the HIghMass galaxies from the general trend is even more evident. The HIghMass galaxies have only moderate to high current SFRs but significantly higher SSFRs at fixed . Given the fact that represents the integrated past SF, this offset can either due to a higher ratio of current to past-averaged SFR and/or the HIghMass galaxies have formed the bulk of their stars more recently relative to the typical ALFALFA galaxy, and thus have a shorter integrated SFH.
In order to test these scenarios, we characterize the shape of the SFH and estimate the formation time, again by SED fitting. The relevant parameters are defined as follows: is the time since the galaxy first started forming stars; is the mass-weighted age; is the timescale of the SFH so that the continuous component of SFH is given as ; and -, the birthrate-parameter, is the present SFR (averaged over the last 100 Myr) divided by the past average SFR, accounting for the bursts in SFH. Due to model degeneracies, these four parameters are poorly constrained by the SED fitting of five optical bands, with typical uncertainties being 60%. Despite this caveat, it is indicative that the HIghMass galaxies in general started to form stars more recently, with a median of 4.16 Gyr, in comparison with a value of 4.51 Gyr for the ALFALFA galaxies. This also suggests that the HIghMass galaxies have overall younger stellar population (median 2.28 vs. 2.54 Gyr). The median timescales of SF are comparable between the two populations, with a median of 0.41 for both, seemingly in contradiction with the prediction that the galaxies in high halos have longer timescales of SF, or equivalently, that their SFHs decline more slowly. However, taking into account the possibility of bursts, the median -parameter is higher among the HIghMass galaxies, being 0.38 (vs. 0.31 for the full ALFALFA sample). It is interesting to note that the two HIghMass galaxies with the highest -parameters (AGC 203522 and AGC 248881) also have the highest EWHα+[NII] values among our KPNO targets, i.e., they are undergoing a burst of star formation at the present time.
The HIghMass galaxies in fact follow the standard calibration of the fundamental plane (e.g., the –SSFR– correlation in Huang et al., 2012b), despite the higher than average at fixed , , , or . This consistency suggests that the more gas-rich galaxies with higher s tend to have higher SSFRs and lower surface densities by a corresponding amount, so that they follow the same fundamental plane as defined by their gas-poorer counterparts. Hence, it would be impractical to identify the gas-rich galaxies in high halos by selecting outliers from the fundamental plane, because of the seemingly self-regulated process between gas supply and SF.
The upper panel of Fig. 9 confirms the finding that the HIghMass galaxies have overall lower stellar mass surface densities at fixed , relative to the parent .40–SDSS (DR8) sample. The concentration index in the r-band, , is plotted as a function of in the lower panel of Fig. 9. Higher values of correspond to bulge-dominated systems ( for a de Vaucouleurs model; 2.29 for an exponential disk). Except for UGC 4599, all of the HIghMass galaxies can be categorized as disk systems. However, in comparison with the parent sample, the overall lower concentration indexes of the HIghMass galaxies at fixed is insignificant but rather results from the very large scatter in the concentration index vs. relation.
In summary, the moderate to high current SFRs of the HIghMass galaxies, together with their overall higher EWs, SSFRs, and -parameters support the idea that SF in them has been suppressed in the past, but that they are undergoing an active period of disk growth at the current epoch. This evolutionary state is predicted to be the typical behavior of galaxies residing in high DM halos by semi-analytical models (e.g., Boissier & Prantzos, 2000). And/Or, the HIghMass galaxies appear to have been forming the bulk of their stars at later times, possibly as triggered by gas infall events. Future work will explore evidence for gas infall in the HI synthesis maps and better determine the SFH via NIR photometry from warm-Spitzer.
6.2 HI-based SFEs in the HIghMass Galaxies
Among the various forms of applicable SFLs, the most commonly studied is the empirical K-S relation which attempts to describe how the SFR surface density is regulated by the gas surface density, e.g., , where the exponent is determined globally to be in Kennicutt (1998). By definition, K-S relation gives the surface density of SF efficiency, , and the reciprocal of the SFE is the SF timescale. Within the optical disk where H2 dominates, it has been established that the correlates better with the than with the total gas density (Leroy et al., 2008; Bigiel et al., 2008), indicating that SF occurs exclusively in the molecular phase of the ISM. In spirals, the of H2 alone is nearly constant with an H2 depletion time of 2 Gyr (Leroy et al., 2008; Bigiel et al., 2011; Schruba et al., 2011), i.e., at a resolution of kpc. Controversial results are found in low-metallicity dwarf galaxies and in the outer parts of large spirals, where the ISM is mostly atomic. The HI-based is much smaller, with a SF timescale of 100 Gyr and, in systems where HI dominates, the K-S relation is likely to have a distinct form, e.g., also begins to correlate with the (Bigiel et al., 2010; Krumholz, 2013).
In the current work, we only inspect the global HI-based SFE () and the corresponding gas depletion timescale . The distribution of is known to be broad, ranging from 0.3 Gyr (on the scale of starbursts) to 100 Gyr (many times the Hubble time, Gyr). Huang et al. (2012b) have already shown that as an HI-selected sample, the ALFALFA galaxies have overall lower SFEs, or equivalently longer Gyr, relative to an optically-selected sample. The bottom panel of Fig. 8 shows the distributions of HIghMass galaxies and the ALFALFA parent sample on an SFE vs. diagram. The horizontal dash-dotted line in green corresponds to ; the cyan dashed line on top marks the average SFE derived from the GASS sample ( Gyr, Schiminovich et al., 2010).
Contrary to the expectation that the high results from a low efficiency of SF in the HIghMass galaxies, their HI-based SFEs are moderate relative to the parent ALFALFA sample (see Fig. 8). The median SFE is yr-1 ( Gyr), which is slightly higher than the average of the ALFALFA population overall, but still lower than that of the stellar mass-selected GASS galaxies. The distribution is confirmed to be broad. However, except for the early-type UGC 4599 which has a comparable to the obtained in spiral outer disks (100 Gyr), the global HI depletion timescales are not extremely long in comparison with the H2 depletion time (2 Gyr), with 74% of the sample having . The majority of the HIghMass galaxies with are in our list of LSB galaxies, including AGC 188749, AGC 190796, AGC 190277, UGC 8089, and UGC 9234, in support of the correlation between lower surface density and lower SFE.
The HIghMass galaxies have overall lower and stellar surface densities, suggesting lower given the K-S relation. One may naively expect the HIghMass galaxies to have lower SFEs based on our understanding of the K-S relation. However, such a reasoning implicitly relies on several questionable assumptions. In the inner disks with higher levels of , H2 can still be the dominant component of the ISM locally. The lower caused by the lower is possible if the K-S relation is significantly super-linear with . This slope is highly debated due to the different background subtraction or the treatment of diffuse emission unrelated to SF. However, a number of authors obtained value close to 1 (Leroy et al., 2008; Bigiel et al., 2011; Schruba et al., 2011), at least in the inner disk. The exact form of the K-S relation is less clear towards the outskirts, but the total there is not necessarily low for the HIghMass galaxies relative to the more normal spiral population. Despite the lower central surface density, disks formed in higher halos have longer scale lengths so that the gas may be distributed in extended disks. In fact, except for a few cases with truncated radial profiles, the star forming disks are traceable to large radii in most of the HIghMass galaxies. Finally, the inference of global properties such as the SFE according to the results derived from resolved samples which yield the K-S relation is subject to spatial averaging over a range of , timescales and conditions within the ISM.
Although models predict that a lower SFE should lead to a higher gas fraction and vice versa (e.g., Bouché et al., 2010), the HIghMass galaxies with high s do not have particularly low HI-based SFEs relative to the other galaxies. Given that the -to- ratios are lower than average, the H2-based SFEs should be even higher than normal spirals. However, the global SFEs are still low in comparison with the with the former set by the inefficient conversion of atomic to molecular gas in the far outer galaxy (Kennicutt & Evans, 2012). Future work will attempt to compare the properties of both HI and molecular distributions to probe further the K-S relation applicable in the HIghMass galaxies.
6.3 Spin Parameter Distribution
Both semi-analytical models and hydrodynamic simulations predict that the stellar disks in high halos are formed to be less concentrated and more gas-rich (e.g., Mo et al., 1998; Boissier & Prantzos, 2000; Kim & Lee, 2013; Kravtsov, 2013). In support of this, the stellar disks of the HIghMass galaxies are confirmed to be extended with overall lower surface densities at fixed . A quantitative angular momentum statistic, the “spin parameter” , can be expressed on terms of observable quantities as:
| (3) |
where is the rotational velocity as derived above, is the scale length of the optical disk and is the mass of the associated DM halo (Hernandez & Cervantes-Sodi, 2006). We follow the same approach as in Huang et al. (2012b) to derive the empirical distribution of host halos, adopting the derived from the relation given in Papastergis et al. (2011). Underlying assumptions include an exponential surface density profile of the optical disk, a flat disk rotation curve at , an isothermal density profile of the halo (virialized), and that the potential energy of the galaxy is dominated by that of the halo. The last two assumptions are known to be unrealistic or highly uncertain, but are adopted for simplicity. Therefore, the relative distributions are more indicative than the absolute values.
Although Hernandez et al. (2007) find that the distribution of a disk galaxy sample selected from the SDSS is consistent with values derived from simulations, Huang et al. (2012b) have shown that the ALFALFA population overall shows a distribution that is no longer lognormal and has a mean value well in excess of that predicted, implying that the HI-selected galaxies preferentially occupy DM halos of higher than average . In Fig. 10, we examine the statistical measures of derived as above for the full HIghMass galaxies (solid line) superposed on a normalized distribution for the ALFALFA population overall (dashed line). The shaded area traces the subsets included in two of our HI synthesis imaging programs. All of the JVLA11 targets (shaded in red) are stellar massive disks (), while the GMRT11 targets (shaded in cyan) all have .
There is evidence that the HIghMass galaxies do indeed reside in DM halos characterized by higher than average values of , and the average of the less stellar massive GMRT11 targets is similar to that of the JVLA11 ones. However, the significance of a departure from the rest of the ALFALFA population and possible dependence on other paramters such as or color is presently unclear, given the statistical uncertainties and small sample size. The HI synthesis maps will permit us to constrain the halo density profile. In fact, Hallenbeck et al. (2014) present UGC 12506 as a first case of a HIghMass galaxy whose spin parameter, derived from the fitting the HI velocity field, is truly high. Future work will use the halo density profiles derived from the HI maps to constrain the spin parameters of the HIghMass galaxies more directly.
6.4 The Local Environment of HIghMass Galaxies
It is well-known that the HI mass of disk galaxies can be depleted by interactions with environments of galaxies, especially via tidal or ram pressure stripping. Here, we examine whether or not the exceptionally gas-rich massive HI disks included in HIghMass are different from the rest of the HI-selected population. To quantify the environment we used a galaxy’s th nearest neighbors as a metric. Using as the source catalog the SDSS DR7 spectroscopic catalog galaxies (Abazajian et al., 2009), the ten nearest neighbors of all of the high S/N ratio detections in the .40 sample were found. The catalogs were cut in R.A. and Dec., as well as redshift, such that the ALFALFA sample was volume-limited in the range 60-140 Mpc (within which 21 of the HIghMass galaxies fall), and the SDSS sample was volume-limited out to 165 Mpc, or equivalently an absolute r-band petrosian magnitude of 18.6. The search for neighbors then proceeded within an expanding spherical bubble (in the plane of the sky and in redshift distances), out to a limit of 45 Mpc. Finally a minimum separation of 10 arcsec was applied because such close neighbors are unlikely to be indicative of the surrounding environment and would not be distinguishable from the parent galaxy in ALFALFA survey anyway.
Measures of local galaxy density were estimated by averaging the logarithm of the 1st, 2nd, and 3rd nearest neighbor densities (similar to Baldry et al., 2006), and are plotted for the ALFALFA sample, the ALFALFA sample with stellar mass above , and the HIghMass galaxies in Fig. 11. K-S tests comparing the distributions suggest that the high stellar mass sample is distinct from its parent ALFALFA sample (with a P-value of ), with the high stellar mass galaxies typically avoiding regions of very low local density. The K-S tests for the HIghMass galaxies indicate that their environment is more similar to that of the high stellar mass galaxies (P-value of 0.71), than that of the average ALFALFA galaxy (P-value of 0.013). ALFALFA is naturally biased to blue galaxies which tend to be less clustered; Martin et al. (2012) have shown that the gas-rich galaxies detected by ALFALFA is the most weakly clustered population known. Thus, it may be surprising to conclude that the local environment of a HIghMass galaxy is not especially under dense, when compared with that of similarly stellar massive galaxies in ALFALFA. Much the same result is found when they are compared with other high HI mass galaxies within ALFALFA.
7 Summary and Future Work
The main goal of this paper has been to describe the optical properties of the 34 HIghMass program galaxies, a set of exceptionally gas-rich, massive HI disks identified among the 15000 HI detections presented in the .40 catalog (Haynes et al., 2011). In addition to summarizing the characteristics of the HIghMass galaxies as a subset of the overall HI-selected population, we present a dataset of high-quality H imaging for 29 HIghMass galaxies. The higher-than-average (for their stellar mass) gas fractions may result from suppressed SF in the past or may be attributed to late cold gas accretion. Understanding the past history and current evolutionary state of such extremely HI-rich galaxies as a population in the local Universe will provide insight into the nature of the massive and gas rich systems which are likely to dominate the planned deep field surveys of HI in galaxies at higher redshift with the SKA and its pathfinders (e.g. Meyer, 2009; Duffy et al., 2012).
This work is the first systematic H study of galaxies in this regime. Relative to the existing large H surveys of field galaxies, the HIghMass galaxies lie at further distances and are thus more massive in general. We report the details of our observation and the procedures of image reduction, continuum subtraction, as well as H and R-band surface photometry in the Appendix. KPNO measurements are presented in Table 2. Because of the shortcomings of the standard SDSS photometry pipeline, e.g., shredding and sky background over-subtraction, we follow a similar approach to obtain supplementary measurements from the SDSS images which are presented in Table 3. Multiple internal and external checks ensure the consistency of the KPNO and SDSS results and the quality of absolute flux calibration. Current SFRs of the HIghMass galaxies are therefore derived in two ways: SED fitting to the SDSS bands and converting from the . Albeit the poorer constraint of SFR(SED) for some galaxies, optical SED- and -derived values agree within the uncertainty ranges for most of the sources; there is no evidence that the high values are due to an excess or deficit in the formation of massive stars.
The 34 galaxies that comprise the HIghMass sample span a range of luminosities, , and SFRs and all but three, UGC 6066, UGC 9234, and UGC 4599, clearly reside in the blue cloud region of the color-magnitude diagram. Several, e.g., AGC 190796, AGC 190277, and UGC 12506 meet the criteria of low surface brightness characteristics of other samples, but the majority are not ”crouching giants” like Malin 1. In comparison with the SFRs derived in other H surveys, the HIghMass galaxies have overall higher integrated SFRs. This characteristic rules out the hypothesis that the high HI fractions in the HIghMass galaxies result from a simple inhibition of gas conversion into stars at the present time. Relative to the overall .40–SDSS parent sample, the HIghMass galaxies exhibit healthy ongoing SF and (HI-based) SFEs despite the evidence by their overall high H EWs and -parameters that they may have have been relatively inactive in forming stars in the past. The derived high SSFRs at fixed HI rotational velocities also support a picture of more recent formation times. However, the SFR surface density profiles show that the SF activity is spread throughout their extended disks so that they have lower SFR surface densities overall. Similarly, the HIghMass galaxies have, on average, lower surface brightness in the R-band or the stellar mass surface density. Albeit limited by resolution, the slopes of the HII region LFs in the luminous part agree with the results derived from samples of normal spirals; again, there is no sign of abnormal behavior in the formation of massive stars.
Only two of the HIghMass galaxies have prominent central EW peaks: UGC 9023 and UGC 9037. In fact, Hallenbeck et al. (2014) find evidence from the HI velocity field that the gas in UGC 9037 is inflowing and suggest that it may be on the verge of a starburst phase. All the other HIghMass galaxies have higher EWs in the outer disk regions, implying inside-out disk growth. In particular, the EW profiles rise almost monotonically in AGC 203522, AGC 726428, AGC 721391, and UGC 6692, i.e., the SF activity is migrating outwards. Shallower outer stellar disks (upbending profiles) are seldom seen in gas-rich galaxies but there are a handful of downbending double exponential disks in the HIghMass sample. Although their disks are growing inside-out at the current epoch, SF thresholds exist in the downbending disks, probably as a result of a concentrated gas distribution. The majority of HIghMass galaxies have strong color gradients, being redder in the center, in agreement with the scenario of inside-out disk formation. The color gradients reverse at the very outermost regions in some disks, which may result from a combination of a drop in the SFR and radial stellar migration.
In the future, we will use gas dynamics derived from the HI maps to constrain the properties of DM halos, as well as to search for the imprints of recent accretion left on the HI morphology or velocity fields. In addition to the atomic gas content, the mass of cold molecular gas will be given by IRAM 30-m observations of the 12CO() line emission, and, for a few galaxies, resolved CARMA maps will trace its distribution. In combination with the H images, these additional data will allow us to study in detail the HI-to-H2 conversion, K-S relation, and SF threshold in these massive gas-rich disks. Herschel images will be used to probe the obscured SF, cold dust emission, and to identify the sources or regions with extremely low dust-to-gas ratios which may be responsible for the low efficiency of H2 formation. The SFHs and old stellar populations will be further constrained by Spitzer observations. Optical spectra will help determine the CO-to-H2 conversion factors and yield metal enrichment histories throughout the disks. A synthesis of these multi-wavelength data will allow us to study all the key processes involved in gas consumption and star formation in these exceptional HIghMass galaxies.
Appendix A H and R-band Data Reduction
A.1 Image Processing and Continuum Subtraction
The preliminary H and R-band image reduction follows standard procedures in IRAF: fixing header keywords, pedestal removing, trimming, bias subtracting, flat fielding, interpolating across the columns of bad pixels, and cosmic ray cleaning. All the frames have noticeable curvature at the edges; however, all the sample galaxies occupy only the inner 10% of the chip or less.
The processed narrowband images contain contributions from both H and underlying stellar continuum, and the accuracy of the continuum scaling and subtraction can be the dominant error source for galaxies with low emission-line equivalent widths (Kennicutt et al., 2008). We adapt the IRAF package kindly provided by Salzer to conduct continuum subtraction, etc. A set of exposures for the same galaxy, including three H frames and two/three R frames, are first shifted to register to an R-band image taken on a photometric night (called R-reference frame). Given the rough central coordinates and pixel scales, astrometry is obtained by shifting and rotating. Then we average the FWHM of over seven stars near the HIghMass galaxies and find out a frame with the worst seeing. All the other frames are convolved with a gaussian kernel to match this worst PSF. The same set of stars are used to determine the scaling factors subsequently.
All H images are normalized to the one taken on a photometric night and combined as the final ‘ON’ frame; similarly combined R image yields the final ‘OFF’ frame. Net H images are obtained by subtracting a scaled ‘OFF’ frame from the ‘ON’ frame. This scaling factor is determined by the ratio of transmissivity of two filters, the sky transparency if under non-photometric conditions, and the difference in exposure time, but we estimate it by the average of ratios between foreground star counts in the two frames, forcing the residual fluxes of stars to reach a minimum in the net H images. Our method implicitly assumes that field stars have no significant H emission on average, which is most likely to be valid, and it allows for sky transparency changes. For some large programs, e.g., Kennicutt et al. (2008), a uniform scaling factor can be derived by averaging the values from all galaxies observed in the same H filter. In our case, 5/8 H filters were used for only one or two galaxies thereby we skip this process.
A.2 Surface Photometry
The reduction steps outlined above produced three combined images per galaxy that will be of further use: a net H, an unscaled R-band, and a scaled R-band. Considering the future studies, e.g., a comparison between the gas and SF surface density, both the integrated fluxes and one-dimensional profiles are of interest. We therefore brief surface photometry process as follows.
A.2.1 Isophotal Fitting
We make use of the GALPHOT package, a collection of IRAF scripts modified to accommodate the KPNO images, which performs sky background subtraction and contamination cleaning (Huang et al., 2012a). Starting from an initial guess, elliptical surface brightness contours were fitted to these cleaned images, outwards to the radius at which the fitting fails to converge and inwards to the seeing limit. We adopt a logarithmic scale in radius increment, with = 1.25 . The center coordinates, ellipticities, and position angles are all allowed to vary. Final fits were visually inspected for robustness. This process is applied to all three combined images in order to refill the masked regions by interpolation. However, for consistency, only the set of ellipses as a result of fit to the unscaled R-band image are retained and used for aperture photometry on H and scaled R-band images, yielding the azimuthally-averaged surface brightness profiles comparable in all bands. The disk portion of the surface brightness profile, with the most linear appearance, is selected; within this semi-major-axis range of the disk, averages of ellipse centroids, position angles () and ellipticities () are measured to characterize the global properties of a galaxy (tabulated in Table 2). This region is then fit to an exponential profile, yielding the disk scale length and surface brightness interpolating to center, .
A.2.2 Global Magnitudes
Although we record several sets of global magnitudes, including ones at fixed isophotal levels, partial magnitudes integrated to a certain number of disk scale length (e.g., mag8 to ), and asymptotic magnitudes extrapolated to infinity from the exponential outer disk fit, we report hereafter the Petrosian magnitudes for the majority of the HIghMass galaxies. We follow the SDSS convention, but calculate fluxes in elliptical annuli rather than in circular rings. The Petrosian ratio at a galacticentric radius , , is calculated inside an elliptical annuli with an inner semi-major-axis of and outer of . The local surface brightness in the lower left panels of Fig. 12 – 14 also represents the mean H surface brightness inside these annuli. The Petrosian radius () is defined as the semi-major axis at which Petrosian ratio , i.e., the radius where local surface brightness drops to 0.2 of the enclosed surface brightness. Our Petrosian magnitude denotes the flux in an elliptical aperture with , and centroid, , and as given by the global measurements. We also calculate and as the semi-major axes of ellipses that contain 50% and 90% of the Petrosian flux, respectively.
The errors given on magnitudes in this paper include the contributions from the photometric zero point error for a given night and the uncertainty in determining the sky level (set to 0.15 of the sky values in the sky boxes), in addition to the formal errors. In most cases, the Petrosian magnitudes agree with mag8 (similar to the model magnitudes of disk galaxies in SDSS), within the magnitude errors (see below for the exception). However, in four galaxies, AGC 190796, AGC 203522, UGC 8089, and AGC 726428, the LSB H emission drops so slowly outwards that the outermost ellipse of confidential surface brightness measurement is reached before the Petrosian radius can be determined. We report mag8 instead of Petrosian magnitudes for them in Table 2.
If a significant change in slope exists in the light profile, we mark the inner and outer disk regions and fit two exponential functions to each portion individually. The inner fit is used to determine the general disk properties, e.g., , , and as presented in Table 2 and 3, whereas the outer fit is used to extrapolate the surface brightness profile beyond the outermost measured isophote in the calculation of mag8, and to determine the Petrosian aperture.
A.2.3 Absolute Flux Calibration
The instrumental magnitudes (CR being the observed count rate in unites of counts s-1), are calibrated to Johnson-Cousins and AB magnitude systems, respectively, for R-band and H measurements. For R-band calibration, we solve for the color coefficient (), extinction coefficient (), and zero point magnitudes (ZPs). in this equation with all Landolt standards from the same night:
| (4) |
where is the calibrated magnitudes available in Landolt (1992), is the color of stars we measured, and AM is airmass. We get , given multiple exposures for the same star on the first photometric night. The ZPs are determined to be 23.9680.006, 24.0340.003, and 23.9820.008 for the three photometric nights, respectively, with high photometric quality.
For calibrations of H filters, because of the narrow bandpasses, the color term is dropped and we adopt the standard KPNO values. The width of H filters we used translates to a ZP offset, and we only need to solve for ZP in this equation:
| (5) |
where is the monochromatic magnitudes of spectrophotometric standards available in Oke & Gunn (1983) and FWHM is the width of H filters in units of Å. The monochromatic magnitudes () can be converted to flux density ( in units of erg s-1 cm-2 ) via (Oke & Gunn, 1983), so that , where wavelength is in units of . Therefore, given the calibrated H magnitude , the line flux in units of erg s-1 cm-2 is derived as
| (6) |
It must be taken into account that the R-band image used is contaminated by H flux, so that the continuum is over-subtracted. We correct for this effect following a similar approach as in Kennicutt et al. (2008). Because of our targets match very well with the central wavelengths of the H filters, the normalized H filter transmission is close to unity. The final correction factor is thus ‘’, where is filter transmission at wavelength , is exposure time (3 min in R and 15 min in H), and the R frame is divided by factor so as to scale to H frame for the purpose of continuum subtraction. This corresponds to an increment of the final H flux by for most of the HIghMass galaxies.
Examples of the variation with semi-major axis of our KPNO measurements are shown by filled symbols in Fig. 12 – 14 for three galaxies, UGC 6168, UGC 6692, and UGC 9234, respectively (see more discussions of these profiles in text). Black upwards triangles with error bars denote the R-band results in all of these plots; black filled circles with error bars are data points for H. The top two panels show position angles and ellipticities of a series of elliptical apertures as a result of the isophotal fitting. Black solid horizontal lines mark the global values as averages in the disk region (in between the two vertical dash-dotted lines); dotted horizontal lines illustrate the uncertainty range. The middle panels are surface brightness profiles and accumulated magnitudes, converted to AB magnitude system to be consistent with the SDSS results (see Appendix B). Solid horizontal lines mark the Petrosian magnitudes; dashed horizontal lines mark the mag8. The bottom panels are the same quantities for H in physical units, corrected for continuum over-subtraction. Definitions of solid and dashed horizontal lines are the same as in the middle panels; dotted horizontal lines illustrate the uncertainty range.
It is demonstrated that the Petrosian magnitudes recover essentially all of the flux in our disk galaxies, and they generally agree with mag8 within the uncertainty (in Fig. 12 and 13). The only exception is UGC 9234 with a compact central bulge but a shallow outer disk (see the middle left panel of Fig. 14). The strong break in surface brightness profile of this galaxy causes a large deviation between the two magnitudes, in a sense that the Petrosian magnitude severely undercounts the extended flux (see the middle and bottom right panels).
A.2.4 H Equivalent Widths
Finally, we calculated the H equivalent widths (EWs) from net H and scaled R-band images. By definition, it compares the line flux against underlying continuum level, so that EW can be derived without a calibration of absolute flux. It characterizes the strength of current SF relative to the past. The EW in units of , corrected for continuum over-subtraction is:
| (7) |
where FWHM is the width of H filters in units of Å and s are instrumental magnitudes in net H and scaled R-band images, respectively. We present the EW profiles of all 29 HIghMass galaxies with our KPNO measurements in Fig. 15, in order of ascending galaxy . The EW is plotted as a function of semi-major axis in the second column; disk region with an exponential surface brightness profile is marked in between the vertical dash-dotted lines. Cleaned R-band and H images are shown in the third and forth columns, color scales inverted. Apertures within which the Petrosian magnitudes are measured are overlaid on these images, being absent if Petrosian radius is undefined.
A.3 H Photometry External Check
UGC 7686 in the GOLDmine dataset is not re-observed. All the H images presented here are new narrowband observations, and there are few literature measurements to compare for the purpose of external photometry quality check. We only find that UGC 8573 (NGC 5230) has been observed spectroscopically by Jansen et al. (2000). Jansen et al. (2000) obtained integrated and nuclear spectra for 196 nearby galaxies (Nearby Field Galaxy Survey), in order to measure the current SFRs and metallicities of these galaxies. For UGC 8573, 77% of the total B-filter light is sampled in the integrated spectra, resulting in the spectroscopic induce measurements of EW[NII]λλ6548 = 2.1, EWHα = 20.0, and EW[NII]λλ6584 = 7.0 for the integrated spectra. The corresponds numbers for the nuclear spectra are 1.2, 8.0, and 3.4 , respectively. Our global EWHα+[NII] is determined to be 34.512.84 , given the flux inside the Petrosian aperture. Taking into account of the different apertures and the variation of EW in the galaxy, this agreement is satisfactory. Although only the emission-line fluxes relative to H are presented in Jansen et al. (2000), Kewley et al. (2002) calibrate these integrated fluxes to absolute fluxes by comparison with the B-band photometry. Accounting for the extinction inferred from the IR data, they derived an H SFR for NGC 5230 to be log SFR = 0.93, in agreement with our H result, being log SFR(H) = 0.960.15, and our SED fitting result, being log SFR(SED) = 0.890.23 (see Section 4).
We perform an independent check of the calibration of our H measurements by comparing the fluxes in the 3 arcsec nuclear apertures in our H images with the flux in the H+[NII] lines in the SDSS DR8 spectroscopic data (Brinchmann et al., 2004) obtained in 3 arcsec fibers (UGC 12506 is outside of the SDSS spectroscopic footprint). To reduce the impact of aperture effect, we focus on 18 galaxies with better smoothed PSFs. Additional flux uncertainties are introduced into this comparison as a result of our astrometry uncertainty, as well as the offset from center in case of the SDSS fiber positions (e.g., UGC 8573, UGC 9334). We characterize this by the difference in fluxes we obtained from our net H image when placing the 3 arcsec aperture (1) at the coordinate of SDSS-reported fiber position and (2) at the R-band global centroid we derived in Appendix A. Note that the SDSS line fluxes are corrected for Galactic extinction. We assume following Kennicutt et al. (2008), and is given by the DIRBE measurements of diffuse IR emission (Schlegel et al., 1998). Based on the HI systemic velocity, we find that [NII]6584 is outside of the H filter for AGC 203522, UGC 8408, UGC 9023, UGC 9234, and AGC 188749, so that only the SDSS line fluxes of H and [NII]6548 are added up. The final comparison is shown in Fig. 16. Considering that the fluxes from our survey and the SDSS dataset have been measured using entirely different techniques (imaging vs. spectroscopic), the consistency of the respective fluxes is excellent. The only outlier, UGC 6066, has large uncertainties in SDSS measurements as a result of the low S/N spectra, making our flux more reliable.
Appendix B Reprocessed SDSS Photometry
B.1 Surface and Integral Photometry
Because many gas rich galaxies appear to be patchy due to star forming regions throughout the disk, the standard SDSS pipeline will easily suffer from shredding (Huang et al., 2012a). Furthermore, the automatic sky background subtraction is optimized for more distant galaxies with small angular sizes, but will lead to over subtraction for large or LSB galaxies. As a result, we independently recomputed photometric quantities for all 34 HIghMass galaxies, making use of an IRAF pipeline adapted from ‘GALPHOT’.
Header-supplemented corrected frames are retrieved from SDSS DR7 in five bands, u, g, r, i, z. Multiple adjacent frames are combined if our target is on image edge. Following the treatment to H and R-band images in Appendix A, all the other bands are first shifted to align with the r-band image and smoothed to a common PSF. Elliptical isophotal fitting is applied to all images in order to interpolate over the contaminating sources for all bands, but we use the same set of apertures given by the r-band fitting on all SDSS images for consistency. We obtain one-dimensional profiles, as a function of semi-major axis, of the centroid, , , and surface brightness of all elliptical isophots.
Among various global magnitudes we calculated, the Petrosian magnitudes are preferred. Alternatively, we adopt mag8 in all bands if Petrosian radius is undetermined in any band to ensure the reliability of colors that are obtained from comparable apertures. To convert counts to AB magnitudes, we follow the convention of SDSS asinh magnitudes, where the photometric zeropoint, extinction coefficient, and softening parameter are found in image headers. However, we confirm that all of the HIghMass galaxies are detected in SDSS bands with high S/N so that the difference between asinh magnitude and conventional magnitude is less than 1%.
The SDSS measurements of three galaxies are presented by colored open symbols along with the KPNO results by black filled symbols in the top four panels of Fig. 12 – 14; u-band data are denoted by blue circles, g by cyan upward triangles, r by green downward triangles, i by yellow diamonds, and z by red squares. Definitions of the lines are the same as those of the KPNO data. Although only three representative cases are shown, it is generally true that the elliptical isophot fitting to r-band image performed independently from the R-band fitting generates similar sets of apertures possessing similar variations of the and with semi-major axis: the fitting result is robust and insensitive to the initial assumptions of aperture orientation. The global and measurements from r- and R-band images also agree with each other within the uncertainties. Because R and H surface photometries are performed in the same set of apertures, we can derive EWHα profiles. Similarly, surface brightness is measured in the same set of apertures for all SDSS bands, and thus we can obtain the azimuthally-averaged broadband color profiles, which are demonstrated in the first column of Fig. 15 for the color. In between the vertical dash-dotted lines are the disk regions in u (blue lines) and r (green lines) bands, respectively.
B.2 Broadband Photometry Quality Check
B.2.1 Internal Comparison
We have checked the internal consistency of broadband photometry by comparing the KPNO R-band magnitudes with the same quantities inferred by the combined SDSS magnitudes, using the transformation, . The KPNO magnitudes on the Johnson-Cousins standard photometric system are placed onto the AB system by correcting for the color zero-point differences between these systems: . The most extreme outlier from the one-to-one relation is AGC 190796. Its KPNO R-band magnitude is measured inside the Petrosian aperture, whereas its SDSS combined magnitude comes from mag8 because the Petrosian radius is available only on the r-band image. This Malin-like galaxy has a relatively steeper inner disk but the surface brightness drops off slowly throughout the outer disk. The disk scale length is thus underestimated from the inner fit. In all, we demonstrate that our SDSS-derived R-band magnitudes agree with the KPNO measurements without any systematic offset. This gives further confidence that our KPNO flux calibration is reliable. Plus, the two separate ellipse fittings give consistent , , and surface brightness profiles.
B.2.2 External Comparison
We perform external checks with the I-band catalog from SFI++ Tully-Fisher Survey (Springob et al., 2007), as well as the SDSS DR8 pipeline measurements. I-band magnitudes are derived from our SDSS magnitudes via . We note that the SFI++ program was led by our earlier group members and a similar photometry procedure was followed. It is not surprising to see the excellent agreement between our results (Petrosian magnitudes preferred) and the SFI++ results (mag8) for the 12 galaxies in common. We mention that UGC 8573 has been observed by Jansen et al. (2000) and their B-band magnitude also agree with ours.
In addition we retrieved the SDSS images from DR7 database but we compare our results with the DR8 pipeline measurements, given the fact that DR8 is superior to DR7 mainly due to the changes in image processing rather than re-observing. Although the sky background subtraction is improved in DR8 (Blanton et al., 2011), the problem of shredding still remains. We identify the HIghMass galaxies with problematic DR8 photometry in at least one band and they are represented by open circles in Fig. 17. The rest of galaxies as filled circles in the same figure can be cross correlated to a single photometric object that dominates in flux. The top panels illustrate comparisons between our mag8 and the DR8 model magnitudes in five bands, respectively. Obviously, fluxes are under represented by the pipeline magnitudes, especially in bluer bands and among the galaxies suffering from shredding. It suggests an inconsistency of flux redistribution among multiple children in different bands, in a sense that the bluer star-forming regions are more likely to be identified as separate photometric objects. Therefore, the pipeline magnitudes result in redder colors than our measurements, and subsequently lower SSFRs. The lower panels show comparisons of more quantities, e.g., axial ratio, , , and disk scale length . Both axial ratio measurements have been corrected for the seeing effect and no systematic deviation exists. However, our Petrosian magnitudes are derived in elliptical apertures, so that our and are systematically larger than the same pipeline values derived in circular apertures. Large scatters are seen in the last two panels; the most extreme outliers with much smaller pipeline s suffer from shredding (being open circles). These indicate that the pipeline axial ratio can be a good proxy to infer the circular velocity from HI line width by an inclination correction, whereas the derived quantities depending on are more vulnerable to large scatter, e.g., the empirical values obtained in Huang et al. (2012b).
References
- Abazajian et al. (2009) Abazajian, K. N., Adelman-McCarthy, J. K., Agüeros, M. A., et al. 2009, ApJS, 182, 543
- Baldry et al. (2004) Baldry, I. K., Glazebrook, K., Brinkmann, J., et al. 2004, ApJ, 600, 681
- Baldry et al. (2006) Baldry, I. K., Balogh, M. L., Bower, R. G., et al. 2006, MNRAS, 373, 469
- Bell et al. (2003) Bell, E. F., McIntosh, D. H., Katz, N., & Weinberg, M. D. 2003, ApJS, 149, 289
- Bigiel et al. (2008) Bigiel, F., Leroy, A., Walter, F., et al. 2008, AJ, 136, 2846
- Bigiel et al. (2010) Bigiel, F., Leroy, A., Walter, F., et al. 2010, AJ, 140, 1194
- Bigiel et al. (2011) Bigiel, F., Leroy, A. K., Walter, F., et al. 2011, ApJ, 730, L13
- Blanton et al. (2005) Blanton, M. R., Lupton, R. H., Schlegel, D. J., et al. 2005, ApJ, 631, 208
- Blanton et al. (2011) Blanton, M. R., Kazin, E., Muna, D., Weaver, B. A., & Price-Whelan, A. 2011, AJ, 142, 31
- Boissier & Prantzos (2000) Boissier, S., & Prantzos, N. 2000, MNRAS, 312, 398
- Boissier et al. (2007) Boissier, S., Gil de Paz, A., Boselli, A., et al. 2007, ApJS, 173, 524
- Bothun (1985) Bothun, G. D. 1985, AJ, 90, 1982
- Bothun et al. (1985) Bothun, G. D., Beers, T. C., Mould, J. R., & Huchra, J. P. 1985, AJ, 90, 2487
- Bothun et al. (1987) Bothun, G. D., Impey, C. D., Malin, D. F., & Mould, J. R. 1987, AJ, 94, 23
- Bothun et al. (1990) Bothun, G. D., Schombert, J. M., Impey, C. D., & Schneider, S. E. 1990, ApJ, 360, 427
- Bouché et al. (2010) Bouché, N., Dekel, A., Genzel, R., et al. 2010, ApJ, 718, 1001
- Brinchmann et al. (2004) Brinchmann, J., Charlot, S., White, S. D. M., et al. 2004, MNRAS, 351, 1151
- Bruzual & Charlot (2003) Bruzual, G., & Charlot, S. 2003, MNRAS, 344, 1000
- Caldwell et al. (1991) Caldwell, N., Kennicutt, R., Phillips, A. C., & Schommer, R. A. 1991, ApJ, 370, 526
- Calzetti et al. (2000) Calzetti, D., Armus, L., Bohlin, R. C., et al. 2000, ApJ, 533, 682
- Catinella et al. (2008) Catinella, B., Haynes, M. P., Giovanelli, R., Gardner, J. P., & Connolly, A. J. 2008, ApJ, 685, L13
- Catinella et al. (2010) Catinella, B., Schiminovich, D., Kauffmann, G., et al. 2010, MNRAS, 403, 683
- Catinella et al. (2013) Catinella, B., Schiminovich, D., Cortese, L., et al. 2013, MNRAS, 436, 34
- Chabrier (2003) Chabrier, G. 2003, PASP, 115, 763
- Cortese et al. (2012) Cortese, L., Boissier, S., Boselli, A., et al. 2012, A&A, 544, A101
- Cowie et al. (1996) Cowie, L. L., Songaila, A., Hu, E. M., & Cohen, J. G. 1996, AJ, 112, 839
- Croton et al. (2006) Croton, D. J., Springel, V., White, S. D. M., et al. 2006, MNRAS, 365, 11
- de Vaucouleurs et al. (1991) de Vaucouleurs, G., de Vaucouleurs, A., Corwin, H. G., Jr., et al. 1991, Third Reference Catalogue of Bright Galaxies
- Disney & Phillipps (1987) Disney, M., & Phillipps, S. 1987, Nature, 329, 203
- Duffy et al. (2012) Duffy, A. R., Meyer, M. J., Staveley-Smith, L., et al. 2012, MNRAS, 426, 3385
- Finkelman & Brosch (2011) Finkelman, I. & Brosch, N. 2011, MNRAS, 413, 2621
- Fraternali & Tomassetti (2012) Fraternali, F., & Tomassetti, M. 2012, MNRAS, 426, 2166
- Freeman (1970) Freeman, K. C. 1970, ApJ, 160, 811
- Fu et al. (2010) Fu, J., Guo, Q., Kauffmann, G., & Krumholz, M. R. 2010, MNRAS, 409, 515
- Gavazzi et al. (2003) Gavazzi, G., Boselli, A., Donati, A., Franzetti, P., & Scodeggio, M. 2003, A&A, 400, 451
- Gavazzi et al. (2012) Gavazzi, G., Fumagalli, M., Galardo, V., et al. 2012, A&A, 545, A16
- Giovanelli & Haynes (1985) Giovanelli, R., & Haynes, M. P. 1985, ApJ, 292, 404
- Giovanelli et al. (1994) Giovanelli, R., Haynes, M. P., Salzer, J. J., et al. 1994, AJ, 107, 2036
- Giovanelli et al. (1997) Giovanelli, R., Haynes, M. P., Herter, T., et al. 1997, AJ, 113, 22
- Giovanelli et al. (2005) Giovanelli, R., Haynes, M. P., Kent, B. R., et al. 2005, AJ, 130, 2598
- Hallenbeck et al. (2014) Hallenbeck, G., Huang, S., Haynes, M.P. et al. 2014, (submitted)
- Haynes et al. (2011) Haynes, M. P., Giovanelli, R., Martin, A. M., et al. 2011, AJ, 142, 170
- Helmboldt et al. (2005) Helmboldt, J. F., Walterbos, R. A. M., Bothun, G. D., & O’Neil, K. 2005, ApJ, 630, 824
- Hernandez & Cervantes-Sodi (2006) Hernandez, X., & Cervantes-Sodi, B. 2006, MNRAS, 368, 351
- Hernandez et al. (2007) Hernandez, X., Park, C., Cervantes-Sodi, B., & Choi, Y.-Y. 2007, MNRAS, 375, 163
- Hopkins et al. (2003) Hopkins, A. M., Miller, C. J., Nichol, R. C., et al. 2003, ApJ, 599, 971
- Huang et al. (2012a) Huang, S., Haynes, M. P., Giovanelli, R., et al. 2012, AJ, 143, 133
- Huang et al. (2012b) Huang, S., Haynes, M. P., Giovanelli, R., & Brinchmann, J. 2012, ApJ, 756, 113
- Hunter & Elmegreen (2004) Hunter, D. A., & Elmegreen, B. G. 2004, AJ, 128, 2170
- Hunter et al. (2010) Hunter, D. A., Elmegreen, B. G., & Ludka, B. C. 2010, AJ, 139, 447
- Impey & Bothun (1997) Impey, C., & Bothun, G. 1997, ARA&A, 35, 267
- James et al. (2004) James, P. A., Shane, N. S., Beckman, J. E., et al. 2004, A&A, 414, 23
- Jansen et al. (2000) Jansen, R. A., Franx, M., Fabricant, D., & Caldwell, N. 2000, ApJS, 126, 271
- Jansen et al. (2000) Jansen, R. A., Fabricant, D., Franx, M., & Caldwell, N. 2000, ApJS, 126, 331
- Karachentsev & Kaisin (2010) Karachentsev, I. D., & Kaisin, S. S. 2010, AJ, 140, 1241
- Karachentseva (1973) Karachentseva, V. E. 1973, Astrofizicheskie Issledovaniia Izvestiya Spetsial’noj Astrofizicheskoj Observatorii, 8, 3
- Kennicutt (1983) Kennicutt, R. C., Jr. 1983, ApJ, 272, 54
- Kennicutt (1988) Kennicutt, R. C., Jr. 1988, ApJ, 334, 144
- Kennicutt et al. (1989) Kennicutt, R. C., Jr., Edgar, B. K., & Hodge, P. W. 1989, ApJ, 337, 761
- Kennicutt et al. (1989) Kennicutt, R. C., Jr., Keel, W. C., & Blaha, C. A. 1989, AJ, 97, 1022
- Kennicutt (1989) Kennicutt, R. C., Jr. 1989, ApJ, 344, 685
- Kennicutt (1998) Kennicutt, R. C., Jr. 1998, ApJ, 498, 541
- Kennicutt et al. (2003) Kennicutt, R. C., Jr., Armus, L., Bendo, G., et al. 2003, PASP, 115, 928
- Kennicutt et al. (2008) Kennicutt, R. C., Jr., Lee, J. C., Funes, S. J., José G., Sakai, S., & Akiyama, S. 2008, ApJS, 178, 247
- Kennicutt & Evans (2012) Kennicutt, R. C., Jr, & Evans, N. J., II 2012, arXiv:1204.3552
- Kereš et al. (2005) Kereš, D., Katz, N., Weinberg, D. H., & Davé, R. 2005, MNRAS, 363, 2
- Kewley et al. (2002) Kewley, L. J., Geller, M. J., Jansen, R. A., & Dopita, M. A. 2002, AJ, 124, 3135
- Kewley et al. (2010) Kewley, L. J., Rupke, D., Zahid, H. J., Geller, M. J., & Barton, E. J. 2010, ApJ, 721, L48
- Kim & Lee (2013) Kim, J.-h., & Lee, J. 2013, MNRAS, 432, 1701
- Kravtsov (2013) Kravtsov, A. V. 2013, ApJ, 764, L31
- Krumholz (2013) Krumholz, M. R. 2013, MNRAS, 2443
- Landolt (1992) Landolt, A. U. 1992, AJ, 104, 340
- Lee et al. (2007) Lee, J. C., Kennicutt, R. C., Funes, S. J., José G., Sakai, S., & Akiyama, S. 2007, ApJ, 671, L113
- Lelli et al. (2010) Lelli, F., Fraternali, F., & Sancisi, R. 2010, A&A, 516, A11
- Lemonias et al. (2011) Lemonias, J. J., Schiminovich, D., Thilker, D., et al. 2011, ApJ, 733, 74
- Leroy et al. (2008) Leroy, A. K., Walter, F., Brinks, E., et al. 2008, AJ, 136, 2782
- Li et al. (2012) Li, C., Kauffmann, G., Fu, J., et al. 2012, MNRAS, 424, 1471
- Liu et al. (2013) Liu, G., Calzetti, D., Kennicutt, R. C., Jr., et al. 2013, ApJ, 772, 27
- Martin & Roy (1994) Martin, P., & Roy, J.-R. 1994, ApJ, 424, 599
- Martin et al. (2012) Martin, A. M., Giovanelli, R., Haynes, M. P., & Guzzo, L. 2012, ApJ, 750, 38
- Martín-Navarro et al. (2012) Martín-Navarro, I., Bakos, J., Trujillo, I., et al. 2012, MNRAS, 427, 1102
- Masters et al. (2012) Masters, K. L., Nichol, R. C., Haynes, M. P., et al. 2012, MNRAS, 424, 2180
- Meurer et al. (2006) Meurer, G. R., Hanish, D. J., Ferguson, H. C., et al. 2006, ApJS, 165, 307
- Meyer et al. (2004) Meyer, M. J., Zwaan, M. A., Webster, R. L., et al. 2004, MNRAS, 350, 1195
- Meyer (2009) Meyer, M. 2009, Panoramic Radio Astronomy: Wide-field 1-2 GHz Research on Galaxy Evolution,
- Mo et al. (1994) Mo, H. J., McGaugh, S. S., & Bothun, G. D. 1994, MNRAS, 267, 129
- Mo et al. (1998) Mo, H. J., Mao, S., & White, S. D. M. 1998, MNRAS, 295, 319
- Moran et al. (2010) Moran, S. M., Kauffmann, G., Heckman, T. M., et al. 2010, ApJ, 720, 1126
- Muñoz-Mateos et al. (2011) Muñoz-Mateos, J. C., Boissier, S., Gil de Paz, A., et al. 2011, ApJ, 731, 10
- Oey & Clarke (1998) Oey, M. S., & Clarke, C. J. 1998, AJ, 115, 1543
- Oke & Gunn (1983) Oke, J. B., & Gunn, J. E. 1983, ApJ, 266, 713
- Papastergis et al. (2011) Papastergis, E., Martin, A. M., Giovanelli, R., & Haynes, M. P. 2011, ApJ, 739, 38
- Pickering et al. (1997) Pickering, T. E., Impey, C. D., van Gorkom, J. H., & Bothun, G. D. 1997, AJ, 114, 1858
- Pohlen & Trujillo (2006) Pohlen, M., & Trujillo, I. 2006, A&A, 454, 759
- Portas et al. (2010) Portas, A. M., Brinks, E., Filho, M. E., et al. 2010, MNRAS, 407, 1674
- Roškar et al. (2008) Roškar, R., Debattista, V. P., Stinson, G. S., et al. 2008, ApJ, 675, L65
- Saintonge et al. (2011) Saintonge, A., Kauffmann, G., Kramer, C., et al. 2011, MNRAS, 415, 32
- Salim et al. (2007) Salim, S., Rich, R. M., Charlot, S., et al. 2007, ApJS, 173, 267
- Sánchez-Gallego et al. (2012) Sánchez-Gallego, J. R., Knapen, J. H., Wilson, C. D., et al. 2012, MNRAS, 422, 3208
- Sancisi et al. (2008) Sancisi, R., Fraternali, F., Oosterloo, T., & van der Hulst, T. 2008, A&A Rev., 15, 189
- Schiminovich et al. (2010) Schiminovich, D., Catinella, B., Kauffmann, G., et al. 2010, MNRAS, 408, 919
- Schlegel et al. (1998) Schlegel, D. J., Finkbeiner, D. P., & Davis, M. 1998, ApJ, 500, 525
- Schombert et al. (1992) Schombert, J. M., Bothun, G. D., Schneider, S. E., & McGaugh, S. S. 1992, AJ, 103, 1107
- Schombert et al. (2011) Schombert, J., Maciel, T., & McGaugh, S. 2011, Advances in Astronomy, 2011,
- Schruba et al. (2011) Schruba, A., Leroy, A. K., Walter, F., et al. 2011, AJ, 142, 37
- Sprayberry et al. (1995) Sprayberry, D., Impey, C. D., Bothun, G. D., & Irwin, M. J. 1995, AJ, 109, 558
- Springel et al. (2006) Springel, V., Frenk, C. S., & White, S. D. M. 2006, Nature, 440, 1137
- Springob et al. (2007) Springob, C. M., Masters, K. L., Haynes, M. P., Giovanelli, R., & Marinoni, C. 2007, ApJS, 172, 599
- Stewart et al. (2013) Stewart, K. R., Brooks, A. M., Bullock, J. S., et al. 2013, arXiv:1301.3143
- Taylor et al. (2011) Taylor, E. N., Hopkins, A. M., Baldry, I. K., et al. 2011, MNRAS, 418, 1587
- Thilker et al. (2000) Thilker, D. A., Braun, R., & Walterbos, R. A. M. 2000, AJ, 120, 3070
- Thilker et al. (2007) Thilker, D. A., Bianchi, L., Meurer, G., et al. 2007, ApJS, 173, 538
- Tully et al. (1996) Tully, R. B., Verheijen, M. A. W., Pierce, M. J., Huang, J.-S., & Wainscoat, R. J. 1996, AJ, 112, 2471
- Verdes-Montenegro et al. (2005) Verdes-Montenegro, L., Sulentic, J., Lisenfeld, U., et al. 2005, A&A, 436, 443
- Walter et al. (2008) Walter, F., Brinks, E., de Blok, W. J. G., et al. 2008, AJ, 136, 2563
- Wang et al. (2013) Wang, J., Kauffmann, G., Józsa, G. I. G., et al. 2013, MNRAS, 433, 270
- Willett et al. (2013) Willett, K. W., Lintott, C. J., Bamford, S. P., et al. 2013, MNRAS, 435, 2835
- Zwaan et al. (2005) Zwaan, M. A., Meyer, M. J., Staveley-Smith, L., & Webster, R. L. 2005, MNRAS, 359, L30
| AGC | Other | R.A. | Dec. | morph | GALEX | H | HI | |||||
|---|---|---|---|---|---|---|---|---|---|---|---|---|
| [∘] | [∘] | [km s-1] | [km s-1] | [km s-1] | [Mpc] | [M⊙] | ||||||
| (1) | (2) | (3) | (4) | (5) | (6) | (7) | (8) | (9) | (10) | (11) | (12) | (13) |
| 188749 | SDSS J080649.98+120341.7 | 121.7079 | 12.062 | ExtendedSrc | 136 | 105 | 10972 | 160 | 10.14(0.03) | AIS | K | GMRT11 |
| 4599 | UGC 04599 | 131.9238 | 13.419 | (R)S0 | 148 | 195 | 2071 | 32 | 10.04(0.15) | AIS | K | … |
| 190796 | LSBC F634-V02 | 137.7754 | 13.122 | S/Malin-like | 123 | 158 | 8895 | 131 | 10.14(0.02) | AIS | K | … |
| 721391 | CGCG 121-063 | 140.3658 | 25.062 | … | 293 | 152 | 7537 | 111 | 10.07(0.02) | AIS | K | … |
| 190277 | CGCG 062-031 | 141.3088 | 12.156 | Sdm(flat) | 286 | 144 | 8658 | 128 | 10.22(0.02) | MIS | K | … |
| 5543 | UGC 05543 | 154.0850 | 4.822 | Sc | 547 | 340 | 13737 | 201 | 10.73(0.03) | MIS | K | JVLA11 |
| 5648 | UGC 05648 | 156.5362 | 4.372 | S | 322 | 169 | 6862 | 103 | 10.14(0.02) | MIS | K | … |
| 5711 | NGC 3270 | 157.8750 | 24.869 | S(r)b: | 522 | 271 | 6253 | 93 | 10.51(0.01) | AIS | K | JVLA11 |
| 203522 | SDSS J103304.79+073453.2 | 158.2700 | 7.581 | … | 190 | 108 | 10886 | 160 | 10.21(0.04) | AIS | K | GMRT11 |
| 6043 | UGC 06043 | 164.0642 | 15.223 | Scd: | 276 | 150 | 8148 | 121 | 10.06(0.03) | AIS | K | … |
| 6066 | UGC 06066 | 164.7471 | 6.522 | Sab:edge-on | 667 | 342 | 11807 | 173 | 10.71(0.02) | … | K | JVLA11 |
| 6168 | UGC 06168 | 166.7679 | 7.804 | (R’)S(r)bc: | 363 | 193 | 8073 | 120 | 10.35(0.02) | AIS | K | JVLA11 |
| 6536 | NGC 3728 | 173.3158 | 24.447 | Sb | 430 | 269 | 6962 | 103 | 10.58(0.01) | AIS | K | WSRT11 |
| 6692 | NGC 3833 | 175.8704 | 10.161 | Sc | 390 | 219 | 6060 | 91 | 10.37(0.01) | AIS | K | … |
| 213964 | SDSS J114637.62+061017.0 | 176.6567 | 6.171 | … | 88 | 57 | 9876 | 146 | 10.08(0.03) | AIS | K | GMRT11 |
| 6895 | NGC 3968 | 178.8696 | 11.968 | S(rs)bc | 490 | 324 | 6389 | 96 | 10.65(0.01) | AIS | K | GMRT09 |
| 6967 | NGC 4017 | 179.6908 | 27.452 | Sbc | 253 | 242 | 3453 | 51 | 10.23(0.09) | GII | K | … |
| 7220 | IC 3046 | 183.2829 | 12.918 | S?/Sc(s)I | 443 | 225 | 8102 | 120 | 10.52(0.01) | GII | K | JVLA11 |
| 7686 | IC 3467 | 188.1025 | 11.787 | Scd: | 274 | 140 | 7510 | 112 | 10.22(0.02) | DIS | G | GMRT11 |
| 7899 | IC 3704 | 190.9400 | 10.770 | Sbc/Sc | 433 | 221 | 8696 | 128 | 10.42(0.02) | GII | K | JVLA11 |
| 8089 | UGC 08089 | 194.6254 | 9.544 | SBdm: | 117 | 105 | 7142 | 106 | 10.06(0.01) | … | K | GMRT11 |
| 8408 | NGC 5115 | 200.7512 | 13.951 | SBcd: | 290 | 171 | 7303 | 108 | 10.26(0.02) | AIS | K | … |
| 8475 | NGC 5162 | 202.3575 | 11.008 | Scd: | 591 | 329 | 6835 | 101 | 10.66(0.01) | GII | K | GMRT09 |
| 8573 | NGC 5230 | 203.8829 | 13.676 | S(s)c | 152 | 154 | 6857 | 101 | 10.53(0.01) | AIS | K | GMRT09 |
| 8797 | UGC 08797 | 208.2600 | 24.560 | S? | 559 | 305 | 17104 | 247 | 10.70(0.04) | AIS | … | JVLA11 |
| 9023 | UGC 09023 | 211.7129 | 9.321 | Scd: | 231 | 128 | 7203 | 106 | 10.05(0.02) | AIS | K | … |
| 248881 | KUG 1405+151 | 211.8550 | 14.919 | Spiral | 192 | 115 | 7660 | 112 | 10.10(0.02) | AIS | K | … |
| 9037 | UGC 09037 | 212.1213 | 7.058 | Scd: | 294 | 174 | 5939 | 88 | 10.33(0.01) | MIS | K | JVLA11 |
| 726428 | 2MASX J14220675+2659490 | 215.5283 | 26.997 | … | 208 | 142 | 8892 | 129 | 10.02(0.03) | AIS | K | … |
| 9234 | UGC 09234 | 216.1942 | 26.139 | S? | 589 | 433 | 10890 | 158 | 10.68(0.02) | GII | K | WSRT11 |
| 9334 | NGC 5650 | 217.7542 | 5.978 | Sbc | 413 | 259 | 7493 | 110 | 10.57(0.01) | MIS | K | JVLA11 |
| 714145 | 2MASX J14342549+0835510 | 218.6063 | 8.597 | … | 283 | 158 | 8262 | 121 | 10.18(0.03) | AIS | K | … |
| 9410 | UGC 09410 | 219.3079 | 8.646 | Sbc | 317 | 170 | 8421 | 123 | 10.19(0.03) | AIS | K | … |
| 12506 | UGC 12506 | 349.8771 | 16.074 | Scd: | 457 | 230 | 7237 | 98 | 10.53(0.01) | AIS | K* | JVLA11 |
| AGC | H filter | R | EWHα+[NII] | ||||||||||
|---|---|---|---|---|---|---|---|---|---|---|---|---|---|
| [deg] | [mag arcsec-2] | [arcsec] | [arcsec] | [arcsec] | [arcsec] | [arcsec] | [mag] | [erg s-1 cm-2] | [Å] | [ yr-1] | |||
| (1) | (2) | (3) | (4) | (5) | (6) | (7) | (8) | (9) | (10) | (11) | (12) | (13) | (14) |
| 188749 | 1497 | -17(28) | 0.27(0.14) | 20.87 | 4.2 | … | 8.5 | 18.5 | 32.2 | 16.00(0.03) | -13.86(0.13) | 17.37(5.56) | -0.39(0.18) |
| 190796 | 1496 | 85(43) | 0.09(0.05) | 21.92 | 8.8 | … | 17.9 | 57.9 | 49.8 | 14.96(0.19) | -13.47(0.12)**footnotemark: | 19.54(5.68) | -0.22(0.19) |
| 721391 | 1496 | 78(1) | 0.69(0.05) | 20.22 | 9.9 | 5.7 | 12.4 | 27.8 | 87.0 | 14.81(0.03) | -13.16(0.04) | 28.82(2.95) | 0.32(0.28) |
| 5543 | 1517 | -11(6) | 0.39(0.06) | 19.83 | 10.1 | … | 15.2 | 37.7 | 96.5 | 13.30(0.02) | -12.53(0.02) | 30.63(1.41) | 1.25(0.24) |
| 5648 | 1566 | 18(1) | 0.63(0.05) | 19.46 | 6.7 | … | 10.6 | 27.0 | 68.5 | 14.40(0.01) | -12.98(0.02) | 34.26(1.83) | 0.34(0.24) |
| 5711 | 1566 | 12(1) | 0.65(0.06) | 20.16 | 23.4 | … | 29.9 | 89.7 | 208.5 | 12.22(0.01) | -12.45(0.03) | 13.98(0.88) | 1.03(0.36) |
| 203522 | 1497 | -84(5) | 0.43(0.06) | 21.13 | 4.3 | 5.1 | … | … | 31.0 | 15.98(0.02)**footnotemark: | -13.14(0.01)**footnotemark: | 90.66(2.85) | 0.47(0.17) |
| 6043 | 1496 | 62(6) | 0.56(0.04) | 21.07 | 10.7 | 34.7 | 17.9 | 37.0 | 77.6 | 14.75(0.01) | -13.21(0.06) | 24.41(3.90) | 0.22(0.25) |
| 6066 | 1498 | 40(2) | 0.68(0.08) | 20.45 | 14.5 | … | 10.9 | 49.2 | 121.7 | 13.62(0.02) | -13.17(0.06) | 9.36(1.29) | 0.88(0.34) |
| 6168 | 1496 | -56(2) | 0.58(0.07) | 19.92 | 8.7 | … | 13.1 | 36.4 | 81.7 | 14.05(0.01) | -12.89(0.02) | 27.25(1.50) | 0.57(0.26) |
| 6536 | 1566 | 21(5) | 0.38(0.05) | 20.88 | 18.2 | … | 11.7 | 48.3 | 138.1 | 12.68(0.01) | -12.95(0.01) | 6.72(0.25) | 0.13(0.20) |
| 6692 | 1495 | 36(6) | 0.49(0.06) | 20.27 | 17.6 | 6.8 | 24.3 | 38.6 | 153.6 | 13.10(0.01) | -12.56(0.04) | 23.97(2.45) | 0.49(0.20) |
| 213964 | 1497 | 35(46) | 0.32(0.10) | 21.18 | 5.7 | … | 10.9 | 29.3 | 40.0 | 15.68(0.02) | -13.26(0.03) | 51.19(3.91) | 0.08(0.15) |
| 6895 | 1566 | 20(13) | 0.31(0.04) | 19.78 | 19.8 | … | 29.0 | 74.6 | 190.0 | 11.62(0.02) | -12.11(0.04) | 16.54(1.42) | 0.96(0.24) |
| 6967 | 1565 | -29(51) | 0.36(0.17) | 19.41 | 12.4 | … | 28.6 | 47.5 | 127.8 | 12.60(0.02) | -12.03(0.01) | 39.78(1.32) | 0.31(0.11) |
| 7220 | 1496 | -49(1) | 0.70(0.09) | 20.26 | 14.6 | 11.7 | 14.7 | 43.2 | 127.3 | 13.84(0.01) | -12.88(0.03) | 22.95(1.61) | 0.90(0.35) |
| 7899 | 1496 | 41(2) | 0.70(0.06) | 19.53 | 11.7 | 5.0 | 17.3 | 37.5 | 118.0 | 13.63(0.01) | -12.45(0.01) | 53.87(1.14) | 1.20(0.30) |
| 8089 | 1566 | -19(44) | 0.29(0.19) | 21.17 | 7.0 | … | … | … | 49.7 | 15.23(0.03)**footnotemark: | -13.50(0.04)**footnotemark: | 21.42(2.22) | -0.47(0.14) |
| 8408 | 1566 | 99(3) | 0.42(0.11) | 20.08 | 10.6 | … | 16.9 | 39.1 | 95.8 | 13.52(0.02) | -12.83(0.04) | 19.51(2.04) | 0.41(0.19) |
| 8475 | 1566 | -15(3) | 0.52(0.05) | 19.88 | 23.6 | … | 37.9 | 86.8 | 222.4 | 11.73(0.01) | -12.10(0.01) | 19.46(0.62) | 1.33(0.30) |
| 8573 | 1566 | 75(46) | 0.15(0.06) | 19.84 | 15.5 | … | 25.9 | 52.0 | 147.0 | 12.01(0.02) | -11.97(0.03) | 34.51(2.84) | 0.96(0.15) |
| 9023 | 1566 | 138(5) | 0.51(0.09) | 20.96 | 10.1 | 6.0 | 14.4 | 32.2 | 75.2 | 14.88(0.06) | -13.19(0.12) | 30.68(8.99) | 0.04(0.21) |
| 248881 | 1496 | -64(14) | 0.43(0.12) | 19.82 | 5.0 | 12.5 | 10.5 | 25.3 | 47.3 | 14.85(0.02) | -12.90(0.01) | 58.02(2.44) | 0.38(0.22) |
| 9037 | 1495 | -14(6) | 0.43(0.07) | 20.20 | 12.2 | … | 17.2 | 45.9 | 108.0 | 13.29(0.02) | -12.43(0.04) | 39.95(3.62) | 0.56(0.20) |
| 726428 | 1496 | -4(7) | 0.28(0.05) | 20.93 | 5.8 | … | 9.2 | 25.8 | 43.3 | 15.42(0.05) | -13.34(0.02)**footnotemark: | 37.06(1.65) | -0.13(0.12) |
| 9234 | 1497 | -42(25) | 0.27(0.13) | 23.32 | 33.3 | … | 6.2 | 19.2 | 103.2 | 14.36(0.02) | -13.55(0.04) | 6.70(0.67) | -0.02(0.19) |
| 9334 | 1496 | -73(5) | 0.38(0.09) | 19.71 | 13.1 | … | 22.8 | 52.1 | 127.7 | 12.53(0.02) | -12.16(0.03) | 35.34(2.54) | 1.02(0.21) |
| 714145 | 1496 | -12(5) | 0.52(0.05) | 20.56 | 6.7 | … | 9.9 | 25.2 | 54.5 | 15.23(0.04) | -13.43(0.07) | 22.64(3.80) | -0.07(0.22) |
| 9410 | 1496 | -50(2) | 0.58(0.04) | 20.21 | 8.7 | … | 12.6 | 33.3 | 76.6 | 14.45(0.01) | -12.99(0.02) | 31.17(1.58) | 0.40(0.22) |
Values with superscripts are measured by extrapolating the radial profiles to eight times the disk scale length, in substitute for the Petrosian magnitudes. See Appendix A for the definitions of the two types of global magnitudes and validation of their consistency.
| AGC | u | g | r | i | z | ||||||||
|---|---|---|---|---|---|---|---|---|---|---|---|---|---|
| [mag] | [mag] | [mag] | [mag] | [mag] | [mag arcsec-2] | [mag] | [mag] | [] | [ kpc-2] | [ yr-1] | |||
| (1) | (2) | (3) | (4) | (5) | (6) | (7) | (8) | (9) | (10) | (11) | (12) | (13) | (14) |
| 188749 | 18.00(0.14) | 16.68(0.02) | 16.31(0.02) | 16.01(0.02) | 16.05(0.09) | 0.76 | 23.5 | 0.18(0.14) | -19.96 | 9.50(0.08) | 7.32 | -1.28(0.98) | -1.23(0.73) |
| 4599 | 15.71(0.05) | 14.18(0.01) | 13.54(0.01) | 13.14(0.01) | 12.95(0.02) | 0.93 | 21.6 | 0.16(0.13) | -19.23 | 9.62(0.17) | 8.52 | -2.05(0.93) | -1.89(0.70) |
| 190796 | 17.23(0.07)**footnotemark: | 15.94(0.01)**footnotemark: | 15.55(0.01)**footnotemark: | 15.18(0.01)**footnotemark: | 15.12(0.03)**footnotemark: | 0.92 | 24.0 | 0.20(0.16) | -20.34**footnotemark: | 9.76(0.11) | … | -0.61(0.88) | -0.90(0.74) |
| 721391 | 16.57(0.05) | 15.45(0.01) | 15.02(0.01) | 14.71(0.01) | 14.54(0.03) | 0.26 | 23.3 | 0.62(0.30) | -20.93 | 9.84(0.08) | 7.89 | 0.41(0.25) | -0.22(0.20) |
| 190277 | 17.25(0.06) | 16.11(0.01) | 15.62(0.01) | 15.27(0.01) | 15.28(0.04) | 0.13 | 24.6 | 0.50(0.22) | -20.54 | 9.70(0.07) | 7.76 | 0.07(0.23) | -0.33(0.18) |
| 5543 | 15.44(0.05) | 14.16(0.01) | 13.60(0.01) | 13.23(0.01) | 13.07(0.02) | 0.59 | 22.2 | 0.47(0.26) | -23.48 | 11.07(0.09) | 8.22 | 1.08(0.31) | -0.58(0.26) |
| 5648 | 16.23(0.05) | 15.12(0.01) | 14.66(0.01) | 14.40(0.01) | 14.19(0.02) | 0.30 | 22.7 | 0.54(0.27) | -21.02 | 9.92(0.08) | 8.21 | 0.38(0.23) | -0.28(0.16) |
| 5711 | 14.76(0.07) | 13.31(0.01) | 12.61(0.01) | 12.23(0.01) | 11.92(0.03) | 0.26 | 23.2 | 0.90(0.39) | -23.19 | 11.05(0.10) | 8.72 | 0.83(0.58) | -0.74(0.45) |
| 203522 | 17.39(0.15) | 16.43(0.02) | 16.23(0.02) | 16.04(0.03) | 16.12(0.13) | 0.48 | 24.3 | 0.33(0.19) | -20.18 | 9.25(0.08) | 6.91 | 0.12(0.51) | -0.15(0.46) |
| 6043 | 16.63(0.11) | 15.45(0.01) | 15.05(0.02) | 14.87(0.02) | 14.61(0.06) | 0.40 | 23.9 | 0.50(0.27) | -20.93 | 9.80(0.10) | 7.33 | 0.18(0.61) | -0.39(0.47) |
| 6066 | 16.38(0.07) | 14.70(0.01) | 13.93(0.01) | 13.47(0.01) | 13.22(0.02) | 0.23 | 23.2 | 0.91(0.37) | -23.26 | 11.13(0.10) | 9.11 | -0.01(1.03) | -1.48(0.79) |
| 6168 | 16.08(0.06) | 14.91(0.01) | 14.35(0.01) | 14.00(0.01) | 13.76(0.03) | 0.34 | 23.2 | 0.55(0.29) | -21.69 | 10.37(0.08) | 8.38 | 0.57(0.24) | -0.39(0.19) |
| 6536 | 15.08(0.05) | 13.63(0.01) | 12.96(0.01) | 12.61(0.01) | 12.35(0.02) | 0.60 | 21.8 | 0.34(0.22) | -22.54 | 10.87(0.10) | 8.84 | -0.06(0.90) | -1.30(0.70) |
| 6692 | 15.39(0.07) | 14.08(0.01) | 13.39(0.01) | 13.06(0.01) | 12.83(0.03) | 0.46 | 22.5 | 0.35(0.21) | -21.93 | 10.56(0.09) | 8.10 | 0.20(0.46) | -0.84(0.38) |
| 213964 | 17.14(0.05)**footnotemark: | 16.21(0.01)**footnotemark: | 15.88(0.01)**footnotemark: | 15.75(0.01)**footnotemark: | 15.71(0.03)**footnotemark: | 0.64 | 23.9 | 0.21(0.16) | -20.20**footnotemark: | 9.39(0.06) | 6.97 | 0.06(0.18) | -0.21(0.18) |
| 6895 | 13.67(0.06) | 12.49(0.01) | 11.88(0.01) | 11.49(0.01) | 11.27(0.02) | 0.65 | 22.1 | 0.41(0.26) | -23.51 | 11.24(0.09) | 8.45 | 1.15(0.24) | -0.58(0.21) |
| 6967 | 14.07(0.05) | 13.04(0.01) | 12.60(0.01) | 12.41(0.01) | 12.33(0.03) | 0.85 | 21.8 | 0.16(0.12) | -21.19 | 10.00(0.12) | 7.67 | 0.19(0.23) | -0.47(0.20) |
| 7220 | 16.00(0.06) | 14.73(0.01) | 14.12(0.01) | 13.76(0.01) | 13.40(0.03) | 0.18 | 23.5 | 0.92(0.38) | -22.29 | 10.59(0.08) | 8.48 | 0.88(0.27) | -0.32(0.18) |
| 7686 | 16.47(0.07) | 15.40(0.01) | 15.01(0.01) | 14.75(0.01) | 14.65(0.04) | 0.22 | 23.7 | 0.56(0.27) | -20.90 | 9.71(0.07) | 7.75 | 0.39(0.23) | -0.19(0.20) |
| 7899 | 15.53(0.05) | 14.37(0.01) | 13.90(0.01) | 13.57(0.01) | 13.39(0.02) | 0.21 | 23.1 | 0.75(0.33) | -22.47 | 10.49(0.08) | 8.32 | 0.99(0.25) | -0.24(0.20) |
| 8089 | 16.53(0.06)**footnotemark: | 15.63(0.01)**footnotemark: | 15.33(0.02)**footnotemark: | 15.19(0.01)**footnotemark: | 15.05(0.04)**footnotemark: | 0.83 | 24.0 | 0.18(0.15) | -20.05**footnotemark: | 9.37(0.07) | 6.93 | 0.04(0.17) | -0.20(0.18) |
| 8408 | 15.46(0.05) | 14.34(0.01) | 13.88(0.01) | 13.61(0.01) | 13.49(0.03) | 0.53 | 22.6 | 0.32(0.20) | -21.69 | 10.24(0.08) | 7.97 | 0.50(0.22) | -0.42(0.20) |
| 8475 | 14.09(0.06) | 12.79(0.01) | 12.10(0.01) | 11.74(0.01) | 11.41(0.02) | 0.44 | 22.7 | 0.74(0.33) | -23.80 | 11.28(0.09) | 8.33 | 1.31(0.27) | -0.50(0.22) |
| 8573 | 13.90(0.05) | 12.77(0.01) | 12.29(0.01) | 11.98(0.01) | 11.86(0.03) | 0.87 | 21.9 | 0.20(0.16) | -23.02 | 10.89(0.09) | 8.00 | 0.89(0.23) | -0.58(0.22) |
| 8797 | 16.62(0.06) | 15.26(0.01) | 14.59(0.01) | 14.21(0.01) | 14.00(0.03) | 0.40 | 22.8 | 0.62(0.31) | -23.05 | 10.98(0.09) | 8.49 | 0.79(0.42) | -0.72(0.33) |
| 9023 | 16.83(0.14) | 15.57(0.02) | 15.17(0.02) | 14.96(0.02) | 14.88(0.08) | 0.44 | 23.6 | 0.31(0.19) | -20.36 | 9.59(0.08) | 7.50 | -0.81(1.01) | -0.96(0.75) |
| 248881 | 16.27(0.05) | 15.32(0.01) | 15.08(0.01) | 14.90(0.01) | 14.68(0.03) | 0.55 | 22.8 | 0.41(0.24) | -20.64 | 9.56(0.11) | 7.46 | 0.43(0.23) | -0.10(0.27) |
| 9037 | 14.99(0.06) | 13.97(0.01) | 13.60(0.01) | 13.37(0.01) | 13.19(0.04) | 0.53 | 22.5 | 0.36(0.22) | -21.57 | 10.09(0.08) | 7.89 | 0.63(0.21) | -0.25(0.18) |
| 726428 | 17.10(0.05)**footnotemark: | 16.07(0.01)**footnotemark: | 15.66(0.01)**footnotemark: | 15.33(0.01)**footnotemark: | 15.43(0.03)**footnotemark: | 0.68 | 23.3 | 0.18(0.13) | -20.13**footnotemark: | 9.58(0.08) | 7.62 | -0.21(0.19) | -0.46(0.20) |
| 9234 | 17.09(0.06) | 15.34(0.01) | 14.54(0.01) | 14.14(0.01) | 13.89(0.02) | 0.73 | 21.8 | 0.28(0.20) | -21.77 | 10.75(0.09) | 8.77 | -1.21(0.95) | -2.12(0.72) |
| 9334 | 14.33(0.05) | 13.24(0.01) | 12.78(0.01) | 12.53(0.01) | 12.29(0.03) | 0.60 | 22.3 | 0.40(0.23) | -22.92 | 10.73(0.08) | 8.05 | 1.11(0.21) | -0.31(0.16) |
| 714145 | 17.04(0.11) | 15.90(0.02) | 15.49(0.02) | 15.23(0.02) | 15.11(0.06) | 0.45 | 23.3 | 0.40(0.23) | -20.40 | 9.64(0.08) | 7.71 | 0.01(0.30) | -0.37(0.22) |
| 9410 | 16.39(0.09) | 15.25(0.01) | 14.73(0.01) | 14.44(0.01) | 14.28(0.04) | 0.36 | 23.1 | 0.44(0.24) | -21.26 | 10.10(0.08) | 8.07 | 0.35(0.24) | -0.40(0.19) |
| 12506 | 16.13(0.09) | 14.65(0.01) | 13.96(0.01) | 13.71(0.01) | 13.22(0.03) | 0.13 | 24.2 | 0.82(0.38) | -21.98 | 10.46(0.11) | 8.37 | 0.40(0.64) | -0.64(0.52) |
Values with superscripts are measured by extrapolating the radial profiles to eight times the disk scale length, in substitute for the Petrosian magnitudes. See Appendix A for the definitions of the two types of global magnitudes and validation of their consistency.