Implications of the isobar run results
for chiral magnetic effect in heavy ion collisions
Abstract
Chiral magnetic effect (CME) is a macroscopic transport phenomenon induced by quantum anomaly in the presence of chiral imbalance and an external magnetic field. Relativistic heavy ion collisions provide the unique opportunity to look for CME in a non-Abelian plasma, where the chiral imbalance is created by topological transitions similar to those occurring in the Early Universe. The isobar run at Relativistic Heavy Ion Collider was proposed as a way to separate the possible CME signal driven by magnetic field from the background. The first blind analysis results from this important experiment have been recently released by the STAR Collaboration. Under the pre-defined assumption of identical background in RuRu and ZrZr, the results are inconsistent with the presence of CME, as well as with all existing theoretical models (whether including CME or not). However the observed difference of backgrounds must be taken into account before any physical conclusion is drawn. In this paper, we show that once the observed difference in hadron multiplicity and collective flow are quantitatively taken into account, the STAR results could be consistent with a finite CME signal contribution of about .
pacs:
25.75.-q, 25.75.Gz, 25.75.LdIntroduction.— Chiral magnetic effect (CME) is a macroscopic transport phenomenon induced by quantum anomaly in chiral matter. In the presence of an external magnetic field and a chiral imbalance, the CME amounts to the generation of an electric current along :
| (1) |
where is the chiral magnetic conductivity that is proportional to the chiral chemical potential parameterizing the chirality imbalance between the left- and right-handed chiral fermions Kharzeev (2006); Kharzeev et al. (2008); Fukushima et al. (2008). The CME has an impact on the physics of high-density QCD matter Kharzeev et al. (1998, 2002); Kharzeev (2006); Kharzeev and Zhitnitsky (2007); Kharzeev et al. (2008); Fukushima et al. (2008), condensed matter physics Son and Spivak (2013); Zyuzin and Burkov (2012); Basar et al. (2014); Li et al. (2016); Huang et al. (2015), astrophysics Grabowska et al. (2015); Masada et al. (2018); Yamamoto (2016), cosmology Tashiro et al. (2012); Vilenkin and Leahy (1982); Vilenkin (1980), plasma physics Akamatsu and Yamamoto (2013); Hirono et al. (2016); Gorbar et al. (2016), and quantum information Kharzeev and Li (2019); Shevchenko (2013); for reviews, see e.g. Kharzeev and Liao (2021); Kharzeev et al. (2016); Kharzeev (2014); Fukushima (2019); Hattori and Huang (2017); Gao et al. (2020); Burkov (2015); Armitage et al. (2018); Shovkovy (2021).
Relativistic heavy ion collisions provide a unique opportunity to create and study a quark-gluon plasma (QGP) at a temperature of over a trillion degrees. In QGP, the fluctuations of quark chirality imbalance are generated through the topological fluctuations of gluon fields. Moreover, the QGP produced in heavy ion collisions experiences an extremely strong magnetic field Kharzeev et al. (2008) created mostly by the fast-moving spectator protons. Thus the CME is expected to occur in the produced QGP Kharzeev (2006), and may lead to a detectable signal in these collisions Voloshin (2004). The observation of CME in heavy ion collisions would establish the presence of topological fluctuations in a non-Abelian plasma, which represent a crucial ingredient of the baryon asymmetry generation in the Early Universe.
Extensive experimental efforts have been made by STAR, ALICE and CMS Collaborations to look for CME in collisions at both the Relativistic Heavy Ion Collider (RHIC) and the Large Hadron Collider (LHC) Abelev et al. (2009, 2010); Acharya et al. (2020, 2018); Khachatryan et al. (2017), see reviews Zhao and Wang (2019); Li and Wang (2020); Bzdak et al. (2020). The search has proved to be challenging due to a relatively small signal masked by a strong background contamination Voloshin (2004); Wang (2010); Pratt (2010); Bzdak et al. (2010, 2011), see e.g. discussions in Zhao and Wang (2019); Li and Wang (2020); Bzdak et al. (2020, 2013); Choudhury et al. (2022); Christakoglou et al. (2021).
To disentangle the signal driven by magnetic field (in addition to topological fluctuations) and the background driven by the collective flow determined by the collision geometry, it has been proposed to perform a measurement of CME observables in RuRu and ZrZr isobar collisions Voloshin (2010); Koch et al. (2017). The motivation for this measurement was that the similar size and shape of the colliding nuclei would lead to a nearly identical background, whereas the difference in electric charge of Ru and Zr nuclei would result in a difference in the created magnetic field, and thus in a difference in the observed CME signal.
In 2018 the STAR Collaboration performed the corresponding measurements at RHIC. A careful blind analysis was carried out subsequently Adam et al. (2021), with the first set of data released in September 2021 Abdallah et al. (2022a). STAR results are inconsistent with the “pre-defined” criteria for the CME, i.e. the criteria based on the assumption that the backgrounds in RuRu and ZrZr collisions are identical. Namely, the ratios of the CME observables measured in RuRu and ZrZr collisions are smaller than 1, whereas a stronger magnetic field in RuRu system would apparently make this ratio bigger than 1 in the presence of CME. The problem with this result however is that if the CME is absent, the ratios of these observables would have to be equal to 1, and not be smaller than 1. Indeed, none of the theory models predicted the ration smaller than 1, so this experimental result begs for an explanation.
The examination of STAR data Abdallah et al. (2022a) shows the key to understanding this puzzle is the observed difference between the gross properties of hadron production in RuRu and ZrZr collisions that stem from the difference in the shape and size of Ru and Zr nuclei. This observed difference in the multiplicity distributions and the collective flow invalidates the “pre-defined” criteria for the presence of CME, and clearly indicates the need for a post-blinding re-analysis of STAR data. Only after such an analysis is performed, one will be able to draw conclusions about the presence or absence of CME in the data. In this Letter, we address this issue by combining insights from theoretical simulations based on the event-by-event anomalous-viscous fluid dynamics (EBE-AVFD) framework Shi et al. (2020, 2018); Jiang et al. (2018); An et al. (2022); Shen et al. (2016) with the analysis of STAR data.
Correlation observables.— In heavy ion collisions, the CME leads to a charge separation along the magnetic field which is approximately perpendicular to the reaction plane Bloczynski et al. (2013). Such a charge separation can be measured via charge-dependent azimuthal correlations Voloshin (2004); Abelev et al. (2009, 2010), with the most commonly used and observables defined as:
| (2) | |||
| (3) |
In the above, are azimuthal angles of the charged hadron pairs while is the event-plane angle. The “OS-SS” means the difference between the opposite-sign hadron pairs (i.e. the pairs of hadrons with opposite electric charges) and same-sign pairs. Other observables have also been developed and used for experimental analysis Abdallah et al. (2022a); Choudhury et al. (2022), such as comparison between reaction and event plane Xu et al. (2018a); Voloshin (2018), invariant mass dependence Zhao et al. (2019), R-correlator Magdy et al. (2018), signed balance function Tang (2020), event-shape engineering Acharya et al. (2018); Wen et al. (2018) and others.
The CME signal induces the parity-odd harmonic in the azimuthal angle distribution of charged hadrons Kharzeev (2006):
Therefore it contributes to the above observables as and which are thus proportional to the square of the magnetic field strength.
The main challenge in the experimental search of CME is the background correlations that dominate the observables. The identified backgrounds are local charge conservation at hydrodynamic freeze-out and resonance decays. Their contributions to the observables scale approximately as and where is the charged particle multiplicity and is the elliptic flow coefficient. One may also consider the observable for which . Such scaling behaviors were found to approximately hold in model simulations. For more detailed discussions on signals and backgrounds see e.g. Choudhury et al. (2022).
The isobar collision experiment in principle allows to separate the signal and background contributions. In the idealized scenario, the two systems would be identical in their bulk properties (such as multiplicity and collective flow), which would result in the identical background contributions to the and correlators. Therefore in the case of pure background, with no CME present, the measured isobar ratios would be and . The case of a finite CME contribution would imply and . These are the “pre-defined criteria” used in the STAR blind analysis Abdallah et al. (2022a); Adam et al. (2021). However, as clearly shown by the STAR data, the bulk properties of hadrons produced in the two isobar systems are not identical. For example, in the same centrality class, the hadron multiplicities differ at a few percent level – this difference is extremely important in the search for the CME effect. This situation requires a more careful isobar comparison with a proper baseline identification.
Isobar multiplicity comparison.— As discussed above, the event multiplicity plays a key role in the background correlations and it is important to first examine the multiplicity difference between the two isobar pairs. While the Ru and Zr nuclei have an equal number of nucleons, the geometric distributions of protons and neutrons within these nuclei have a non-negligible difference Shi et al. (2019); Xu et al. (2018b); Hammelmann et al. (2020). This difference translates into the difference in the initial conditions (e.g. the participant and the binary collision densities), which in turn affects the subsequent bulk evolution and leads to the observed discrepancy in multiplicity.
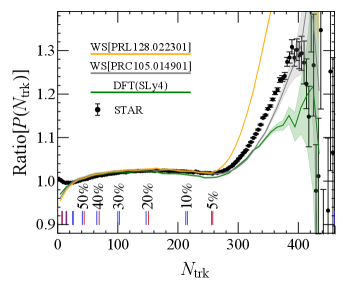
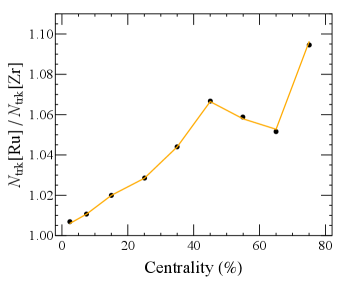
First, we will show that by adopting suitable parameters (like charge radius, neuron skin and harmonic deformation coefficients) for Ru and Zr nuclear distributions, one can reasonably reproduce the observed multiplicity difference. In Fig. 1 (upper panel), we show the ratio for the multiplicity distribution between RuRu and ZrZr from simulations with several choices for the nuclear parameters Zhang and Jia (2022); Abdallah et al. (2022a); Xu et al. (2021). The STAR data are also shown for comparison, along with vertical bars indicating centrality class definition by STAR analysis. The simulation results compare well with data for the centrality class which will be the focus of our analysis. Considerable deviations occur in the very central and peripheral regions where fluctuations and uncertainties of both simulations and data become large. In Fig. 1 (lower panel) for the ratio of average multiplicity between RuRu and ZrZr in the same centrality class as defined by the STAR analysis, one sees nice agreement between simulation results and experimental data. With such multiplicity difference quantitatively accounted, one can expect the simulations to provide useful and realistic baseline resulting from the background correlations.
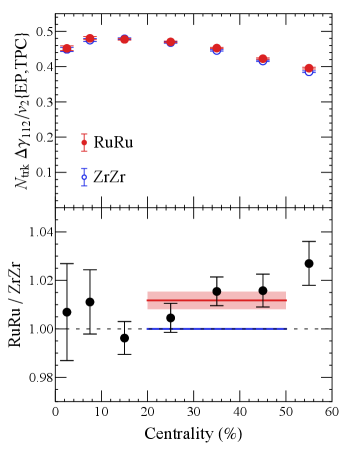
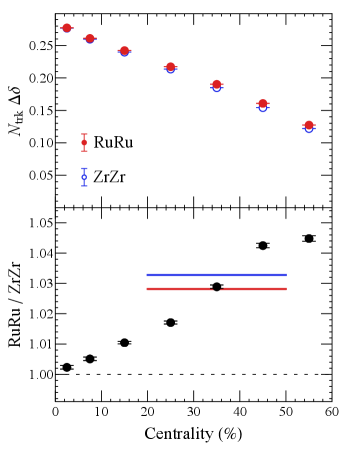
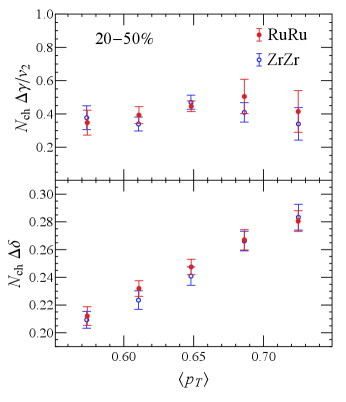
Understanding the measured correlations.— Given the isobar multiplicity difference, a reasonable way to compare the correlators is to take into account the expected scaling behavior of background correlations by examining the following re-scaled correlators: and . Using STAR data from Abdallah et al. (2022a); STAR Collaboration (2022), we plot these re-scaled observables for RuRu and ZrZr in Fig. 2 (upper panels) as well as the RuRu/ZrZr ratios (lower panels).
Let us discuss the RuRu/ZrZr ratios shown in the lower panels of Fig. 2. If the background correlations were to scale exactly as , then the pure-background baseline for both and ratios would be unity. (As a caveat, the non-flow effect has the potential of shifting this ratio at about level and requires careful scrutiny Feng et al. (2022).) A nonzero CME contribution on top of the baseline would then lead to and . As one can see from Fig. 2, the ratio for the scaled correlator is around unity for very central collisions and gradually increases to a value well above one towards the relatively more peripheral region.
This trend is consistent with a nonzero CME contribution that should increase with growing magnetic field strength from central to peripheral collisions. On the other hand, the ratio for the scaled correlator also increases from unity in very central collisions to be above unity in more peripheral collisions, while a nonzero CME contribution would have decreased this ratio to be below unity. This apparent “inconsistency” between the and trends requires a closer scrutiny of the background behavior.
To resolve this issue, we have used our simulation events in the pure background case to verify the assumption about the background scaling. It turns out that the scaling is not exact and a non-negligible additional dependence on the average transverse momentum can be identified, especially in the correlator. The physical origin of this effect is due to the initial fluctuations that could induce a spread of radial flow “push” and thus a spread of even for events with similar multiplicity. Stronger radial flow (i.e. larger ) would lead to a stronger angular collimation of correlated charged hadron pairs, and thus to the enhancement of background correlations Pratt (2010).
To demonstrate the impact of this effect on the and correlators, we bin the simulation events based on and compute the corresponding correlators in each bin. The results, plotted in Fig. 3, clearly show a linear increase of with . The , on the other hand, appears to be relatively insensitive to the . We also note that hydrodynamic simulations performed in Nijs and van der Schee (2021) and in our calculations demonstrate that the RuRu events have a larger than ZrZr events in the same centrality class.
Our findings suggest that while unity is a suitable baseline ratio of the correlator, flow-induced corrections need to be taken into account for the baseline ratio of . Since RuRu system has a larger multiplicity than ZrZr system in the same centrality class, the scaled correlator would have a relative enhancement in the RuRu system due to a slightly larger radial flow “push”. To quantify this correction, we have evaluated the baseline ratio from pure background case to be by using the AVFD simulation events for the isobar pairs. In short, our analysis of the baseline ratios can be summarized as and for collisions, shown as blue lines in Fig. 2 (lower panels). Comparing with the corresponding STAR data, and , shown as red bands in Fig. 2 (lower panels), we conclude that both the scaled and correlators are consistent with a nonzero CME contribution.
Extracting CME signal fraction.— Given the indication of a nonzero CME signal from our analysis above, we now make an attempt to extract the CME signal fraction from both the and correlators based on the available information for centrality from the STAR data as well as from the simulation results.
Let us first examine the correlator. Assuming that the CME signal fraction is , we split the correlator measured in RuRu collisions into a signal and background contributions as follows:
| (4) | |||
| (5) |
where the subscripts “s” and “b” denote the signal and background components, respectively. Since the ZrZr collisions are expected to possess a weaker magnetic field, and thus relatively smaller signal and larger background, we then re-scale these quantities from RuRu to ZrZr collisions as follows:
| (6) | |||
| (7) |
Therefore, the total correlator for ZrZr is:
| (8) | |||||
which means the -ratio between the isobars is
| (9) |
Let us rewrite the ratio as (or equivalently ) and then we can express the as
| (10) |
Under the naïve assumption of identical backgrounds in RuRu and ZrZr systems, as used in the STAR predefined criteria, the pure background case would correspond to , while a nonzero signal would correspond to , and . This assumption is however invalided by the data, as already discussed above.
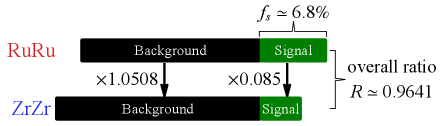
The estimates based on experimental data and simulations suggest instead the following values: (a) or directly from measurements; (b) , dominated by the multiplicity difference, is estimated according to the ratio of and ; (c) The isobar signal ratio is dictated by the magnetic fields, for which the ratio is determined from simulations to be Shi et al. (2019) . See Supplemental Material A Sup for details of how these values are obtained or estimated. Putting these inputs together, one arrives at the following estimate for the CME signal fraction in the measured correlator:
| (11) |
We note that this value is consistent with the isobar analysis results from the event-plane/spectator-plane contrast method Abdallah et al. (2022a). To make the outcome of this analysis more transparent, we illustrate it in Fig. 4.
Summary.— To summarize, we have combined the insights from theoretical simulations with the analysis of STAR experimental data to understand the implications of isobar collisions for the chiral magnetic effect. First, we have shown that the measured multiplicity difference between the RuRu and ZrZr systems, which plays a key role for establishing the background baseline, can be successfully described by simulations with suitable initial nuclear structure inputs. Furthermore, we have identified the radial flow “push” as an important contributor to background correlations, in addition to the multiplicity and elliptic flow. Quantitatively accounting for these two effects on the backgrounds has allowed us a calibration of the appropriate baselines for both the scaled and correlators. Compared with the experimental data, we conclude that the correlation measurements could be consistent with a finite CME signal contribution, estimated at a level of about fraction as illustrated in Fig. 4. Such a fraction is obtained by assuming that the non-CME background of is inversely proportional to multiplicity. There is however non-flow effect Feng et al. (2022) that could make nontrivial contributions to background ratio, the influence of which clearly deserves future investigations (— see Supplemental Material A Sup for more discussions).
Let us discuss possible future measurements that can further help to establish or rule out the presence of CME signal in heavy ion collisions. Given that the radial flow push is found to bear impact on the calibration of backgrounds, it would be very useful to measure and compare the average transverse momentum of charged particles between the isobar systems. Another useful approach for the isobar comparison is to apply identical event selection criteria for multiplicity, and and then compare the subset of isobar events that are ensured to have identical background correlations Shi et al. (2020, 2019). Both the participant-plane/spectator-plane contrast method Xu et al. (2018a); Voloshin (2018) and the event-shape engineering approach Milton et al. (2021) have the potential of maximizing the signal/background contrast, extracting the signal fraction and allowing a verification of expected signal scaling between isobar pairs. Beyond the and correlators, it would be interesting to understand the background scaling and their implications for the interpretation of isobar comparison in e.g. the R-correlator Lacey et al. (2022) as well as the signed balance function Tang (2020). Finally, it is of great importance to achieve a coherent understanding of both isobar and AuAu systems Feng et al. (2021). Recent STAR measurements in AuAu collisions based on the participant-plane/spectator-plane contrast method, while suffering from a limited statistics, do suggest a nonzero CME fraction of Abdallah et al. (2022b). Future high precision measurements based on the anticipated large sample of AuAu events together with the ongoing post-blinding analysis of the extensive isobar data set will hopefully allow to improve the statistical significance of these results and allow to make a conclusive statement on the presence or absence of CME in heavy ion collisions.
Acknowledgments
We thank H. Caines, Y. Hu, H. Huang, R. Lacey, S. Pratt, A. Tang, P. Tribedy, S. Voloshin, F. Wang, G. Wang and Z. Xu for useful discussions and communications. This work is partly supported by the U.S. Department of Energy, Office of Science, Office of Nuclear Physics, within the framework of the Beam Energy Scan Theory (BEST) Topical Collaboration. D.K. and S.S. also acknowledge support by the U.S. Department of Energy, Office of Science, Office of Nuclear Physics, grants Nos. DE-FG88ER40388 and DE-SC0012704. J.L. also acknowledges support by the NSF Grant No. PHY-2209183.
Appendix A Supplementary Materials
In this Supplemental Material, we provide a number of technical details on the simulations and analysis that have been used to obtain the results reported in the main manuscript.
A.0.1 The EBE-AVFD framework
The EBE-AVFD model Shi et al. (2018); Jiang et al. (2018); Shi et al. (2020); An et al. (2022) is a comprehensive simulation framework that dynamically describes the CME in heavy-ion collisions. This state-of-the-art tool has been developed over the past few years to offer a quantitative and realistic characterization of the CME signals as well as the relevant backgrounds. Accordingly, EBE-AVFD implements the dynamical CME transport for quark currents on top of the relativistically expanding viscous QGP fluid and properly models major sources of background correlations such as local charge conservation (LCC) and resonance decays. This tool has been extensively used by experimentalists at both RHIC and LHC to study CME-related observables and help their analyses Choudhury et al. (2022); Christakoglou et al. (2021).
More specifically, the EBE-AVFD framework starts with event-wise fluctuating initial conditions, and solves the evolution of chiral quark currents as linear perturbations in addition to the viscous bulk flow background provided by data-validated hydrodynamic simulation packages. The LCC effect is incorporated in the freeze-out process, followed by the hadron cascade simulations. The fluctuating initial conditions for entropy density profiles are generated by the Monte-Carlo Glauber model. The initial axial charge density () is approximated in such a way that it is proportional to the corresponding local entropy density with a constant ratio. This ratio parameter can be varied to sensitively control the strength of the CME transport. For example, one can set to , and in the simulations to represent scenarios of zero, modest and strong CME signals respectively. The initial electromagnetic field is computed according to the event-wise proton configuration in the Monte-Carlo Glauber initial conditions. The hydrodynamic evolution is solved through two components. The bulk-matter collective flow is described by the VISH2+1 simulation package Shen et al. (2016), with the lattice equation of state s95p-v1.2, shear-viscosity , and freeze-out temperature MeV. Such hydrodynamic simulations of bulk flow have been extensively tested and validated with relevant experimental data. The dynamical CME transport is described by anomalous hydrodynamic equations for the quark chiral currents on top of the bulk flow background, where the magnetic-field-induced CME currents lead to a charge separation in the fireball. After the hydrodynamic stage, hadrons are locally produced in all fluid cells on the freeze-out hypersurface, using the Cooper-Frye procedure. In the freeze-out process, the LCC effect is implemented in the EBE-AVFD package by generalizing an earlier method to mimic more realistically the impact of a finite charge-correlation length, by using a parameter to characterize the fraction of charged hadrons that are sampled in positive-negative pairs with the rest of the hadrons sampled individually. Varying the parameter between 0 and 1 would tune the LCC contributions from none to its maximum. Finally, all the hadrons produced from the freeze-out hypersurface are further subject to hadron cascades through the UrQMD simulations, which account for various hadron resonance decay processes and automatically include their contributions to the charge-dependent correlations. More details can be found in Shi et al. (2018); Jiang et al. (2018); Shi et al. (2020); An et al. (2022).
For the present work, we’ve performed EBE-AVFD simulations with new inputs for the Ru and Zr nucleon distributions that are used in the Monte-Carlo Glauber initial conditions. We tested several different choices based on recent literature Zhang and Jia (2022); Abdallah et al. (2022a); Xu et al. (2021) and were able to reasonably reproduce the observed multiplicity distributions and the ratio between isobar systems, as shown in Fig. 1 of the main manuscript. After successful calibration with isobar multiplicity ratio, these simulation events are used for computations of observables in subsequent figures.
A.0.2 The estimation of signal fraction
Here we provide details on the various numbers and associated uncertainties that are involved in our estimation of the CME signal fraction.
First of all, our analysis uses the official STAR data from their isobar publication Abdallah et al. (2022a) which are now publicly available from STAR Collaboration (2022). We list the relevant numbers in the following table.
| mean | ratio | |||||
|---|---|---|---|---|---|---|
| RuRu | 0.3738(16) | 0.5314(22) | 0.7563(36) | 0.5538(15) | 0.9641(37) | |
| ZrZr | 0.3827(16) | 0.5464(22) | 0.7942(38) | 0.5744(16) | ||
| RuRu | 0.21739(8) | 0.19034(8) | 0.16083(8) | 0.18952(4) | 1.02814(33) | |
| ZrZr | 0.21373(8) | 0.18499(8) | 0.15427(8) | 0.18433(4) | ||
| RuRu | 0.4704(20) | 0.4528(19) | 0.4228(20) | 0.4487(11) | 1.0117(36) | |
| ZrZr | 0.4683(19) | 0.4459(18) | 0.4163(20) | 0.4435(11) | ||
| RuRu | 0.57195(5) | 0.63703(6) | 0.67319(8) | 0.62739(4) | 1.01513(8) | |
| ZrZr | 0.56515(4) | 0.62652(6) | 0.66244(8) | 0.61804(4) | ||
| RuRu | 125.84 | 85.22 | 55.91 | 88.99 | 1.0413 | |
| ZrZr | 122.35 | 81.62 | 52.41 | 85.46 | ||
| RuRu | 0.0126034 | 0.94916 | ||||
| ZrZr | 0.0132784 |
We next show the details for estimating the signal fraction. For this purpose, three numbers need to be obtained: the CME-driven signal ratio between Ru and Zr, the non-CME pure background ratio between Ru and Zr, as well as the overall measured correlator ratio between Ru and Zr.
CME-driven signal ratio — The CME-driven signal difference in is dominated by the magnetic field squared projected along the second-order event plane, . Therefore the signal ratio parameter , with being the ratio of elliptic flow and the ratio of projected magnetic field squared projected. The theoretical uncertainty of is dominated by that of the proton density distributions within the colliding nuclei. According to Shi et al. (2019) and similar calculations, one can estimate that . The measured ratio can be obtained from experimental data, for which the uncertainty is negligibly small. Combining these together, we obtain the CME-driven signal ratio parameter to be .
Non-CME background ratio — In this work, we take the working assumption that non-CME pure background contribution to the correlator is proportional to inverse multiplicity . With the STAR data for multiplicity distributions available from the HEP database STAR Collaboration (2022), we compute the mean inverse multiplicity as and find that and for the cenrality class. Accordingly, the estimation of the background ratio parameter is given by . As a caveat, there could be non-flow correction to the multiplicity scaling of background ratio used above, as demonstrated by recent analysis in Feng et al. (2022). If such correction is estimated at a level of about uncertainty for the , it would amount to about of uncertainty in the extracted . Clearly, this is an important factor that needs to be carefully quantified with further theoretical modelings and experimental analysis.
Calculation of the correlator ratio —
For the correlator ratio of the scaled correlator , we can simply read off the numbers listed in Table 1 to obtain . Similarly, the RuRu-to-ZrZr ratio of multiplicity scaled correlators and are found to be and and , respectively. Here, we have used the uncorrected number of tracks () for calculating charged multiplicity, for elliptic flow and for . The results for the class are obtained as the mean value from those of , , and centrality classes.
Substituting all these numbers together into the Eq. (10) of the main manuscript, we obtain the final result for the extracted signal fraction: . It should be noted that the estimation of correlator ratio is based on the full TPC measurement by Group-1, which is between the maximum and minimum values obtained from other analysis groups. If one takes the maximum value of , from the 3PC-TPC measurement of Group-3, the fraction becomes ; whereas for the minimum value, from Group-2’s SE-TPC measurement, it gives and results in .
References
- Kharzeev (2006) Dmitri Kharzeev, “Parity violation in hot QCD: Why it can happen, and how to look for it,” Phys. Lett. B 633, 260–264 (2006), arXiv:hep-ph/0406125 .
- Kharzeev et al. (2008) Dmitri E. Kharzeev, Larry D. McLerran, and Harmen J. Warringa, “The Effects of topological charge change in heavy ion collisions: ’Event by event P and CP violation’,” Nucl. Phys. A 803, 227–253 (2008), arXiv:0711.0950 [hep-ph] .
- Fukushima et al. (2008) Kenji Fukushima, Dmitri E. Kharzeev, and Harmen J. Warringa, “The Chiral Magnetic Effect,” Phys. Rev. D 78, 074033 (2008), arXiv:0808.3382 [hep-ph] .
- Kharzeev et al. (1998) Dmitri Kharzeev, R. D. Pisarski, and Michel H. G. Tytgat, “Possibility of spontaneous parity violation in hot QCD,” Phys. Rev. Lett. 81, 512–515 (1998), arXiv:hep-ph/9804221 .
- Kharzeev et al. (2002) D. Kharzeev, A. Krasnitz, and R. Venugopalan, “Anomalous chirality fluctuations in the initial stage of heavy ion collisions and parity odd bubbles,” Phys. Lett. B 545, 298–306 (2002), arXiv:hep-ph/0109253 .
- Kharzeev and Zhitnitsky (2007) D. Kharzeev and A. Zhitnitsky, “Charge separation induced by P-odd bubbles in QCD matter,” Nucl. Phys. A 797, 67–79 (2007), arXiv:0706.1026 [hep-ph] .
- Son and Spivak (2013) D. T. Son and B. Z. Spivak, “Chiral Anomaly and Classical Negative Magnetoresistance of Weyl Metals,” Phys. Rev. B 88, 104412 (2013), arXiv:1206.1627 [cond-mat.mes-hall] .
- Zyuzin and Burkov (2012) A. A. Zyuzin and A. A. Burkov, “Topological response in Weyl semimetals and the chiral anomaly,” Phys. Rev. B 86, 115133 (2012), arXiv:1206.1868 [cond-mat.mes-hall] .
- Basar et al. (2014) Gokce Basar, Dmitri E. Kharzeev, and Ho-Ung Yee, “Triangle anomaly in Weyl semimetals,” Phys. Rev. B 89, 035142 (2014), arXiv:1305.6338 [hep-th] .
- Li et al. (2016) Qiang Li, Dmitri E. Kharzeev, Cheng Zhang, Yuan Huang, I. Pletikosic, A. V. Fedorov, R. D. Zhong, J. A. Schneeloch, G. D. Gu, and T. Valla, “Observation of the chiral magnetic effect in ZrTe5,” Nature Phys. 12, 550–554 (2016), arXiv:1412.6543 [cond-mat.str-el] .
- Huang et al. (2015) Xiaochun Huang et al., “Observation of the Chiral-Anomaly-Induced Negative Magnetoresistance in 3D Weyl Semimetal TaAs,” Phys. Rev. X 5, 031023 (2015), arXiv:1503.01304 [cond-mat.mtrl-sci] .
- Grabowska et al. (2015) Dorota Grabowska, David B. Kaplan, and Sanjay Reddy, “Role of the electron mass in damping chiral plasma instability in Supernovae and neutron stars,” Phys. Rev. D 91, 085035 (2015), arXiv:1409.3602 [hep-ph] .
- Masada et al. (2018) Youhei Masada, Kei Kotake, Tomoya Takiwaki, and Naoki Yamamoto, “Chiral magnetohydrodynamic turbulence in core-collapse supernovae,” Phys. Rev. D 98, 083018 (2018), arXiv:1805.10419 [astro-ph.HE] .
- Yamamoto (2016) Naoki Yamamoto, “Chiral transport of neutrinos in supernovae: Neutrino-induced fluid helicity and helical plasma instability,” Phys. Rev. D 93, 065017 (2016), arXiv:1511.00933 [astro-ph.HE] .
- Tashiro et al. (2012) Hiroyuki Tashiro, Tanmay Vachaspati, and Alexander Vilenkin, “Chiral Effects and Cosmic Magnetic Fields,” Phys. Rev. D 86, 105033 (2012), arXiv:1206.5549 [astro-ph.CO] .
- Vilenkin and Leahy (1982) A. Vilenkin and D. A. Leahy, “PARITY NONCONSERVATION AND THE ORIGIN OF COSMIC MAGNETIC FIELDS,” Astrophys. J. 254, 77–81 (1982).
- Vilenkin (1980) A. Vilenkin, “EQUILIBRIUM PARITY VIOLATING CURRENT IN A MAGNETIC FIELD,” Phys. Rev. D 22, 3080–3084 (1980).
- Akamatsu and Yamamoto (2013) Yukinao Akamatsu and Naoki Yamamoto, “Chiral Plasma Instabilities,” Phys. Rev. Lett. 111, 052002 (2013), arXiv:1302.2125 [nucl-th] .
- Hirono et al. (2016) Yuji Hirono, Dmitri E. Kharzeev, and Yi Yin, “Quantized chiral magnetic current from reconnections of magnetic flux,” Phys. Rev. Lett. 117, 172301 (2016), arXiv:1606.09611 [hep-ph] .
- Gorbar et al. (2016) E. V. Gorbar, I. A. Shovkovy, S. Vilchinskii, I. Rudenok, A. Boyarsky, and O. Ruchayskiy, “Anomalous Maxwell equations for inhomogeneous chiral plasma,” Phys. Rev. D 93, 105028 (2016), arXiv:1603.03442 [hep-th] .
- Kharzeev and Li (2019) Dmitri E. Kharzeev and Qiang Li, “The Chiral Qubit: quantum computing with chiral anomaly,” (2019), arXiv:1903.07133 [quant-ph] .
- Shevchenko (2013) V. Shevchenko, “Quantum measurements and chiral magnetic effect,” Nucl. Phys. B 870, 1–15 (2013), arXiv:1208.0777 [hep-th] .
- Kharzeev and Liao (2021) Dmitri E. Kharzeev and Jinfeng Liao, “Chiral magnetic effect reveals the topology of gauge fields in heavy-ion collisions,” Nature Rev. Phys. 3, 55–63 (2021), arXiv:2102.06623 [hep-ph] .
- Kharzeev et al. (2016) D. E. Kharzeev, J. Liao, S. A. Voloshin, and G. Wang, “Chiral magnetic and vortical effects in high-energy nuclear collisions—A status report,” Prog. Part. Nucl. Phys. 88, 1–28 (2016), arXiv:1511.04050 [hep-ph] .
- Kharzeev (2014) Dmitri E. Kharzeev, “The Chiral Magnetic Effect and Anomaly-Induced Transport,” Prog. Part. Nucl. Phys. 75, 133–151 (2014), arXiv:1312.3348 [hep-ph] .
- Fukushima (2019) Kenji Fukushima, “Extreme matter in electromagnetic fields and rotation,” Prog. Part. Nucl. Phys. 107, 167–199 (2019), arXiv:1812.08886 [hep-ph] .
- Hattori and Huang (2017) Koichi Hattori and Xu-Guang Huang, “Novel quantum phenomena induced by strong magnetic fields in heavy-ion collisions,” Nucl. Sci. Tech. 28, 26 (2017), arXiv:1609.00747 [nucl-th] .
- Gao et al. (2020) Jian-Hua Gao, Guo-Liang Ma, Shi Pu, and Qun Wang, “Recent developments in chiral and spin polarization effects in heavy-ion collisions,” Nucl. Sci. Tech. 31, 90 (2020), arXiv:2005.10432 [hep-ph] .
- Burkov (2015) A. A. Burkov, “Chiral anomaly and transport in Weyl metals,” J. Phys. Condens. Matter 27, 113201 (2015), arXiv:1502.07609 [cond-mat.mes-hall] .
- Armitage et al. (2018) N. P. Armitage, E. J. Mele, and Ashvin Vishwanath, “Weyl and Dirac Semimetals in Three Dimensional Solids,” Rev. Mod. Phys. 90, 015001 (2018), arXiv:1705.01111 [cond-mat.str-el] .
- Shovkovy (2021) Igor A. Shovkovy, “Anomalous plasma: chiral magnetic effect and all that,” (2021), arXiv:2111.11416 [nucl-th] .
- Voloshin (2004) Sergei A. Voloshin, “Parity violation in hot QCD: How to detect it,” Phys. Rev. C 70, 057901 (2004), arXiv:hep-ph/0406311 .
- Abelev et al. (2009) B. I. Abelev et al. (STAR), “Azimuthal Charged-Particle Correlations and Possible Local Strong Parity Violation,” Phys. Rev. Lett. 103, 251601 (2009), arXiv:0909.1739 [nucl-ex] .
- Abelev et al. (2010) B. I. Abelev et al. (STAR), “Observation of charge-dependent azimuthal correlations and possible local strong parity violation in heavy ion collisions,” Phys. Rev. C 81, 054908 (2010), arXiv:0909.1717 [nucl-ex] .
- Acharya et al. (2020) Shreyasi Acharya et al. (ALICE), “Constraining the Chiral Magnetic Effect with charge-dependent azimuthal correlations in Pb-Pb collisions at = 2.76 and 5.02 TeV,” JHEP 09, 160 (2020), arXiv:2005.14640 [nucl-ex] .
- Acharya et al. (2018) Shreyasi Acharya et al. (ALICE), “Constraining the magnitude of the Chiral Magnetic Effect with Event Shape Engineering in Pb-Pb collisions at = 2.76 TeV,” Phys. Lett. B 777, 151–162 (2018), arXiv:1709.04723 [nucl-ex] .
- Khachatryan et al. (2017) Vardan Khachatryan et al. (CMS), “Observation of charge-dependent azimuthal correlations in -Pb collisions and its implication for the search for the chiral magnetic effect,” Phys. Rev. Lett. 118, 122301 (2017), arXiv:1610.00263 [nucl-ex] .
- Zhao and Wang (2019) Jie Zhao and Fuqiang Wang, “Experimental searches for the chiral magnetic effect in heavy-ion collisions,” Prog. Part. Nucl. Phys. 107, 200–236 (2019), arXiv:1906.11413 [nucl-ex] .
- Li and Wang (2020) Wei Li and Gang Wang, “Chiral Magnetic Effects in Nuclear Collisions,” Ann. Rev. Nucl. Part. Sci. 70, 293–321 (2020), arXiv:2002.10397 [nucl-ex] .
- Bzdak et al. (2020) Adam Bzdak, Shinichi Esumi, Volker Koch, Jinfeng Liao, Mikhail Stephanov, and Nu Xu, “Mapping the Phases of Quantum Chromodynamics with Beam Energy Scan,” Phys. Rept. 853, 1–87 (2020), arXiv:1906.00936 [nucl-th] .
- Wang (2010) Fuqiang Wang, “Effects of Cluster Particle Correlations on Local Parity Violation Observables,” Phys. Rev. C 81, 064902 (2010), arXiv:0911.1482 [nucl-ex] .
- Pratt (2010) Scott Pratt, “Alternative Contributions to the Angular Correlations Observed at RHIC Associated with Parity Fluctuations,” (2010), arXiv:1002.1758 [nucl-th] .
- Bzdak et al. (2010) Adam Bzdak, Volker Koch, and Jinfeng Liao, “Remarks on possible local parity violation in heavy ion collisions,” Phys. Rev. C 81, 031901 (2010), arXiv:0912.5050 [nucl-th] .
- Bzdak et al. (2011) Adam Bzdak, Volker Koch, and Jinfeng Liao, “Azimuthal correlations from transverse momentum conservation and possible local parity violation,” Phys. Rev. C 83, 014905 (2011), arXiv:1008.4919 [nucl-th] .
- Bzdak et al. (2013) Adam Bzdak, Volker Koch, and Jinfeng Liao, “Charge-Dependent Correlations in Relativistic Heavy Ion Collisions and the Chiral Magnetic Effect,” Lect. Notes Phys. 871, 503–536 (2013), arXiv:1207.7327 [nucl-th] .
- Choudhury et al. (2022) Subikash Choudhury et al., “Investigation of experimental observables in search of the chiral magnetic effect in heavy-ion collisions in the STAR experiment *,” Chin. Phys. C 46, 014101 (2022), arXiv:2105.06044 [nucl-ex] .
- Christakoglou et al. (2021) Panos Christakoglou, Shi Qiu, and Joey Staa, “Systematic study of the chiral magnetic effect with the AVFD model at LHC energies,” Eur. Phys. J. C 81, 717 (2021), arXiv:2106.03537 [nucl-th] .
- Voloshin (2010) Sergei A. Voloshin, “Testing the Chiral Magnetic Effect with Central U+U collisions,” Phys. Rev. Lett. 105, 172301 (2010), arXiv:1006.1020 [nucl-th] .
- Koch et al. (2017) Volker Koch, Soeren Schlichting, Vladimir Skokov, Paul Sorensen, Jim Thomas, Sergei Voloshin, Gang Wang, and Ho-Ung Yee, “Status of the chiral magnetic effect and collisions of isobars,” Chin. Phys. C 41, 072001 (2017), arXiv:1608.00982 [nucl-th] .
- Adam et al. (2021) J. Adam et al. (STAR), “Methods for a blind analysis of isobar data collected by the STAR collaboration,” Nucl. Sci. Tech. 32, 48 (2021), arXiv:1911.00596 [nucl-ex] .
- Abdallah et al. (2022a) Mohamed Abdallah et al. (STAR), “Search for the chiral magnetic effect with isobar collisions at =200 GeV by the STAR Collaboration at the BNL Relativistic Heavy Ion Collider,” Phys. Rev. C 105, 014901 (2022a), arXiv:2109.00131 [nucl-ex] .
- Shi et al. (2020) Shuzhe Shi, Hui Zhang, Defu Hou, and Jinfeng Liao, “Signatures of Chiral Magnetic Effect in the Collisions of Isobars,” Phys. Rev. Lett. 125, 242301 (2020), arXiv:1910.14010 [nucl-th] .
- Shi et al. (2018) Shuzhe Shi, Yin Jiang, Elias Lilleskov, and Jinfeng Liao, “Anomalous Chiral Transport in Heavy Ion Collisions from Anomalous-Viscous Fluid Dynamics,” Annals Phys. 394, 50–72 (2018), arXiv:1711.02496 [nucl-th] .
- Jiang et al. (2018) Yin Jiang, Shuzhe Shi, Yi Yin, and Jinfeng Liao, “Quantifying the chiral magnetic effect from anomalous-viscous fluid dynamics,” Chin. Phys. C 42, 011001 (2018), arXiv:1611.04586 [nucl-th] .
- An et al. (2022) Xin An et al., “The BEST framework for the search for the QCD critical point and the chiral magnetic effect,” Nucl. Phys. A 1017, 122343 (2022), arXiv:2108.13867 [nucl-th] .
- Shen et al. (2016) Chun Shen, Zhi Qiu, Huichao Song, Jonah Bernhard, Steffen Bass, and Ulrich Heinz, “The iEBE-VISHNU code package for relativistic heavy-ion collisions,” Comput. Phys. Commun. 199, 61–85 (2016), arXiv:1409.8164 [nucl-th] .
- Bloczynski et al. (2013) John Bloczynski, Xu-Guang Huang, Xilin Zhang, and Jinfeng Liao, “Azimuthally fluctuating magnetic field and its impacts on observables in heavy-ion collisions,” Phys. Lett. B 718, 1529–1535 (2013), arXiv:1209.6594 [nucl-th] .
- Xu et al. (2018a) Hao-jie Xu, Jie Zhao, Xiaobao Wang, Hanlin Li, Zi-Wei Lin, Caiwan Shen, and Fuqiang Wang, “Varying the chiral magnetic effect relative to flow in a single nucleus-nucleus collision,” Chin. Phys. C 42, 084103 (2018a), arXiv:1710.07265 [nucl-th] .
- Voloshin (2018) Sergei A. Voloshin, “Estimate of the signal from the chiral magnetic effect in heavy-ion collisions from measurements relative to the participant and spectator flow planes,” Phys. Rev. C 98, 054911 (2018), arXiv:1805.05300 [nucl-ex] .
- Zhao et al. (2019) Jie Zhao, Hanlin Li, and Fuqiang Wang, “Isolating the chiral magnetic effect from backgrounds by pair invariant mass,” Eur. Phys. J. C 79, 168 (2019), arXiv:1705.05410 [nucl-ex] .
- Magdy et al. (2018) Niseem Magdy, Shuzhe Shi, Jinfeng Liao, N. Ajitanand, and Roy A. Lacey, “New correlator to detect and characterize the chiral magnetic effect,” Phys. Rev. C 97, 061901 (2018), arXiv:1710.01717 [physics.data-an] .
- Tang (2020) A. H. Tang, “Probe chiral magnetic effect with signed balance function,” Chin. Phys. C 44, 054101 (2020), arXiv:1903.04622 [nucl-ex] .
- Wen et al. (2018) Fufang Wen, Jacob Bryon, Liwen Wen, and Gang Wang, “Event-shape-engineering study of charge separation in heavy-ion collisions,” Chin. Phys. C 42, 014001 (2018), arXiv:1608.03205 [nucl-th] .
- Zhang and Jia (2022) Chunjian Zhang and Jiangyong Jia, “Evidence of Quadrupole and Octupole Deformations in Zr96+Zr96 and Ru96+Ru96 Collisions at Ultrarelativistic Energies,” Phys. Rev. Lett. 128, 022301 (2022), arXiv:2109.01631 [nucl-th] .
- Xu et al. (2021) Hao-jie Xu, Hanlin Li, Xiaobao Wang, Caiwan Shen, and Fuqiang Wang, “Determine the neutron skin type by relativistic isobaric collisions,” Phys. Lett. B 819, 136453 (2021), arXiv:2103.05595 [nucl-th] .
- Shi et al. (2019) Shuzhe Shi, Hui Zhang, Defu Hou, and Jinfeng Liao, “Chiral Magnetic Effect in Isobaric Collisions from Anomalous-Viscous Fluid Dynamics (AVFD),” Nucl. Phys. A 982, 539–542 (2019), arXiv:1807.05604 [hep-ph] .
- Xu et al. (2018b) Hao-Jie Xu, Xiaobao Wang, Hanlin Li, Jie Zhao, Zi-Wei Lin, Caiwan Shen, and Fuqiang Wang, “Importance of isobar density distributions on the chiral magnetic effect search,” Phys. Rev. Lett. 121, 022301 (2018b), arXiv:1710.03086 [nucl-th] .
- Hammelmann et al. (2020) Jan Hammelmann, Alba Soto-Ontoso, Massimiliano Alvioli, Hannah Elfner, and Mark Strikman, “Influence of the neutron-skin effect on nuclear isobar collisions at energies available at the BNL Relativistic Heavy Ion Collider,” Phys. Rev. C 101, 061901 (2020), arXiv:1908.10231 [nucl-th] .
- STAR Collaboration (2022) STAR Collaboration, “Search for the chiral magnetic effect with isobar collisions at =200 GeV by the STAR Collaboration at the BNL Relativistic Heavy Ion Collider,” HEPData (collection) (2022), https://doi.org/10.17182/hepdata.115993.
- Feng et al. (2022) Yicheng Feng, Jie Zhao, Hanlin Li, Hao-jie Xu, and Fuqiang Wang, “Two- and three-particle nonflow contributions to the chiral magnetic effect measurement by spectator and participant planes in relativistic heavy ion collisions,” Phys. Rev. C 105, 024913 (2022), arXiv:2106.15595 [nucl-ex] .
- Nijs and van der Schee (2021) Govert Nijs and Wilke van der Schee, “Inferring nuclear structure from heavy isobar collisions using Trajectum,” (2021), arXiv:2112.13771 [nucl-th] .
- (72) See Supplemental Material at https://journals.aps.org/prc/supplemental/10.1103/PhysRevC.106.L051903 for technical details on the simulations and analysis that have been used to obtain the results reported in the main manuscript.
- Milton et al. (2021) Ryan Milton, Gang Wang, Maria Sergeeva, Shuzhe Shi, Jinfeng Liao, and Huan Zhong Huang, “Utilization of event shape in search of the chiral magnetic effect in heavy-ion collisions,” Phys. Rev. C 104, 064906 (2021), arXiv:2110.01435 [nucl-th] .
- Lacey et al. (2022) Roy A. Lacey, Niseem Magdy, Petr Parfenov, and Arkadiy Taranenko, “Scaling properties of background- and chiral-magnetically-driven charge separation in heavy ion collisions at GeV,” (2022), arXiv:2203.10029 [nucl-ex] .
- Feng et al. (2021) Yicheng Feng, Yufu Lin, Jie Zhao, and Fuqiang Wang, “Revisit the chiral magnetic effect expectation in isobaric collisions at the relativistic heavy ion collider,” Phys. Lett. B 820, 136549 (2021), arXiv:2103.10378 [nucl-ex] .
- Abdallah et al. (2022b) Mohamed Abdallah et al. (STAR), “Search for the Chiral Magnetic Effect via Charge-Dependent Azimuthal Correlations Relative to Spectator and Participant Planes in Au+Au Collisions at = 200 GeV,” Phys. Rev. Lett. 128, 092301 (2022b), arXiv:2106.09243 [nucl-ex] .