In-situ measurements of whole-dish reflectivity for VERITAS
Abstract
The VERITAS array is a set of four imaging atmospheric Cherenkov telescopes (IACTs) sensitive to gamma rays at energies between 85 GeV and 30 TeV. Each telescope is based on a tessellated mirror, 12 metres in diameter, which reflects light from a gamma-ray-induced air shower to form an image on a pixellated ‘camera’ comprising 499 photomultiplier tubes. The image brightness is the primary measure of the gamma ray’s energy so a knowledge of the mirror reflectivity is important. We describe here a method, pioneered by members of the MAGIC collaboration, to measure the whole-dish reflectivity, quickly and regularly, so that effects of aging can be monitored. A CCD camera attached near the centre of the dish simultaneously acquires an image of both a target star and its reflection on a target of Spectralon, a highly-reflective material, placed at the focus of the telescope. The ratio of their brightnesses, as recorded by the CCD, along with geometric factors, provides an estimate of the dish reflectivity with few systematic errors. A filter wheel is placed in front of the CCD camera, allowing to measure the reflectivity as a function of wavelength. We present initial results obtained with the VERITAS telescopes during 2012.
1 Introduction
Very-high-energy (VHE) gamma-ray astronomy makes use of arrays of imaging atmospheric Cherenkov telescopes (IACTs). A telescope consists of a large tesseleted mirror that focusses Cherenkov light from extensive air showers onto a camera comprising an array of photomultiplier tubes (PMTs). The summed signals from the PMTs is proportional to the energy of the incident gamma ray so a key parameter needed to extract science from the data acquired using such telescopes is the effective reflectivity of the mirror, the “whole-dish” reflectivity. This number can be estimated using measurements on individual facets made with a portable, commercially available, device and corrections resulting from the shadowing effects of the camera and its support structure can be introduced. However it is desirable to have alternative ways of determining the mirror reflectivity if only to build confidence in one’s understanding of the instrument and as a way of estimating systematic errors.
In this report we describe our experience with a system developed to measure the whole-dish reflectivity of the VERITAS telescopes. The method we follow was first suggested by members of the MAGIC collaboration [1, 2]. The basic idea is to mount a digital camera on the telescope to record, in the same image, light coming directly from a bright star as well as the light from the star that has reflected off the main mirror and subsequently off a target of known reflectivity placed at the focus. Up to numerical factors, the whole-dish reflectivity is determined from the ratio of the two signals. The use of a single camera to simultaneously record both the direct and reflected images eliminates many possible systematic errors.
2 The VERITAS Reflectometer
VERITAS comprises an array of four IACTs located at the Whipple Observatory on Mount Hopkins in southern Arizona [3, 4]. Each of the telescopes is based on a 12-m diameter Davies-Cotton reflector focussing light onto a 499-pixel camera made from close-packed Hamamatsu R10560 PMTs coupled to light concentrators. The reflector is made up of 345 identical mirror facets; when they are perfectly aligned the on-axis point-spread-function is smaller than a pixel diameter.
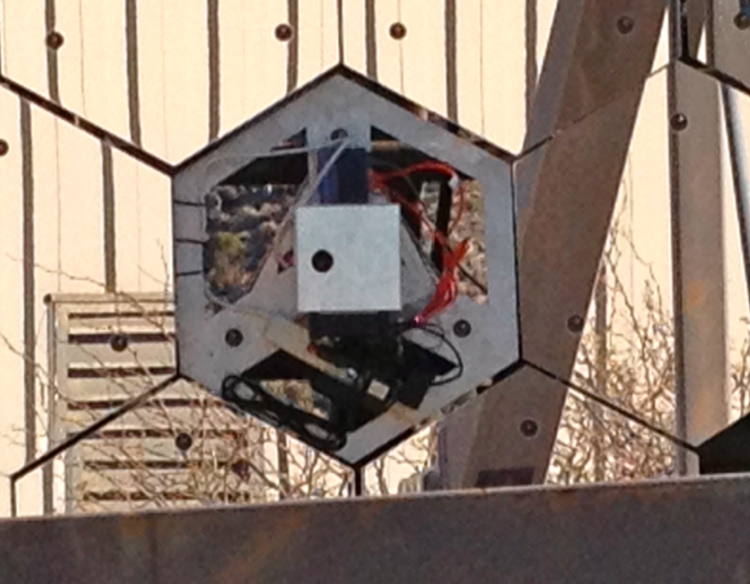
The digital camera used for this work is a Prosilica GC1380 CCD camera equipped with a 25 mm Pentax C-mount lens. The camera was chosen primarily for cost and convenience reasons; we use the same camera as that which forms part of a tool developed for precisely aligning the mirror facets [5]. In order to study possible wavelength-dependent effects we employ a filter wheel equipped with band-pass filters. The filters have transmission curves 10 nm wide (FWHM) and centred on 400, 420, 440 and 460 nm. The camera and filters are controlled by a local computer111http://beagleboard.org/ and are housed in an aluminum box mounted close to the centre of the VERITAS reflector in place of one of the mirror facets, as shown in Figure 1. Use of the standard facet-mounting hardware permits easy adjustment of the camera’s pointing direction.
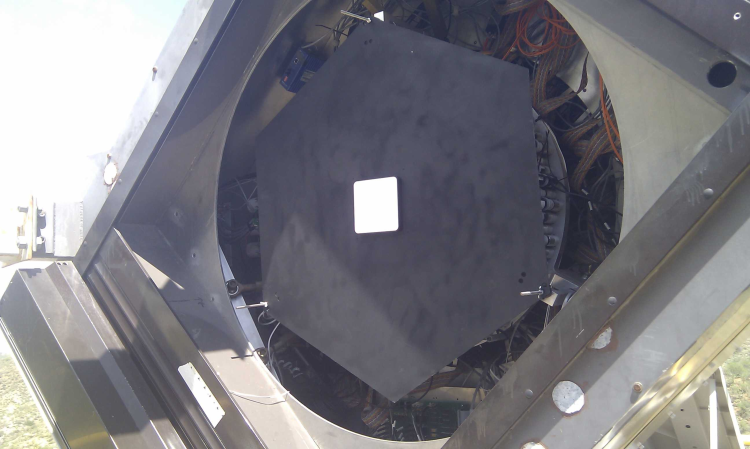
The secondary reflector onto which starlight is focussed is a square piece of Spectralon 222http://www.labsphere.com/, 12.5 cm on a side. It is a fluoropolymer with diffuse reflectance greater than 99% over the wavelength range of interest. The target is attached to an aluminum plate that can be temporarily mounted at the focal point of the telescope, as shown in Figure 2.
3 Data Acquisition and Analysis
Data for reflectivity studies are typically acquired over the course of several nights, one night per telescope, at intervals of several months. This schedule is sometimes modified by weather and observing priorities. For a given telescope, a star is tracked and images are recorded, first with no filters in place and then with the filters, sequentially. Exposure times are adjusted to avoid saturation, and multiple images are acquired to improve statistics. This sequence is repeated on a series of bright target stars at high elevation.
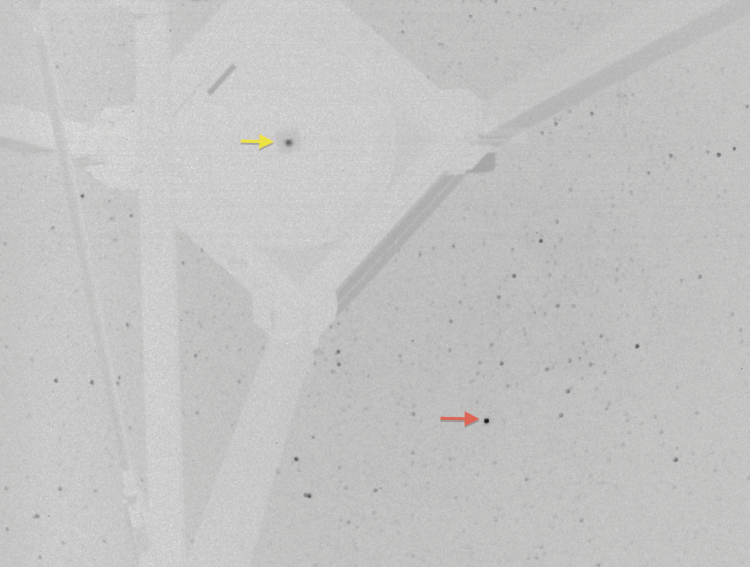
A typical image is shown in Figure 3 with a logarithmic intensity scale. One can see the Spectralon target and the broad glow of the reflected star image in the upper left quadrant. The bright spot due to the direct light from the target star is visible in the lower right quadrant.
The analysis proceeds by identifying the approximate locations of the star and the reflection in the image. The pixel values from a 100-by-100 square centred on each of these locations are saved in files for further processing. Files from multiple exposures are combined.
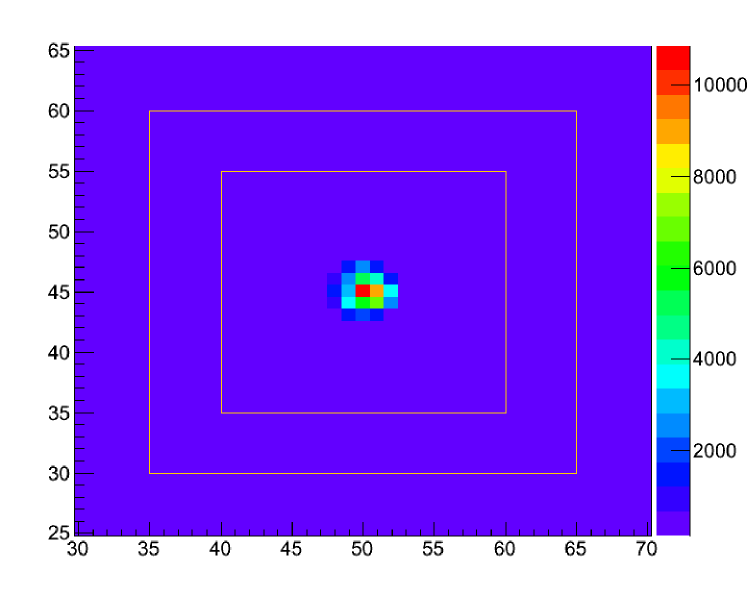
A two-dimensional histogram of a typical star file is shown in Figure 4, highlighting the good signal-to-noise ratio. The net signal is determined by summing the pixel values from the region between the concentric squares and subtracting it, appropriately scaled, from the sum of the pixels from the inner square. (The squares are overly large for this example but were defined such that they could be used for images where the star was defocussed to mitigate saturation effects. We maintain the same limits for purposes of minimizing systematic errors.) For the star image it is mainly the average pedestal that is being subtracted since there is very little background light in that part of the image.
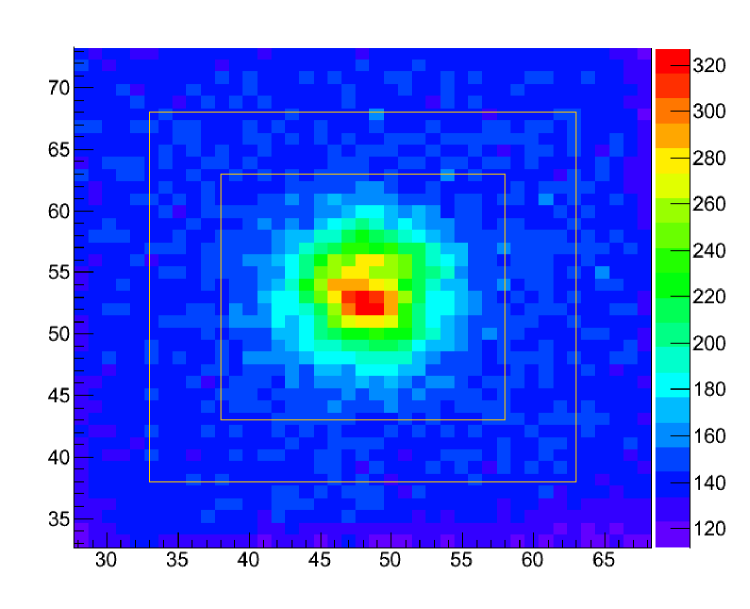
The corresponding plot for the reflection image is shown in Figure 5 where it is clear that background is an important consideration. Ambient light tends to brighten the Spectralon . To check that background subtraction is done effectively and correctly we plot, in Figure 6, the pixel values, row by row in sequence, from the inner square, together with a line indicating the computed background level. The squares used here are based on 5- and 7-sigma limits determined by fitting a Gaussian distribution to the reflection distribution.
The whole-dish reflectivity is calculated from the direct and reflected signals, and , respectively, using the formula where is the area of the dish and is the distance from the Spectralon to the CCD camera.

4 Corrections and Uncertainties
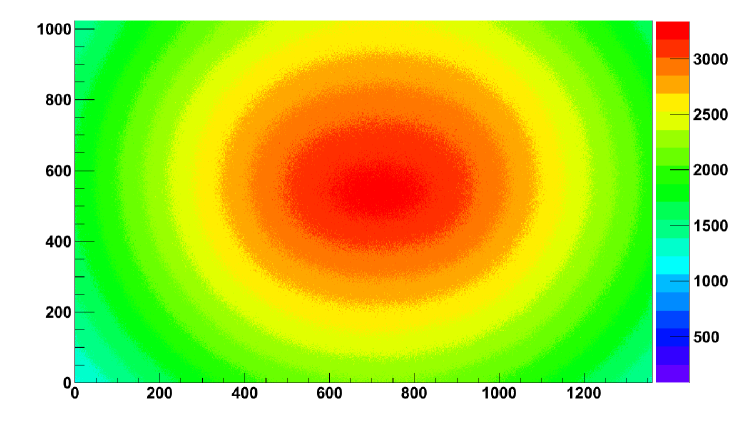
The optics of our camera are such that vignetting is significant and must be taken into account when computing the reflectivity. We can estimate the size of the effect using images taken for flatfielding purposes. These were acquired by pointing the camera to zenith at twilight and a sample is shown in Figure 7. The corrections can be determined by normalizing the pixel values to the maximum value and using the inverse of these numbers as pixel-by-pixel correction factors. In this work we use a single value for the star and a single value for the reflection since the variation is quite small over the regions of interest. The correction to the ratio of the reflection signal to the star signal is of order 10%.
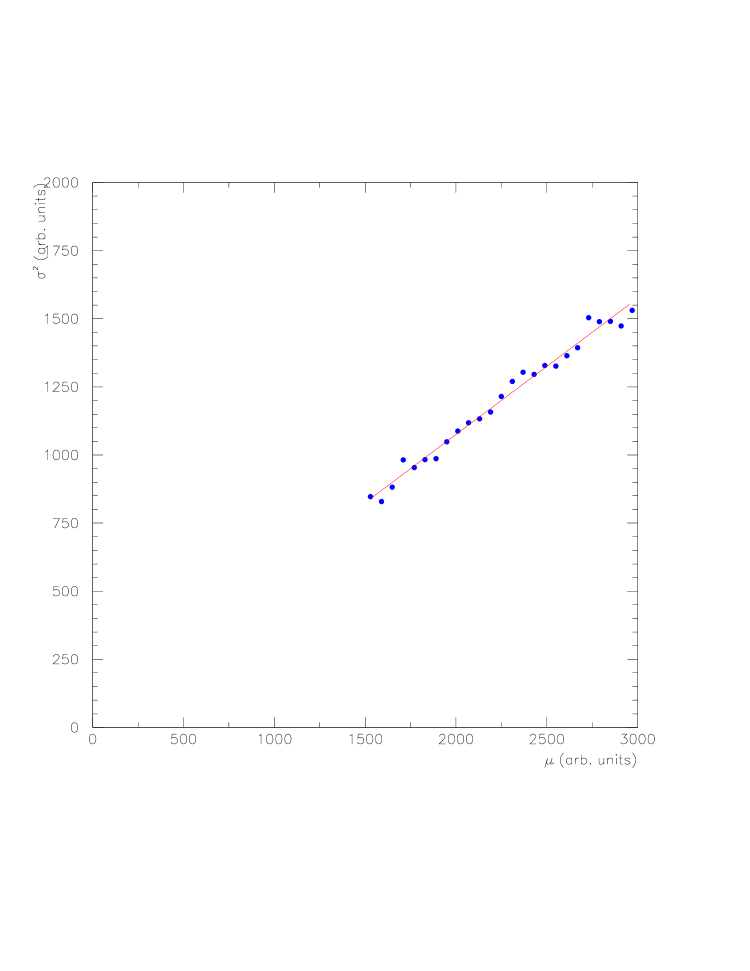
The data from Figure 7 are useful for determining statistical uncertainties. We assume that adjacent pixels should report approximately the same number in a flat-field image since the twilight sky is uniform and vignetting effects vary slowly. The largest contribution to any difference between adjacent values should be due to statistical fluctuations. Thus we can histogram the difference between pixel and pixel for all values of and use the width of the resulting distribution as an estimator of the statistical error. This is expected to vary with the magnitudes of the pixel values so we make separate histograms for diffent ranges of pixel values. The results are shown in Figure 8 where the variances are plotted as a function of pixel value. This dependence is used in assigning uncertainties to pixel values in the analysis.
5 Some Results
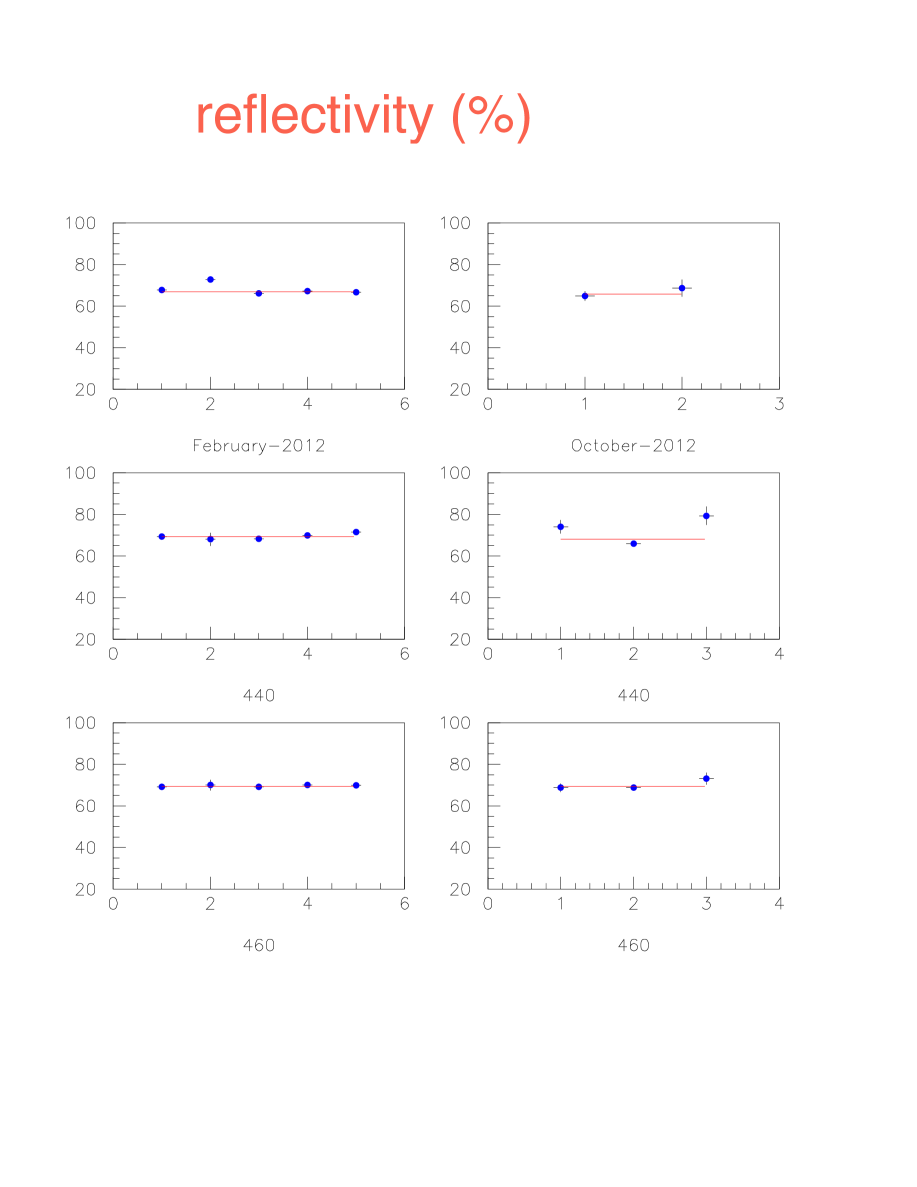
Some typical results, from one of the telescopes, are shown in Figure 9 where reflectivities in percent are plotted. Each point was calculated with images from a different star and the flat line is an average value, drawn to show that results are consistent within errors. There are two columns, one for data acquired in February, 2012 and the other for data acquired the following October. In each column the top panel shows reflectivities measured without a band-pass filter while the middle and bottom panels show measurements made with 440 nm and 460 nm filters, respectively. Images made with 400 nm and 420 nm filters had very poor signal to noise and are not shown. Measurements at these wavelengths will need longer integration times under darker skies.
Although the results shown are preliminary and we do not present precise numbers here, we note some interesting qualitative features. First, the technique produces numbers that are reproducible, independent of the star used, and stable over time. Second, the reflectivities measured without a filter are slightly lower than those measured with filters. This is presumably due to the fall-off with wavelength of reflectivity. By restricting observations to wavelengths near the maximum of reflectivity curve one obtains larger values.
The whole-dish reflectivity numbers are in the neighbourhood of 70%. Laboratory measurements on individual facets before installation were reported previously [6] and were in the range 90-95% for wavelengths between 250 and 400 nm, falling to 75-80% at wavelengths greater than 600 nm. These numbers are remeasured, and are found to be somewhat lower, when facets are periodically removed for resurfacing, after which they return to their original values. The lower values for in situ measurements can be explained by features such as shadowing of the mirror due to the PMT camera and support structure, tails in the point-spread function due to residual misalignment of some of the mirror facets, and various degrees of surface aging - on any dish a certain fraction of the facets will be due for resurfacing. Indeed, the differences between laboratory-facet and whole-dish reflectivities are expected and are hard to calculate precisely so it is good to have an end-to-end system like the one described here.
6 Conclusions
The whole-dish reflectivity procedure suggested by MAGIC has been implemented in the VERITAS array and initial results indicate that it is relatively simple to use and produces reliable results.
As we progress towards a solid understanding of our measurements we intend to build a separate system for each telescope and take data in parallel. Similarly, with a better understanding of statistical and systematic uncertainties, we expect to reduce acquistion times to the point where they do not interfere significantly with astronomical observations. It is important to have measurements on a monthly basis to be able to effectively track long-term changes. Measurements made immediately before and after mirror washings and facet replacements would also be of great interest.
Acknowledgments: We warmly thank our colleagues in the VERITAS collaboration for their support of this work and for assistance with data acquisition. VERITAS research is supported by grants from the U.S. Department of Energy Office of Science, the U.S. National Science Foundation and the Smithsonian Institution, by NSERC in Canada, by Science Foundation Ireland (SFI 10/RFP/AST2748) and by STFC in the U.K. We acknowledge the excellent work of the technical support staff at the Fred Lawrence Whipple Observatory and at the collaborating institutions in the construction and operation of the instrument.
References
- [1] R. Mirzoyan, M. Garczarczyk, J. Hose and D. Paneque, Astroparticle Physics 27 (2007) 509
- [2] H. Kellermann, Diploma thesis, MPI Munich 2011/03/11, http://magic.mppmu.mpg.de/publications/theses/HKellermann dipl.pdf
- [3] J. Holder et al., Astroparticle Physics 25 (2006), 391
- [4] T.C. Weekes et al., Astroparticle Physics 17 (2002), 221
- [5] A. McCann, D. Hanna, J. Kildea and M. McCutcheon, Astroparticle Physics 32 (2010) 325
- [6] E. Roache et al., Proc 30th International Cosmic Ray Conference, Merida (2007)