In-vehicle alertness monitoring for older adults
Abstract.
Alertness monitoring in the context of driving improves safety and saves lives. Computer vision based alertness monitoring is an active area of research. However, the algorithms and datasets that exist for alertness monitoring are primarily aimed at younger adults (18-50 years old). We present a system for in-vehicle alertness monitoring for older adults. Through a design study, we ascertained the variables and parameters that are suitable for older adults traveling independently in Level 5 vehicles. We implemented a prototype traveler monitoring system and evaluated the alertness detection algorithm on ten older adults (70 years and older). We report on the system design and implementation at a level of detail that is suitable for the beginning researcher or practitioner. Our study suggests that dataset development is the foremost challenge for developing alertness monitoring systems targeted at older adults. This study is the first of its kind for a hitherto under-studied population and has implications for future work on algorithm development and system design through participatory methods.
1. Introduction
The ability to travel independently within a city is a major factor in quality of life for older adults. Older adults, especially those with age-related cognitive disabilities, may stop driving due to deficits in reaction time, memory, and attention. Connected and automated vehicles (CAVs) prolong mobility and safety for this population. CAVs are those vehicles where at least some aspect of a safety-critical control function (e.g., steering, throttle, or braking) occurs without direct driver input (Administration et al., 2013). CAVs may be autonomous (i.e., use only vehicle sensors) or may be connected (i.e., use communications systems such as connected vehicle technology, in which cars and roadside infrastructure communicate wirelessly). Motivated by technological innovations in this direction, The United States Department of Transportation recently announced an inclusive design challenge. This challenge invited proposals for highly automated vehicle designs that centered persons with disabilities.
In 2020, there were an estimated 38 million people aged 70 and older living in the United States, representing about 11 percent of the population (Federal Highway Administration, 2022). Based on data reported by states to the Federal Highway Administration, there were approximately 31 million licensed drivers 70 and older in 2020 (Federal Highway Administration, 2022). According to the U.S. Census Bureau, the population 70 and older is projected to increase to 53 million by 2030 (US Census Bureau, 2017).
Cognitive impairment is a common problem for older adults (Rashid et al., 2012; Reitz and Mayeux, 2010). Cognitive decline associated with age (Tricco et al., 2012; Rashid et al., 2012; Ataollahi Eshkoor et al., 2014), has an occurrence rate of approximately 21.5–71.3 per 1,000 person-years in seniors (Tricco et al., 2012). Mild cognitive impairment (MCI) rates range from 3% to as high as 42% in population studies (Tricco et al., 2012), and from 6% to 85% in clinical settings (Pinto and Subramanyam, 2009; Petersen et al., 1999). The MCI conversion rate to dementia is about 10% per year (DeCarli, 2003; Pinto and Subramanyam, 2009; RC et al., 2001; Rashid et al., 2012; Bruscoli and Lovestone, 2004; Petersen, 2004; Panza et al., 2005), which is increased to 80%–90% after approximately 6 years (Busse et al., 2006). It is estimated that a new case of dementia is added each 7 seconds (Rashid et al., 2012). The prevalence of dementia in the elderly population is between 1% to 2% per year (Odawara, 2012; Smith et al., 1996). It is forecast that the number of cases in the developing world will increase by 100% between 2001 and 2040 (Rashid et al., 2012). It seems that the rate of dementia will increase from 9.4% in 2000 to 23.5% by 2050 in the population over 60 years of age (Nizamuddin, 2000).
These statistics motivate the ultimate goal of our project: to design and characterize methods for in-vehicle alertness monitoring for older adults with mild cognitive impairment (MCI). As this population experiences reduced alertness and memory, difficulty in information processing, memory loss, disorientation, and difficulty in decision-making, it is important to monitor their alertness level to ensure their safety and improve their mobility experience (Parikh et al., 2016; Gold, 2012). This paper reports on our design process and algorithmic implementations for an in-vehicle alertness monitoring system for older adults.
Driving automation technologies have been classified in a six-level system by SAE International (SAE International, 2021). Our focus is on personal vehicles that will exhibit SAE Level 5 automation (SAE International, 2021). The level 5 vehicles perform the dynamic driving task independently of the driver, under all conditions and in different scenarios. Fully autonomous cars are undergoing testing in several pockets of the world, but none are yet available to the general public (Novakazi, 2020). Designing for independent traveling in an SAE Level 5 vehicle creates a scenario where attentiveness monitoring is distinct from driver inattention, as the traveler is not expected to attend to the driving tasks or even to take over. The in-vehicle monitoring system that we designed can be extended to incorporate eye movements, situational awareness, etc., for vehicles that have lower levels of automation.
Our contributions are as follows:
-
(1)
We develop an alertness monitoring system for a previously under-studied population. We evaluate the performance of our system and algorithm on the older adults.
-
(2)
Our algorithm is based on four features drawn from prior literature: eye aspect ratio (EAR); mouth aspect ratio (MAR); MAR/EAR (MOE); pupil circularity. We are the first to report on the performance of these features on a large publicly available dataset (UTA Real-Life Drowsiness Dataset (UTA-RLDD) (Ghoddoosian et al., 2019).
-
(3)
We present the design decisions behind a practical implementation of such a system in a prototype Level 5 vehicle. These design decisions range from screen and camera placement (hardware), to feedback about where the head is placed (user experience), to algorithmic implementation. We target our system design report to the beginning researcher or practitioner.
2. Related Work
Our work builds on prior research that has used facial landmark features to classify a person’s alertness level. Our review background literature considered alertness, attentiveness, drowsiness and sleepiness to be part of the same goal, namely, improving safety, and thus we consider these terms interchangeable.
2.1. Features used to detect alertness levels
Multiple approaches were used in order to detect drivers’ attentiveness using sensorial, physiological, behavioral, visual, and environmental modalities. Early methods considered the steering motion of vehicles as an indicator of drowsiness (Sahayadhas et al., 2012). More recent approaches used face monitoring and tracking to detect the alertness levels of drivers. These methods relied on extracting facial features related to yawning and eye closure (Park et al., 2016; Reddy et al., 2017; Smith et al., 2000). Additionally, approaches that measured physiological signals such as brain waves and heart rates were introduced in order to correlate them to states of drowsiness (Kokonozi et al., 2008).
Several studies have been conducted on the state of the driver’s eye based on a video surveillance system to detect the eyes and calculate their frequency of blinking to check the driver’s fatigue level (Massoz et al., 2018; Mandal et al., 2016; Al-Rahayfeh and Faezipour, 2013; Kurylyak et al., 2012). Some studies have used a cascade of classifiers to detect the ocular area’s rapid detection (Kurylyak et al., 2012). A Haar-like descriptor and an AdaBoost classification algorithm have been widely used for face and eye-tracking by using Percent Eye closure (PERCLOS) to evaluate driver tiredness (Lienhart and Maydt, 2002; Freund et al., 1996). PERCLOS evaluates the proportion of the total time that a drivers’ eyelids are 80% closed and reflects a slow closing of the eyelids rather than a standard blink (Wierwille et al., 1994).
Wahlstrom et al. developed a gaze detection system to determine the activity of drivers in real-time in order to send a warning in states of drowsiness (Wahlstrom et al., 2003). Gundgurti et al. extracted geometric features of the mouth in addition to features related to head movements to detect drowsiness effectively. However their method suffered in situations involving poor illumination and variations in the skin color (Gundgurti et al., 2013). Sigari et al. developed an efficient adaptive fuzzy system that derived features from the eyes and the face regions such as eye closure rates and head orientation to estimate the drivers’ fatigue level using video sequences captured in laboratory and real conditions (Sigari et al., 2013). Rahman et al. proposed a progressive haptic alerting system which detected the eyes state using Local Binary Pattern and warned the drivers using a vibration-like alert (Rahman et al., 2011). Jo et al. introduced a system to separate between drowsiness and distraction using the driver’s face direction (Jo et al., 2011). The system utilized template matching and appearance-based features to detect and validate the location of the eyes using a dataset collected from 22 subjects (Jo et al., 2011). Taken together, these approaches faced challenges in practical adoption due to errors resulting from signal disambiguation, loss of facial tracking arising from sudden movements, and the invasiveness of signal extraction using contact-based sensors.
The detection of facial features (also called landmarks) is an essential part of many face monitoring systems. Eyes, as one of the most salient facial features reflecting individuals’ affective states and focus of attention (Song et al., 2014), have become one of the most remarkable information sources in the face. Eye tracking serves as the first step in order to get glance behaviour, which is of most interest because it is a good indicator of the direction of the driver’s attention (Devi and Bajaj, 2008). Glance behaviour can be used to detect both visual and cognitive distraction (Fernández et al., 2016). It has also been used by many studies as an indicator of distraction while driving and has been evaluated in numerous ways (Fernández et al., 2016). Therefore, both eye detection and tracking form the basis for further analysis to get glance behaviour, which can be used for both cognitive and visual distraction.
2.2. Face and Facial Landmarks Detection
A typical face processing scheme in alertness monitoring systems involves the following steps:
-
•
Face detection and head tracking: In many cases a face detection algorithm is used as a face tracking one. In other cases, a face detection algorithm is used as an input for a more robust face tracking algorithm. When the tracking is lost, a face detection call is usually involved.
-
•
Localization of facial features (e.g., eyes). Facial landmarks localization is usually performed, but it should be noted that, in some cases, no specific landmarks are localized. So, in such cases, estimation of specific cues are extracted based on anthropometric measures from both face and head.
In general, “detection” processes are machine-learning based classifications that classify between object or non-object images. For example, whether a picture has a face on it or not, and where the face is if it does. To classify, we need a classifier.
Our implementation is based on the Viola-Jones algorithm, which has made object detection practically feasible in real-world applications (Vikram and Padmavathi, 2017). The Viola-Jones algorithm contains three main ideas that make it possible to build and run in real-time: the integral image, classifier learning with AdaBoost, and the attentional cascade structure (Heydarzadeh and Haghighat, 2011). This framework is used to create state-of-the-art detectors (e.g., face detectors (Fan et al., 2012)), such as in the Opencv library. However, cascade detectors work well on frontal faces but sometimes, they fail to detect profile or partially occluded faces. Thus, we used the Histogram of Oriented Gradients (HOG), which is a feature descriptor used in computer vision and image processing for the purpose of object detection. This approach can be trained with fewer images and faster (Surasak et al., 2018).
2.3. Classification methods used to detect attentiveness levels
The majority of methods for alertness detection in the last decade have utilized deep networks in one form or another. For extracting the intermediate representation, algorithms consist of proprietary software (Wang and Xu, 2016; Liang et al., 2019; François et al., 2016), or a pre-trained CNN (Shih and Hsu, 2016) such as the VGG-16 (Simonyan and Zisserman, 2014). For characterizing alertness, models consist of logistic regression (Liang et al., 2019), artificial neural network (ANN) (Wang and Xu, 2016), support vector machine (SVM) (Cristianini et al., 2000), hidden Markov model (HMM) (Weng et al., 2016), Multi-Timescale by CNN (Massoz et al., 2018), long-short term memory (LSTM) network smoothed by a temporal CNN (Shih and Hsu, 2016), or end-to-end 3D-CNN (Huynh et al., 2016) are conducted.
3. Method
We start with design considerations for an older adult alertness monitoring system, present our approach to determine key parameters, and finally describe the feature extraction and classification algorithms.
3.1. Design variables
For the purpose of our use case, the Level 5 CAV was assumed to be personally owned, which meant that we expected that parameters could be personalized to one traveler. The vehicle was expected to be a mid-sized sedan or larger, such as an SUV or minivan. Because the design study is for SAE level 5 vehicles, we expected that travelers will sit in the vehicle in the same way as we sit in the front passenger seat in manually-driven vehicles of today. Therefore, no steering wheels or other vehicle control devices would be in front of the traveler. Instead, the main features of the vehicle cab would be a dashboard, with an interactive display that presents trip relevant information to the traveler. Sensors to monitor the traveler would be integrated into the dashboard or the seat, and finally feedback from the driver monitoring system would be shown on a display located on the dashboard.
In the list below, we discuss design variables specific to traveler alertness monitoring.
-
(1)
Sensor
-
(a)
Type: Alertness is a user state that can be operationalized in several ways, for example, as alertness versus sleepiness, or as situational attentiveness, or as focusing (foveating) on a key region of interest. For each of these definitions, there is a range of sensor types to achieve the goal. In this study, we chose visible light cameras as our primary traveler monitoring sensor for attentivenessWe selected a standard webcam (Logitech C270 HD Webcam) as it is a low-cost sensor which can additionally be used for head pose detection and facial landmark tracking.
-
(b)
Placement: The placement of the sensor within the vehicle must be done in such a way that it provides a natural advantage for recording, while at the same time minimally occluding the traveler’s experience. We experimented with three configurations of camera placement and three distances from the traveler.
-
(a)
-
(2)
Traveler
-
(a)
Expectations from the traveler: This design variable refers to the extent to which the designer and developer can expect the user to cooperate with requests to align themselves to a tracking box, or submit to a calibration procedure, or sit still while a baseline is being established, or respond to audiovisual alerts, etc.
-
(b)
Characteristics of the user: Older people have different physical characteristics compared to younger people, which can impact the outcome of a traveler monitoring system. For example, older adults will have wrinkles around the eye and are more likely to be wearing glasses. Other characteristics include the distribution of activities older adults perform, which can change the distribution of head and body poses the traveler monitoring system will receive compared to young users. Furthermore, there is some evidence that older adults with MCI may have different eye movements than healthy individuals (Nie et al., 2020; Wilcockson et al., 2019; Molitor et al., 2015). There are also likely to be changes in the distribution of activities, attentional focus, and lucidity for older adults with MCI.
-
(a)
-
(3)
Data
-
(a)
Raw data: This variable refers to the data that is recorded from the traveler. In our study, raw data consists of RGB video recorded at 24fps. No audio is required for alertness detection.
-
(b)
Features: This variable refers to how the raw data is processed, the time scale over which data is smoothed or otherwise preprocessed to reduce noise, and the extent to which features of interest are passed up the software stack. For example, video data may be processed to extract facial landmark points, which are sent to one computational sub-routine, and to extract the subset of pixels that comprise the eye region and mouth area, which are sent to a different computational sub-routine. Raw data may be secured on the vehicle while only specific features are permitted to be passed upstream to protect user privacy.
-
(a)
-
(4)
Context: In addition to the features extracted from the primary sensor, other data may be used in the decision making process. For example, for alertness monitoring, the predictions from the video channel could be checked against a physiological sensor to rule out false alarms as a result of lighting and shadow.
-
(5)
Intelligence: Data recorded by one or more sensors needs to be fused for reliable predictions. In addition, this variable refers to the extent to which the underlying algorithm incorporates computational mechanisms to adapt to the primary traveler (see note on personally owned vehicle) or adopts a best fit (one-size-fits-all) approach.
-
(6)
Feedback: This design variable considers the extent to which the system is permitted to ask the traveler to reorient themselves for facial tracking, as well as the types of cues that the system will provide to the traveler, for example, visual and audio prompts to assess if the traveler simply dozed off or needs medical assistance can be provided by the vehicle.
-
(7)
Privacy: Because the traveler alertness monitoring system will record highly personal data, there is a trade-off between local processing versus cloud-based processing in terms of user privacy and algorithmic improvements which leverage the cloud-based computational back end. For example, a system where all facial landmark features are processed locally, and no face videos are stored, would address privacy concerns related with out of context use of the facial video stream.
-
(8)
Security: Because the goal of an alertness monitoring system is to escalate the alerts if the traveler does not respond to a nudge, the design and implementation could create a novel attack space from the cybersecurity perspective. For example, a malicious adversary might gain access to the the alert code to get the vehicle to repeatedly call the caregiver, or perform a man-in-the-middle attack on the camera feed causing the vehicle suddenly come to a stop because it thinks the traveler needs medical attention.
3.2. Design of the alertness monitoring system
The purpose of the proposed system is to gather implicit cues from the older adult traveler to assess their degree of alertness, which allows the automated vehicle to monitor the passenger’s state and act accordingly. Several aspects of the traveler can be monitored and tracked such as: expressions, body positions, eye-tracking monitoring, physiological signals, etc. In our prototype, we have focused on alertness as our target population is susceptible to motion-induced sleepiness and distraction (Ren et al., 2019; Lin et al., 2016). Discussions with the physicians on the team, the advisory board members, and driver rehabilitation specialists revealed that taking a nap may be considered entirely reasonable while on a long trip. However, it would be concerning for a short (¡20 minutes) trip if the older adult with MCI traveling alone displayed signs of low alertness.
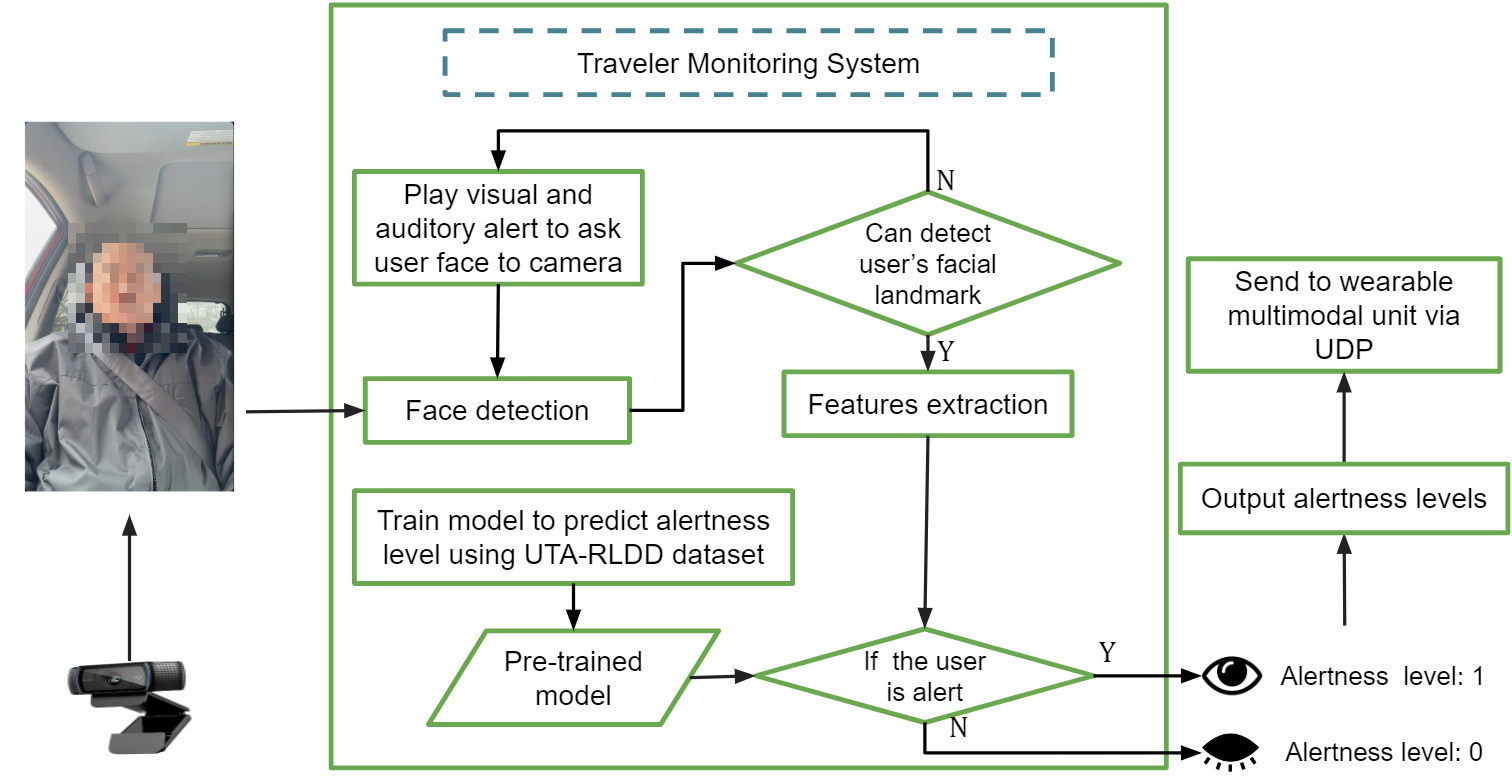
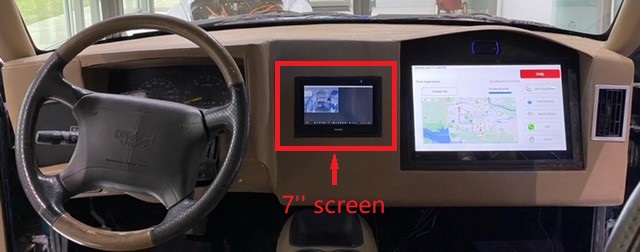
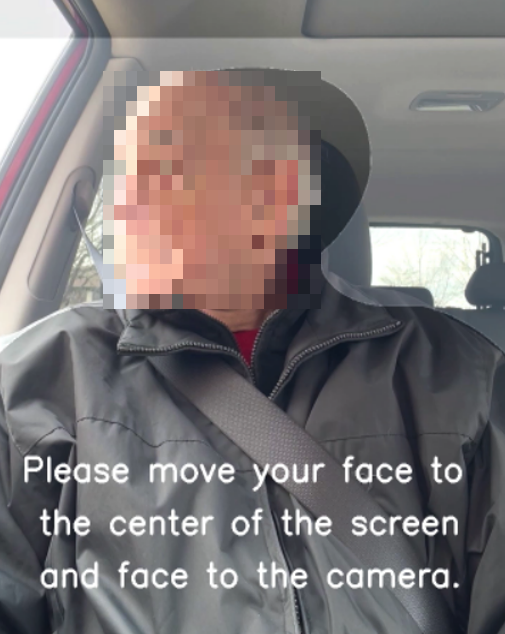
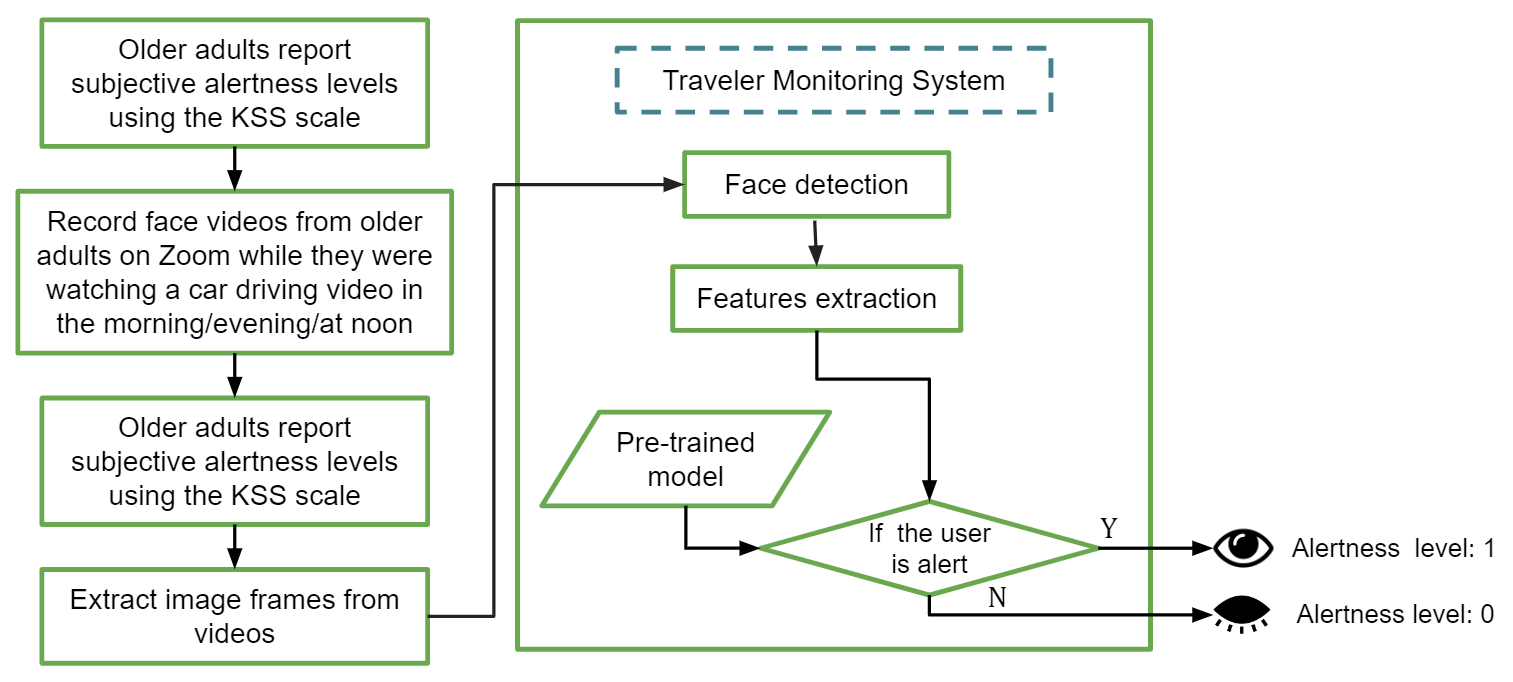
Figure 1 shows the system diagram. The prototype system uses computer vision libraries to monitor features associated with low alertness, such as eye aspect ratio, mouth aspect ratio, and pupil circularity, by using a remote camera embedded within the vehicle’s dashboard. These features are combined to predict an overall level of alertness of the traveler in real time. Each frame of the camera feed goes through the following processing steps: contrast enhancement, face detection, feature extraction, and alertness level prediction. Figure 2 illustrates the dashboard of the prototype vehicle. There is a small 7” screen placed adjacent to a larger in-vehicle information system. The system plays a beep sound through a sound bar in the dashboard when it cannot detect the traveler’s face, to remind them to reposition back to the center of the screen. In addition to the auditory cue, the system provides visual cues as shown in Figure 3.
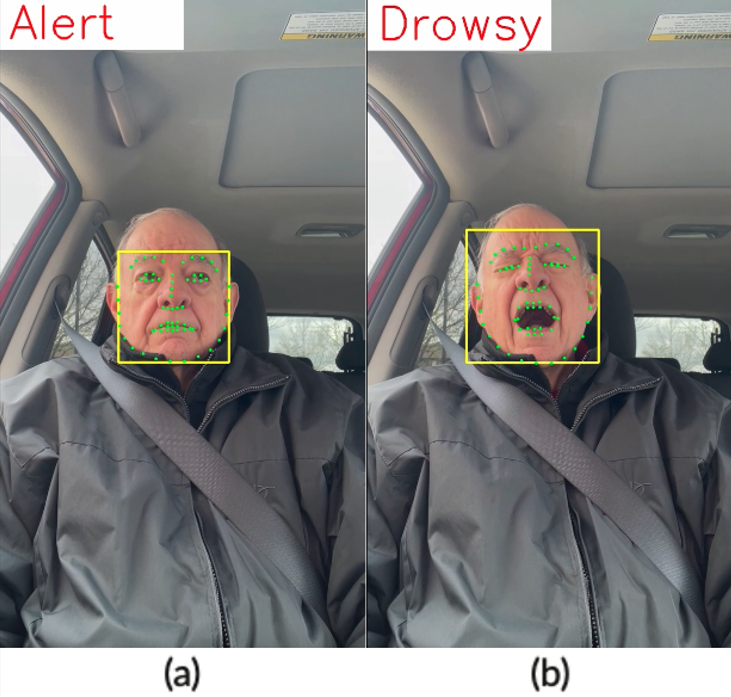
To account for individual differences in facial structure and the facial cues that indicate low alertness, the traveler monitoring system starts with a calibration step for each new traveler. During calibration, the traveler is asked to keep their face steady and centered on the screen in front of them for around 30 seconds. The algorithm assumes that these data contain exemplars of a high alertness state for this traveler. When the features deviate from this exemplar, the algorithm detects a loss in alertness level. The features are calculated at a frame-by-frame level. We average the features in ten consecutive frames. When the average features deviate from the exemplar capture in the calibration stage, the algorithm detects a loss in alertness. Examples of the detection result between alert and drowsy states are presented in Figure 4.
3.3. Camera and screen placement
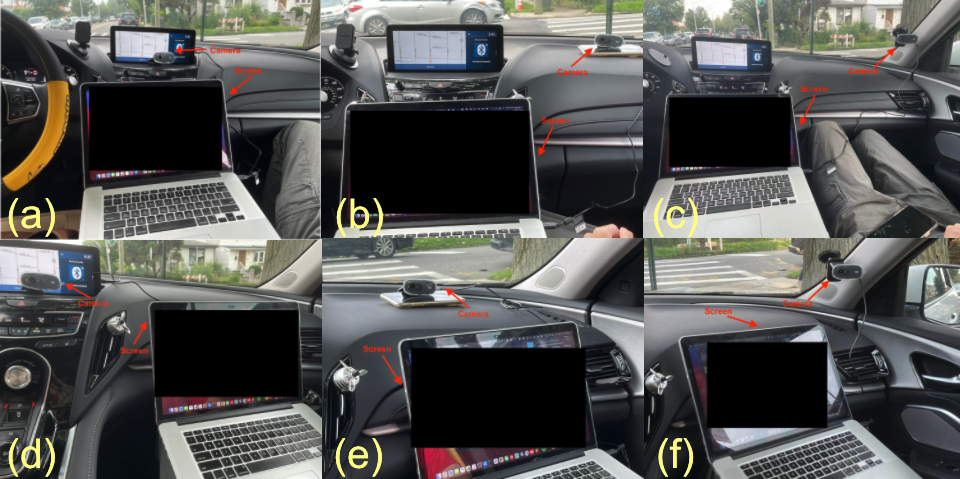
Detection accuracy is highly dependent on the quality of input to the feature detection algorithm. We tested different locations of the camera in a car aiming to capture the traveler’s front face. A front face will enable us to extract features we need to predict the traveler’s alertness level. Other than the camera, we also need to consider the location of visual displays in the dashboard, as the traveler will likely be looking at those displays.
To determine an optimal location of the camera for our system, we tested three different locations (In the middle of the dashboard - Figure 5.(a) and Figure 5.(d); In front of the traveler - Figure 5.(b) and Figure 5.(e); On the right side of the front windshield - Figure 5.(c) and Figure 5.(f)). We tested two locations for the screen (In the middle of the dashboard - Figure 5.(a), Figure 5.(b) and Figure 5.(c); In front of the traveler - Figure 5.(d), Figure 5.(e) and Figure 5.(f)). Table 1 shows the face detection rate in different camera and screen placement locations. Based on the percentage of successful face detections, the optimal location for both camera and screen is determined to be in front of the traveler.
To identify the optimal distance between users’ eyes and the camera for our system, we tested four distances (44.3 inches, 39.2 inches, 30.5 inches, 28.2 inches). We recorded videos at these four distances and analyzed the facial landmark detection rate for each video. We recorded two videos for each distance while the user was wearing or not wearing glasses. We converted the video to image frames. We extracted five frames per second. For all the videos, we followed the following procedure to mimic a traveler’s behaviors.
-
•
0-10s: preparation (we removed this part before analyzing the face detection rate)
-
•
10-40s: looking ahead
-
•
40-70s: looking at the main display (the laptop)
-
•
70-100s: using a phone
-
•
100-130s: looking at the front left passenger seat
-
•
130-160s: looking ahead
-
•
160-190s: looking at the main display
-
•
190-220s: using a phone
-
•
220-250s: looking at the front left passenger seat
Table 2 shows the face detection rate for all image frames of each video under different distances:
The result showed that the face detection rate increased when the camera was moved closer to the participant when they were not wearing glasses. When wearing glasses, the face detection rate generally increased as the camera was moved closer, but the accuracy dropped off at the closest distance (28.2 inches) suggesting that glasses may be interfering with face detection at this close range. Among the four tested distances, 30.5 inches appears to be the most optimal. Under this distance, we could detect facial landmarks for almost all frames (99.86%) for both wearing and not wearing glasses conditions. Cameras placed at closer distances may be impacted by glasses and it the cameras may also be more obvious to users leading to annoyance.
| Face detection rate % | Camera location | ||||||||
|---|---|---|---|---|---|---|---|---|---|
|
|
|
|||||||
| Main display location - below the camera |
|
91.34% | 99.11% | 71.36% | |||||
|
79.01% | 96.08% | 85.64% | ||||||
| Inches (distance between eye and camera) | Glasses (face detection rate) | No glasses (face detection rate) |
| 44.3 | 88.07% | 99.61% |
| 39.2 | 97.71% | 99.65% |
| 30.5 | 99.86% | 99.86% |
| 28.2 | 94.46% | 100% |
3.4. Feature Extraction
We used dlib’s pre-trained facial landmark to detect a face area and extract features. We selected four features from the previous literature to train our classification model (Sathasivam et al., 2020; Singh et al., 2018). We also tested the performance of classifiers trained using different combinations of these features.
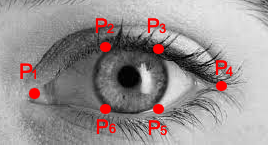
3.4.1. Eye Aspect Ratio (EAR)
EAR is the ratio of the length of the eyes to the width of the eyes. The length of the eyes is calculated by averaging over two distinct vertical lines across the eyes, as illustrated in the Figure 6 and Equation 1. Based on literature (Sathasivam et al., 2020), if an individual becomes drowsy, their average eye aspect ratio over successive frames starts to decline since their eyes started to be more closed or they were blinking faster.
| (1) |
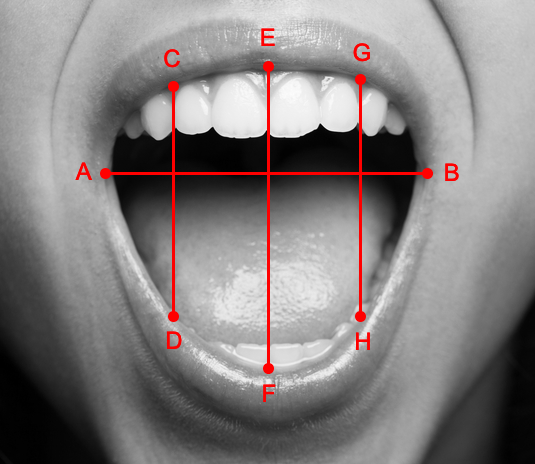
3.4.2. Mouth Aspect Ratio (MAR)
Computationally similar to the EAR, the MAR measures the ratio of the length of the mouth to the width of the mouth, as illustrated in the Figure 7 and Equation 2 Researchers have previously pointed out that as an individual becomes drowsy, they are likely to yawn and lose control over their mouth, making their MAR to be higher than usual in this state (Singh et al., 2018).
| (2) |
3.4.3. Pupil Circularity (PUC)
PUC is a measure complementary to EAR, but it places a greater emphasis on the pupil instead of the entire eye, as illustrated in Equations 3, 4, and 5. For example, someone who has their eyes half-open or almost closed will have a much lower pupil circularity value versus someone who has their eyes fully open due to the squared term in the denominator.
| (3) |
| (4) |
| (5) | |||
3.4.4. Mouth Aspect Ratio Over Eye Aspect Ratio (MOE)
MOE is the ratio of the MAR to the EAR. The benefit of using this feature is that EAR and MAR are expected to move in opposite directions if the state of the individual changes. As opposed to both EAR and MAR, MOE as a measure will be more responsive to these changes as it will capture the subtle changes in both EAR and MAR and will exaggerate the changes as the denominator and numerator move in opposite directions. As an individual gets drowsy, the MOE will increase.
3.4.5. Feature Normalization
We did feature normalization because each subject has different core features in their default alert state. That is, person A may naturally have smaller eyes than person B. If a model is trained on person B while tested on person A, the classifier will always predict the state as drowsy because it will detect a fall in EAR and PUC and a rise in MOE even though person A was alert.
To normalize the features of each training subject, we took the first 30 frames for each training subject’s alert video and used them as the baseline. The mean and standard deviation of each feature for these 30 frames were calculated and used to normalize each feature individually for each test subject. Mathematically, this is what the normalization equation looked like:
| (6) |
where: is the feature, is the subject, mean and standard deviation are taken from the first 30 frames of the alert state video.
3.5. Classification Algorithm
3.5.1. K Nearest Neighbors
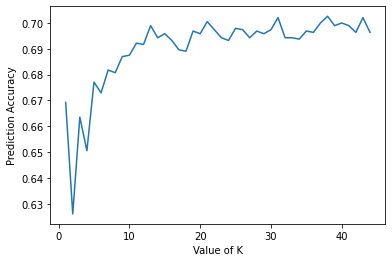
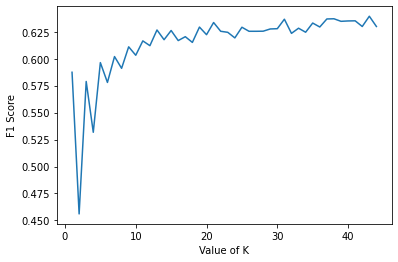
Motivated by the article (Wang et al., 2019; Zhong, 2019), the KNN classifier obtained useful results. K-nearest neighbors with the kd-trees search algorithm were used for the classification task. We extracted features described in section 3.4 from videos in the UTA-RLDD data set. We used 80% of the data as the training data set and 20% of the data as the test data set. Based on the features and the corresponding label (alert or drowsy) in the training data set, we trained the K neighbors classifier to fit the model. We took 45 runs for K from 1 to 45 to find the best K value to predict the alertness level of the features in the test data set. Figure 8 shows the prediction accuracy of the K neighbors classifier on the test data set with the different K values from 1 to 45. Figure 9 shows the F1 score of the K neighbors classifier on the test data set with the different K values from 1 to 10. We chose the K value as 38 to achieve the highest alertness levels prediction accuracy (¿70%) on the test data set.
4. Results
4.1. Dataset and Preprocessing
For our training and test data, we used the Real-Life Drowsiness Dataset (UTA-RLDD) (Ghoddoosian et al., 2019) created specifically for detecting multi-stage drowsiness. The dataset consists of around 30 hours of videos of 60 unique participants. There were 51 men and 9 women, from different ethnicities (10 Caucasian, 5 non-white Hispanic, 30 Indo-Aryan and Dravidian, 8 Middle Eastern, and 7 East Asian) and ages (from 20 to 59 years old with a mean of 25 and standard deviation of 6). The subjects wore glasses in 21 of the 180 videos and had considerable facial hair in 72 out of the 180 videos. Videos were taken from roughly different angles in different real-life environments and backgrounds. Participants were instructed to take three videos of themselves by their phone/web camera (of any model or type) in three different drowsiness states, based on the Karolinska Sleep Scale (Shahid et al., 2011), for around 10 minutes each. All videos were recorded at such an angle that both eyes were visible, and the camera was placed within one arm length away from the subject. These instructions were used to make the videos similar to videos that would be obtained in a car, by phone placed in a phone holder on the dash of the car while driving. The proposed setup was to lay the phone against the display of their laptop while they were watching or reading something on their computer.
For each video, we used OpenCV to extract 1 frame per second starting at the 40 seconds mark until the end of the video. The end goal is to detect not only extreme and visible cases of drowsiness but allow our system to detect softer signals of drowsiness as well.
4.2. Results on the UTA-RLDD dataset
In this section, we reported the accuracy, F1-score, precision, and recall of the models we trained using the K-nearest neighbors algorithm to predict the drowsy state when using different sets of features. Table 3 shows the detailed information.
We extracted 13235 frames from the UTA-RLDD dataset. We used 9264 frames as the training data and the remaining 3971 frames as test data. Among the 9264 frames in the training dataset, 51% were extracted from the alert state videos, and 49% were extracted from the drowsy state videos. Among the 3971 frames in the test dataset, 45.5% were extracted from the alert state videos, and 54.5% were extracted from the drowsy state videos.
| Features | Accuracy | Precision | Recall | F1 Score |
| EAR | 79.53% | 0.74 | 0.87 | 0.80 |
| MAR | 49.94% | 0.31 | 0.58 | 0.40 |
| PUC | 71.42% | 0.65 | 0.79 | 0.71 |
| MOE | 85.04% | 0.79 | 0.93 | 0.85 |
| EAR+MAR | 47.87% | 0.049 | 0.91 | 0.093 |
| EAR+PUC | 60.59% | 0.46 | 0.72 | 0.56 |
| EAR+MOE | 85.62% | 0.78 | 0.95 | 0.85 |
| MAR+PUC | 55.50% | 0.25 | 0.78 | 0.38 |
| MAR+MOE | 86.33% | 0.79 | 0.95 | 0.86 |
| PUC+MOE | 85.32% | 0.79 | 0.93 | 0.85 |
| EAR+MAR+PUC | 49.23% | 0.16 | 0.64 | 0.25 |
| EAR+MAR+MOE | 85.72% | 0.78 | 0.95 | 0.86 |
| EAR+PUC+MOE | 84.56% | 0.76 | 0.94 | 0.84 |
| MAR+PUC+MOE | 85.55% | 0.78 | 0.95 | 0.85 |
| EAR+MAR+PUC+MOE | 85.19% | 0.77 | 0.95 | 0.85 |
| EAR | MAR | PUC | MOE | |||||
| Mean | Std | Mean | Std | Mean | Std | Mean | Std | |
| Alert | 0.28 | 0.06 | 0.98 | 0.12 | 0.43 | 0.06 | 3.86 | 1.62 |
| Drowsy | 0.21 | 0.10 | 1.04 | 0.13 | 0.38 | 0.07 | 7.12 | 5.04 |
| Delta | -25.0% | +6.1% | -16.7% | +84.5 | ||||
The result shows that MOE (the ratio of MAR divided by EAR) seems to be the most sensitive feature among the four features we tested. The result aligns with the fact that MOE captures the subtle changes in both EAR and MAR and will exaggerate the changes as the denominator and numerator move in opposite directions. Though the feature MAR is the least sensitive feature among the four features (accuracy=49.94%, F1 score=0.4), the highest accuracy (86.33%) and F1 score (0.86) were found when using the feature combination of MAR and MOE, followed by using the feature combination of EAR, MAR, and MOE (accuracy=85.72%, F1 score=0.86). The third highest accuracy was found using the feature combination of EAR and MOE (accuracy=85.63%, F1 score=0.85).
We also found that in some cases, individual features work better than a combination of features. For example, when using the feature combinations EAR+MAR, EAR+PUC, MAR+PUC, and EAR+MAR+PUC, the accuracy, and F1 score are lower than using these features individually.
We investigated the mean and standard deviation of the EAR, MAR, PUC, and MOE for alert and drowsy conditions. Table 4 shows that EAR and PUC are larger in the alert condition than in the drowsy condition on average, while the MAR is smaller in the alert condition than in the drowsy state. The result also shows that the MOE is larger in the drowsy condition than in the alert condition on average. Moreover, the difference in MOE’s mean value in the alert and the drowsy condition is larger than other than three features. This aligns with the fact that MOE could exaggerate the changes of EAR and MAR.
4.3. Results on target population
We tested our algorithm on older adult participants to evaluate how well we could detect drowsiness in older adults. Older adults were recruited from the general population. Ten participants agreed to participate in three Zoom sessions, one in the morning, one around noon, and one in the evening. These times were selected so as to record videos of participants’ faces when they were alert and drowsy. In the Zoom meeting, participants were asked to watch a car driving video 111https://www.youtube.com/watch?v=fkps18H3SXY. Participants were instructed to feel free to talk or look around as they usually do when traveling as a passenger. Participants were asked to report their sleepiness level based on the Karonlinksa Sleep Scale (Shahid et al., 2011) before and after watching the car driving video. Figure 10 shows the detailed study procedure. Table 6 shows the meeting time with participants and their self-reported sleepiness level.
We collected 33 videos from 10 older adults without MCI. Table 6 shows the percentage of frames that the traveler monitoring system could detect the participant’s facial landmark. The results show that the facial landmark detection rate for most participants is higher than 90% except for participants 7, 8, and 9. The main reasons that the results were low for these three participants are that (1) their video resolution was low and (2) their face was out of the viewport of the camera. To address these concerns, we used a higher-resolution Logitech c920 webcam in our final prototype system while placing the camera directly in front of the user to capture their face during the entire process; thus, ensuring our system can detect greater than 90% of facial landmarks.
Participant 2 reported they were extremely alert in the first session, alert in the second session, very alert in the third session, and sleepy in the fourth session. Based on their reported subjective alertness level, their alertness level is highest in session A and lowest in session D. Table 5 shows the mean and standard deviation of the EAR, MAR, PUC, and MOE for that participant. The average EAR and PUC are the highest, while the average MOE is the lowest in session A. The average MAR and MOE are the highest, while the average PUC is the lowest in session D. The bolded values in table 5 show that the MOE features can distinguish the different alertness levels, and that MOE is a good feature to predict the alertness level.
| Self-reported alertness | Eye aspect ratio (EAR) | Mouth aspect ratio (MAR) | Pupil circularity (PUC) | MAR/EAR (MOE) | |||||
|---|---|---|---|---|---|---|---|---|---|
| Mean | SD | Mean | SD | Mean | SD | Mean | SD | ||
| Session A | 1 | 0.289 | 0.047 | 0.991 | 0.049 | 0.438 | 0.051 | 3.546 | 0.784 |
| Session B | 3 | 0.264 | 0.028 | 1.024 | 0.030 | 0.393 | 0.033 | 3.934 | 0.488 |
| Session C | 2 | 0.247 | 0.036 | 0.976 | 0.043 | 0.394 | 0.038 | 4.073 | 0.838 |
| Session D | 8 | 0.257 | 0.021 | 1.174 | 0.070 | 0.393 | 0.025 | 4.602 | 0.496 |
| Participant ID | Session time |
|
|
|
|
||||||||
| 2A | 12 PM - 1 PM | Fairly alert | Extremely alert |
|
100 | ||||||||
| 2B | 11 AM - 12 PM |
|
|
|
100 | ||||||||
| 2C | 6 PM - 7 PM | Very alert | Very alert | did not occur | 99.1 | ||||||||
| 2D | 9 PM - 10 PM |
|
|
|
100 | ||||||||
| 3A | 8 AM - 9 AM |
|
Very alert | did not occur | 99.8 | ||||||||
| 3B | 11 AM - 12 PM |
|
Fairly alert |
|
95.0 | ||||||||
| 3C | 5 PM - 6 PM | Very alert |
|
|
99.9 | ||||||||
| 4A | 10 AM - 11 AM | Very alert | Very alert | did not occur | 91.9 | ||||||||
| 4B | 6 PM - 7 PM | Very alert | Alert |
|
99.1 | ||||||||
| 4C | 1 PM - 2 PM | Very alert | Very alert | did not occur | 88.6 | ||||||||
| 5A | 9 AM - 10 AM | Alert | Very alert | did not occur | 99.5 | ||||||||
| 5B | 1 PM - 2 PM | Very alert | Very alert | did not occur | 99.5 | ||||||||
| 5C | 6 PM - 7 PM | Very alert | Very alert | did not occur | 99.9 | ||||||||
| 5D | 9 PM - 10 PM | Fairly alert |
|
|
99.6 | ||||||||
| 6A | 8 AM - 9 AM | Alert | Fairly alert | did not occur | 100 | ||||||||
| 6B | 7 PM - 8 PM |
|
|
|
52.5 | ||||||||
| 6C | 12 PM - 1 PM | Very alert |
|
|
100 | ||||||||
| 7A | 8 AM - 9 AM | Very alert | Alert | did not occur | 0 | ||||||||
| 7B | 12 PM - 1 PM | Alert | Alert | did not occur | 61.3 | ||||||||
| 7C | 5 PM - 6 PM | Alert | Alert | did not occur | 1.2 | ||||||||
| 8A | 9 AM - 10 AM | Alert |
|
|
70.4 | ||||||||
| 8B | 1 PM - 2 PM | Fairly alert |
|
|
84.7 | ||||||||
| 8C | 6 PM - 7 PM | Fairly alert |
|
|
2.4 | ||||||||
| 8D | 2 PM - 3 PM |
|
|
|
17.8 | ||||||||
| 9A | 9 AM - 10 AM |
|
|
|
0.3 | ||||||||
| 9B | 2 PM - 3 PM |
|
|
|
9.6 | ||||||||
| 9C | 9 PM - 10 PM |
|
|
|
48.3 | ||||||||
| 10A | 9 AM - 10 AM | Very alert | Alert | did not occur | 92.4 | ||||||||
| 10B | 1 PM - 2 PM | Alert | Fairly alert |
|
86.6 | ||||||||
| 10C | 6 PM - 7 PM | Alert | Alert | did not occur | 87.6 | ||||||||
| 11A | 4 PM - 5 PM | Alert |
|
did not occur | 96.8 | ||||||||
| 11B | 9 AM - 10 AM | Very alert | Very alert | did not occur | 99.7 | ||||||||
| 11C | 3 PM - 4 PM | Alert | Alert | did not occur | 99.8 |
5. Limitations and Future Work
The first limitation of our system is that the outcome is bottlenecked by the success or failure of facial landmark detection.
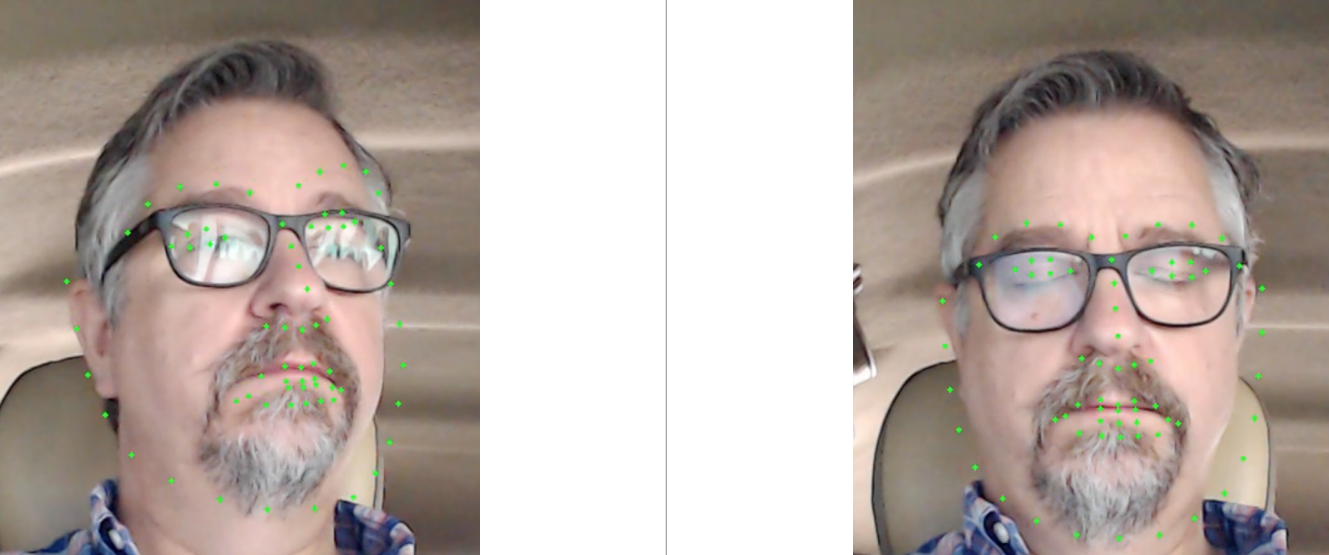
Glasses. Almost all the older adults that participated in our study wore glasses. Wearing sunglasses also affects the performance of our system. Especially for our target population, it is very common to wear sunglasses because older adults need to protect their eyes from the sunlight. Facial landmark detection in the presence of glasses is a known challenge in the computer vision community. We found that eyeglasses affect the facial landmark detection because it is difficult to localize the eyes area due to light reflection and the frame of eyeglasses (Figure 11 shows an example failure case). A potential solution for this issue is adding an image preprocessing step to remove glasses from the face images. Another possibility is to add a “glasses detector” as a preprocessing step and utilize cues such as head pose and head movement to detect sleepiness if glasses are detected.
Lighting. Facial landmark detection rate is also affected by the lighting in the scene. When vehicles run at night and the vehicle’s interior becomes less visible, the performance of any visible light camera based system would be affected. A potential solution for this issue is applying dark image enhancement algorithms as a preprocessing step to facilitate facial landmarks detection in poor light conditions. Previously, researchers have proposed using near infrared lighting was used to address this issue (Gwon et al., 2014). However, more than 50% of sunlight is near infrared (Barolet et al., 2016). From a practical perspective, it might be necessary to have two types of camera in the vehicle, one for day use and one for night use.
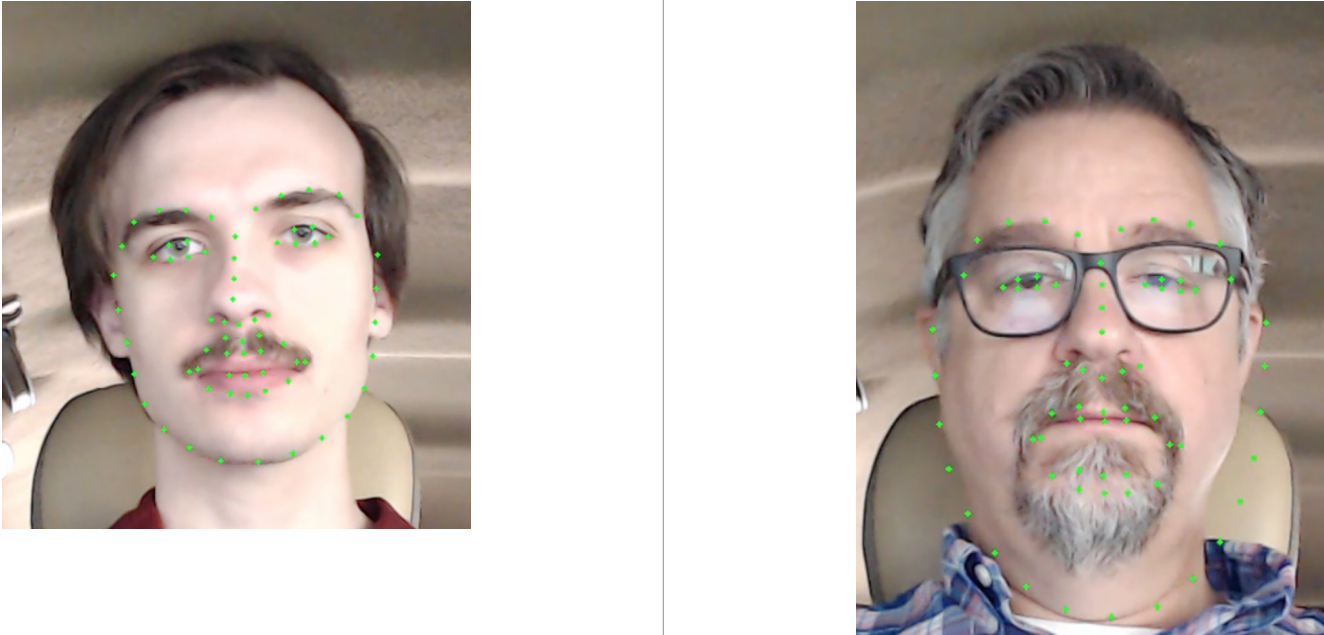
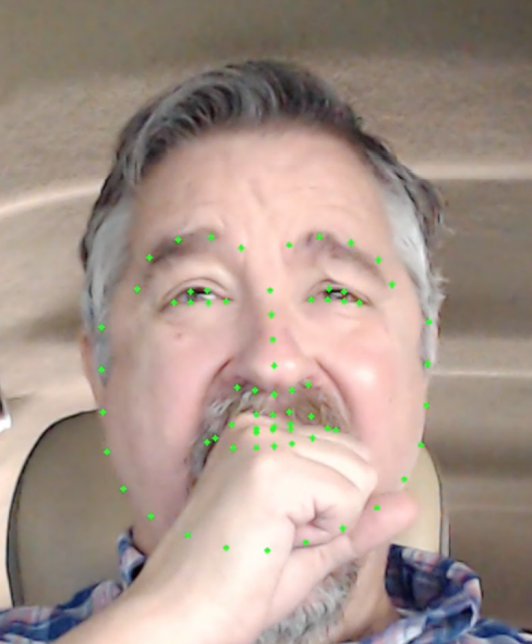
Facial hair. The presence of facial hair is known to reduce the accuracy of facial landmarks detection. Figures 12 and 13 illustrate how the subject’s mustache and beard affected facial landmark detection. Future work might address these limitations by developing personalized facial landmarks detection algorithms, for example by asking the user to annotate a few pictures of themselves and using these annotations to learn the landmarks. In our use case, the vehicle is personally owned, and thus, we can expect the user to be the same at all times.
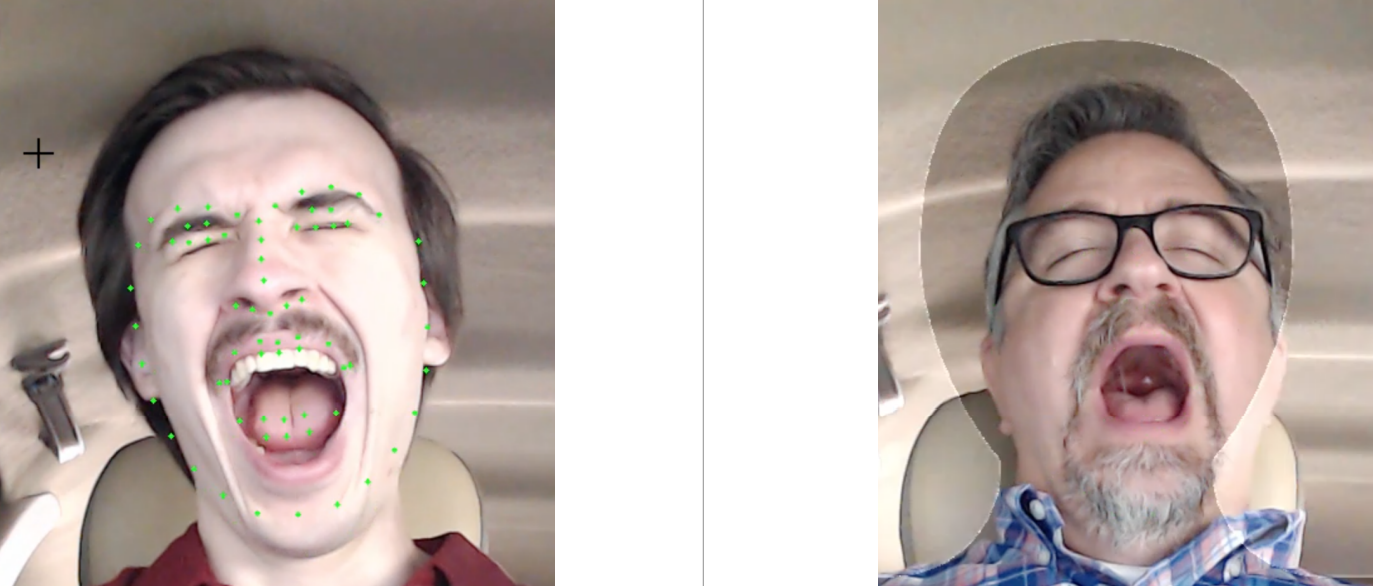
Behavioral differences. The major limitation of our system, and possibly the richest area of future work, is accounting for how different people behave when they are inattentive, or drowsy or fatigued. For example, one of our test subjects put their hand over their mouth while yawning (Figure 14), which immediately led to false facial landmarks. Future work toward in-vehicle attentiveness monitoring in older adults should consider qualitative studies to elicit how the target population expresses themselves in the states that we need to detect algorithmically.
Moreover, the calibration stage significantly affect the detection accuracy. However, uses are not familiar about the whole system and don’t know what to do. We need to find a way to guarantee we can get accurate baseline features in the calibration stage. Users may need to stop detection in the trip or stop the alert to remind that the face is not at the center of the screen since they may need to move around.
References
- (1)
- Administration et al. (2013) National Highway Traffic Safety Administration et al. 2013. Preliminary statement of policy concerning automated vehicles. Washington, DC 1 (2013), 14.
- Al-Rahayfeh and Faezipour (2013) Amer Al-Rahayfeh and Miad Faezipour. 2013. Eye tracking and head movement detection: A state-of-art survey. IEEE journal of translational engineering in health and medicine 1 (2013), 2100212–2100212.
- Ataollahi Eshkoor et al. (2014) Sima Ataollahi Eshkoor, Tengku Aizan Hamid, Siti Sa’adiah Hassan Nudin, and Chan Yoke Mun. 2014. Does substance abuse contribute to further risk of falls in dementia. Aging, Neuropsychology, and Cognition 21, 3 (2014), 317–324.
- Barolet et al. (2016) Daniel Barolet, François Christiaens, and Michael R Hamblin. 2016. Infrared and skin: Friend or foe. Journal of Photochemistry and Photobiology B: Biology 155 (2016), 78–85.
- Bruscoli and Lovestone (2004) Maddalena Bruscoli and Simon Lovestone. 2004. Is MCI really just early dementia? A systematic review of conversion studies. International psychogeriatrics 16, 2 (2004), 129–140.
- Busse et al. (2006) Anja Busse, Matthias C Angermeyer, and Steffi G Riedel-Heller. 2006. Progression of mild cognitive impairment to dementia: a challenge to current thinking. The British Journal of Psychiatry 189, 5 (2006), 399–404.
- Cristianini et al. (2000) Nello Cristianini, John Shawe-Taylor, et al. 2000. An introduction to support vector machines and other kernel-based learning methods. Cambridge university press.
- DeCarli (2003) Charles DeCarli. 2003. Mild cognitive impairment: prevalence, prognosis, aetiology, and treatment. The Lancet Neurology 2, 1 (2003), 15–21.
- Devi and Bajaj (2008) Mandalapu Sarada Devi and Preeti R Bajaj. 2008. Driver fatigue detection based on eye tracking. In 2008 First International Conference on Emerging Trends in Engineering and Technology. IEEE, 649–652.
- Fan et al. (2012) Xianghua Fan, Fuyou Zhang, Haixia Wang, and Xiao Lu. 2012. The system of face detection based on OpenCV. In 2012 24th Chinese Control and Decision Conference (CCDC). IEEE, 648–651.
- Federal Highway Administration (2022) Federal Highway Administration. 2022. Table DL-22 - Highway Statistics 2020 - Policy — Federal Highway Administration. https://www.fhwa.dot.gov/policyinformation/statistics/2020/dl22.cfm
- Fernández et al. (2016) Alberto Fernández, Rubén Usamentiaga, Juan Luis Carús, and Rubén Casado. 2016. Driver distraction using visual-based sensors and algorithms. Sensors 16, 11 (2016), 1805.
- François et al. (2016) Clémentine François, Thomas Hoyoux, Thomas Langohr, Jérôme Wertz, and Jacques G Verly. 2016. Tests of a new drowsiness characterization and monitoring system based on ocular parameters. International journal of environmental research and public health 13, 2 (2016), 174.
- Freund et al. (1996) Yoav Freund, Robert E Schapire, et al. 1996. Experiments with a new boosting algorithm. In icml, Vol. 96. Citeseer, 148–156.
- Ghoddoosian et al. (2019) Reza Ghoddoosian, Marnim Galib, and Vassilis Athitsos. 2019. A realistic dataset and baseline temporal model for early drowsiness detection. In Proceedings of the IEEE/CVF Conference on Computer Vision and Pattern Recognition Workshops. 0–0.
- Gold (2012) David A Gold. 2012. An examination of instrumental activities of daily living assessment in older adults and mild cognitive impairment. Journal of clinical and experimental neuropsychology 34, 1 (2012), 11–34.
- Gundgurti et al. (2013) Padmavati Gundgurti, Basavaraj Patil, V Hemadri, and U Kulkarni. 2013. Experimental study on assessment on impact of biometric parameters on drowsiness based on yawning and head movement using support vector machine. International journal of computer science and management research 2, 5 (2013), 2576–2580.
- Gwon et al. (2014) Su Yeong Gwon, Chul Woo Cho, Hyeon Chang Lee, Won Oh Lee, and Kang Ryoung Park. 2014. Gaze tracking system for user wearing glasses. Sensors 14, 2 (2014), 2110–2134.
- Heydarzadeh and Haghighat (2011) Yasaman Heydarzadeh and Abolfazl Toroghi Haghighat. 2011. An efficient face detection method using adaboost and facial parts. IJSSST 12, 4 (2011).
- Huynh et al. (2016) Xuan-Phung Huynh, Sang-Min Park, and Yong-Guk Kim. 2016. Detection of driver drowsiness using 3D deep neural network and semi-supervised gradient boosting machine. In Asian Conference on Computer Vision. Springer, 134–145.
- Jo et al. (2011) Jaeik Jo, Sung Joo Lee, Jaihie Kim, Ho Gi Jung, and Kang Ryoung Park. 2011. Vision-based method for detecting driver drowsiness and distraction in driver monitoring system. Optical Engineering 50, 12 (2011), 127202.
- Kokonozi et al. (2008) AK Kokonozi, EM Michail, IC Chouvarda, and NM Maglaveras. 2008. A study of heart rate and brain system complexity and their interaction in sleep-deprived subjects. In 2008 Computers in Cardiology. IEEE, 969–971.
- Kurylyak et al. (2012) Yuriy Kurylyak, Francesco Lamonaca, and Giovanni Mirabelli. 2012. Detection of the eye blinks for human’s fatigue monitoring. In 2012 IEEE International Symposium on Medical Measurements and Applications Proceedings. IEEE, 1–4.
- Liang et al. (2019) Yulan Liang, William J Horrey, Mark E Howard, Michael L Lee, Clare Anderson, Michael S Shreeve, Conor S O’Brien, and Charles A Czeisler. 2019. Prediction of drowsiness events in night shift workers during morning driving. Accident Analysis & Prevention 126 (2019), 105–114.
- Lienhart and Maydt (2002) Rainer Lienhart and Jochen Maydt. 2002. An extended set of haar-like features for rapid object detection. In Proceedings. international conference on image processing, Vol. 1. IEEE, I–I.
- Lin et al. (2016) Feng Lin, Ping Ren, Kelly Cotton, Anton Porsteinsson, Mark Mapstone, and Kathi L Heffner. 2016. Mental fatigability and heart rate variability in mild cognitive impairment. The American Journal of Geriatric Psychiatry 24, 5 (2016), 374–378.
- Mandal et al. (2016) Bappaditya Mandal, Liyuan Li, Gang Sam Wang, and Jie Lin. 2016. Towards detection of bus driver fatigue based on robust visual analysis of eye state. IEEE Transactions on Intelligent Transportation Systems 18, 3 (2016), 545–557.
- Massoz et al. (2018) Quentin Massoz, Jacques G Verly, and Marc Van Droogenbroeck. 2018. Multi-timescale drowsiness characterization based on a video of a driver’s face. Sensors 18, 9 (2018), 2801.
- Molitor et al. (2015) Robert J Molitor, Philip C Ko, and Brandon A Ally. 2015. Eye movements in Alzheimer’s disease. Journal of Alzheimer’s disease 44, 1 (2015), 1–12.
- Nie et al. (2020) Jing Nie, Qi Qiu, Michael Phillips, Lin Sun, Feng Yan, Xiang Lin, Shifu Xiao, and Xia Li. 2020. Early Diagnosis of Mild Cognitive Impairment Based on Eye Movement Parameters in an Aging Chinese Population. Frontiers in Aging Neuroscience 12 (2020), 221.
- Nizamuddin (2000) M Nizamuddin. 2000. Population ageing: policy responses to population ageing in Asia and the Pacific. In Fifth Asian and Pacific Population Conference, Vol. 2025. Citeseer, 95.
- Novakazi (2020) Fjolle Novakazi. 2020. Perception Creates Reality-Factors Influencing the Driver’s Perception and Consequent Understanding of Driving Automation Systems. Ph.D. Dissertation. Chalmers Tekniska Hogskola (Sweden).
- Odawara (2012) Toshinari Odawara. 2012. Cautious notification and continual monitoring of patients with mild cognitive impairment. Psychogeriatrics 12, 2 (2012), 131–132.
- Panza et al. (2005) Francesco Panza, Alessia D’Introno, Anna Maria Colacicco, Cristiano Capurso, Angelo Del Parigi, Richard J Caselli, Alberto Pilotto, Giovanni Argentieri, Pier Luigi Scapicchio, Emanuele Scafato, et al. 2005. Current epidemiology of mild cognitive impairment and other predementia syndromes. The American Journal of Geriatric Psychiatry 13, 8 (2005), 633–644.
- Parikh et al. (2016) Preeyam K Parikh, Angela K Troyer, Andrea M Maione, and Kelly J Murphy. 2016. The impact of memory change on daily life in normal aging and mild cognitive impairment. The Gerontologist 56, 5 (2016), 877–885.
- Park et al. (2016) Sanghyuk Park, Fei Pan, Sunghun Kang, and Chang D Yoo. 2016. Driver drowsiness detection system based on feature representation learning using various deep networks. In Asian Conference on Computer Vision. Springer, 154–164.
- Petersen (2004) Ronald C Petersen. 2004. Mild cognitive impairment as a diagnostic entity. Journal of internal medicine 256, 3 (2004), 183–194.
- Petersen et al. (1999) Ronald C Petersen, Glenn E Smith, Stephen C Waring, Robert J Ivnik, Eric G Tangalos, and Emre Kokmen. 1999. Mild cognitive impairment: clinical characterization and outcome. Archives of neurology 56, 3 (1999), 303–308.
- Pinto and Subramanyam (2009) Charles Pinto and Alka A Subramanyam. 2009. Mild cognitive impairment: The dilemma. Indian journal of psychiatry 51, Suppl1 (2009), S44.
- Rahman et al. (2011) ASM Mahfujur Rahman, Niloufar Azmi, Shervin Shirmohammadi, and Abdulmotaleb El Saddik. 2011. A novel haptic jacket based alerting scheme in a driver fatigue monitoring system. In 2011 IEEE International Workshop on Haptic Audio Visual Environments and Games. IEEE, 112–117.
- Rashid et al. (2012) AK Rashid, AM Azizah, and S Rohana. 2012. Cognitive impairment among the elderly Malays living in rural Malaysia. Med J Malaysia 67, 2 (2012), 186–9.
- RC et al. (2001) S Petersen RC, JC Stevens, M Ganguli, EG Tangalos, JL Cummings, and ST DeKosky. 2001. Practice parameter: Early detection of dementia: Mild cognitive impairment (an evidence-based review). Neurology 56 (2001), 1133–42.
- Reddy et al. (2017) Bhargava Reddy, Ye-Hoon Kim, Sojung Yun, Chanwon Seo, and Junik Jang. 2017. Real-time driver drowsiness detection for embedded system using model compression of deep neural networks. In Proceedings of the IEEE Conference on Computer Vision and Pattern Recognition Workshops. 121–128.
- Reitz and Mayeux (2010) Christiane Reitz and Richard Mayeux. 2010. Use of genetic variation as biomarkers for mild cognitive impairment and progression of mild cognitive impairment to dementia. Journal of Alzheimer’s Disease 19, 1 (2010), 229–251.
- Ren et al. (2019) Ping Ren, Andrew J Anderson, Kelsey McDermott, Timothy M Baran, and Feng Lin. 2019. Cognitive fatigue and cortical-striatal network in old age. Aging (Albany NY) 11, 8 (2019), 2312.
- SAE International (2021) SAE International. 2021. J3016_202104: Taxonomy and definitions for terms related to driving automation systems for On-Road motor vehicles - SAE international. https://www.sae.org/standards/content/j3016_202104
- Sahayadhas et al. (2012) Arun Sahayadhas, Kenneth Sundaraj, and Murugappan Murugappan. 2012. Detecting driver drowsiness based on sensors: a review. Sensors 12, 12 (2012), 16937–16953.
- Sathasivam et al. (2020) Saravanaraj Sathasivam, Sharifah Saon, Azmi Sidek, Mohamad Md Som, Hussein Ali Ameen, et al. 2020. Drowsiness Detection System using Eye Aspect Ratio Technique. In 2020 IEEE Student Conference on Research and Development (SCOReD). IEEE, 448–452.
- Shahid et al. (2011) Azmeh Shahid, Kate Wilkinson, Shai Marcu, and Colin M Shapiro. 2011. Karolinska sleepiness scale (KSS). In STOP, THAT and One Hundred Other Sleep Scales. Springer, 209–210.
- Shih and Hsu (2016) Tun-Huai Shih and Chiou-Ting Hsu. 2016. MSTN: Multistage spatial-temporal network for driver drowsiness detection. In Asian Conference on Computer Vision. Springer, 146–153.
- Sigari et al. (2013) Mohamad-Hoseyn Sigari, Mahmood Fathy, and Mohsen Soryani. 2013. A driver face monitoring system for fatigue and distraction detection. International journal of vehicular technology 2013 (2013).
- Simonyan and Zisserman (2014) Karen Simonyan and Andrew Zisserman. 2014. Very deep convolutional networks for large-scale image recognition. arXiv preprint arXiv:1409.1556 (2014).
- Singh et al. (2018) Ashlesha Singh, Chandrakant Chandewar, and Pranav Pattarkine. 2018. Driver drowsiness alert system with effective feature extraction. Int. JR in Emer. Sci. and Tech 5, 4 (2018), 26–31.
- Smith et al. (1996) Glenn E Smith, Ronald C Petersen, Joseph E Parisi, Robert J Ivnik, Emre Kokmen, Eric G Tangalos, and Stephen Waring. 1996. Definition, course, and outcome of mild cognitive impairment. Aging, Neuropsychology, and Cognition 3, 2 (1996), 141–147.
- Smith et al. (2000) Paul Smith, Mubarak Shah, and Niels da Vitoria Lobo. 2000. Monitoring head/eye motion for driver alertness with one camera. In Proceedings 15th International Conference on Pattern Recognition. ICPR-2000, Vol. 4. IEEE, 636–642.
- Song et al. (2014) Fengyi Song, Xiaoyang Tan, Xue Liu, and Songcan Chen. 2014. Eyes closeness detection from still images with multi-scale histograms of principal oriented gradients. Pattern Recognition 47, 9 (2014), 2825–2838.
- Surasak et al. (2018) Thattapon Surasak, Ito Takahiro, Cheng-hsuan Cheng, Chi-en Wang, and Pao-you Sheng. 2018. Histogram of oriented gradients for human detection in video. In 2018 5th International conference on business and industrial research (ICBIR). IEEE, 172–176.
- Tricco et al. (2012) Andrea C Tricco, Charlene Soobiah, Erin Lillie, Laure Perrier, Maggie H Chen, Brenda Hemmelgarn, Sumit R Majumdar, and Sharon E Straus. 2012. Use of cognitive enhancers for mild cognitive impairment: protocol for a systematic review and network meta-analysis. Systematic reviews 1, 1 (2012), 1–6.
- US Census Bureau (2017) U. C US Census Bureau. 2017. National Population Projections Tables: Main Series. The United States Census Bureau (2017).
- Vikram and Padmavathi (2017) K Vikram and S Padmavathi. 2017. Facial parts detection using Viola Jones algorithm. In 2017 4th international conference on advanced computing and communication systems (ICACCS). IEEE, 1–4.
- Wahlstrom et al. (2003) Eric Wahlstrom, Osama Masoud, and Nikos Papanikolopoulos. 2003. Vision-based methods for driver monitoring. In Proceedings of the 2003 IEEE International Conference on Intelligent Transportation Systems, Vol. 2. IEEE, 903–908.
- Wang et al. (2019) Jun Wang, Xiaoping Yu, Qiang Liu, and Zhou Yang. 2019. Research on key technologies of intelligent transportation based on image recognition and anti-fatigue driving. EURASIP Journal on Image and Video Processing 2019, 1 (2019), 1–13.
- Wang and Xu (2016) Xuesong Wang and Chuan Xu. 2016. Driver drowsiness detection based on non-intrusive metrics considering individual specifics. Accident Analysis & Prevention 95 (2016), 350–357.
- Weng et al. (2016) Ching-Hua Weng, Ying-Hsiu Lai, and Shang-Hong Lai. 2016. Driver drowsiness detection via a hierarchical temporal deep belief network. In Asian Conference on Computer Vision. Springer, 117–133.
- Wierwille et al. (1994) Walter W Wierwille, SS Wreggit, CL Kirn, LA Ellsworth, and RJ Fairbanks. 1994. Research on vehicle-based driver status/performance monitoring; development, validation, and refinement of algorithms for detection of driver drowsiness. final report. Technical Report.
- Wilcockson et al. (2019) Thomas DW Wilcockson, Diako Mardanbegi, Baiqiang Xia, Simon Taylor, Pete Sawyer, Hans W Gellersen, Ira Leroi, Rebecca Killick, and Trevor J Crawford. 2019. Abnormalities of saccadic eye movements in dementia due to Alzheimer’s disease and mild cognitive impairment. Aging (Albany NY) 11, 15 (2019), 5389.
- Zhong (2019) Grant Zhong. 2019. Drowsiness detection with machine learning. https://towardsdatascience.com/drowsiness-detection-with-machine-learning-765a16ca208a