In vivo three- and four-photon fluorescence microscopy using a 1.8 µm femtosecond fiber laser system
Abstract
Multiphoton microscopy has enabled us to image cellular dynamics in vivo. However, the excitation wavelength for imaging with commercially available lasers is mostly limited between 650–1040 nm. Here we develop a femtosecond fiber laser system that produces 150 fs pulses at 1.8 µm. Our system starts from an erbium-doped silica fiber laser, and its wavelength is converted to 1.8 µm using a Raman shift fiber. The 1.8 µm pulses are amplified with a two-stage Tm:ZBLAN fiber amplifier. The final pulse energy is 1 µJ, sufficient for in vivo imaging. We successfully observe TurboFP635-expressing cortical neurons at a depth of 0.8 mm from the brain surface by three-photon excitation and Clover-expressing astrocytes at a depth of 0.2 mm by four-photon excitation.
1 Introduction
In the last few decades, in vivo multiphoton microscopy [1, 2] has become very popular in neuroscience. It enables non-invasive observation of fluorescent protein-expressing neurons up to 1000 µm deep in mouse brains. While two-photon excitation is widely used, 3- or 4-photon excitation is rarely used. This is because the commercially-available femtosecond lasers, which only cover the wavelength between 650 and 1040 nm, and do not match the 3-photon (3P) /4-photon (4P) excitation of the commonly used fluorescent proteins such as green fluorescent protein (GFP) or Red fluorescent protein (RFP). e.g., 3P excitation of RFP and 4P excitation of GFP requires 1600 nm. Recently, custom-made lasers with wavelengths up to 1700 nm have been developed and applied for 3P/4P in vivo imaging [3, 4]. However, the potential of 1.8 µm for in vivo 3P/4P imaging has remained unknown.
The light scattering of longer wavelengths in tissue is generally lower than that of shorter wavelengths. Therefore, 3-photon excitation with a longer wavelength would enable deeper imaging in brains over two-photon excitation [5]. 3P/4P fluorescence microscope at the wavelength of 1.3 and 1.7 µm has already been realized using optical parametric amplifiers pumped with a high energy (20 µJ) and high repetition rate (1 MHz) femtosecond ytterbium solid state amplifier [4, 6]. In addition, Raman shift of the high energy (6 µJ) femtosecond 1.5 µm pulses from a powerful Er: fiber laser using a rod-style photonic crystal fiber [5] has enabled 3P imaging.
In this paper, we show a new 1.8 µm fiber laser system constructed with relatively standard components and operated in a standard biomedical laboratory. We demonstrate that the laser can be applied to the 3- /4-photon imaging of neuronal cells in vivo.
2 Laser system
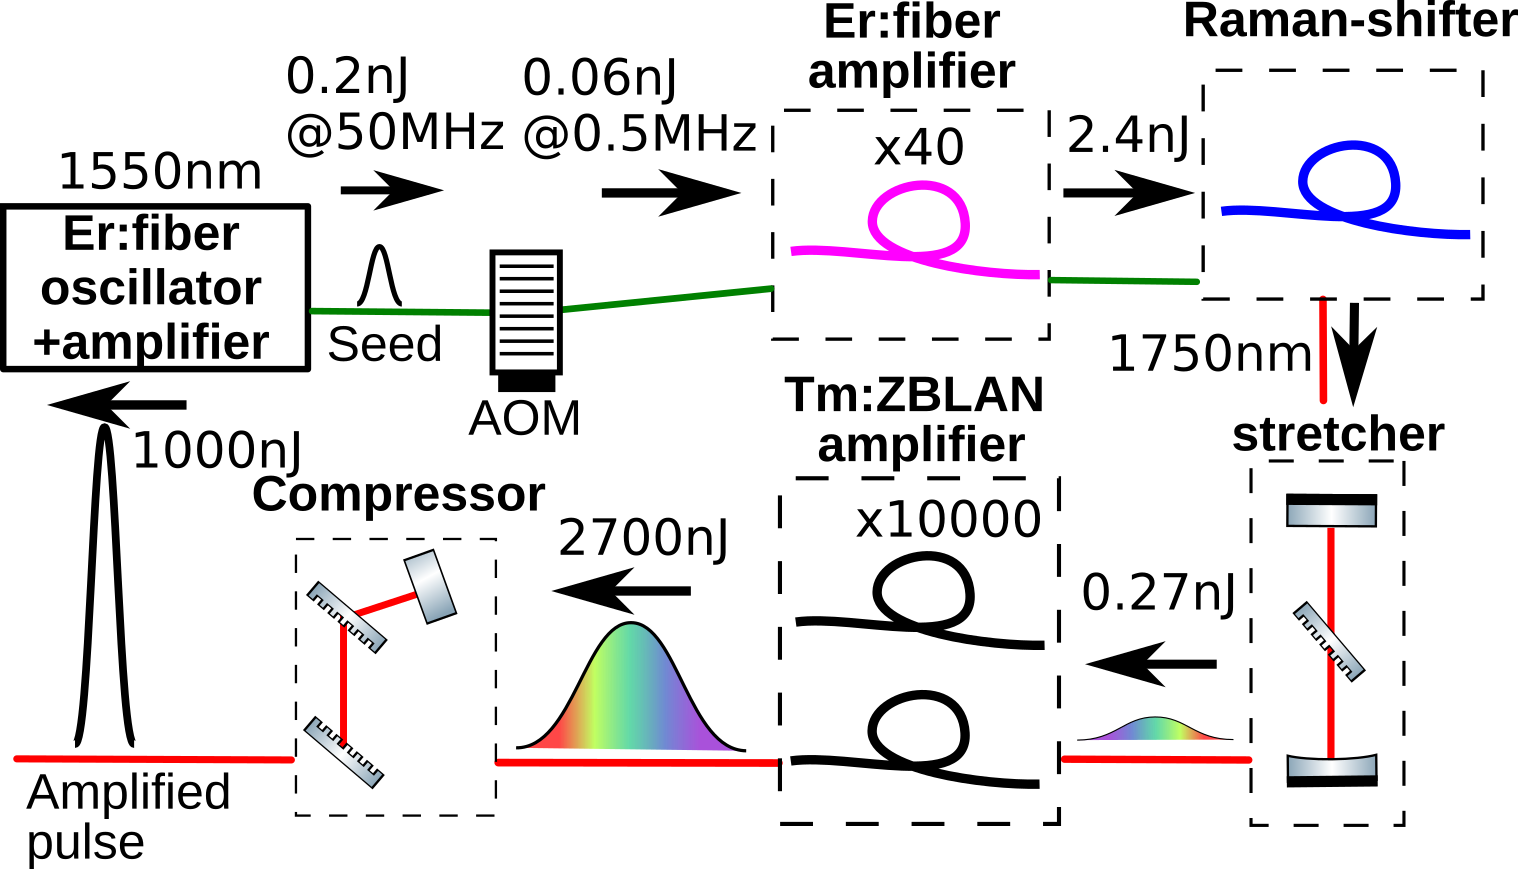
A schematic of our laser system is shown in Fig. 1. The system starts from a commercially available erbium-doped silica fiber (Er:SiO2) oscillator (VFLP-1560-M-fs, Connet). The output power of the oscillator and repetition rates are 1 mW and 50 MHz, respectively. The output of the oscillator was stretched with a dispersion compensation fiber with a length of 5 m (PMDCF, Thorlabs) and was amplified with a standard Er:SiO2 amplifier (MFAS-ER-C-M-PA-PL, Connet). The repetition rate of the amplified pulse train was reduced from 50 MHz to 500 kHz by using an acousto-optic modulator (T-M300-0.1C16J-3-F2P, Gooch&Hausego) driven by a pulse picker electronics and is amplified again with another same type Er:SiO2 amplifier. The amplified pulse energy was about 7 nJ, and the pulses were sent to an anomalous dispersion fiber (PM1950) with a length of 4 m. The mode field diameter of the fiber is 8 µm, and the estimated dispersion is 21.69 fs/mm2. The pulse was compressed in the fiber, simultaneously inducing Raman scattering process inside the fiber. Figure 2(a) shows the Raman-shifted fiber’s output spectrum as the amplifier’s output pulse energy is varied. We were able to shift the center wavelength of the pulse up to 1.85 µm. The center wavelength of the output laser pulse was set to 1.8 µm and introduced into the next amplification stage. To generate the 1.8 µm seed pulse, we used an all-fiber system consisting of lasers and optical components usually used for optical communications.
The 1.8 µm pulse was sent to a Martines stretcher based on a transmission grating with grooves of 560 mm-1 (PCG-560/2000-934, Ibsen). The stretcher introduces the group delay dispersion of 1.1 ps2 and stretches the pulse to 10 ps. The stretched pulse was sent to a thulium-doped fluoride fiber (Tm:ZBLAN) amplifier pumped by a continuous wave 1.6 µm Er:SiO2 laser (VFLS-1600-3W-PM, Connet) with a power of 2 W. The core diameter, the length, and the doping concentration of the fiber are 6 µm, 30 cm, and 1 mol%, respectively. The output spectrum of the preamplifier is shown in Fig. 2(b). The pulse was further amplified by another Tm:ZBLAN amplifier, which consists of a Tm:ZBLAN with a core diameter of 20 µm, a doping concentration of 2 mol% and a length of 20 cm. The pump laser is a commercially available Raman shift fiber laser (RLR-30-1620, IPG photonics). The amplifier’s output power is 1.35 W at a pump power of 5.15 W, and the slope efficiency was 26.1%.
The pulse was introduced into a Tracy compressor based on a pair of the same transmission gratings as that used in the stretcher. The distance of the pair of the gratings is 8.5 cm which corresponds to 0.77 ps2. The spectrum after the compressor is shown in Fig. 2(b). The pulse was characterized by a second harmonic generation frequency-resolved optical gating (FROG) device (MS-FROG, FemtoEasy). The experimentally measured FROG trace and retrieved pulses in time- and frequency-domain are shown in Fig. 3. There was some residual third-order dispersion (TOD) in the retrieved pulse because of the TOD mismatch between the dispersions of the fibers for the amplifier and the grating compressor. The pulse duration (full width at half maximum) was 142 fs.
The retrieved spectrum does not have any intensity in the wavelength range longer than 1.84 µm, although the spectrum recorded with a spectrometer has a significant intensity in the region. We believe that the long wavelength component is a sort of amplified spontaneous emission and is incoherent. Therefore, the component does not produce any second harmonic signals, which are supposed to show up in the FROG trace if it is coherent. The FROG trace did not change when we put a metallic plate in the grating compressor to block the long wavelength component. The spectrum is also shown in Fig. 2(b). The long wavelength components might be absorbed and converted to heat in the water, damaging the brain tissue. Therefore, we kept blocking the long wavelength component and applied the output pulse for the multiphoton microscope. In the end, the power of the laser is 0.5 W in front of the microscope.
3 Three-photon (3P) microscopy
We built a laser scanning multiphoton microscope with our 1.8 µm laser as previously described [7]. Briefly, the system consists of galvanometer scanners (6210H, Cambridge Technology), a scan lens (SL50-3P, Thorlabs), a trinocular tube (U-TR30IR, Olympus), and a water-immersion objective lens (XLPLNN25X SVVMP2SP, NA1.0, Olympus [7]. The system was controlled with the ScanImage software [8]. The transmittance at 1.8 µm of our microscope with the objective lens attached is approximately 32%, while the transmittance without an objective lens is approximately 60%. Fluorescence photon signals were collected by the objective lens and detected by a photomultiplier tube (H7422-40p; Hamamatsu) placed after an emission filter (FF01-709/167 for TurboFP635, FF01-510/84 for Clover; Semrock).
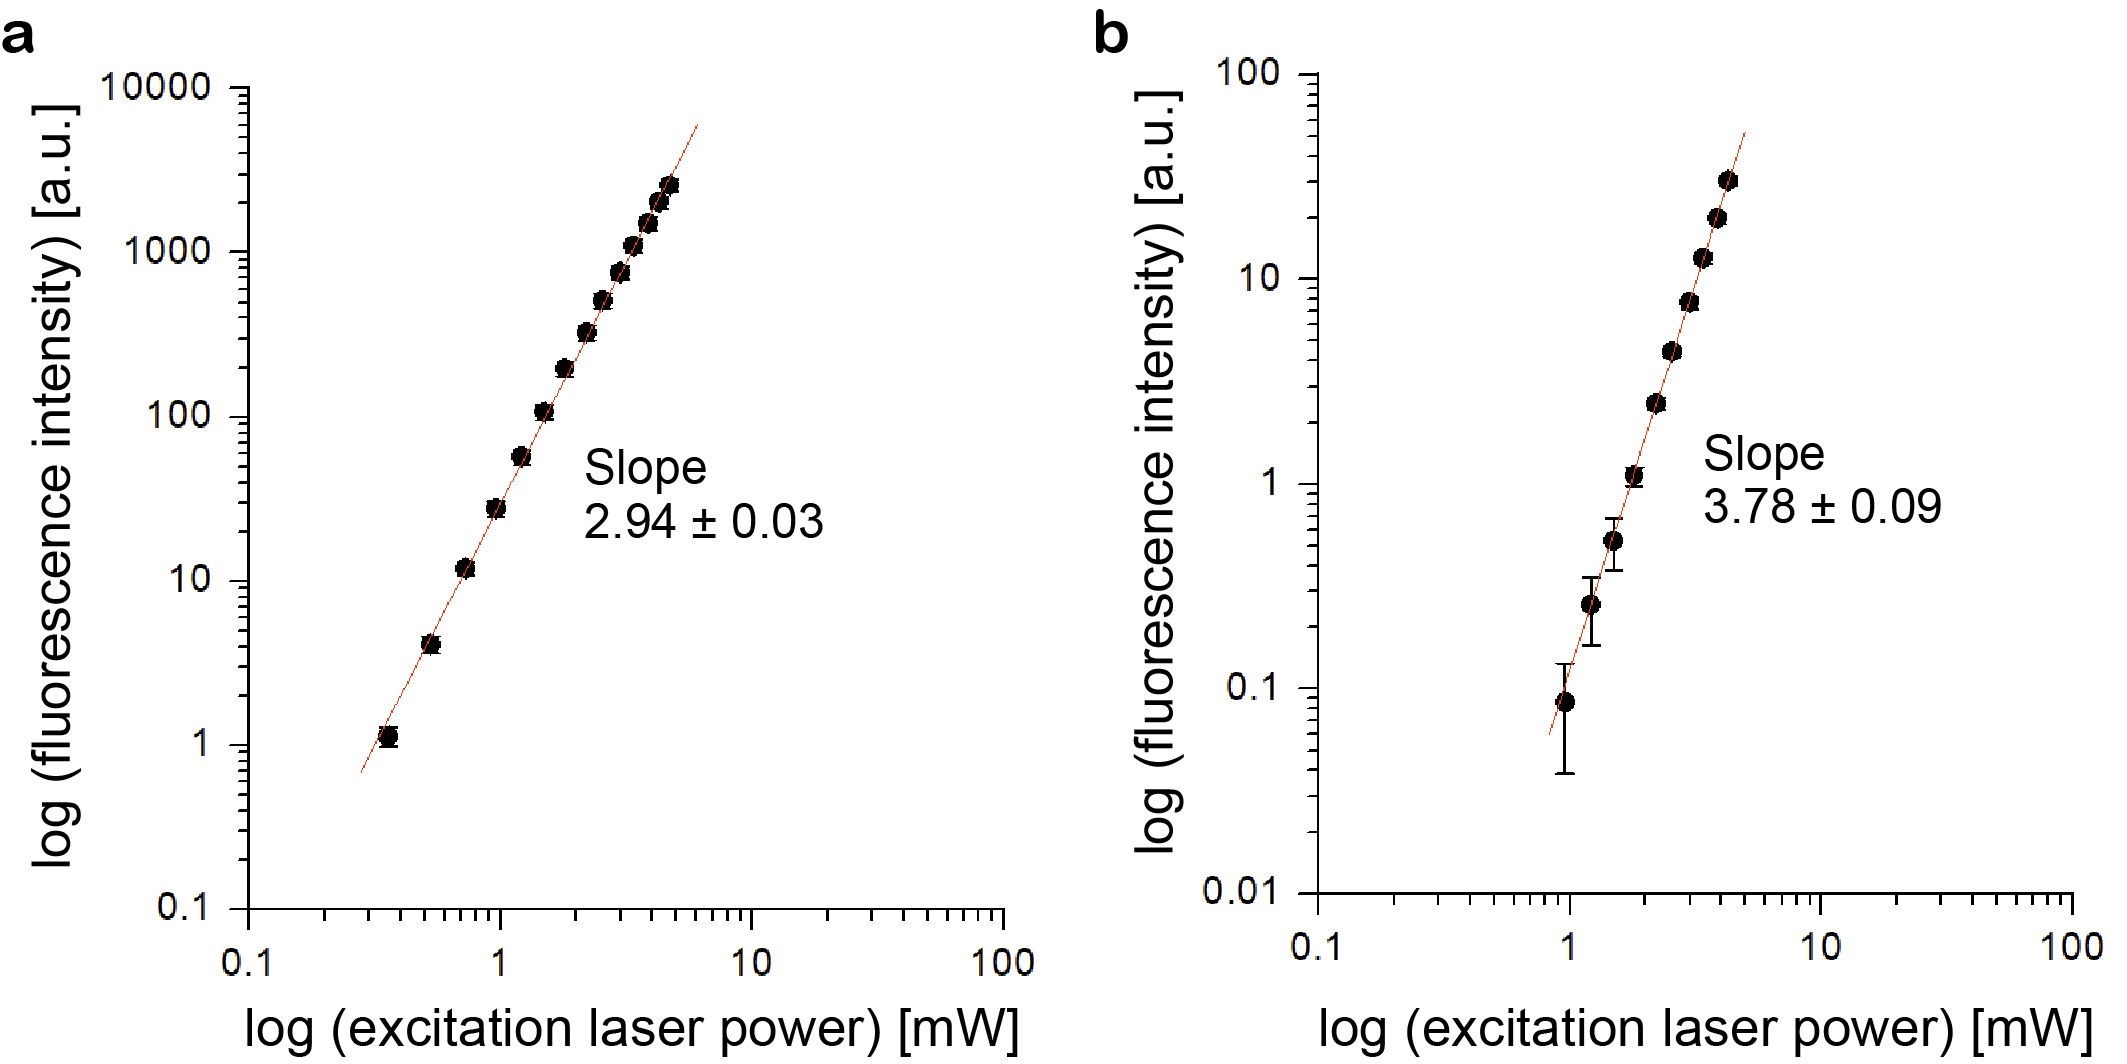
To test whether our setup can induce 3P excitation processes, we measured the dependence of the fluorescence from TurboFP635 (Katushka) [9] and Clover [10] on the excitation laser power at 1.8 µm (Fig. 4). The purified fluorescent proteins from E.coli were dissolved in standard phosphate-buffered saline (PBS) at pH7.4. The fluorescent protein solution was sandwiched between two glass cover glasses and placed under the objective lens with D2O as immersion water. The slopes in the log-log plots confirmed 3P excitation for TurboFP635 (proportional to the cube) and 4P excitation for Clover (proportional to the fourth power).
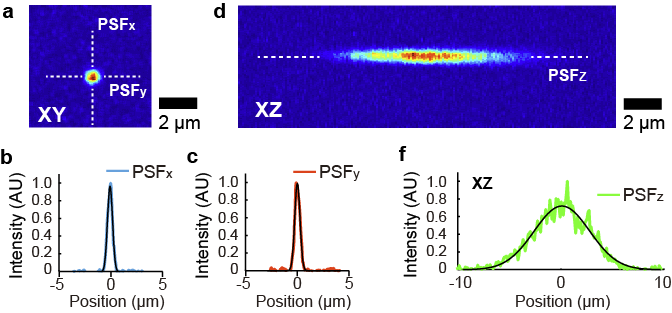
To determine the spatial resolution of the microscope with the 1.8 µm laser, we fixed red fluorescent beads (0.2 µm, FluoSpheres, crimson fluorescent 625/645) in agarose gel and observed them. A typical image is shown in Fig. 5. We fitted the spots with a gaussian to determine the spot size. Since the spot size is much larger than the beads, the spot size should reflect the point spread function of the microscope system. We determined the spatial resolution of the microscope by fitting with Gaussian curves (FWHM 0.56 µm to x-, y-axis, FWHM 6.2 µm to the z-axis, the average of 7 measurements).
We next imaged a mouse hippocampal cultured slice with 3-photon excitation at 1.8 µm. The hippocampus from a 6-day-old mouse was sliced into 350 µm thickness, and 2 days later, the adeno-associated virus encoding CaMKII promoter-DIO-TurboFP635-WPRE3 in combination with low Cre expression [11] was introduced into CA1 region at a depth of approximately 50 µm from the surface of the slice. The slices were incubated at 35 ∘C 5% CO2 for 17 days so that a sufficient level of TurboFP635 expression was obtained. For observation, the slice in PBS was taken out from the incubator and observed under the microscope. Figure 6 shows the typical image taken with the laser power of 8 mW at the sample.
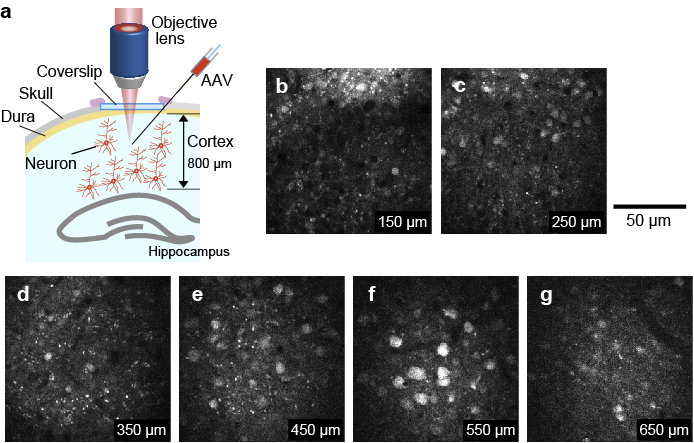
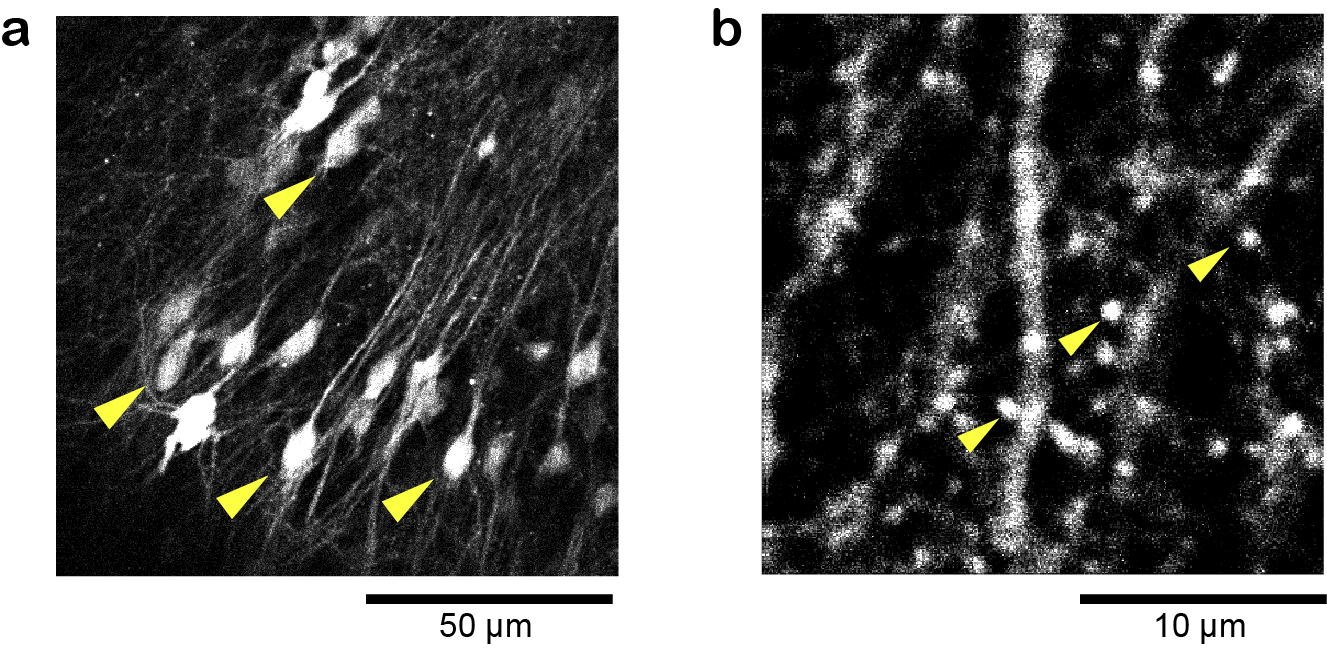
To demonstrate the capability of in vivo imaging by the 1.8 µm laser, we performed 3-photon in vivo imaging of the mouse brain. To label excitatory neurons of the cortex with TurboFP636, adeno-associated virus (AAV) encoding CaMKII promoter-TurboFP635-WPRE3 (CaMKII promoter, TurboFP635, and WPRE3 were gifts from M. Ehlers, S. Sampson (Addgene plasmid #78314) [12], and BK. Kaang (Addgene plasmid #61463) [13], respectively) was prepared as described previously [11]. AAV was injected into the S1 region of the cortex at a depth of approximately 200, 400, 600, 800, 1000 µm from the surface of the cortex as described previously [11]. We typically waited about two weeks after AAV injection until a sufficient level of TurboFP635 expression was obtained. For the imaging, the cortical region in a mouse anesthetized with 1% isoflurane was observed. We acquired a 700-µm-deep stack, taken with 2 µm depth increments with ten frames averaging for single-frame acquisition (Fig. 7). The average laser power required for 3-photon excitation at the surface and 800 µm is 10 and 70 mW, respectively. During the image acquisition from 800 µm to the brain surface, the excitation laser powers were manually adjusted so that the image intensity was approximately the same. We successfully observed neurons at a depth of 650 µm (Fig. 7d). The images were processed by ImageJ (National Institutes of Health; Bethesda, MD, USA).
4 Four-photon (4P) microscopy
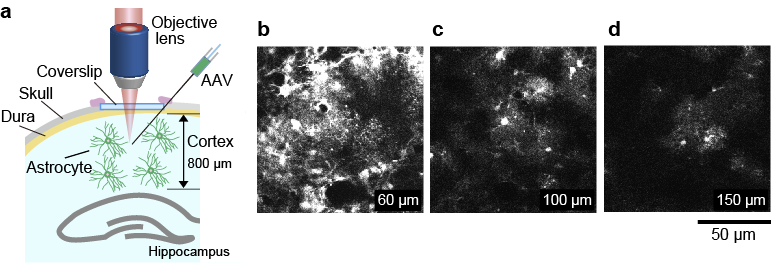
We also performed 4-photon in vivo imaging of astrocytes in the cortex at 1.8 µm. To label astrocytes with Clover, adeno-associated virus (AAV) encoding gfaB1CD promoter-Clover-WPRE3 (gfaB1CD is a gift from B. Khakh, Addgene plasmid 44330) was injected into the S1 region of the cortex at a depth of approximately 200, 500, 1000 µm from the surface of the cortex as described above. We acquired a 150-µm-deep stack, taken with 2 µm depth increments with ten frames averaging for single-frame acquisition (Fig. 8). The average laser power required for 4-photon excitation at the surface and 150 µm is 70 and 80 mW, respectively. During the image acquisition from 150 µm to the brain surface, the excitation laser powers were manually adjusted so that the image intensity was approximately the same. We successfully observed individual astrocytes at a depth of 150 µm (Fig. 8d).
5 Conclusion
We have successfully built a 1.8 µm fiber laser system with commercially available standard components and lasers. There are no custom-designed components in the system. The pulse duration becomes shorter than 150 fs with a pulse energy of 1 µJ. We applied the laser for 3P and 4P microscopy and successfully observed TurboFP635-expressing cortical neurons at 0.7 mm depth with 3-photon excitation and Clover-expressing astrocytes at 0.15 mm depth with 4-photon excitation.
The performance of the laser system is not as high as the optical parametric amplifier pumped by several tens of watt ytterbium fiber lasers. However, our system costs much less than such laser systems. In addition, our system does not require delay-sensitive parts, i.e., all amplifications are on a single line. Another benefit of the system is the scalability of the repetition rate. While optical parametric amplifiers require several hundred watts of power to achieve repetition rates above 10 MHz, our system only needs to change the frequency of the pulse picker and increase the power of the cw laser pumping the final amplifier. It is much easier than increasing the power of the femtosecond pump laser for the optical parametric amplifier. This feature would be crucial to realize photon counting based fluorescence lifetime imaging by 3- or 4-photon excitation. We show that the pulse with a duration of 150 fs is enough for in vivo 3P and 4P microscopy. Thus, we believe that our system can be an alternative to the optical parametric amplifier system.
Funding Core Research for Evolutional Science and Technology (CREST) (JPMJCR17N5), Frontier Photonic Sciences Project of National Institutes of Natural Sciences (NINS), The Naito Foundation, MEXT/JSPS KAKENHI (22H02724, 22H05549, 21H05703, JP22H04926).
Acknowledgments The authors would like to thank Kazuhiko Ogawa of FiberLabs Inc., who provided the ZBLAN fibers used for the oscillator and fiber amplifier. In addition, they gave us many insightful comments and suggestions.
Disclosures The authors declare no conflicts of interest.
Data availability Data underlying the results presented in this paper are not publicly available at this time but may be obtained from the authors upon reasonable request.
References
- [1] V. E. Centonze and J. G. White, “Multiphoton excitation provides optical sections from deeper within scattering specimens than confocal imaging,” \JournalTitleBiophys. J. 75, 2015–2024 (1998).
- [2] W. R. Zipfel, R. M. Williams, and W. W. Webb, “Nonlinear magic: multiphoton microscopy in the biosciences,” \JournalTitleNat. Biotechnol. 21, 1369–1377 (2003).
- [3] T. Wang, D. G. Ouzounov, C. Wu, N. G. Horton, B. Zhang, C.-H. Wu, Y. Zhang, M. J. Schnitzer, and C. Xu, “Three-photon imaging of mouse brain structure and function through the intact skull,” \JournalTitleNature Methods 15, 789–792 (2018).
- [4] Y. Hontani, F. Xia, and C. Xu, “Multicolor three-photon fluorescence imaging with single-wavelength excitation deep in mouse brain,” \JournalTitleScience Advances 7 (2021).
- [5] N. G. Horton, K. Wang, D. Kobat, C. G. Clark, F. W. Wise, C. B. Schaffer, and C. Xu, “In vivo three-photon microscopy of subcortical structures within an intact mouse brain,” \JournalTitleNat. Photon. 7, 205–209 (2013).
- [6] G.-J. Bakker, S. Weischer, J. Ferrer Ortas, J. Heidelin, V. Andresen, M. Beutler, E. Beaurepaire, and P. Friedl, “Intravital deep-tumor single-beam 3-photon, 4-photon, and harmonic microscopy,” \JournalTitleeLife 11, e63776 (2022).
- [7] Y. Nomura, H. Murakoshi, and T. Fuji, “Short-wavelength, ultrafast thulium-doped fiber laser system for three-photon microscopy,” \JournalTitleOSA Continuum 3, 1428–1435 (2020).
- [8] T. A. Pologruto, B. L. Sabatini, and K. Svoboda, “ScanImage: Flexible software for operating laser scanning microscopes,” \JournalTitleBiomedical Engineering Online 2, 13 (2003).
- [9] D. Shcherbo, E. M. Merzlyak, T. V. Chepurnykh, A. F. Fradkov, G. V. Ermakova, E. A. Solovieva, K. A. Lukyanov, E. A. Bogdanova, A. G. Zaraisky, S. Lukyanov, and D. M. Chudakov, “Bright far-red fluorescent protein for whole-body imaging,” \JournalTitleNature Methods 4, 741–746 (2007).
- [10] A. J. Lam, F. St-Pierre, Y. Gong, J. D. Marshall, P. J. Cranfill, M. A. Baird, M. R. McKeown, J. Wiedenmann, M. W. Davidson, M. J. Schnitzer, R. Y. Tsien, and M. Z. Lin, “Improving fret dynamic range with bright green and red fluorescent proteins,” \JournalTitleNature Methods 9, 1005–1012 (2012).
- [11] A. C. E. Shibata, H. H. Ueda, K. Eto, M. Onda, A. Sato, T. Ohba, J. Nabekura, and H. Murakoshi, “Photoactivatable camkii induces synaptic plasticity in single synapses,” \JournalTitleNature Communications 12, 751 (2021).
- [12] J. M. Mouton, S. Helaine, D. W. Holden, and S. L. Sampson, “Elucidating population-wide mycobacterial replication dynamics at the single-cell level,” \JournalTitleMicrobiology 162, 966–978 (2016).
- [13] J.-H. Choi, N.-K. Yu, G.-C. Baek, J. Bakes, D. Seo, H. J. Nam, S. H. Baek, C.-S. Lim, Y.-S. Lee, and B.-K. Kaang, “Optimization of aav expression cassettes to improve packaging capacity and transgene expression in neurons,” \JournalTitleMolecular Brain 7, 17 (2014).