JWST Identification of Extremely Low C/N Galaxies with [N/O] at
Evidencing the Early CNO-Cycle Enrichment and a Connection with Globular Cluster Formation
Abstract
We present chemical abundance ratios of 70 star-forming galaxies at –10 observed by the JWST/NIRSpec ERO, GLASS, and CEERS programs. Among the 70 galaxies, we have pinpointed 2 galaxies, CEERS_01019 at and GLASS_150008 at , with extremely low C/N ([C/N]), evidenced with C iii]1907,1909, N iii]1750, and N iv]1483,1486, which show high N/O ratios ([N/O]) comparable with the one of GN-z11 regardless of whether stellar or AGN radiation is assumed. Such low C/N and high N/O ratios found in CEERS_01019 and GLASS_150008 (additionally identified in GN-z11) are largely biased towards the equilibrium of the CNO cycle, suggesting that these 3 galaxies are enriched by metals processed by the CNO cycle. On the C/N vs. O/H plane, these 3 galaxies do not coincide with Galactic Hii regions, normal star-forming galaxies, and nitrogen-loud quasars with asymptotic giant branch stars, but globular-cluster (GC) stars, indicating a connection with GC formation. We compare C/O and N/O of these 3 galaxies with those of theoretical models, and find that these 3 galaxies are explained by scenarios with dominant CNO-cycle materials, i.e. Wolf-Rayet stars, supermassive () stars, and tidal disruption events, interestingly with a requirement of frequent direct collapses. For all the 70 galaxies, we present measurements of Ne/O, S/O, and Ar/O, together with C/O and N/O. We identify 4 galaxies with very low Ne/O, , indicating abundant massive () stars.
1 Introduction
Chemical abundance ratios of the inter-stellar medium (ISM) in early galaxies are crucial to understanding stellar nucleosynthesis. Local dwarf star-forming galaxies have -to-oxygen (/O) ratios such as neon-to-oxygen (Ne/O) that are around solar abundances and remain mostly constant for their gas-phase metallicity (e.g., Izotov et al., 2006; Kojima et al., 2021; Isobe et al., 2022). These findings suggest that the majority of elements are produced by massive stars evolving into core-collapse supernovae (CCSNe) and/or hypernovae (HNe; e.g., Nomoto et al. 2013). On the other hand, nitrogen-to-oxygen (N/O) ratios of star-forming galaxies increase with metallicity (e.g., Izotov et al., 2006; Pilyugin et al., 2012; Kojima et al., 2021; Isobe et al., 2022), thought to originate from primary oxygen production by massive stars and secondary nitrogen production by low and intermediate-mass metal-rich stars evolving to asymptotic giant branch (AGB) stars (e.g., Vincenzo et al., 2016). Similarly, carbon-to-oxygen (C/O) ratios of star-forming galaxies increase with metallicity due to massive stars and AGB stars (e.g., Berg et al., 2019).
Before the arrival of the James Webb Space Telescope (JWST), these kinds of chemical abundance studies were restricted to at most intermediate redshifts, even with stacking analysis (Steidel et al., 2016) or lensed objects (e.g., Kojima et al., 2017). However, Near Infrared Spectrograph (NIRSpec) on JWST can spectroscopically observe a near-infrared (NIR) wavelength range of 1–5 m 10–1000 times more deeply than other spectrographs. This great advancement has led to several emission line detections of high-redshift () galaxies in restframe ultraviolet (UV) to optical ranges, which are vital for chemical abundance measurements. Shortly after Early Release Observations (ERO; Pontoppidan et al. 2022; PID: 2736) became public, Arellano-Córdova et al. (2022) have reported Ne/O ratios of 3 ERO galaxies and the C/O ratio of one ERO galaxy at . The 3 and 1 galaxies have Ne/O and C/O ratios comparable to those of local galaxies at a given metallicity, respectively.
However, Jones et al. (2023) have found that a galaxy observed by the GLASS-JWST Early Release Science (ERS) program (hereafter GLASS; Treu et al. 2022; PID: 1324) has a very low value of . As the low C/O value is consistent with those expected from yields of pure core-collapse supernovae (Nomoto et al., 2013), Jones et al. (2023) have interpreted the galaxy as having a young chemical composition where carbon production by AGB stars is negligible.
Moreover, GN-z11 at , photometricly identified by Oesch et al. (2016) and spectroscopically confirmed by the JWST Advanced Deep Extragalactic Survey (JADES; Bunker et al. 2023), has a super-solar value of (Cameron et al., 2023; Senchyna et al., 2023), which is significantly higher than those of local galaxies at a given metallicity. Given the ultra-high redshift of corresponding to 440 Myr after the Big Bang, nitrogen production by AGB stars is difficult to explain the N/O enhancement of GN-z11 (e.g., Cameron et al., 2023). Since the report, several studies have been trying to explain the high N/O ratio of GN-z11 (see Section 4.3 for more details). However, it remains unknown whether there is another galaxy with super-solar N/O ratios at high redshift. The carbon-nitrogen (C/N) ratio has also not been studied, although it is usually assumed that both carbon and nitrogen originate from AGB stars.
Furthermore, given that chemical evolution models (Watanabe et al., 2023) predict significant changes of Ne/O ratios from the solar abundances at the early formation phase (more details in Section 5.2), Ne/O ratios potentially evolve toward higher redshifts.
The aim of this paper is to study the neon, carbon, nitrogen, and oxygen abundances of high- galaxies using data from the NIRSpec public surveys to characterize the nature of star formation at high redshifts. This paper is organized as follows. Section 2 explains the data and sample we use. Our analysis is described in Section 3. We report and discuss our results of nitrogen, carbon, and oxygen abundances in Sections 4. Results and discussions of Ne/O ratios are described in 5. Our findings are summarized in Section 6. We assume a standard CDM cosmology with parameters of (, , ) = (0.3, 0.7, 70 km ). Throughout this paper, we use the solar abundance ratios of Asplund et al. (2021). The notation [A/B] is defined as subtracted by the solar abundance .
2 Data and Sample
We utilize JWST/NIRSpec data from the Early Release Observations (ERO; Pontoppidan et al. 2022), taken in the SMACS 0723 lensing cluster field (hereafter referred to as ERO data), the GLASS survey (Treu et al. 2022; hereafter referred to as GLASS data), and the CEERS survey (Finkelstein et al. 2022; hereafter referred to as CEERS data). The ERO data were acquired using medium-resolution () filter-grating pairs of F170LP-G235M and F290LP-G395M, covering the wavelength ranges of 1.7–3.1 and 2.9–5.1 m, respectively. The total exposure time for the ERO data is 4.86 hours for each filter-grating pair. The GLASS data were collected using high-resolution () filter-grating pairs of F100LP-G140H, F170LP-G235H, and F290LP-G395H, covering the wavelength ranges of 1.0–1.6, 1.7–3.1, and 2.9–5.1 m, respectively. The total exposure time for the GLASS data is 4.9 hours for each filter-grating pair. The CEERS data were obtained using medium-resolution filter-grating pairs of F100LP-G140M, F170LP-G235M, and F290LP-G395M, covering the wavelength ranges of 1.0–1.6, 1.7–3.1, and 2.9–5.1 m, respectively. The total exposure time for the CEERS data is 0.86 hours for each filter-grating pair.
We use spectroscopic data that has been reduced by Nakajima et al. (2023). Nakajima et al. (2023) have extracted the raw data from the MAST archive and performed level-2 and 3 calibrations using the JWST Science Calibration Pipeline (ver.1.8.5; Bushouse et al. 2022) with the reference file jwst_1028.pmap, whose flux calibration is based on in-flight flat data. Checking the data, we identify 5, 15, and 50 galaxies at in the ERO, GLASS, and CEERS data, respectively. We refer to these 70 () galaxies as our sample galaxies, hereafter.
3 Analysis
3.1 Flux Measurement
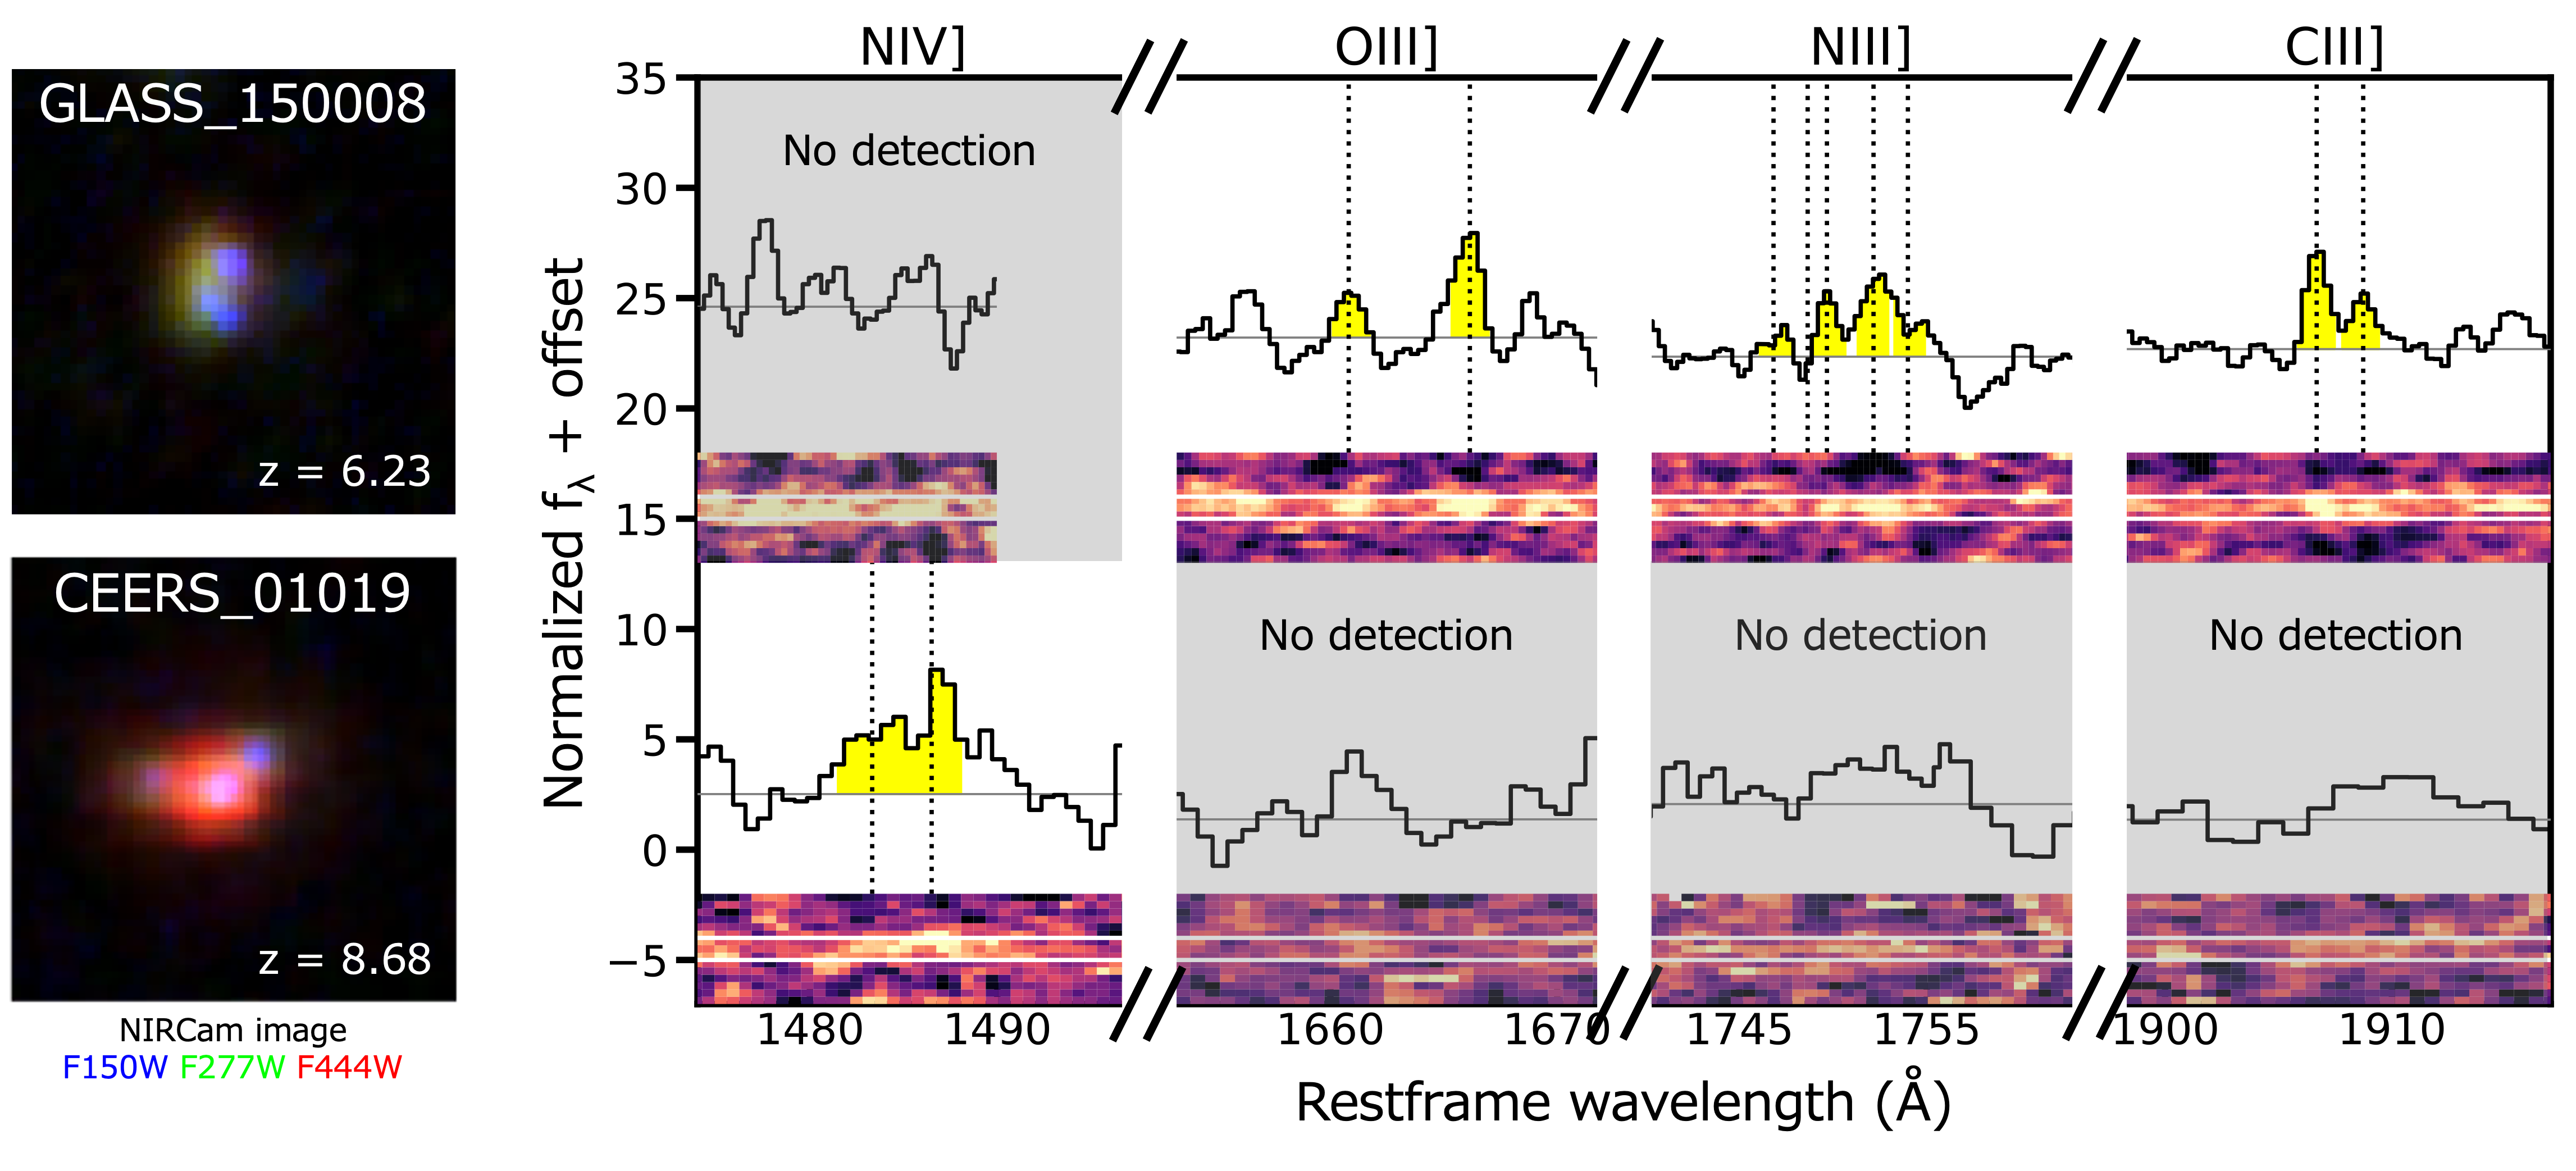
We measure emission-line fluxes by fitting a Gaussian function convolved by line-spread functions that Isobe et al. (2023) have derived from in-flight NIRSpec data of a planetary nebula (PI: J. Muzerolle; PID: 1125). To measure weak emission lines accurately, we fix redshift and velocity dispersion of the Gaussian function to those of [O iii]4959,5007. To derive Ne/O, C/O, and N/O ratios, we explore the following line detections: [Ne iii]3869 (for neon abundance), C iii]1907,1909 (for carbon abundance), N iii]1750111We refer to the quintet of N iii] lines at restframe 1747, 1749, 1750, 1752, and 1754 Å as N iii]1750 in this paper. and N iv]1483,1486 (for nitrogen abundance), [O ii]3727,3729, [O iii]5007, and O iii]1661,1666 (for oxygen abundance), [O iii]4363 (for electron temperature ), and Balmer lines of H, H, and H (for hydrogen abundance and dust correction). Hereafter, we just write [Ne iii], C iii], N iii], N iv], [O ii], [O iii], and O iii] as meaning [Ne iii]3869, C iii]1907,1909, N iii]1750, N iv]1483,1486, [O ii]3727,3729, [O iii]5007, and O iii]1661,1666, respectively, for simplicity. Thirty-five and 7 of our sample galaxies have detections of [Ne iii] and C iii], respectively. We find that one of our sample galaxies, GLASS_150008, has a detection of N iii] with . We also identify the detection of N iv] () from one of our sample galaxies, CEERS_01019, which has also been reported by Larson et al. (2023).
Figure 1 shows JWST/NIRCam images222The imaging data of GLASS_150008 are drawn from the UNCOVER (Bezanson et al., 2022) website (https://jwst-uncover.github.io/), while the imaging data of CEERS_01019 are taken from the CEERS survey (Finkelstein et al., 2022) and reduced by Harikane et al. (2023b). and spectra around N iv], O iii], N iii], and C iii] of GLASS_150008 and CEERS_01019. The O iii], N iii], and C iii] of GLASS_150008 and the N iv] of CEERS_01019 have the ratios larger than 4. We note that GLASS_150008 has the ratio of each line flux in the N iii]1750 quintet to the total flux of the quintet in agreement within a 1 error level with that based on the electron density of cm-3 derived from the observed high C iii]1907/C iii]1909 ratio.
3.2 Emission-line Diagnostics
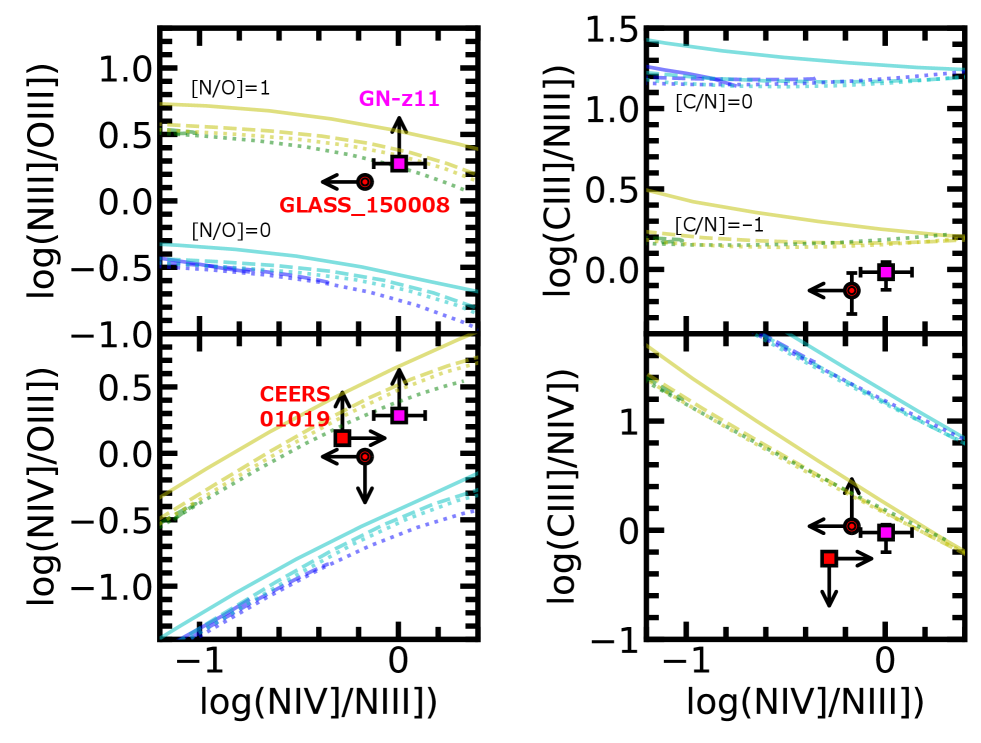
The left panels of Figure 2 compare N iii]/O iii] and N iv]/O iii] ratios of GLASS_150008 (double red circle) and CEERS_01019 (red square) with those of GN-z11 (magenta square) as a function of N iv]/N iii]. The N iii] and N iv] fluxes from Maiolino et al. (2023) and the O iii] upper limit from Bunker et al. (2023)333Originally reported as upper limit in Bunker et al. (2023) but converted to upper limit for consistency with our flux measurements in Section 3.1. are scaled by C iii] lines. We find that GLASS_150008 and CEERS_01019 have high N iii]/O iii] and N iv]/O iii] ratios, respectively, both of which are comparable to those of GN-z11, which is reported to have a super-solar N/O ratio (Section 1). The right panels of Figure 2 also show that GLASS_150008 and CEERS_01019 have low C iii]/N iii] and C iii]/N iv] ratios, respectively, both of which are comparable to those of GN-z11.
To compare the observed emission-line ratios, we construct photoionization models using Cloudy (Ferland et al., 2013) for both stellar and AGN radiations. To model young star-forming galaxies, we use BPASS (Stanway & Eldridge, 2018) binary stellar radiations under the assumptions of the instantaneous star-formation history with the stellar age of 10 Myr, upper star mass cut of 100 with the Salpeter (1955) initial mass function (IMF), and the hydrogen density of 300 cm-3. The value is inferred from a typical value of the electron density () of cm-3 in the ISM of galaxies (Isobe et al., 2023). We also fix He/H and metal-to-oxygen ratios to be the solar abundances. We vary O/H and ionization parameter () values within the ranges of O/H and in 0.25 and 0.25 increments, respectively. We set the stellar metallicity equal to the nebular metallicity defined by the O/H ratio. We refer to this model as the young stellar model, hereafter. We also construct the photoionization models for extremely young star-forming galaxies with very massive stars (extremely young massive stellar model, hereafter), assuming the stellar age of 1 Myr and upper star mass cut of 300 . The other parameters are the same as those of the young stellar model. We also compute the stellar photoionization models with [N/O, whose other parameters are the same as those of the young stellar model and extremely young massive stellar model.
We also construct AGN photoionization models whose incident radiation is parameterized by the following 4 parameters: the big-bump temperature , the X-ray to UV ratio , the low-energy slope of the big-bump component , and the X-ray component slope . Typical AGNs have (Zamorani et al., 1981) and (Francis, 1993; Elvis et al., 1994). We refer to the AGN model with the parameter set of K, , , and as the default AGN model. The flux density per frequency is expressed by:
| (1) |
where is a coefficient corresponding to and is an infrared cutoff temperature at Ryd. The continuum above 100 keV is also assumed to cut off by . Using the AGN radiation, we calculate emission line ratios under the assumption of cm-3. We vary O/H, , and N/O within the ranges of O/H, , N/O, and C/O in 0.25, 0.25, 1, and 1 increments, respectively. We also fix He/H and metal-to-oxygen ratios other than N/O to be the solar abundances. Note that different assumptions of from 10 to cm-3 can change key emission-line ratios of N iii]/O iii], C iii]/O iii]. and C iii]/N iii] by only dex.
In Figure 2, we plot the young stellar models with [N/O and [C/N in blue, the defalut AGN models with [N/O and [C/N in cyan, the young stellar models with [N/O and [C/N in green, and the default AGN models with [N/O and [C/N in yellow. We find that the high N iii]/O iii] ratios of GLASS_150008 and GN-z11, as well as the high N iv]/O iii] ratios of CEERS_01019 and GN-z11, are larger than those predicted by both the young stellar model and the default AGN model with [N/O (blue and cyan). Similarly, the low C iii]/N iii] and C iii]/N iv] ratios in the 3 galaxies are comparable to those of the models with [C/N (green and yellow). These results indicate that the 3 galaxies have very high N/O and low C/N ratios significantly above and below the solar abundance, respectively. These results are not likely affected by the metallicity changes from (blue) to 0.25 (red) as shown in Figure 2, while for accuracy, we derive metallicities first in Sections 3.3 and 3.5.
3.3 Nebular Property
We derive color excesses from Balmer line ratios of H/H, H/H, and H/H as many as possible by assuming the dust attenuation curve of Calzetti et al. (2000) and the case B recombination. Intrinsic values of the Balmer line ratios are calculated by PyNeb (Luridiana et al. 2015; v1.1.15). If none of the above Balmer line ratios are available, we use a median value of for the other galaxies in our sample. Using the values and Calzetti et al. (2000)’s curve, we correct emission-line ratios for dust attenuation.
For the 9 galaxies with the measurements of electron temperatures of O iii () by Nakajima et al. (2023), we use the values and their errors. In addition, we derive (O iii) values of 5 galaxies with [O iii]4363 and/or O iii]1666. The other galaxies in our sample are assumed to have (O iii K with 1 uncertainty of 5000 K. We calculate (O ii) from (O iii) and the empirical relation of Garnett (1992). We assume values to be 300 cm-3.
We derive O+/H+ from [O ii]/H and (O ii) and O2+/H+ from [O iii]4959,5007/H and (O iii). In our sample galaxies where only [O ii] upper limits are present, we presume the smallest values of [O ii] fluxes to be the ones obtained from [O iii] under the assumption of . For these galaxies, we also suppose the true and maximum values of [O ii] fluxes to be their 1 and 3 upper limits, respectively. For our sample galaxies where [O ii] falls outside the wavelength coverage of NIRSpec, we assume the true [O ii] fluxes of the galaxies to be [O iii] divided by a median [O iii]/[O ii] ratio of the other galaxies in our sample. The minimum and maximum values are assumed to be [O iii] divided by [O iii]/[O ii] at and , respectively. We then obtain gas-phase metallicity from the equation by ignoring neutral oxygen and O3+ and higher-order oxygen ions as in e.g., Izotov et al. (2006).
We include errors of the used fluxes as well as uncertainties of the assumptions of and [O ii] for some of our sample galaxies into errors by Monte Carlo simulations. We derive 1000 values of with and flux values such as [O ii] randomly fluctuated by their errors under the assumption of the normal distribution. Then, we derive the 16th and 84th percentiles of the distribution of the 1000 values as the confidence interval of . We note that we cannot measure of 7 galaxies in our sample due to the lack of H. The derived , , and values are summarized in Table 3. We have confirmed that our derived values of GLASS_150008 and CEERS_01019 are consistent with those measured by Jones et al. (2023) and Larson et al. (2023) based on the stellar radiation within a error level, respectively.
We also estimate of GN-z11 in a similar way to our sample galaxies. However, we use [O iii]4363 instead of [O iii]5007, which is outside the NIRSpec wavelength coverage in the case of GN-z11. We assume K and cm-3. We estimate , , O+/H, and O2+/H from the observed H/H, [O iii]/[O ii], [O ii]/H, and [O iii]/H ratios, respectively. The H/H ratio is taken from Maiolino et al. (2023), while the other line ratios are taken from Bunker et al. (2023). We obtain , which is consistent with that derived by Cameron et al. (2023) and Senchyna et al. (2023) based on the stellar radiation within a error level.
3.4 Abundance Ratio Based on Stellar Radiation
| Ion | Emission process | Transition probability | Collision Strength |
|---|---|---|---|
| (1) | (2) | (3) | (4) |
| H0 | Re | Storey & Hummer (1995) | — |
| C2+ | CE | Wiese et al. (1996) | Berrington et al. (1985) |
| N2+ | CE | Galavis et al. (1998) | Blum & Pradhan (1992) |
| O+ | CE | Froese Fischer & Tachiev (2004) | Kisielius et al. (2009) |
| O2+ | CE | Froese Fischer & Tachiev (2004) | Storey et al. (2014)† |
| Ne2+ | CE | Froese Fischer & Tachiev (2004) | McLaughlin & Bell (2000) |
| Ar2+ | CE | Munoz Burgos et al. (2009) | Munoz Burgos et al. (2009) |
| S+ | CE | Rynkun et al. (2019) | Tayal & Zatsarinny (2010) |
| ID | Rad. | |||||
|---|---|---|---|---|---|---|
| (1) | (2) | (3) | (4) | (5) | (6) | (7) |
| GLASS_150008 | stellar | |||||
| CEERS_01019 | stellar | |||||
| 8.23–8.50 | – | AGN | ||||
| GN-z11 | stellar | |||||
| 8.58–9.23 | – | AGN |
We derive Ne/O, C/O, and N/O ratios from ionic abundance ratios with similar ionization energies of Ne2+/O2+, C2+/O2+, and N2+/O2+ to minimize systematics of ionization correction factors (ICFs). We calculate Ne2+/O2+ ratios from [Ne iii]/[O iii] ratios. For GLASS_150008 and GN-z11 with the O iii] detection, we use C iii]/O iii] and N iii]/O iii] ratios to obtain C2+/O2+ and N2+/O2+ ratios with less systematics. For the other galaxies in our sample, we calculate C2+/O2+ and N2+/O2+ ratios from [O iii] lines. We calculate these ionic abundance ratios using PyNeb with the same transition probabilities and collision strengths listed in Table 1.
To derive chemical abundance ratios (Ne/O, C/O, and N/O) from the ionic abundance ratios (Ne2+/O2+, C2+/O2+, and N2+/O2+), we extract ICFs from the young stellar model (Section 3.2). We have checked that our ICFs provide Ne/O and C/O ratios consistent with those based on Izotov et al. (2006) and Berg et al. (2019)’s ICFs, respectively. We have also confirmed that ICF(Ne2+/O2+), ICF(C2+/O2+), and ICF(N2+/O2+) of all our sample galaxies are . In addition, the extremely young massive stellar model provides Ne/O, C/O, and N/O values similar to those of the young stellar model. We derive the errors of the Ne/O, C/O, and N/O ratios by Monte Carlo simulations in the same way as for (Section 3.3). For our sample galaxies without the detections of [Ne iii], C iii], or N iii], we use upper limits of these lines to obtain upper limits of Ne/O, C/O, or N/O ratios. We list the derived abundance ratios in Table 3, while those of GLASS_150008, CEERS_01019, and GN-z11 are highlighted in Table 2. All the 3 galaxies have super-solar N/O values under the assumption of the stellar radiation.
3.5 Abundance Ratio Based on AGN Radiation
3.5.1 AGN Possibility
For accuracy of the abundance ratio measurements, we discuss the AGN possiblity of GLASS_150008, CEERS_01019, and GN-z11. First, GLASS_150008 does not have very high ionization lines that require the presence of AGN. We have also checked that GLASS_150008 does not have a clear broad component in the H line profile. We thus conclude that GLASS_150008 does not have AGN signatures at least in the current data set.
Contrary to GLASS_150008, Larson et al. (2023) have reported that CEERS_01019 with the N iv] detection has an H broad component with the full-width half maximum of km s-1, which can be an evidence of AGN. Maiolino et al. (2023) have also reported that GN-z11 has a detection of [Ne iv]2422,2424 lines that require high-energy photons beyond 63.5 eV, which can also suggest that GN-z11 is an AGN.
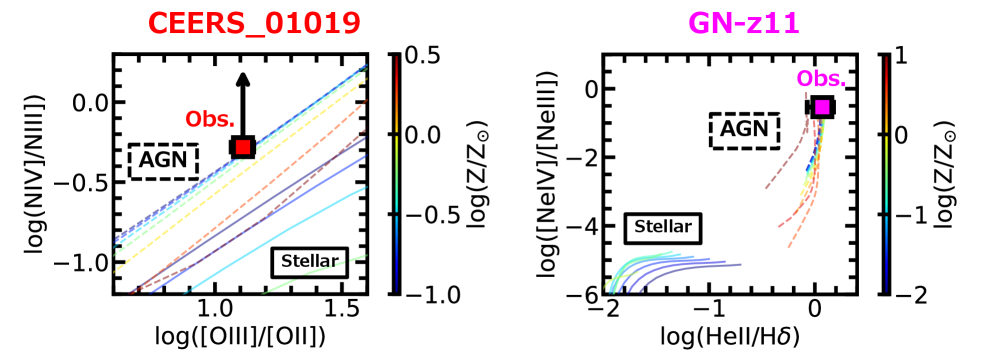
Here, we check if emission line ratios of CEERS_01019 and GN-z11 cannot be reproduced by the BPASS stellar photoionization models. The solid curves in Figure 3 represent predicted emission line ratios of the extremely young massive stellar model. The model contains very massive stars up to 300 , which are expected to produce harder radiation than normal stellar populations. However, we confirm that even the extremely young massive stellar model cannot reproduce the observed N iv]/N iii] and [O iii]/[O ii] relation of CEERS_01019 (red square) or the observed [Ne iv]2422,2424/[Ne iii] and N iv]/N iii] relation of GN-z11 (magenta square; Maiolino et al. 2023). We can say that it is difficult to reproduce the observed emission lines of CEERS_01019 and GN-z11 with the BPASS models.
This does not necessarily mean that all stellar photoionization models fail to reproduce the observed emission lines of CEERS_01019 or GN-z11. For example, Marques-Chaves et al. (2023) claim that the observed high N iv]/N iii] ratio of CEERS_01019 can be explained by the 3MdB stellar photoionization model (Morisset et al., 2015). However, as shown by the color-coded dashed lines in Figure 3, we find that CEERS_01019 has the lower limit of N iv]/N iii] and the [O iii]/[O ii] ratio simultaneously reproduced by the default AGN model. We also find that both [Ne iv]/[Ne iii] and He ii/H ratios of GN-z11 measured by Maiolino et al. (2023) are reproduced by the default AGN model except for (low- AGN model, hereafter). These results indicate the presence of AGN models that consistently reproduce the observed high ionization lines.
3.5.2 Abundance Ratio Re-estimation of CEERS_01019
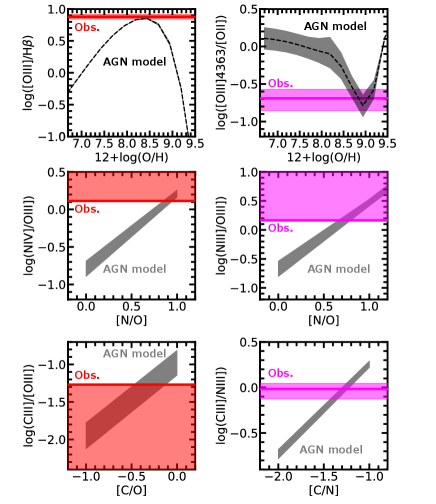
Then, we re-estimate and N/O of CEERS_01019 by using these AGN models. The middle left panel of Figure 4 shows the observed [O iii]/H ratio of CEERS_01019 (red solid line; 1 uncertainty is shown by the red shaded region) and those predicted by the default AGN models with the value derived from the observed [O iii]/[O ii] ratio (gray dashed line; 1 uncertainty based on the observed [O iii]/[O ii] uncertainty is shown by the gray shaded region) as a function of . Note that [O iii]/H values slightly decrease with increasing N/O. With the default AGN models with [N/O, we find that the observed and model-predicted [O iii]/H ratios agree with each other at –8.50. We then derive the N/O ratio of CEERS_01019 by comparing the observed lower limit of N iv]/O iii] with those predicted by the default AGN models with the metallicity range of –8.50, based on the observed [O iii]/[O ii] ratio, and different N/O ratios. We find that the observed lower limit of N iv]/O iii] favors the model with the super-solar value of (i.e., ).
We derive C/O and Ne/O ratios of CEERS_01019 from C iii]/[O iii] and [Ne iii]/[O iii] ratios in the same way as for the N/O ratio, using the default AGN models with –8.50 and [N/O. We obtain [C/O and [Ne/O–0.15, and our derived C/O and N/O ratios provide a low value of [C/N (i.e., ). Note that we can obtain a more strict upper limit of [C/N based on the C iii]/N iv] ratio. The observed ratios among N iii], N iv], and C iii] lines are simultaneously reproduced by the default AGN model with –8.50, , and [C/N.
3.5.3 Abundance Ratio Re-estimation of GN-z11
We derive and N/O of GN-z11 in the similar way to CEERS_01019, while we use the low- AGN model, N iv]/N iii] (Maiolino et al., 2023) as an indicator of , the [O iii]4363/[O ii] (Bunker et al., 2023) for the metallicity measurement, and the lower limit of N iii]/O iii] (Maiolino et al., 2023; Bunker et al., 2023) for the N/O measurement. Using the H/H ratio of Maiolino et al. (2023), we derive under the assumption of K and Calzetti et al. (2000)’s dust attenuation curve. We obtain –9.21, which is higher than those based on the stellar radiation and [O iii]4363 of –8.60 (Cameron et al., 2023), (Senchyna et al., 2023), and our derived value of . This is because the AGN radiation can enhance [O iii]4363, which results in overestimation of .
We derive C/N, C/O, and Ne/O ratios of GN-z11 from C iii]/N iii] (Maiolino et al., 2023), C iii]/O iii] (Maiolino et al., 2023; Bunker et al., 2023), and [Ne iii]/O iii] (Maiolino et al., 2023; Bunker et al., 2023) ratios in the same way as for the N/O ratio, using the low- AGN models with –8.50 and [N/O. We obtain a low value of [C/N–(), [C/O, and [Ne/O (i.e., –, , and ). We have confirmed that the C/N value based on C iii]/N iii] is consistent with that based on C iii]/N iv] within the error level. We summarize the metallicities and the abundance ratios of GLASS_150008, CEERS_01019, and GN-z11 in Table 2.
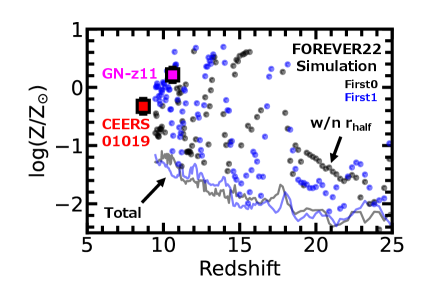
Here, we check whether our derived metallicities of GN-z11 and CEERS_01019 are too high at and 8.68, respectively. Figure 5 compares the metallicity of GN-z11 (magenta square) and CEERS_01019 (red square) based on the AGN radiation with those of First0 (black) and First1 (blue) galaxies of the cosmological hydrodynamics zoom-in simulation FOREVER22 (Yajima et al., 2022a, b). First0 and First1 galaxies have the same initial gas particle masses, dark matter particle masses, and gravitational softening lengths, but slightly different final halo masses of and , respectively (Yajima et al., 2022a). Although the metallicities of the simulated galaxies calculated for the total gas (solid) are lower than that of GN-z11, we find that the simulated galaxies can instantaneously have super-solar metallicities within their half-mass radii ( pc at , where GN-z11 is located). This suggests that it is not very strange even for high- galaxies such as GN-z11 and CEERS_01019 to have high metallicities around the solar value.
4 Nitrogen, Carbon, and Oxygen Abundances
4.1 Result
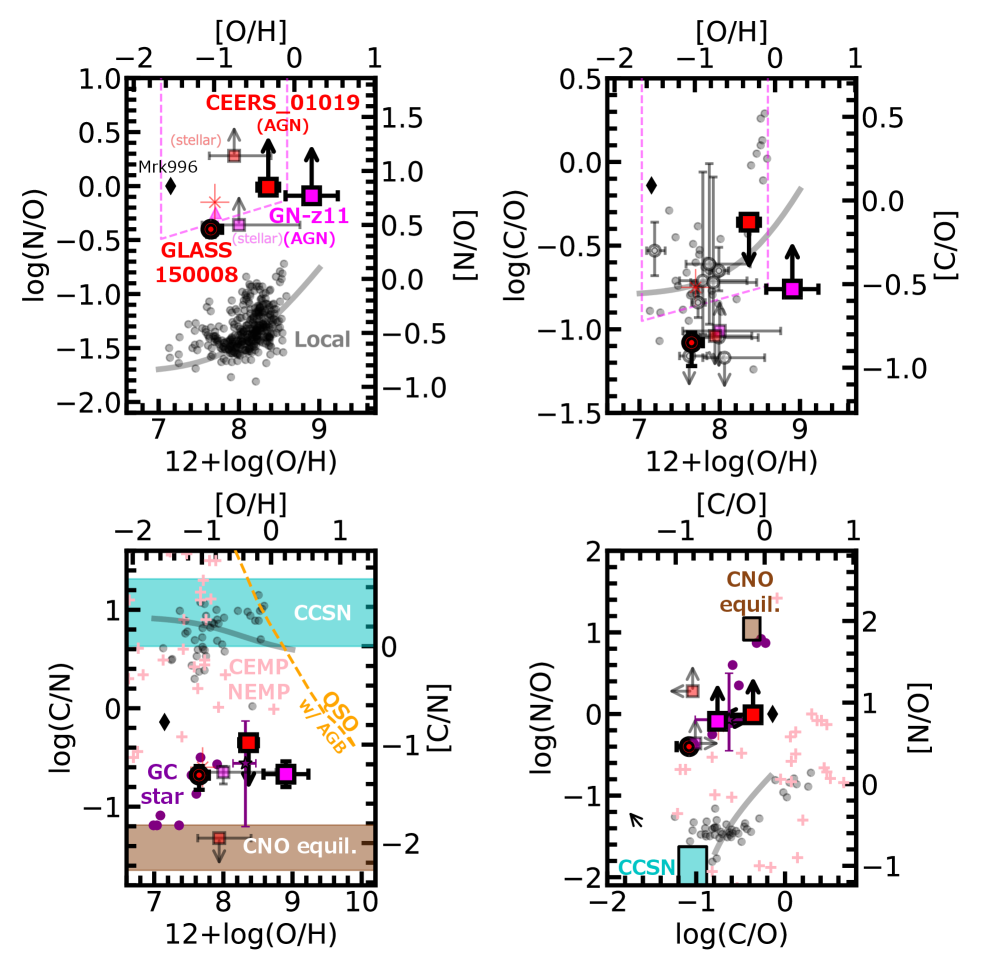
The top left panel of Figure 6 shows N/O ratios as a function of metallicity. We find that GLASS_150008 and CEERS_01019 show [N/O as well as GN-z11. For CEERS_01019 and GN-z11, this conclusion does not change regardless of whether AGN or stellar radiation is assumed. CEERS_01019 and GLASS_150008 are the second and third examples of super-solar N/O galaxies at after the report of GN-z11. Hereafter we refer to these 3 galaxies (CEERS_01019, GLASS_150008, and GN-z11) as JWST N-rich galaxies. The super-solar N/O values are significantly higher than those of typical local dwarf galaxies, Galactic H ii regions (gray dots), and typical Galactic stars (gray curve) at a given , but comparable to that of a Wolf-Rayet galaxy, Mrk996.
Contrary to the high N/O ratios, the top right panel of Figure 6 illustrates that CEERS_01019 (together with many of our sample galaxies in the semi-transparent white circles) has a C/O ratio comparable to those of the typical local galaxies, local stars, and dwarf star-forming galaxies (e.g., Llerena et al., 2022, 2023). GLASS_150008 shows a C/O ratio even lower than those of the typical local galaxies and stars but comparable to some of our sample galaxies.
This discrepancy between the high N/O and low C/O ratios is illustrated by the bottom left panel of Figure 6, which shows the C/N ratios as a function of metallicity. We find that all the JWST N-rich galaxies have [C/N] values less than , which are significantly lower than those of the typical local galaxies and stars. This conclusion is also the case regardless of the assumed radiation.
Such low C/N ratios are expected to be observed in nitrogen-loud quasars (e.g., Batra & Baldwin, 2014), while those O/H ratios have not fully been investigated. Alternatively, we plot a chemical evolution model of Hamann & Ferland (1993) reproducing observed emission-line ratios of quasars. Nitrogen in the model is mainly enriched by AGB stars. Although the quasar model with AGB stars can produce low C/N ratios down to [C/N, it does not reproduce the (relatively-)low O/H ratios of the JWST N-rich galaxies simultaneously. This is because AGB stars require much delay time ( Gyr) to decrease the C/N ratio to [C/N, which increases O/H ratios too much. This result also suggests that the JWST N-rich galaxies are not likely to be nitrogen-loud quasars whose nitrogen is enriched by AGB stars.
The bottom right panel of Figure 6 shows the relations between N/O and C/O. We confirm that the JWST N-rich galaxies have N/O ratios higher than those of the typical local galaxies and stars at a given C/O ratios, which indicate that only nitrogen is selectively enriched in the JWST N-rich galaxies with respect to the typical local galaxies and stars.
4.2 Local Object with Similar C, N, O Abundances
We find that Mrk996, a local metal-poor dwarf star-forming galaxy with a high value of (Senchyna et al., 2023), has a low C/N value similar to the JWST N-rich galaxies (bottom left panel of Figure 6). The bottom right panel of Figure 6 also shows that Mrk996 coincides with the JWST N-rich galaxies on the N/O vs. C/O plane. Mrk996 is known to host WR stars evidenced by the presence of the WR bumps (e.g., Telles et al., 2014). Similar to Mrk996, the JWST N-rich galaxies may also host WR stars.
We also identify some of carbon-enhanced metal-poor (CEMP) stars (Norris et al., 2013) and nitrogen-enhanced metal-poor (NEMP) stars (Beveridge & Sneden, 1994) in the Galactic halo with the C/N vs. O/H and N/O vs. C/O relations comparable to those of the JWST N-rich galaxies as shown by the pink crosses in Figure 6. It should be noted that some of such stars are giants undergoing the conversion of C to N in their hydrogen layers.
Moreover, the purple circles in the bottom panels of Figure 6 indicate dwarf stars in a globular cluster (GC) NGC6752, which have been reported to have high N/O ratios similar to GN-z11 (Senchyna et al., 2023). The purple stars with the error bars also show median and 16th-84th percentile values of the abundance ratios of dwarf stars in a GC 47 Tuc. Carbon and nitrogen abundances of the dwarf stars are drawn from Briley et al. (2004), while the oxygen abundances are taken from D’Orazi et al. (2010). The metallicity of GLASS_150008 is similar to that of the dwarf stars in NGC6752, while CEERS_01019 (GN-z11) has metallicity similar to (or close to) that of the dwarf stars in 47 Tuc. We find that the GC dwarf stars also have low C/N ratios and N/O vs. C/O relations similar to those of the JWST N-rich galaxies. As surface abundance of dwarf stars are likely unevovled, the gas composition at the time of GC formation may also have similar abundance ratios to the JWST N-rich galaxies. This implies that the JWST N-rich galaxies may be progenitors of GCs.
4.3 Origin of Low C/N
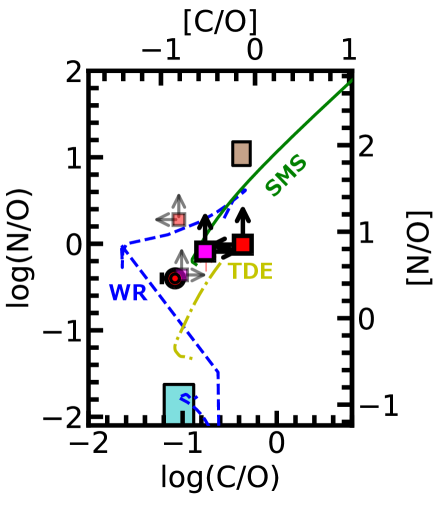
In the bottom panels of Figure 6, we plot the abundance ratios processed by the CNO cycle at the equilibrium state (Maeder et al., 2015) by the brown shaded regions, while core-collapse supernova yields (Watanabe et al., 2023) are shown by the cyan shaded regions. In contrast to the typical local galaxies and stars, we find that the JWST N-rich galaxies have the abundance ratios between those of CCSNe and those of the equilibrium state of the CNO cycle. This suggests that not only CCSNe but also the CNO cycle significantly contribute to the metal enrichment of the JWST N-rich galaxies. Thus, we need scenarios that can enrich gaseous materials originating from the CNO cycle while suppressing oxygen supply by CCSNe in the relatively low-metallicity environments.
In fact, these requirements are met by the scenarios presented to explain nitrogen enrichment of GN-z11 such as Wolf-Rayet (WR) stars (Senchyna et al., 2023; Watanabe et al., 2023), supermassive stars (SMS; Charbonnel et al. 2023; Nagele & Umeda 2023), and tidal disruption events (TDE; Cameron et al. 2023). In all the 3 scenarios, CNO-cycle material can be ejected from the outermost hydrogen-burning layer of stars via stellar winds (for the WR star and SMS scenarios) or gravitational interactions with black holes (for the TDE scenario). Low-metallicity massive stars can also undergo direct collapse (i.e., no ejecta) due to the low opacity of the hydrogen envelope, resulting in a heavier helium core during collapse (Heger et al., 2003). The blue dashed, green solid, and yellow dashed-dotted lines in Figure 7 represent chemical evolution models of WR stars, SMSs, and TDEs, respectively, all of which are constructed by Watanabe et al. (2023) and Watanabe et al. (in prep.). The WR star and SMS models include the yields of WR stars with 25–120 (Limongi & Chieffi, 2018) and SMSs with (Nagele & Umeda, 2023), respectively. The TDE model includes TDE yields calculated by Watanabe et al. (in prep.) with the nucleosynthesis code of Tominaga et al. (2007), assuming the destruction of stars with 9–40 . Note that 100%, 99.99%, and 90% of massive stars are assumed to undergo direct collapse (i.e., no ejecta) in the WR star, SMS, and TDE models, respectively, and that the remaining massive stars explode as CCSNe whose yields are taken from Nomoto et al. (2013). We confirm that all the 3 models can reproduce the observed N/O and C/O ratios of the JWST N-rich galaxies. We have also checked that the N/O and C/O ratios of the wind yields from the SMS (Nagele & Umeda, 2023) are also comparable to those of the JWST N-rich galaxies. These findings suggest the presence of high- galaxies affected by WR stars, SMSs, and/or TDEs with frequent direct collapses.
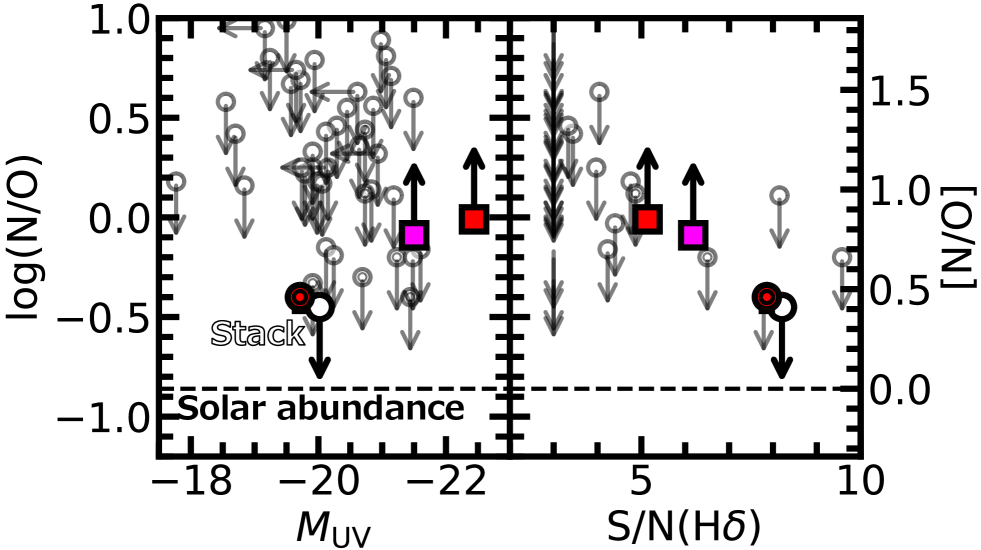
It should be noted that it is unclear that all high- galaxies follow these scenarios with the significant amount of CNO-cycle materials because N/O ratios of the other high- galaxies are not constrained well. Figure 8 shows N/O ratios of our sample galaxies as a function of and ratio of H. The values of our sample galaxies and GN-z11 are taken from Nakajima et al. (2023) and Harikane et al. (2023a), respectively. We find that all of our sample galaxies (semi-transparent white circle) but the JWST N-rich galaxies have poor upper limits above the solar abundance. We also note that all the 3 JWST N-rich galaxies have large values of and/or ratio of H relative to the other galaxies in our sample. These results suggest that we cannot tell whether the other galaxies in our sample have high N/O ratios consistent with the scenarios with dominant CNO-cycle materials, or whether the galaxies have low N/O ratios comparable to those of the CCSN yields, but are not constrained simply because the galaxies are not bright enough and/or the exposure time is not long enough.
We also investigate the typical N/O ratio of high- galaxies by stacking the JWST spectra. We select JWST galaxy spectra with and at –9.4 to cover O iii] and [O iii]. The total number of such spectra reaches . We perform median stacking on the spectra and 100 times bootstrap resampling to estimate the error of the stacked spectrum. We simply fit the Gaussian function to each emission line in the stacked spectrum. We find that neither N iii] nor O iii] is detected in the stacked spectrum. We then estimate an upper limit of the N/O ratio from N iii]/[O iii]. The (opaque) white circle in Figure 8 shows the N/O upper limit, together with the median value of the used galaxies and the ratio of H. We find that the N/O upper limit of the stacked spectrum is still higher than the solar abundance value, which means that we cannot conclude whether even the typical N/O ratio of high- galaxies exceeds the solar abundance.
5 Neon Abundance
5.1 Result
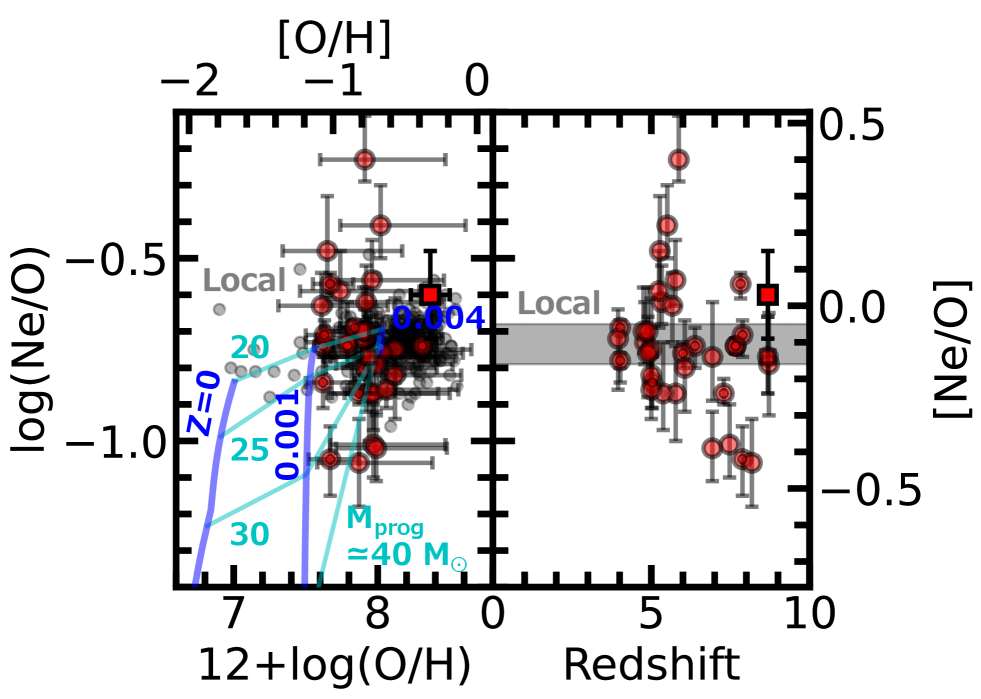
The left panel of Figure 9 shows Ne/O ratios of our sample galaxies (semi-transparent red circle) as a function of . Although the majority of our sample galaxies have Ne/O ratios comparable to those of local dwarf galaxies (gray dot; Izotov et al. 2006; Kojima et al. 2021; Isobe et al. 2022), 4 of our sample galaxies (GLASS_100003, CEERS_00698, CEERS_01143, and CEERS_01149) have values of , which are significantly lower than those of the local dwarf galaxies and the other our sample galaxies. The right panel of Figure 9 illustrates the Ne/O ratios as a function of redshift. Interestingly, all the 4 galaxies with the low Ne/O ratios are located at .
5.2 Origin of Low Ne/O
Here, we explore the origins of the low Ne/O. First, the CNO cycle cannot explain the low Ne/O ratios because the CNO cycle reduces the oxygen abundance and maintains the neon abundance. The 4 galaxies with the low Ne/O ratios have only upper limits of N/O, which means that there is also a possibility that these 4 galaxies have low N/O ratios comparable to those of the CCSN yields (see also the last paragraph of Section 4.3). Since CCSNe can produce large amounts of neon and oxygen, we consider below the contribution of CCSNe to the low Ne/O ratios.
We compare these data points with (Watanabe et al., 2023)’s chemical evolution models accumulating the CCSN yields calculated by the nucleosynthesis code of Tominaga et al. (2007) under the assumption of Kroupa (2001) IMF. We assume the metallicity evolution of the Milky Way (Suzuki & Maeda, 2018), and convert the maximum stellar ages of the models (Agemod) to . The blue curves in Figure 9 correspond to the chemical evolution models that accumulate CCSN ejecta with fixed metallicities of , 0.001, and 0.004. We also illustrate isochrones of the models at , 6.8, 6.9, and 7.0, which correspond to lifetimes of stars with 40, 30, 25, and 20 , respectively (Portinari et al., 1998). As shown in the top left panel of Figure 9, the models predict an increase in Ne/O with Agemod. This increase can originate from the prediction that CCSNe with more massive progenitors have higher temperatures in the carbon-burning layer (e.g., Woosley & Janka, 2005), which reduces neon abundance.
As shown in the top left panel of Figure 9, we find that the models with reproduce the low Ne/O ratios of the 4 galaxies. This finding agrees with the fact that the 4 galaxies are located at higher redshifts beyond 6, because galaxies at higher redshifts are expected to be younger and/or have top-heavy IMFs due to the metal-poorer environment.
6 Summary
We present N/O, C/O, C/N, and Ne/O ratios of 70 star-forming galaxies at –10, observed by the JWST/NIRSpec ERO, GLASS, and CEERS programs. We derive these abundance ratios from emission-line ratios of similar ionization energies, accounting for both stellar and AGN radiation, particularly for CEERS_01019 and GN-z11, which exhibit AGN signatures of high-ionization lines. Our findings are summarized below:
-
•
Among the 70 galaxies, we have pinpointed 2 galaxies with unique characteristics: CEERS_01019 at and GLASS_150008 at . We find the low C/N and high N/O ratios these galaxies, which are also found in GN-z11, largely biased towards the C/N and N/O ratios at the equilibrium of the CNO cycle. This suggests that these 3 galaxies contain the significant amount of metals processed by the CNO cycle. This conclusion does not change regardless of whether stellar or AGN radiation is assumed.
-
•
The C/O and N/O ratios of these 3 galaxies are reproduced by chemical evolution models with the significant amount of CNO-cycle materials involving Wolf-Rayet stars, supermassive stars, and tidal disruption events. Interestingly, these scenarios would require frequent direct collapses.
-
•
On the C/N vs. O/H plane, these 3 galaxies do not align with Galactic H ii regions, typical Galactic stars, typical star-forming galaxies, or nitrogen-loud quasars whose nitrogen is assumed to originate from AGB stars. They do, however, coincide with GC dwarf stars. We may see the site of GC formation in these 3 galaxies.
-
•
The other galaxies in the ERO, GLASS, and CEERS programs have poor upper limits of N/O above the solar abundance. At this moment, we cannot tell whether these galaxies have super-solar N/O ratios.
-
•
We identify 4 galaxies with very low Ne/O, with . This low ratio indicates the abundance of massive () stars.
We thank T. Nagao, A.K. Inoue, S. Aoyama, H. Algera, T. Jones, M. Llerena, D. Schaerer, J. Scholtz, and A.P. Vijayan for having useful discussions. We are grateful to staff of the James Webb Space Telescope Help Desk for letting us know useful information. This work is based on observations made with the NASA/ESA/CSA James Webb Space Telescope. The data were obtained from the Mikulski Archive for Space Telescopes at the Space Telescope Science Institute, which is operated by the Association of Universities for Research in Astronomy, Inc., under NASA contract NAS 5-03127 for JWST. These observations are associated with programs 1125, 2736, 1324, 1345, and 2561. The authors acknowledge the ERO, GLASS, CEERS, and UNCOVER teams led by Klaus M. Pontoppidan, Tommaso Treu, Steven L. Finkelstein, and Ivo Labbe, respectively, for developing their observing programs with a zero-exclusive-access period. This work is based on observations taken by the CANDELS Multi-Cycle Treasury Program with the NASA/ESA HST, which is operated by the Association of Universities for Research in Astronomy, Inc., under NASA contract NAS5-26555. This work was supported by the joint research program of the Institute for Cosmic Ray Research (ICRR), University of Tokyo. This publication is based upon work supported by the World Premier International Research Center Initiative (WPI Initiative), MEXT, Japan. Y.I., M.O., K.N., and Y.H. are supported by JSPS KAKENHI Grant Nos. 21J20785, 20H00180/21H04467, 20K22373, and 21K13953, respectively. H.Y. is supported by MEXT/JSPS KAKENHI (21H04489) and JST FOREST Program (JP-MJFR202Z). This research was supported by a grant from the Hayakawa Satio Fund awarded by the Astronomical Society of Japan.
Appendix A Table of Metallicity and Abundance Ratios Based on the Stellar Radiation
| ID | Redshift | ||||||||
|---|---|---|---|---|---|---|---|---|---|
| K | mag | ||||||||
| (1) | (2) | (3) | (4) | (5) | (6) | (7) | (8) | (9) | (10) |
| ERO_04590 | 8.4956 | 0.12 | |||||||
| ERO_05144 | 6.3784 | 0.00 | |||||||
| ERO_06355 | 7.6651 | 0.13 | |||||||
| ERO_08140 | 5.2751 | 0.05 | |||||||
| ERO_10612 | 7.6601 | 0.00 | |||||||
| GLASS_10000 | 7.8809 | 0.00 | |||||||
| GLASS_100001 | 7.8737 | 0.00 | |||||||
| GLASS_100003 | 7.8773 | 0.00 | |||||||
| GLASS_10021 | 7.2863 | 0.00 | |||||||
| GLASS_110000 | 5.7631 | 0.13 | |||||||
| GLASS_150008 | 6.2291 | 0.07e | |||||||
| GLASS_150029 | 4.5837 | 0.16 | |||||||
| GLASS_160122 | 5.3312 | 0.00 | |||||||
| GLASS_160133 | 4.0151 | 0.13 | |||||||
| GLASS_40066 | 4.0197 | 0.23 | |||||||
| GLASS_50002 | 5.1333 | 0.52 | |||||||
| GLASS_50038 | 5.7720 | 0.00 | |||||||
| GLASS_80029 | 3.9510 | 0.09 | |||||||
| GLASS_80070 | 4.7969 | 0.11 | |||||||
| CEERS_00323 | 5.6657 | 0.07 | |||||||
| CEERS_00355 | 6.0998 | 0.01 | |||||||
| CEERS_00397 | 6.0005 | 0.10 | |||||||
| CEERS_00403 | 5.7609 | 0.53 | |||||||
| CEERS_00407 | 7.0291 | 0.00 | |||||||
| CEERS_00515 | 5.6644 | 0.27 | |||||||
| CEERS_00603 | 6.0568 | 0.04 | |||||||
| CEERS_00618 | 6.0499 | 0.00 | |||||||
| CEERS_00670 | 5.8045 | 0.34 | |||||||
| CEERS_00689 | 7.5458 | 0.07e | |||||||
| CEERS_00698 | 7.4708 | 0.00 | |||||||
| CEERS_00707 | 4.8964 | 0.24 | |||||||
| CEERS_00717 | 6.9315 | 0.21 | |||||||
| CEERS_00792 | 6.2572 | 0.00 | |||||||
| CEERS_01019 | 8.6791 | 0.00 | |||||||
| CEERS_01023 | 7.7764 | 0.07e | |||||||
| CEERS_01025 | 8.7140 | 0.07e | |||||||
| CEERS_01027 | 7.8197 | 0.25 | |||||||
| CEERS_01029 | 8.6100 | 0.07e | |||||||
| CEERS_01038 | 7.1945 | 0.07e | |||||||
| CEERS_01115 | 6.3002 | 0.06 | |||||||
| CEERS_01143 | 6.9266 | 0.00 | |||||||
| CEERS_01149 | 8.1750 | 0.02 | |||||||
| CEERS_01160 | 6.5667 | 0.00 | |||||||
| CEERS_01173 | 4.9957 | 0.31 | |||||||
| CEERS_01236 | 4.4842 | 0.00 | |||||||
| CEERS_01289 | 4.8798 | 0.07 | |||||||
| CEERS_01294 | 4.9987 | 0.15 | |||||||
| CEERS_01324 | 5.0074 | 0.00 | |||||||
| CEERS_01358 | 5.5038 | 0.38 | |||||||
| CEERS_01365 | 4.3074 | 0.00 | |||||||
| CEERS_01374 | 4.9999 | 0.13 | |||||||
| CEERS_01401 | 5.3749 | 0.07 | |||||||
| CEERS_01449 | 4.7519 | 0.20 | |||||||
| CEERS_01465 | 5.2692 | 0.00 | |||||||
| CEERS_01536 | 5.0337 | 0.08 | |||||||
| CEERS_01539 | 4.8841 | 0.27 | |||||||
| CEERS_01544 | 4.1901 | 0.05 | |||||||
| CEERS_01561 | 6.1967 | 0.00 | |||||||
| CEERS_01605 | 4.6309 | 0.07 | |||||||
| CEERS_01658 | 4.6038 | 0.24 | |||||||
| CEERS_01677 | 5.8670 | 0.00 | |||||||
| CEERS_02174 | 5.3030 | 0.21 | |||||||
| CEERS_02782 | 5.2408 | 0.32 |
Note. — (1): Ion. (2): Emission process. Re: Recombination; CE: Collisional excitation. (3): Reference of the transition probability. (4): Reference of the collision strength. †: Aggarwal & Keenan (1999) for O iii].
Note. — (1) Name. (2) . (3)–(6) Abundance ratios. (7) Incident radiation assumed to derive the abundance ratios.
Note. — (1) ID. (2) Redshift. (3) Electron temperature. a: Based on [O iii]4363 derived by Nakajima et al. (2023); b: Based on [O iii]4363 but not reported by Nakajima et al. (2023); c: Based on O iii]1666; d: Assumption. (4) Color excess. e: Assumed to be the median of the other our sample galaxies. (5) Metallicity. f: [O ii] ; g: [O ii] ; h: [O ii] out of wavelength coverage. We include uncertainties of the assumptions of and [O ii] into the errors of and the abundance ratios by performing Monte Carlo simulations (Section 3.4). (6)–(10) Abundance ratios. i: Based on metallicity-insensitive C iii]/O iii]. The other C/O measurements are based on C iii]/[O iii]. j: Based on metallicity-insensitive N iii]/O iii]. k: Based on N iv]/[O iii] The other N/O measurements are based on N iii]/[O iii].
Appendix B Argon and Sulfur Abundances
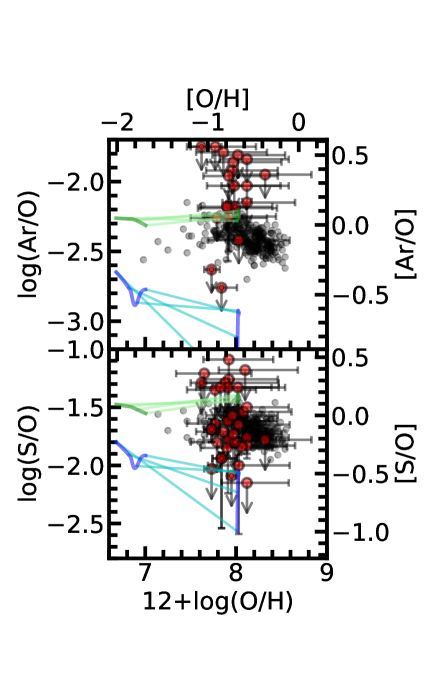
We obtain Ar/O and S/O ratios in the same way as the Ne/O and N/O measurements. We derive ionic abundance ratios of Ar2+/H+ and S+/H+ from [Ar iii]7136 and [S ii]6716,6731 lines respectively. We use (O ii) for S+/H+ and (S iii) for Ar2+/H+, where (S iii) is calculated from (O iii) and the empirical relation of Garnett (1992). Because the ionization energy of S+ ion is lower than that of H+, we derive ICF(S+) calculated until the photo-dissociation region (PDR). Figure 10 illustrates Ar/O and S/O ratios of our sample galaxies as a function of metallicity. In addition to the CCSN models (blue), we plot Watanabe et al. (2023)’s hypernova (HN) models (green). The observed Ar/O and S/O ratios can be explained by the combination of CCSN and HN yields (see Watanabe et al. 2023 for more details).
References
- Aggarwal & Keenan (1999) Aggarwal, K. M., & Keenan, F. P. 1999, ApJS, 123, 311, doi: 10.1086/313232
- Arellano-Córdova et al. (2022) Arellano-Córdova, K. Z., Berg, D. A., Chisholm, J., et al. 2022, ApJ, 940, L23, doi: 10.3847/2041-8213/ac9ab2
- Asplund et al. (2021) Asplund, M., Amarsi, A. M., & Grevesse, N. 2021, A&A, 653, A141, doi: 10.1051/0004-6361/202140445
- Astropy Collaboration et al. (2013) Astropy Collaboration, Robitaille, T. P., Tollerud, E. J., et al. 2013, A&A, 558, A33, doi: 10.1051/0004-6361/201322068
- Astropy Collaboration et al. (2022) Astropy Collaboration, Price-Whelan, A. M., Lim, P. L., et al. 2022, ApJ, 935, 167, doi: 10.3847/1538-4357/ac7c74
- Batra & Baldwin (2014) Batra, N. D., & Baldwin, J. A. 2014, MNRAS, 439, 771, doi: 10.1093/mnras/stu007
- Berg et al. (2019) Berg, D. A., Erb, D. K., Henry, R. B. C., Skillman, E. D., & McQuinn, K. B. W. 2019, ApJ, 874, 93, doi: 10.3847/1538-4357/ab020a
- Berg et al. (2016) Berg, D. A., Skillman, E. D., Henry, R. B. C., Erb, D. K., & Carigi, L. 2016, ApJ, 827, 126, doi: 10.3847/0004-637X/827/2/126
- Berrington et al. (1985) Berrington, K. A., Burke, P. G., Dufton, P. L., & Kingston, A. E. 1985, Atomic Data and Nuclear Data Tables, 33, 195, doi: 10.1016/0092-640X(85)90001-4
- Beveridge & Sneden (1994) Beveridge, R. C., & Sneden, C. 1994, AJ, 108, 285, doi: 10.1086/117068
- Bezanson et al. (2022) Bezanson, R., Labbe, I., Whitaker, K. E., et al. 2022, arXiv e-prints, arXiv:2212.04026, doi: 10.48550/arXiv.2212.04026
- Blum & Pradhan (1992) Blum, R. D., & Pradhan, A. K. 1992, ApJS, 80, 425, doi: 10.1086/191670
- Briley et al. (2004) Briley, M. M., Harbeck, D., Smith, G. H., & Grebel, E. K. 2004, AJ, 127, 1588, doi: 10.1086/381912
- Bunker et al. (2023) Bunker, A. J., Saxena, A., Cameron, A. J., et al. 2023, arXiv e-prints, arXiv:2302.07256, doi: 10.48550/arXiv.2302.07256
- Bushouse et al. (2022) Bushouse, H., Eisenhamer, J., Dencheva, N., et al. 2022, JWST Calibration Pipeline, 1.8.5, Zenodo, doi: 10.5281/zenodo.7429939
- Calzetti et al. (2000) Calzetti, D., Armus, L., Bohlin, R. C., et al. 2000, ApJ, 533, 682, doi: 10.1086/308692
- Cameron et al. (2023) Cameron, A. J., Katz, H., Rey, M. P., & Saxena, A. 2023, MNRAS, doi: 10.1093/mnras/stad1579
- Carretta et al. (2005) Carretta, E., Gratton, R. G., Lucatello, S., Bragaglia, A., & Bonifacio, P. 2005, A&A, 433, 597, doi: 10.1051/0004-6361:20041892
- Charbonnel et al. (2023) Charbonnel, C., Schaerer, D., Prantzos, N., et al. 2023, A&A, 673, L7, doi: 10.1051/0004-6361/202346410
- D’Orazi et al. (2010) D’Orazi, V., Lucatello, S., Gratton, R., et al. 2010, ApJ, 713, L1, doi: 10.1088/2041-8205/713/1/L1
- Elvis et al. (1994) Elvis, M., Wilkes, B. J., McDowell, J. C., et al. 1994, ApJS, 95, 1, doi: 10.1086/192093
- Ferland et al. (2013) Ferland, G. J., Porter, R. L., van Hoof, P. A. M., et al. 2013, Rev. Mexicana Astron. Astrofis., 49, 137. https://arxiv.org/abs/1302.4485
- Finkelstein et al. (2022) Finkelstein, S. L., Bagley, M. B., Ferguson, H. C., et al. 2022, arXiv e-prints, arXiv:2211.05792. https://arxiv.org/abs/2211.05792
- Francis (1993) Francis, P. J. 1993, ApJ, 407, 519, doi: 10.1086/172533
- Froese Fischer & Tachiev (2004) Froese Fischer, C., & Tachiev, G. 2004, Atomic Data and Nuclear Data Tables, 87, 1, doi: 10.1016/j.adt.2004.02.001
- Galavis et al. (1998) Galavis, M. E., Mendoza, C., & Zeippen, C. J. 1998, A&AS, 131, 499, doi: 10.1051/aas:1998435
- García-Rojas & Esteban (2007) García-Rojas, J., & Esteban, C. 2007, ApJ, 670, 457, doi: 10.1086/521871
- Garnett (1992) Garnett, D. R. 1992, AJ, 103, 1330, doi: 10.1086/116146
- Hamann & Ferland (1993) Hamann, F., & Ferland, G. 1993, ApJ, 418, 11, doi: 10.1086/173366
- Harikane et al. (2023a) Harikane, Y., Nakajima, K., Ouchi, M., et al. 2023a, arXiv e-prints, arXiv:2304.06658, doi: 10.48550/arXiv.2304.06658
- Harikane et al. (2023b) Harikane, Y., Ouchi, M., Oguri, M., et al. 2023b, ApJS, 265, 5, doi: 10.3847/1538-4365/acaaa9
- Heger et al. (2003) Heger, A., Fryer, C. L., Woosley, S. E., Langer, N., & Hartmann, D. H. 2003, ApJ, 591, 288, doi: 10.1086/375341
- Isobe et al. (2023) Isobe, Y., Ouchi, M., Nakajima, K., et al. 2023, arXiv e-prints, arXiv:2301.06811, doi: 10.48550/arXiv.2301.06811
- Isobe et al. (2022) Isobe, Y., Ouchi, M., Suzuki, A., et al. 2022, ApJ, 925, 111, doi: 10.3847/1538-4357/ac3509
- Izotov et al. (2006) Izotov, Y. I., Stasińska, G., Meynet, G., Guseva, N. G., & Thuan, T. X. 2006, A&A, 448, 955, doi: 10.1051/0004-6361:20053763
- Jones et al. (2023) Jones, T., Sanders, R., Chen, Y., et al. 2023, arXiv e-prints, arXiv:2301.07126, doi: 10.48550/arXiv.2301.07126
- Kisielius et al. (2009) Kisielius, R., Storey, P. J., Ferland, G. J., & Keenan, F. P. 2009, MNRAS, 397, 903, doi: 10.1111/j.1365-2966.2009.14989.x
- Kojima et al. (2017) Kojima, T., Ouchi, M., Nakajima, K., et al. 2017, PASJ, 69, 44, doi: 10.1093/pasj/psx017
- Kojima et al. (2021) Kojima, T., Ouchi, M., Rauch, M., et al. 2021, ApJ, 913, 22, doi: 10.3847/1538-4357/abec3d
- Kroupa (2001) Kroupa, P. 2001, MNRAS, 322, 231, doi: 10.1046/j.1365-8711.2001.04022.x
- Larson et al. (2023) Larson, R. L., Finkelstein, S. L., Kocevski, D. D., et al. 2023, arXiv e-prints, arXiv:2303.08918, doi: 10.48550/arXiv.2303.08918
- Limongi & Chieffi (2018) Limongi, M., & Chieffi, A. 2018, ApJS, 237, 13, doi: 10.3847/1538-4365/aacb24
- Llerena et al. (2022) Llerena, M., Amorín, R., Cullen, F., et al. 2022, A&A, 659, A16, doi: 10.1051/0004-6361/202141651
- Llerena et al. (2023) Llerena, M., Amorín, R., Pentericci, L., et al. 2023, A&A, 676, A53, doi: 10.1051/0004-6361/202346232
- Luridiana et al. (2015) Luridiana, V., Morisset, C., & Shaw, R. A. 2015, A&A, 573, A42, doi: 10.1051/0004-6361/201323152
- Maeder et al. (2015) Maeder, A., Meynet, G., & Chiappini, C. 2015, A&A, 576, A56, doi: 10.1051/0004-6361/201424153
- Maiolino et al. (2023) Maiolino, R., Scholtz, J., Witstok, J., et al. 2023, arXiv e-prints, arXiv:2305.12492, doi: 10.48550/arXiv.2305.12492
- Marques-Chaves et al. (2023) Marques-Chaves, R., Schaerer, D., Kuruvanthodi, A., et al. 2023, arXiv e-prints, arXiv:2307.04234, doi: 10.48550/arXiv.2307.04234
- McLaughlin & Bell (2000) McLaughlin, B. M., & Bell, K. L. 2000, JPhB, 33, 597, doi: 10.1088/0953-4075/33/4/301
- Morisset et al. (2015) Morisset, C., Delgado-Inglada, G., & Flores-Fajardo, N. 2015, Rev. Mexicana Astron. Astrofis., 51, 103, doi: 10.48550/arXiv.1412.5349
- Munoz Burgos et al. (2009) Munoz Burgos, J. M., Loch, S. D., Ballance, C. P., & Boivin, R. F. 2009, A&A, 500, 1253, doi: 10.1051/0004-6361/200911743
- Nagele & Umeda (2023) Nagele, C., & Umeda, H. 2023, ApJ, 949, L16, doi: 10.3847/2041-8213/acd550
- Nakajima et al. (2023) Nakajima, K., Ouchi, M., Isobe, Y., et al. 2023, arXiv e-prints, arXiv:2301.12825, doi: 10.48550/arXiv.2301.12825
- Nicholls et al. (2017) Nicholls, D. C., Sutherland, R. S., Dopita, M. A., Kewley, L. J., & Groves, B. A. 2017, MNRAS, 466, 4403, doi: 10.1093/mnras/stw3235
- Nomoto et al. (2013) Nomoto, K., Kobayashi, C., & Tominaga, N. 2013, ARA&A, 51, 457, doi: 10.1146/annurev-astro-082812-140956
- Norris et al. (2013) Norris, J. E., Yong, D., Bessell, M. S., et al. 2013, ApJ, 762, 28, doi: 10.1088/0004-637X/762/1/28
- Oesch et al. (2016) Oesch, P. A., Brammer, G., van Dokkum, P. G., et al. 2016, ApJ, 819, 129, doi: 10.3847/0004-637x/819/2/129
- Pilyugin et al. (2012) Pilyugin, L. S., Vílchez, J. M., Mattsson, L., & Thuan, T. X. 2012, MNRAS, 421, 1624, doi: 10.1111/j.1365-2966.2012.20420.x
- Pontoppidan et al. (2022) Pontoppidan, K. M., Barrientes, J., Blome, C., et al. 2022, ApJ, 936, L14, doi: 10.3847/2041-8213/ac8a4e
- Portinari et al. (1998) Portinari, L., Chiosi, C., & Bressan, A. 1998, A&A, 334, 505. https://arxiv.org/abs/astro-ph/9711337
- Rynkun et al. (2019) Rynkun, P., Gaigalas, G., & Jönsson, P. 2019, A&A, 623, A155, doi: 10.1051/0004-6361/201834931
- Salpeter (1955) Salpeter, E. E. 1955, ApJ, 121, 161, doi: 10.1086/145971
- Senchyna et al. (2023) Senchyna, P., Plat, A., Stark, D. P., & Rudie, G. C. 2023, arXiv e-prints, arXiv:2303.04179, doi: 10.48550/arXiv.2303.04179
- Stanway & Eldridge (2018) Stanway, E. R., & Eldridge, J. J. 2018, MNRAS, 479, 75, doi: 10.1093/mnras/sty1353
- Steidel et al. (2016) Steidel, C. C., Strom, A. L., Pettini, M., et al. 2016, ApJ, 826, 159, doi: 10.3847/0004-637X/826/2/159
- Storey & Hummer (1995) Storey, P. J., & Hummer, D. G. 1995, MNRAS, 272, 41, doi: 10.1093/mnras/272.1.41
- Storey et al. (2014) Storey, P. J., Sochi, T., & Badnell, N. R. 2014, MNRAS, 441, 3028, doi: 10.1093/mnras/stu777
- Suzuki & Maeda (2018) Suzuki, A., & Maeda, K. 2018, MNRAS, 478, 110, doi: 10.1093/mnras/sty999
- Tayal & Zatsarinny (2010) Tayal, S. S., & Zatsarinny, O. 2010, ApJS, 188, 32, doi: 10.1088/0067-0049/188/1/32
- Telles et al. (2014) Telles, E., Thuan, T. X., Izotov, Y. I., & Carrasco, E. R. 2014, A&A, 561, A64, doi: 10.1051/0004-6361/201219270
- The Astropy Collaboration (2018) The Astropy Collaboration. 2018, astropy v3.1: a core python package for astronomy, 3.1, Zenodo, Zenodo, doi: 10.5281/zenodo.4080996
- Tominaga et al. (2007) Tominaga, N., Umeda, H., & Nomoto, K. 2007, ApJ, 660, 516, doi: 10.1086/513063
- Treu et al. (2022) Treu, T., Roberts-Borsani, G., Bradac, M., et al. 2022, ApJ, 935, 110, doi: 10.3847/1538-4357/ac8158
- Vincenzo et al. (2016) Vincenzo, F., Belfiore, F., Maiolino, R., Matteucci, F., & Ventura, P. 2016, MNRAS, 458, 3466, doi: 10.1093/mnras/stw532
- Watanabe et al. (2023) Watanabe, K., Ouchi, M., Nakajima, K., et al. 2023, arXiv e-prints, arXiv:2305.02078, doi: 10.48550/arXiv.2305.02078
- Watanabe et al. (in prep.) Watanabe et al., K. in prep.
- Wiese et al. (1996) Wiese, W. L., Fuhr, J. R., & Deters, T. M. 1996, Atomic transition probabilities of carbon, nitrogen, and oxygen : a critical data compilation
- Woosley & Janka (2005) Woosley, S., & Janka, T. 2005, Nature Physics, 1, 147, doi: 10.1038/nphys172
- Yajima et al. (2022a) Yajima, H., Abe, M., Fukushima, H., et al. 2022a, arXiv e-prints, arXiv:2211.12970, doi: 10.48550/arXiv.2211.12970
- Yajima et al. (2022b) Yajima, H., Abe, M., Khochfar, S., et al. 2022b, MNRAS, 509, 4037, doi: 10.1093/mnras/stab3092
- Zamorani et al. (1981) Zamorani, G., Henry, J. P., Maccacaro, T., et al. 1981, ApJ, 245, 357, doi: 10.1086/158815