JWST’s PEARLS: A JWST/NIRCam view of ALMA sources
Abstract
We report the results of James Webb Space Telescope/NIRCam observations of 19 (sub)millimeter (submm/mm) sources detected by the Atacama Large Millimeter Array (ALMA). The accurate ALMA positions allowed unambiguous identifications of their NIRCam counterparts. Taking gravitational lensing into account, these represent 16 distinct galaxies in three fields and constitute the largest sample of its kind to date. The counterparts’ spectral energy distributions, which cover from rest-frame ultraviolet to near-infrared provide photometric redshifts () and stellar masses ( M⊙), which are similar to sub-millimeter galaxies (SMGs) studied previously. However, our sample is fainter in submm/mm than the classic SMG samples are, and our sources exhibit a wider range of properties. They have dust-embedded star-formation rates as low as 10 M⊙ yr-1, and the sources populate both the star-forming main sequence and the quiescent categories. The deep NIRCam data allow us to study the rest-frame near-IR morphologies. Excluding two multiply imaged systems and one quasar, the majority of the remaining sources are disk-like and show either little or no disturbance. This suggests that secular growth is a potential route for the assembly of high-mass disk galaxies. While a few objects have large disks, the majority have small disks (median half-mass radius of 1.6 kpc). At this time, it is unclear whether this is due to the prevalence of small disks at these redshifts or some unknown selection effects of deep ALMA observations. A larger sample of ALMA sources with NIRCam observations will be able to address this question.
1 Introduction
The submillimeter/millimeter (submm/mm) window offers a view of the high-redshift galaxy population complementary to that seen in visible light (e.g., Smail et al., 1997; Casey et al., 2014). Sources detected in this window are commonly referred to as submillimeter galaxies (SMGs). Followup studies have shown that SMGs are mainly high-redshift (–3), dusty, and star-forming galaxies, and most of the brightest SMGs are gravitationally magnified by foreground massive galaxies or clusters (Blain, 1996; Perrotta et al., 2002; Blain et al., 2002; Negrello et al., 2010, 2017). Over the years, finding SMGs has become one of the most efficient methods to select dusty star-forming galaxies (DSFGs) at high redshifts.
Despite many successes, SMG studies have been limited by the poor angular resolution of single-dish telescopes through which SMGs have been selected. The low resolution makes the source positions uncertain. More recently, interferometry arrays such as the Atacama Large Millimeter/submillimeter Array (ALMA) have been used to locate SMGs and allow unambiguous identification of their counterparts (e.g., Hodge et al., 2013). This has allowed studies of SMGs using exquisite HST images (e.g., Chen et al., 2015; Hodge et al., 2016; Dunlop et al., 2017; Hodge et al., 2019; Stach et al., 2019; Cheng et al., 2020; Cardona-Torres et al., 2022). Due to the high redshifts where SMGs reside, however, HST only sees them in the rest-frame UV-to-visible wavelengths, where SMGs have severe dust extinction. This makes it difficult to obtain a comprehensive picture of their underlying stellar populations. Spitzer/IRAC images of SMGs probe them in the rest-frame near-infrared but have only 2″ angular resolution, which is insufficient to study the host morphologies. The low resolution also often leads to blended IRAC images, which can make it difficult to derive accurate spectral energy distributions (SEDs).
JWST promises to overcome prior limitations in infrared studies of SMGs (Cheng et al., 2022; Chen et al., 2022; Zavala et al., 2022). The NIRCam instrument offers 0.7 to 5 µm images with angular resolution comparable to that of HST. Provided that accurate positions are known (e.g., from ALMA), NIRCam images can reveal the host stellar distributions and allow accurate SED measurements to enable detailed diagnostics of the underlying stellar populations.
This paper presents the JWST/NIRCam view of 19 submm/mm sources (16 distinct galaxies) from the ALMA archival data in three well-studied fields, which form the largest sample of its kind to date. The JWST/NIRCam data come from the Prime Extragalactic Areas for Reionization and Lensing Science program (PEARLS; Windhorst et al. 2022) and the archival data from the Public Release IMaging for Extragalactic Research (PRIMER; Dunlop et al., 2021, PI: James Dunlop,). Accurate positions are available from the ALMA 92 GHz, 260 GHz, or 340 GHz maps, making counterpart identification possible. Section 2 of this paper describes the data, and Section 3 presents the results. A summary is in Section 4. Throughout this paper, magnitudes are in the AB system, and we adopt a flat CDM cosmology with km s-1 Mpc-1, , and .
2 Data and Sample
2.1 Field Description
Our sample is collected from three fields that have both ALMA archival data and new JWST/NIRCam data. ACT-CL J01024915 (nicknamed “El Gordo”) is a high-mass ( M⊙), colliding galaxy cluster at (Menanteau et al., 2010; Marriage et al., 2011; Menanteau et al., 2012; Lindner et al., 2014; Jee et al., 2014). It was selected as a PEARLS field because it is a powerful cosmic lens. Its lensing properties have been modeled based on lensed background objects detected by HST (Zitrin et al., 2013; Diego et al., 2020) and more recently by the PEARLS team (Frye, 2022; Diego et al., 2022) using JWST data.
TN J1338+1942 (hereafter “TNJ1338”) is a radio galaxy at (De Breuck et al., 1999) and is the dominant member of a proto-cluster (Venemans et al., 2002; Miley et al., 2004). It was selected as a PEARLS field primarily for the study of galaxy properties in a proto-cluster environment.
The UKIDSS Ultra-Deep Survey field (hereafter “UDS”—Stach et al. 2018) is one of the most-studied extragalactic survey fields and is where PRIMER will carry out the majority of its JWST observations.
| Name | RA | Dec | Redshift | log(SFR) | ||||||
|---|---|---|---|---|---|---|---|---|---|---|
| J2000 | J2000 | mJy | mJy | mJy | log() | log() | kpc | |||
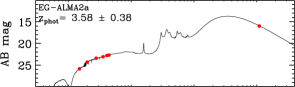
| EG-ALMA 2a | 01:02:49.2 | -49:15:08.7 | 0.320.03 | 3.580.38aaLensed double images of a single source (see Diego et al., 2022). | 4.6 | |||||
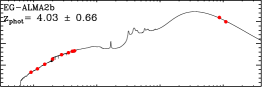
| EG-ALMA 2b | 01:02:49.4 | -49:15:05.3 | 1.620.12 | 0.650.07 | 3.580.38aaLensed double images of a single source (see Diego et al., 2022). | 5.5 | ||||
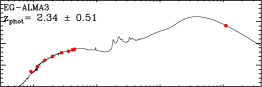
| EG-ALMA 3 | 01:02:49.3 | -49:14:38.1 | 0.750.08 | 2.340.51 | 10.94 0.11 | 1.94 0.49 | 5.350.27 | 2.1 | ||
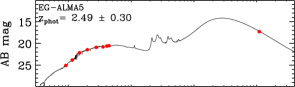
| EG-ALMA 5 | 01:02:50.5 | -49:15:41.7 | 0.250.03 | 2.490.30 | 11.13 0.14 | 1.09 0.44 | 1.530.30 | 1.8 | ||
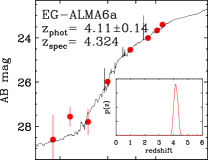
| EG-ALMA 6a | 01:02:51.1 | -49:15:38.8 | 0.900.09 | 4.324bbLensed triple images of a single source. Its is based on CO J=4–3 emission line (see Appendix B) and has uncertainty 0.001. | 3.9 | |||||
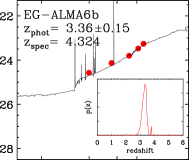
| EG-ALMA 6b | 01:02:54.9 | -49:15:14.7 | 1.370.15 | 1.240.12 | 4.324bbLensed triple images of a single source. Its is based on CO J=4–3 emission line (see Appendix B) and has uncertainty 0.001. | 3.1 | ||||
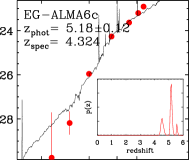
| EG-ALMA 6c | 01:02:55.7 | -49:15:09.0 | 1.890.19 | 0.990.10 | 4.324bbLensed triple images of a single source. Its is based on CO J=4–3 emission line (see Appendix B) and has uncertainty 0.001. | 10.14 0.10 | 1.97 0.14 | 1.800.10 | 10.0 | |
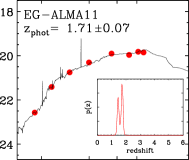
| EG-ALMA 11 | 01:02:57.7 | -49:15:20.0 | 0.110.01 | 1.670.21 | 10.96 0.11 | 1.08 0.46 | 2.270.27 | 2.3 | ||
| EG-ALMA 12 | 01:02:58.1 | -49:14:56.2 | 0.630.07 | 2.490.18 | 10.91 0.15 | 0.98 0.58 | 1.630.34 | 1.4 | ||
| EG-ALMA 13 | 01:03:00.2 | -49:16:03.4 | 0.170.02 | 1.801.08 | 10.48 0.12 | 1.32 0.62 | 1.080.21 | 3.2 | ||
| UDS-ALMA 1 | 02:17:19.6 | -05:09:41.4 | 4.911.54 | 2.100.13 | 11.15 0.08 | 2.30 0.38 | 1.180.42 | 1 | ||
| UDS-ALMA 2 | 02:17:21.0 | -05:08:37.2 | 0.930.16 | 2.080.06cc derived by eazy using AGN templates. | 0.80 | 1 | ||||
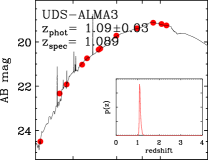
| UDS-ALMA 3 | 02:17:22.3 | -05:10:38.6 | 1.020.13 | 1.089dd from Lang et al. (2019); Bourne et al. (2019). The typical uncertainty is 0.001 | 11.55 0.14 | 1.75 0.64 | 2.540.39 | 1 | ||
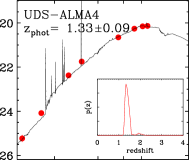
| UDS-ALMA 4 | 02:17:26.1 | -05:10:58.3 | 3.040.38 | 0.860.09 | 1.740.38 | 11.18 0.19 | 2.42 0.37 | 4.640.42 | 1 | |
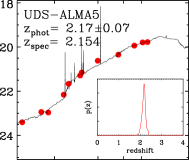
| UDS-ALMA 5 | 02:17:27.2 | -05:11:57.8 | 6.310.65 | 2.430.57 | 2.154dd from Lang et al. (2019); Bourne et al. (2019). The typical uncertainty is 0.001 | 11.32 0.08 | 2.33 0.22 | 3.780.41 | 1 | |
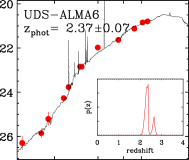
| UDS-ALMA 6 | 02:17:43.9 | -05:07:51.3 | 2.190.26 | 2.510.28 | 11.31 0.07 | 2.28 0.36 | 1.440.40 | 1 | ||
| TN-ALMA 1 | 13:38:24.9 | -19:42:15.8 | 0.0570.006 | 3.171.03 | 10.77 0.40 | 2.36 0.33 | 1.120.42 | 1 | ||
| TN-ALMA 2 | 13:38:25.7 | -19:42:34.6 | 0.0460.005 | 3.390.26 | 10.58 0.09 | 2.17 0.31 | 1.200.39 | 1 | ||
| TN-ALMA 6 | 13:38:26.9 | -19:42:30.9 | 0.0310.003 | 1.470.46 | 11.35 0.10 | 2.05 0.46 | 2.800.41 | 1 |
.
Note. — The flux densities, masses, SFRs, and sizes for the El Gordo sources have been corrected for the gravitational lensing magnification . For most objects, their from magphys-photo-z are listed in the “Redshift” column. The exceptions are (1) the objects that have , for which their are listed; and (2) the point-like source UDS-ALMA 2, for which we adopt from eazy as it was derived using AGN templates and is more plausible. is for the disk component (i.e., with a point-source core subtracted for UDS-ALMA 1/3/4/5). Because is measured in the rest-frame near-IR, it is equivalent to the half-mass radius.
2.2 ALMA archive data and sample construction
The El Gordo field has been observed by the ALMA programs 2013.1.01358.S (PI: A. Baker) and 2018.1.00035.L (PI: K. Kohno) in Band 6 (270 GHz = 1.1 mm) and 2013.1.01051.S (PI: P. Aguirre) in Band 7 (340 GHz = 870 m). The ALMA data in the TNJ1338 field were obtained by program 2015.1.00530.S (PI: C. De Breuck) in Band 3 (92 GHz = 3.3 mm). The UDS has a large number of ALMA programs. In the current PRIMER UDS field, the ALMA Band 6 and/or Band 7 data were collected by astroquery in each PRIMER observation region. These archival data were reduced by the Chinese South American Center ALMA data processing program (Cheng et al., in prep.). Briefly, the data were calibrated by the default ALMA data reduction script ScriptForPI.py. The task tclean in casa 6.2.1 (McMullin et al., 2007) was used to clean the data to build the continuum images. For this set of data, the clean parameters were set to weighting=“briggs” and robust=2.0, and we cleaned the images to 3 .
The final 1.1 mm map in El Gordo has beam size 128093 at ° and reaches 0.065 mJy beam-1 (root-mean-square; rms). This map has an area of 4 arcmin2 overlapped with the NIRCam coverage (see below) and was used for the source detection in this field. The final 870 m map, which covers only a portion of the 1.1 mm map, reaches 0.25 mJy beam-1 with beam size 033040 at °.
In TNJ1338, the final 3.3 mm map has beam size of 211174, ° and reaches 0.009 mJy beam-1 rms. It covers 2 arcmin2, centered around the radio galaxy.
In the UDS field, the final images have beam sizes of about 07 at 1.1 mm and 04 at 870 m. The total coverage is 1 arcmin2. Both images reach rms 0.05 mJy. The source detections were done in both bands, and the results were merged.
Source extraction was done by running SExtractor (Bertin & Arnouts, 1996) in dual-image mode. The detection was done on the ALMA maps not corrected for the primary-beam attenuation, as these have a uniform noise distribution. The photometry was done on the primary-beam-corrected images exported from casa. The detection map was convolved using a Gaussian kernel, and we set detect_thresh = 4. flux_auto was adopted for the flux density measurements. To account for the calibration uncertainty, we added in quadrature 10% of the flux density (Fomalont et al., 2014) to the reported fluxerr_auto to obtain the final uncertainty estimate. All these detections have signal-to-noise ratios (S/N) higher than 3, and all but two have (see Table 1).
2.3 JWST NIRCam Data
The PEARLS NIRCam data in the TNJ1338 field and the El Gordo field were taken on 2022 July 1 and 29, respectively, and these observations are described by Windhorst et al. (2022). Briefly, the observations of El Gordo were done in F090W, F115W, F150W, F200W, F277W, F356W, F410M, and F444W, and the total integration times were 2491, 2491, 1890, 2104, 2104, 1890, 2491, and 2491 seconds, respectively. The observations in TNJ1338 were done in F150W, F182M, F210M, F300M, F335M, and F360M with a uniform total integration time of 1031 seconds in each band. In both fields, the areas where the ALMA data reside are covered by one NIRCam module (module B).
As of this writing, only a small fraction of the PRIMER observations in UDS were executed, all on 2022 July 29. The NIRCam data were taken in three pointings as the parallels to the primary MIRI observations. One pointing is isolated, while the other two overlap and fill the wide gaps between the two NIRCam modules. The passbands used were the same as for El Gordo, but integration times were 837 seconds in each band.
All data were reduced using the JWST data reduction pipeline version 1.6.1dev3+gad99335d in the context of jwst_0944.pmap, starting from the Stage 1 “uncal” products. A few changes and augmentations were made to the pipeline to improve the reduction quality (Yan et al., 2022). In the El Gordo field, the final stacked images were created at a pixel scale 006 and were aligned to the existing HST images of the same scale produced by the Reionization Lensing Cluster Survey (RELICS; Coe et al., 2019). The final stacks in the TNJ1338 field were also aligned to the existing HST images, which are available from the High Level Science Products provided by the Mikulski Archive for Space Telescopes. These HST images have pixel scale of 004, and the NIRCam images were created at the same scale. In the UDS field, the final stacks were created at 006 pixel-1 and were aligned to the existing HST images of the same scale from the Cosmic Assembly Near-infrared Deep Extragalactic Legacy Survey (CANDELS; Grogin et al., 2011; Koekemoer et al., 2011).
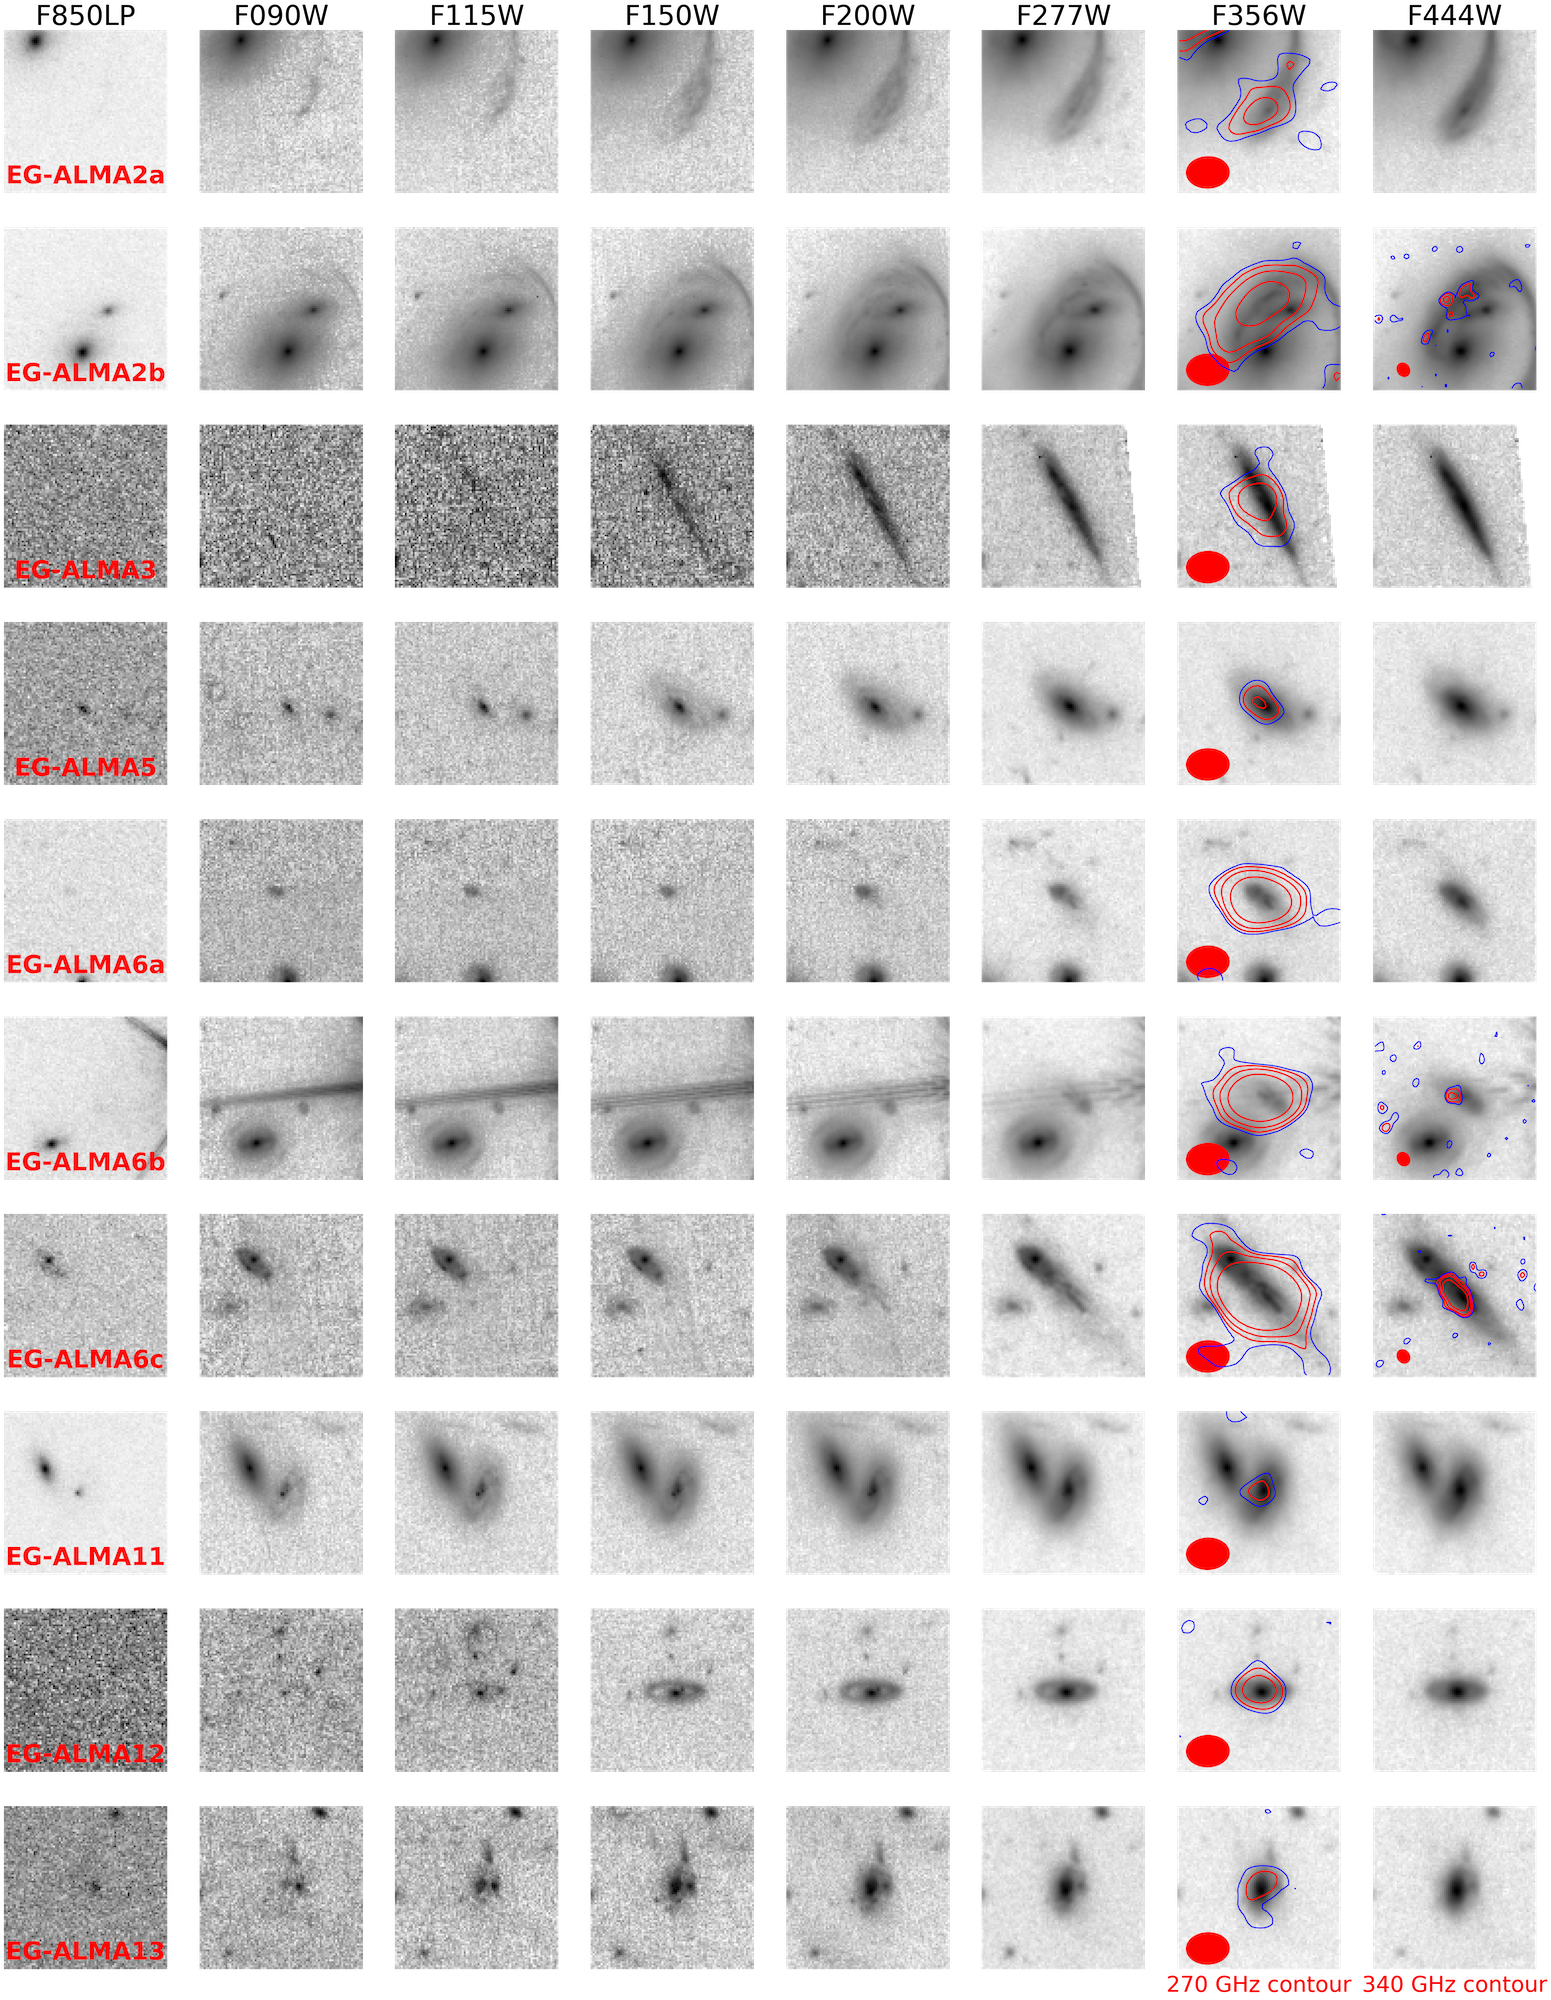
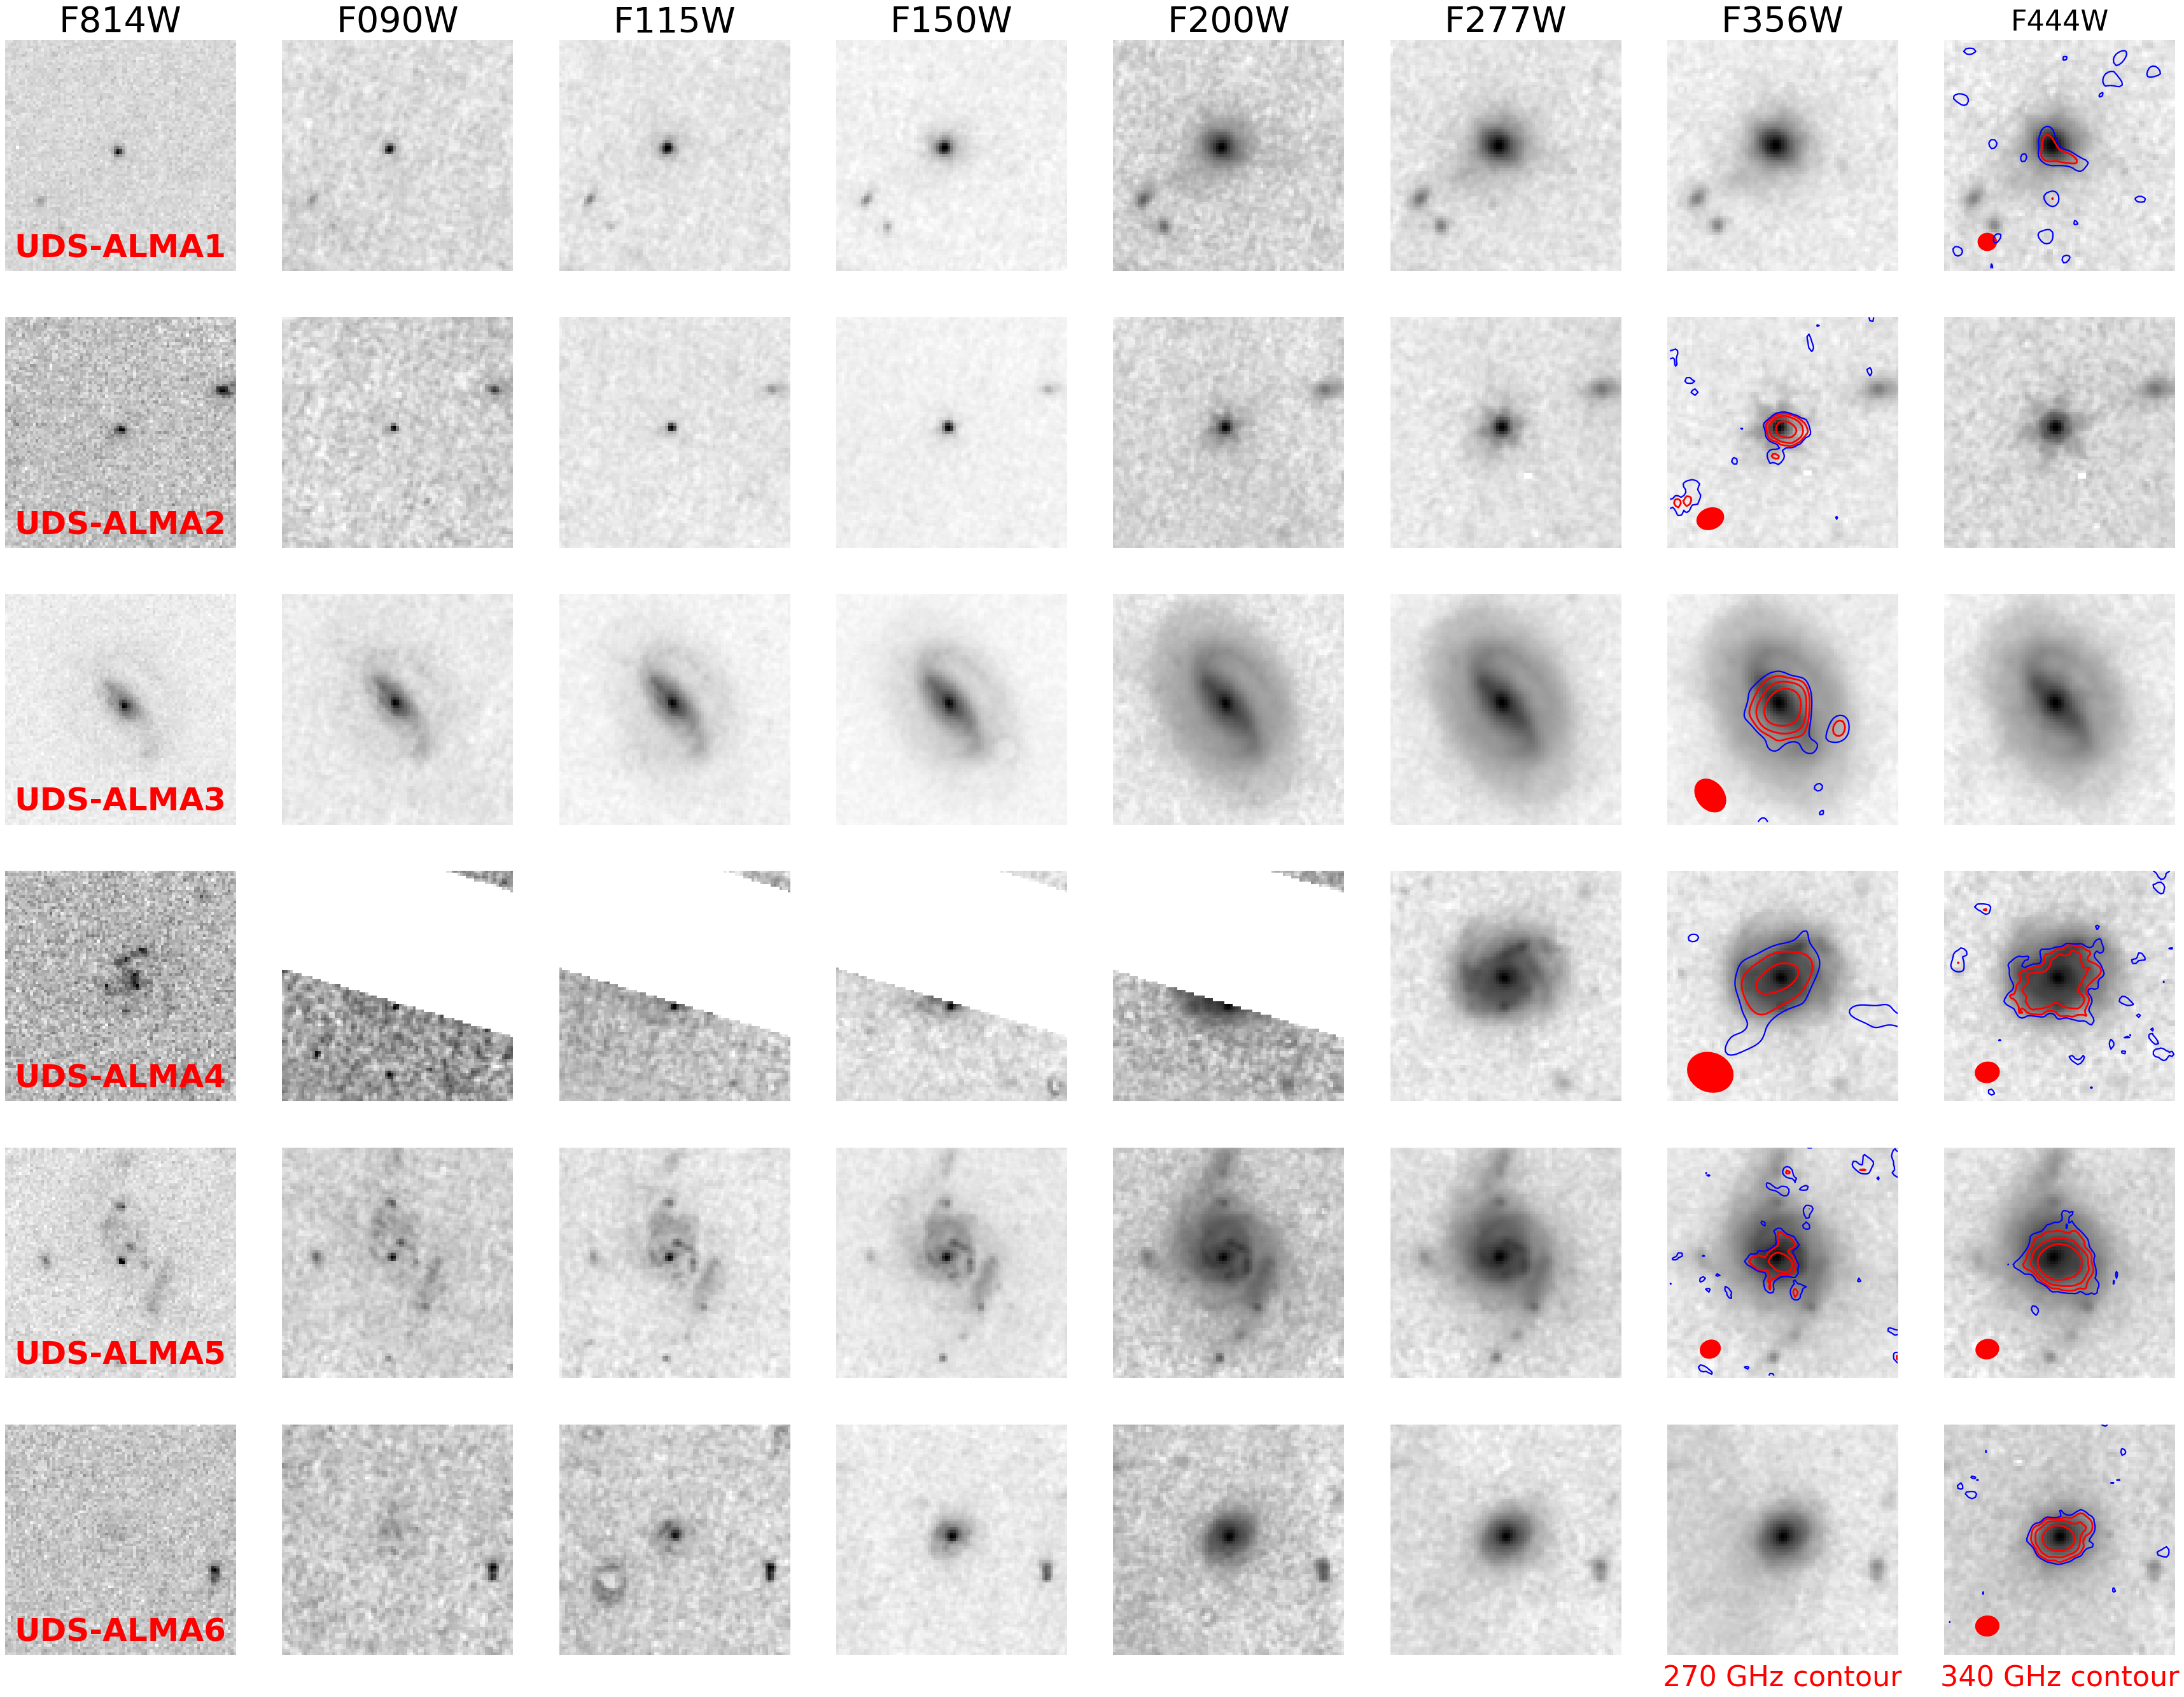
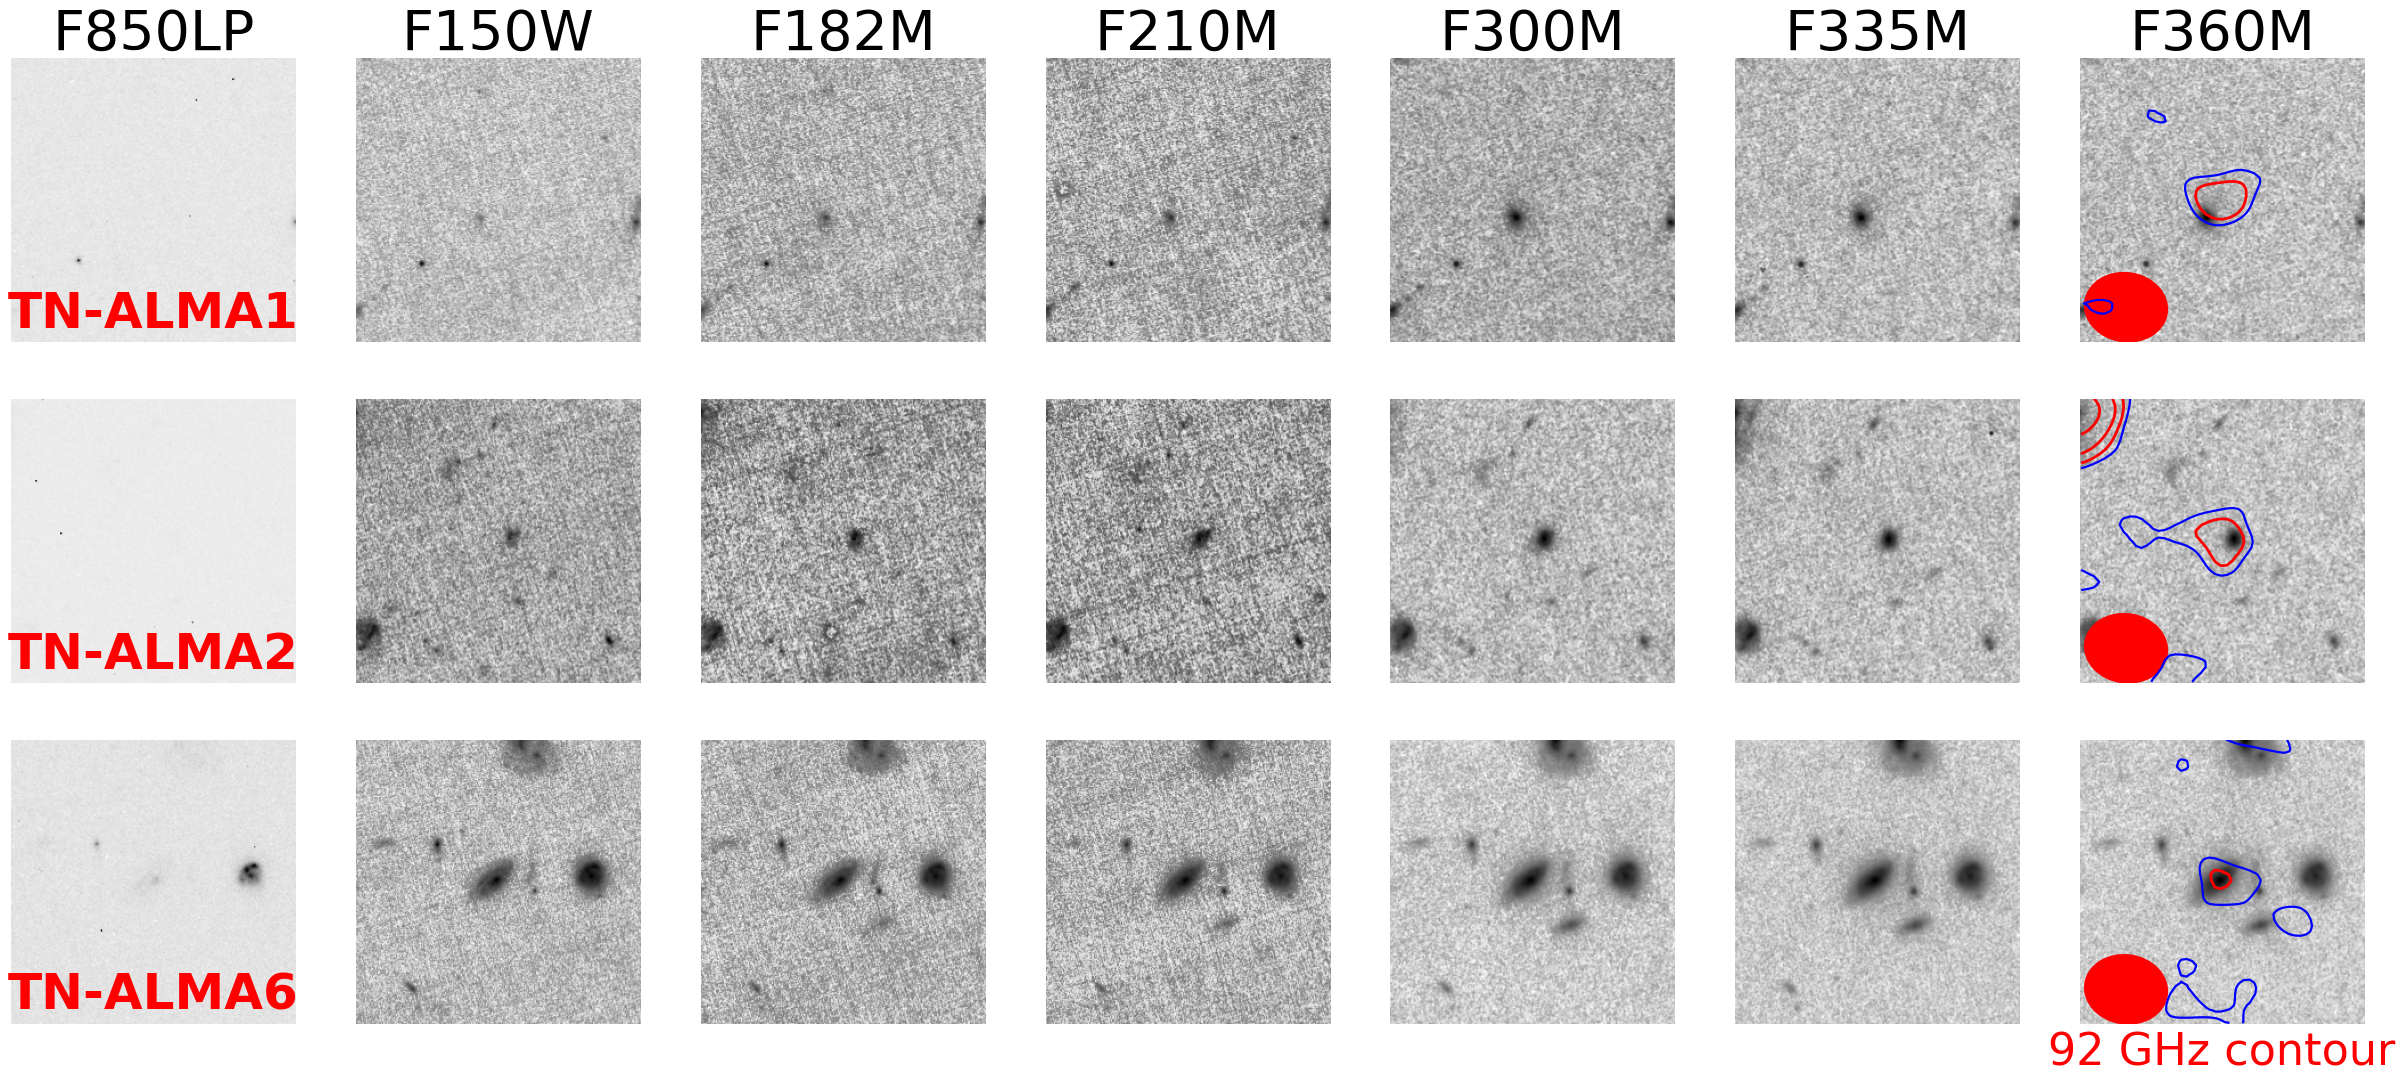
In total, we identified 10, 4, and 6 NIRCam counterparts of our ALMA sources in the El Gordo, TNJ1338, and UDS fields, respectively. One of the TNJ1338 sources is the central radio galaxy, which is studied by Duncan (2022) and not discussed further here. Table 1 lists the remaining 19 sources. Figure 1 shows the HST ACS and NIRCam stamp images for each. The sources in the El Gordo field are affected by gravitational lensing to various degrees. In particular, EG-ALMA 6a/6b/6c are the triple images of a single galaxy that is believed to be associated with the galaxy group (Caputi et al., 2021). EG-ALMA 2a/2b are two images of another single galaxy lensed by two cluster-member galaxies as well as the cluster as a whole. Therefore, the 10 sources in this field correspond to seven unique galaxies; and so our final sample consists of 16 galaxies.
3 Analysis and Results
3.1 SED construction and fitting
For the targets in the El Gordo field, we did not use the HST data because the JWST NIRCam data alone sufficiently sample the rest-frame visible to near-IR range. In the UDS field, UDS-ALMA 4 has no NIRCam data in the short wavelength bands because it falls in the gap in between the modules. Therefore, we used the HST data in F606W, F814W, F125W, and F160W. For homogeneity, these HST images were also used for the other UDS targets. In TNJ1338, the bluest NIRCam band is F150W, and therefore we added HST F775W and F850LP data to extend the wavelength sampling to visible wavelengths.
We used SExtractor in dual-image mode for photometry. For the sources in El Gordo and UDS, the detection band was set to F444W; in TNJ1338, it was set to F360M. In most cases, we adopted mag_iso to optimize the signal-to-noise ratio (S/N) for the best color measurement. The exceptions were the two multiply imaged systems EG-ALMA 2a/2b and EG-ALMA 6a/6b/6c. The former is blended with two cluster-member galaxies, which contribute the major part of the lensing effect that creates this system. The latter has a close neighbor that might be associated with the source but is not the counterpart. In both cases, their mag_iso apertures are severely contaminated by the light from these neighbors. To minimize the contamination, we had to derive colors using a circular aperture of 06 in diameter centered on the position of the brightest pixel in the F444W image.
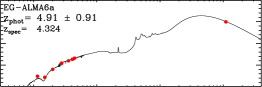
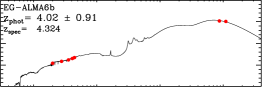
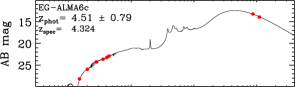
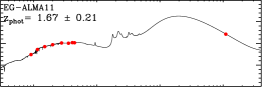
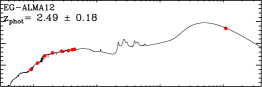
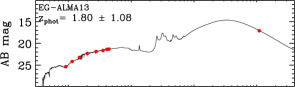
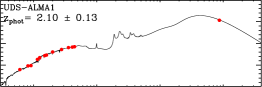
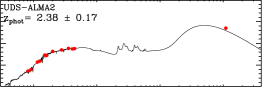
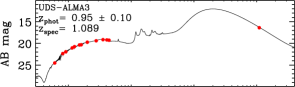
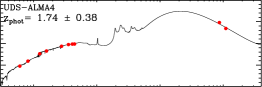
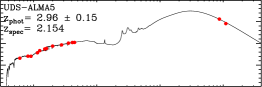
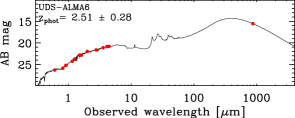
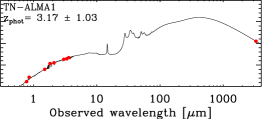
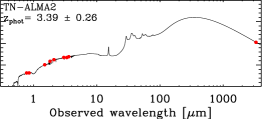
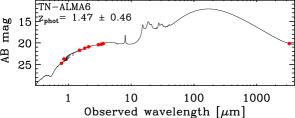
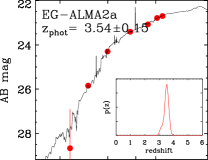
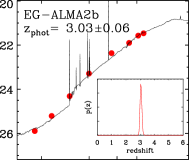
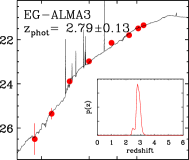
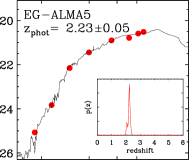
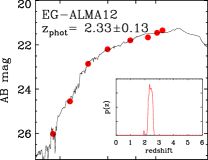
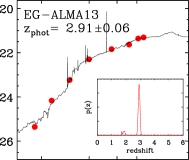
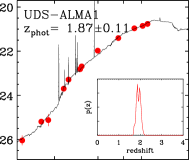
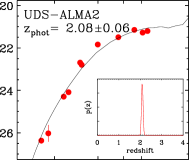
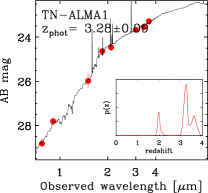
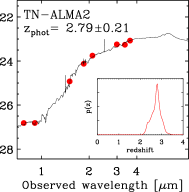
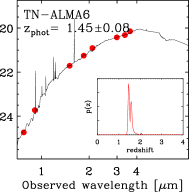
Figure 2 shows the full SEDs, combining rest-frame visible to near-IR photometry with the ALMA photometry. We used magphys+photo-z (da Cunha et al., 2008; Battisti et al., 2019) to fit these SEDs to obtain physical properties of the hosts, most importantly the photometric redshift (), the star formation rate (SFR), and the stellar mass (). The best-fit results are shown in Figure 2, and the derived values are presented in Table 1. The SFR and values for the El Gordo sources have been corrected for the magnification factors () at the corresponding redshifts. Two sources, UDS-ALMA 3 and 5, have spectroscopic redshifts (), which are quoted in Table 1; their and SFR listed in the table were derived at their , while Figure 2 still shows their SED-fitting results when treating redshift as a free parameter.
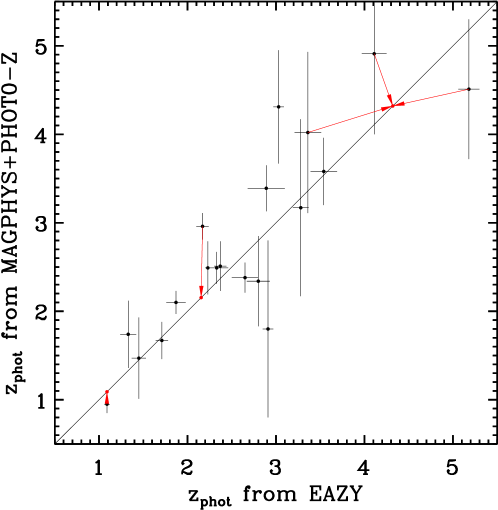
magphys+photo-z is designed to fit panchromatic SEDs based on the “energy-balance” premise, which argues that the UV-to-near-IR energy absorbed by dust in a system should roughly equal the far-IR-to-mm light re-emitted by dust. This approach provides a good constraint on the amount of dust extinction, and propagates the uncertainty of to the uncertainties in other derived parameters. However, the energy-balance premise might not hold if the dust component is not well mixed with stars in the host galaxy. In addition, we have only one or two ALMA bands constraining the dust emission. To check the robustness of the derived by magphys+photo-z, we also fitted the visible-to-near-IR SEDs using eazy (Brammer et al., 2008) with eazy_v1.1_lines.spectra.param templates to derive independently. The best-fit results are summarized in Figure 3. For most sources, these two sets of are consistent with each other (see Appendix A), which gives us confidence in the results obtained by magphys+photo-z.
EG-ALMA 2a/2b and EG-ALMA 6a/6b/6c are two multiply imaged systems. (The latter has from the ALMA spectroscopy; see Appendix B.) It is difficult to obtain reliable photometry for them because the images are highly distorted. This is reflected in the disagreement in values for the individual images and for the same image as measured by the two different methods. We have therefore excluded these objects from the later discussion. We also exclude UDS-ALMA 2, which is likely a quasar, for most purposes.
3.2 Host galaxy star formation: from star-forming to quiescent
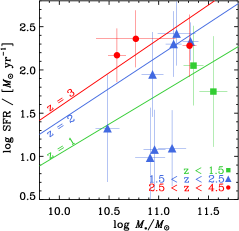
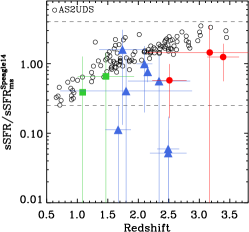
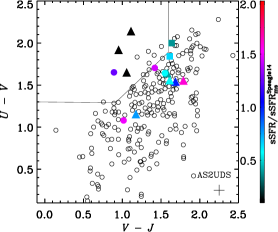
Figure 4 (left) compares these ALMA source hosts to the “star-formation main sequence” from Speagle et al. (2014). Excluding EG-ALMA 2a/2b, EG-ALMA 6a/6b/6c and UDS-ALMA 2, all other sources have M⊙, in line with the general SMG population. However, three objects have M⊙ yr-1, which puts them well below the main sequence. This is more clearly seen in Figure 4 (middle). The mean ratio of sSFR to main sequence is 0.24; the aforementioned three sources are below 0.10, which places them in the realm of quiescent galaxies. In other words, their host galaxies have already built up the bulk of their stellar masses, and their ongoing star formation, while detectable from the submm/mm emission, is not significantly increasing the host’s stellar mass. The usual UVJ diagnostic (Figure 4 right) shows that the three quiescent hosts are indeed in the conventional quiescent-galaxy region (Labbé et al., 2005; Williams et al., 2009), verifying the low sSFR.
3.3 Morphology of host galaxies
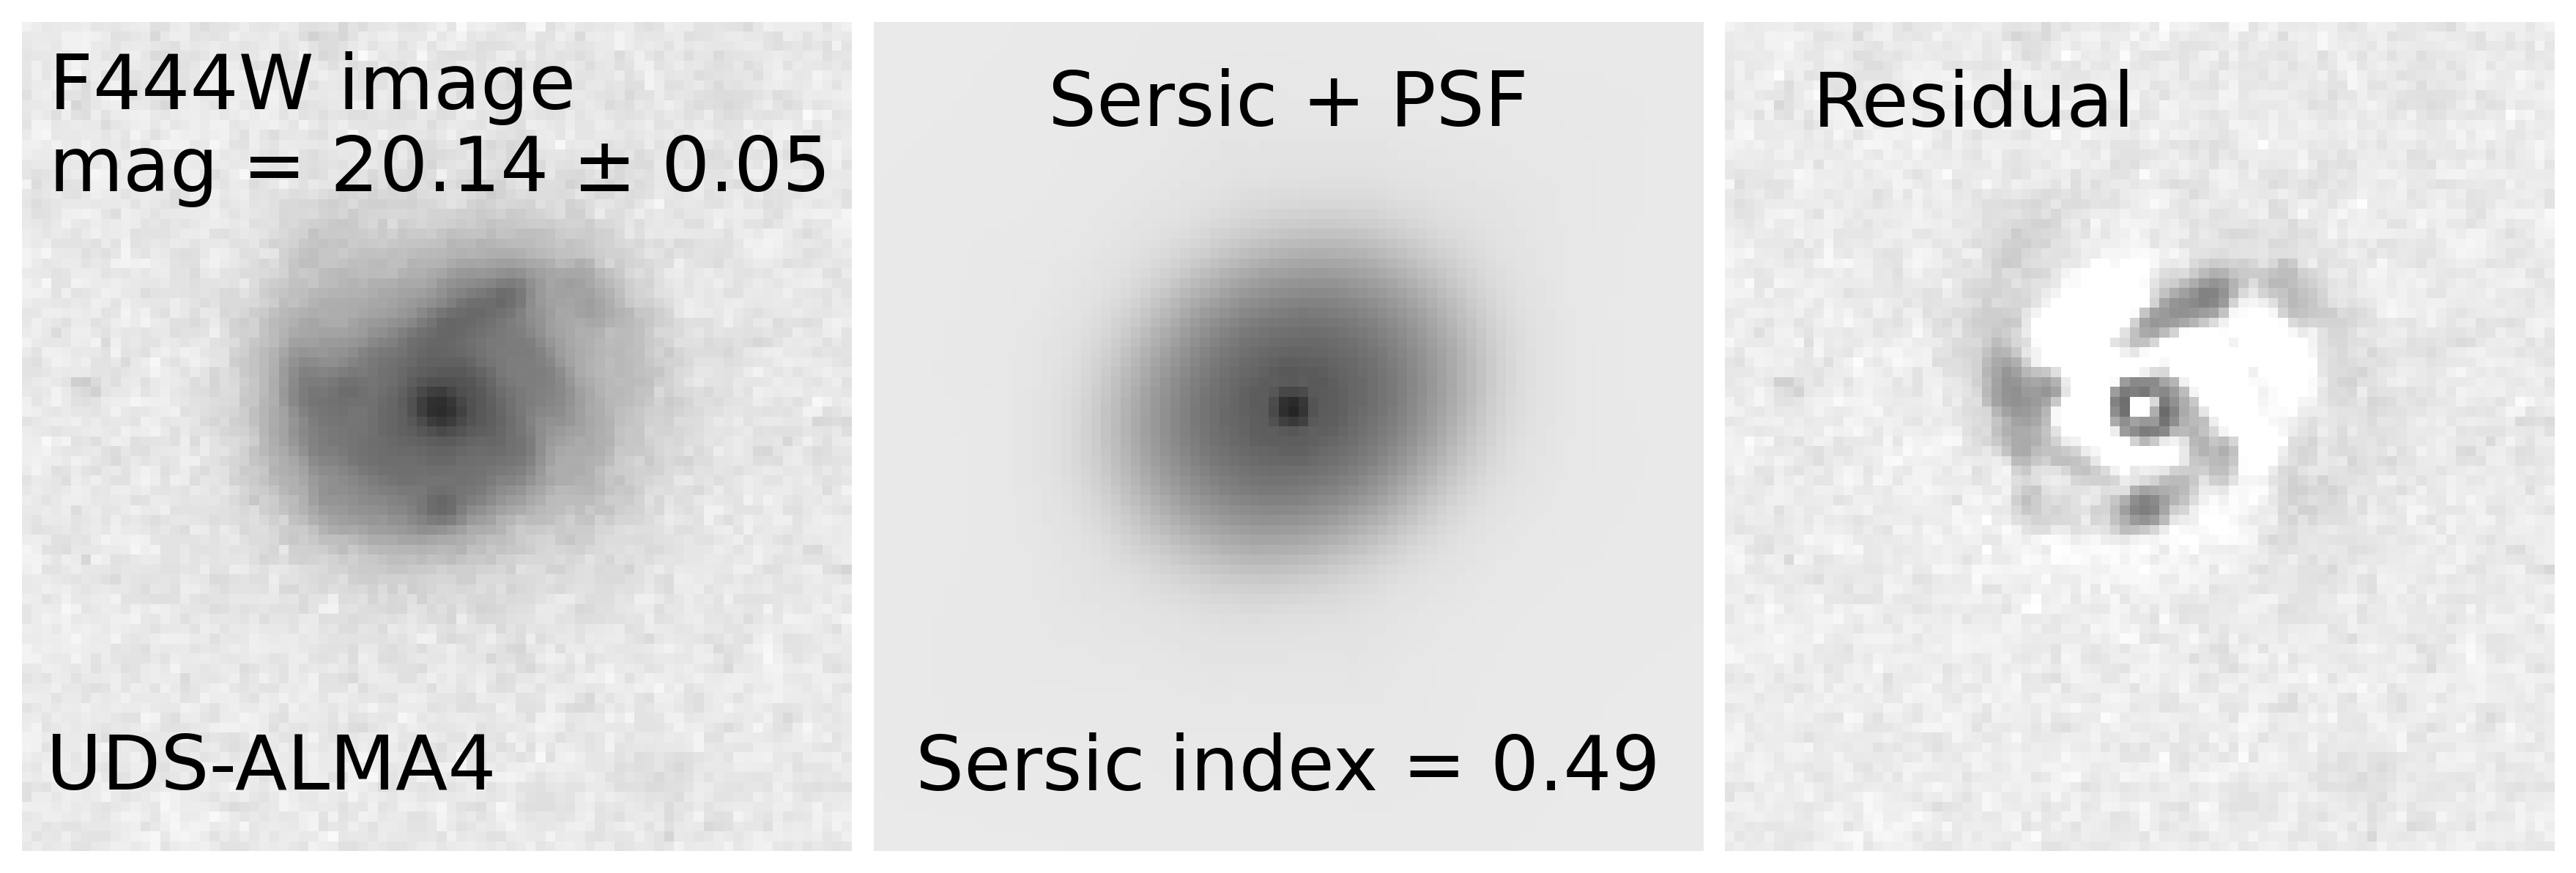
The NIRCam images (Figure 1) allow morphologies to be determined for 13 of the ALMA source hosts.111The two multiply imaged systems in El Gordo are highly distorted, and UDS-ALMA 2 is a point source and potentially hosts a quasar. Morphologies cannot be determined for these. By our visual classification, all 13 show non-disturbed (or weakly disturbed) disks even though some of them (e.g., UDS-ALMA 4) might have features indicative of a recent minor merger.222EG-ALMA 11 has a close neighbor comparable in size, but the neighbor’s spectroscopic redshift shows that it is a foreground galaxy.
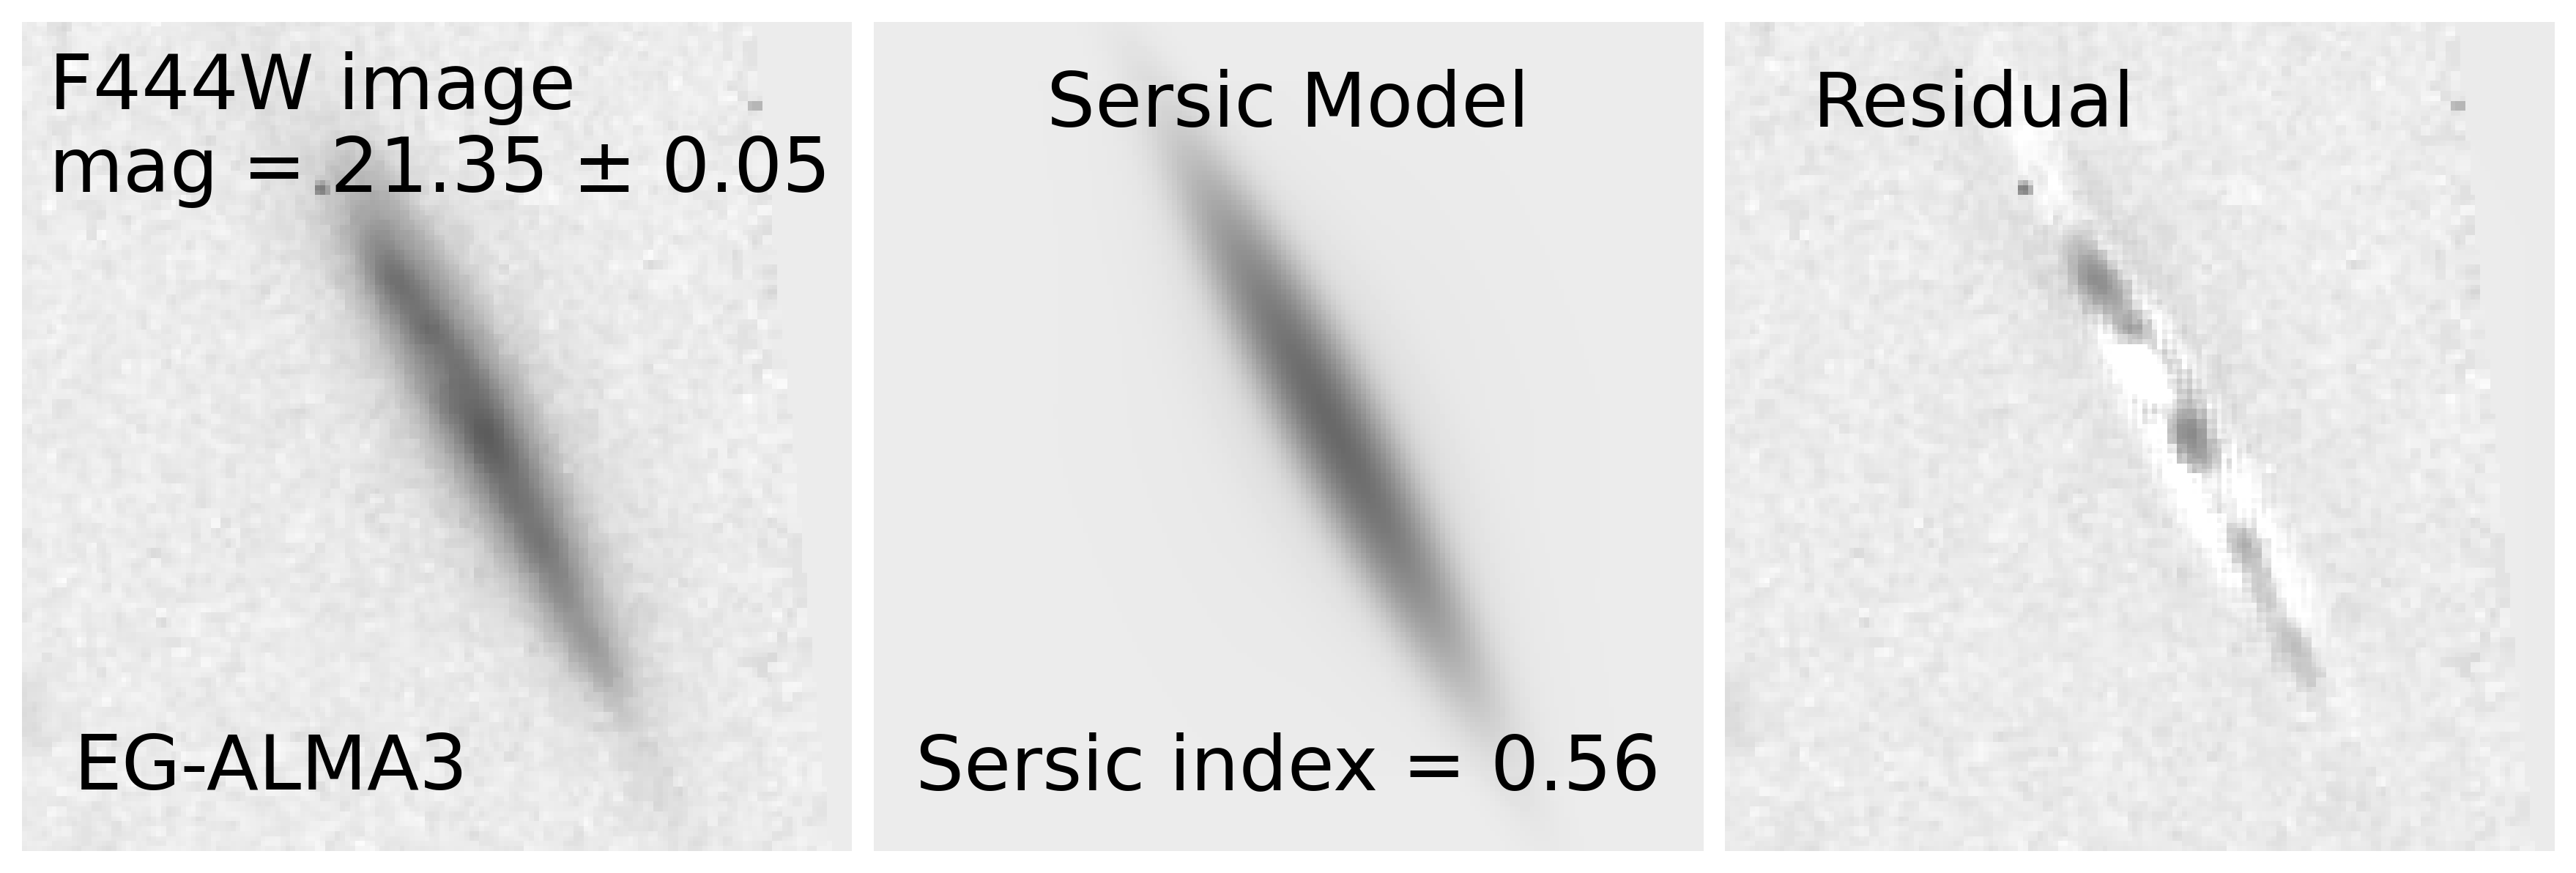
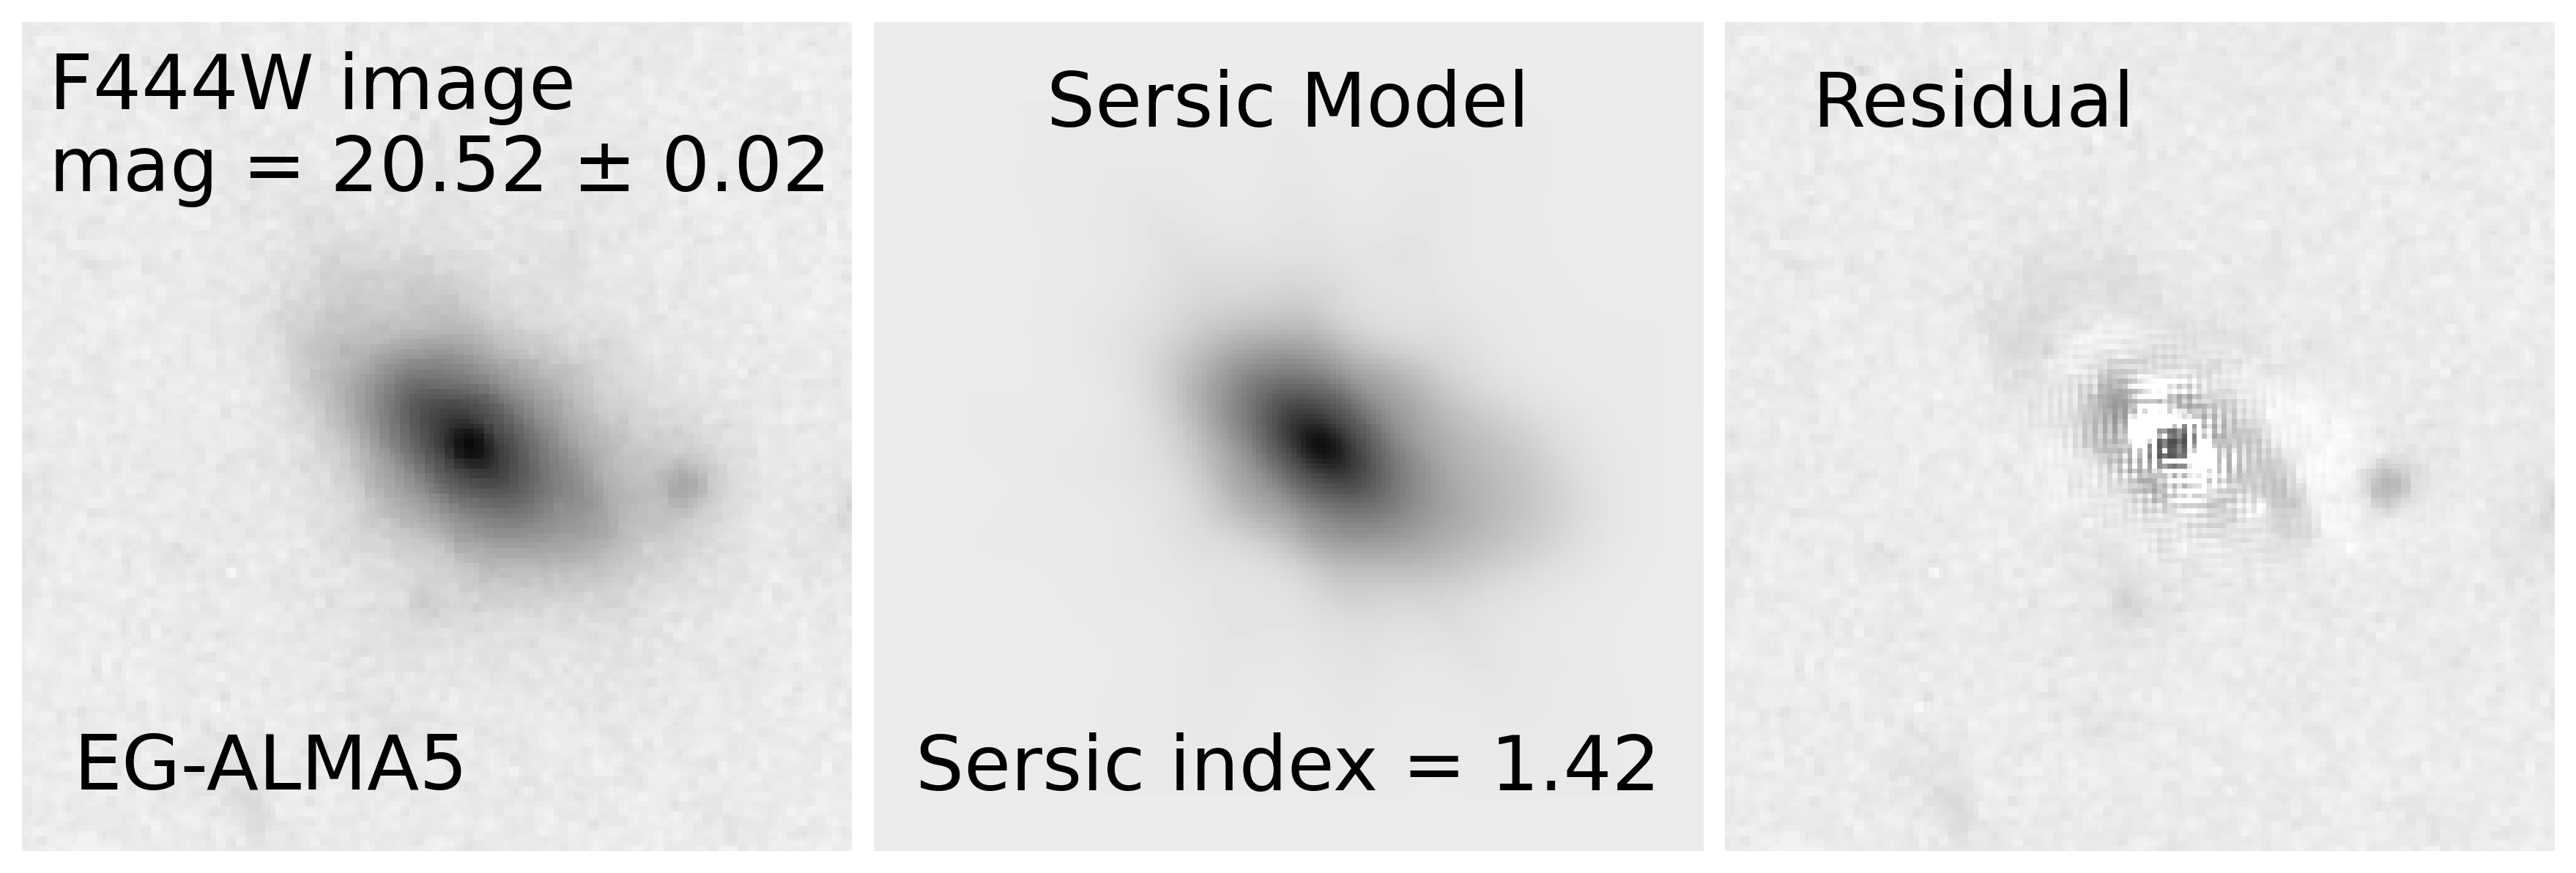
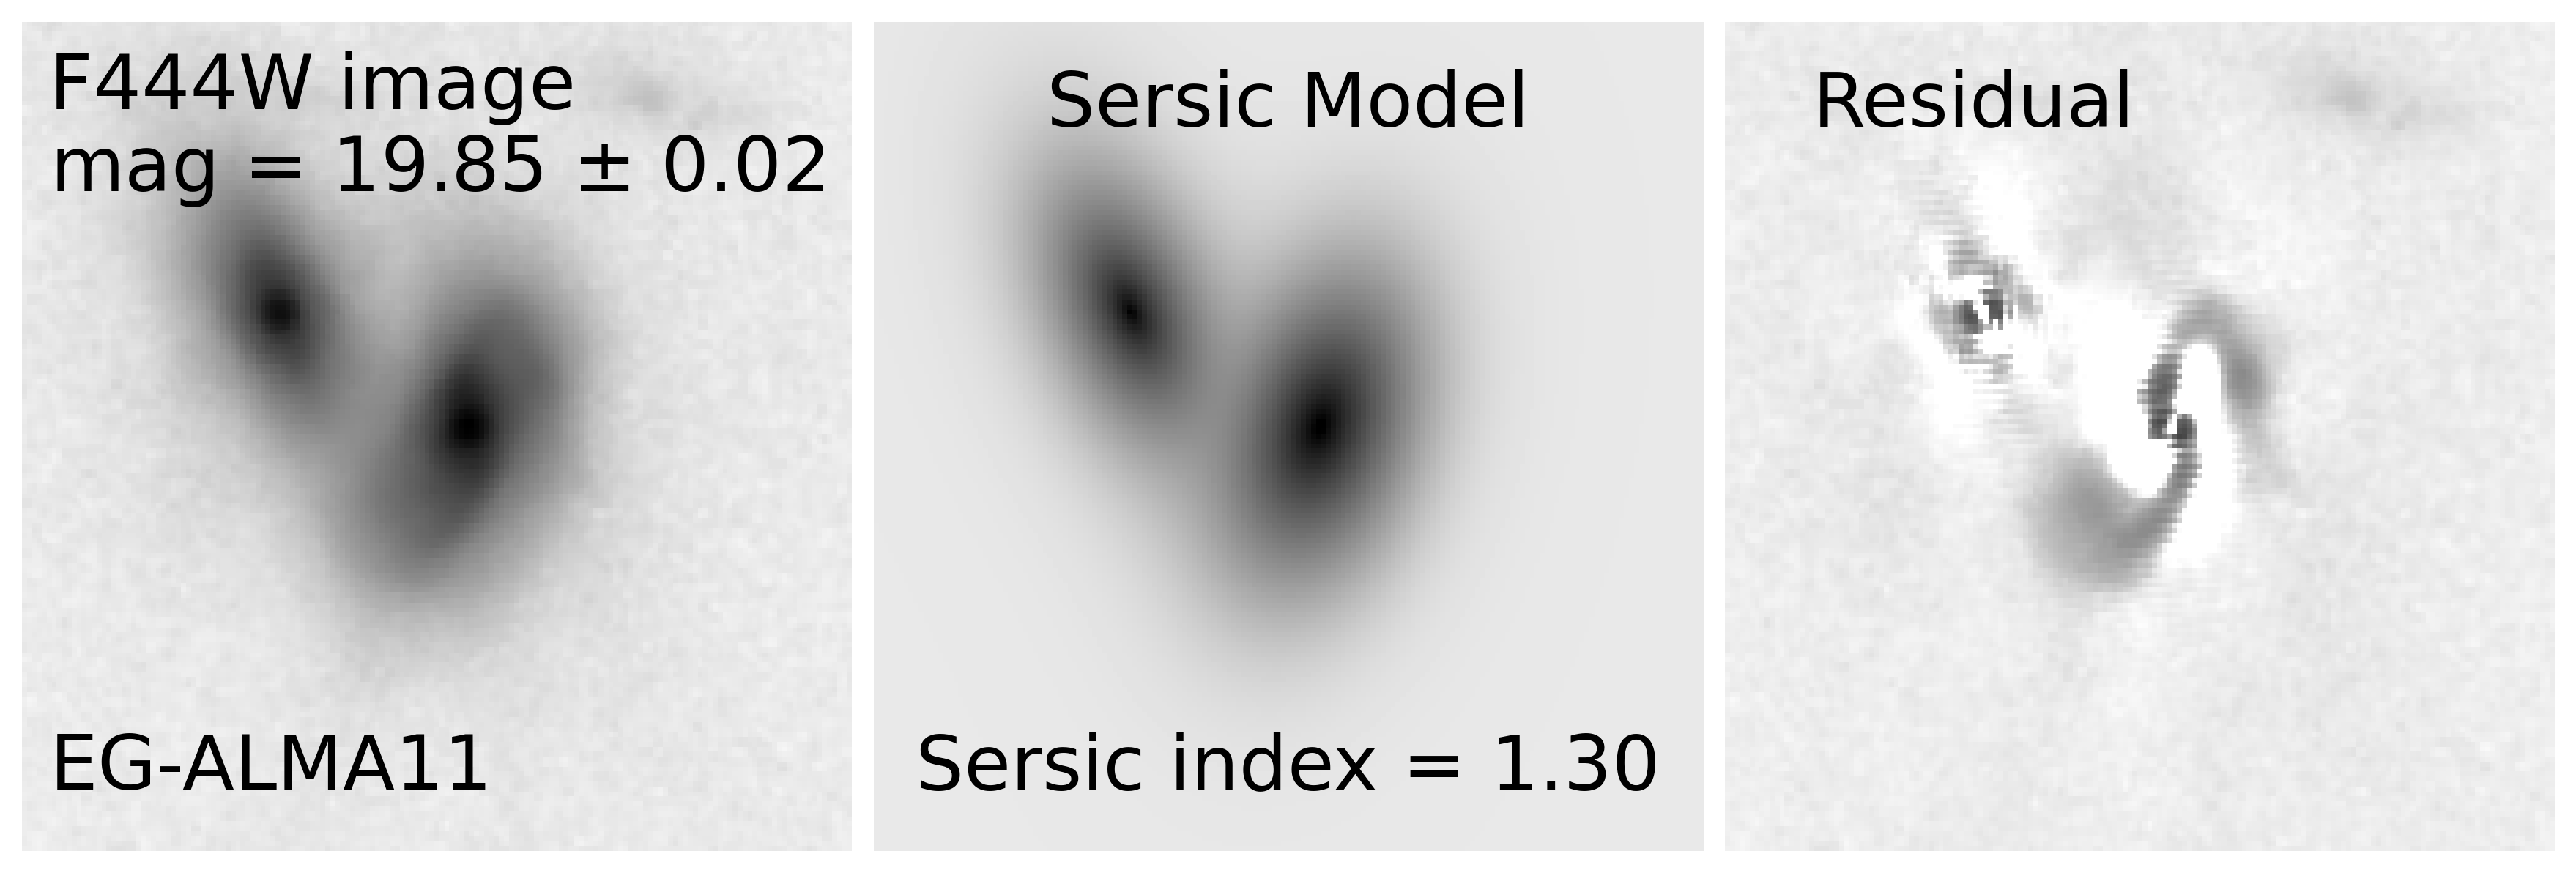
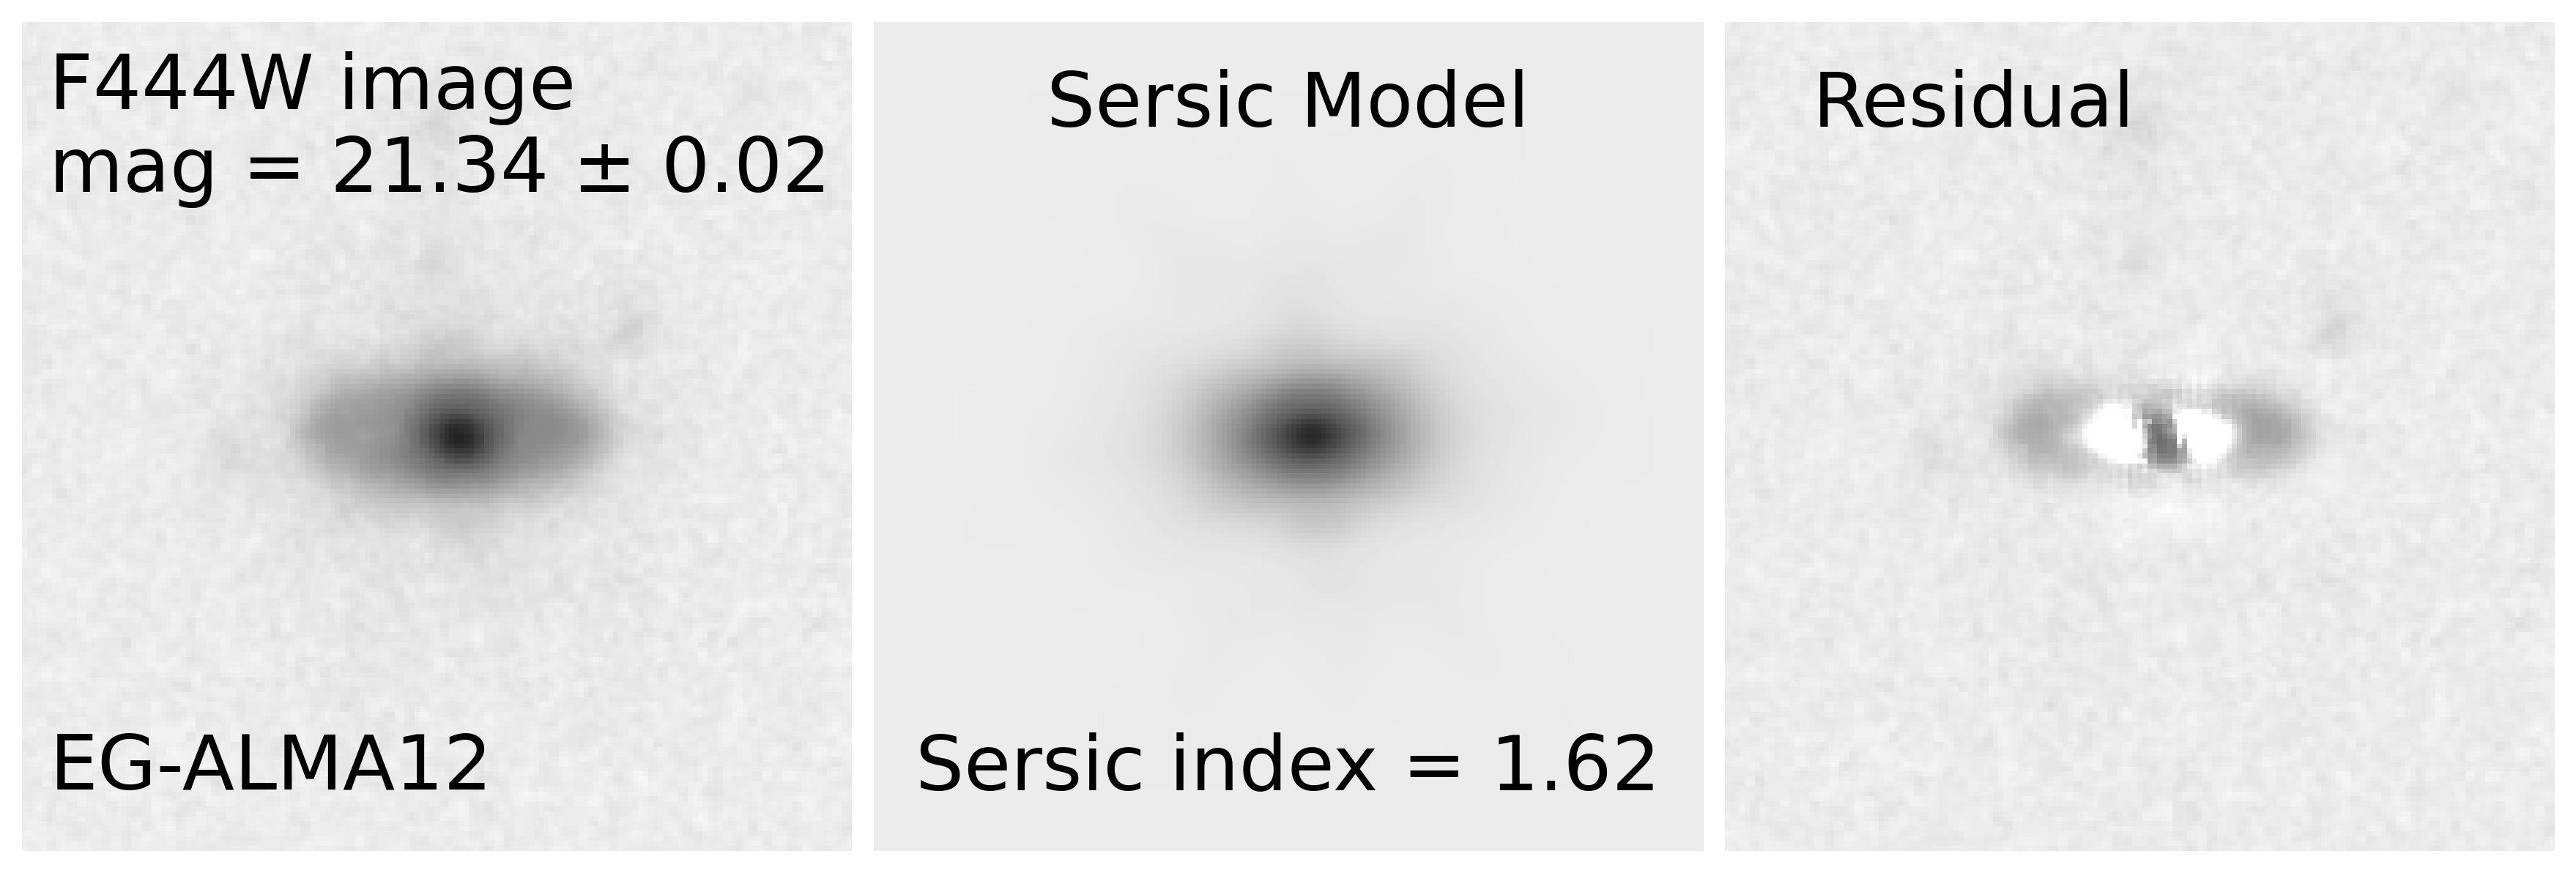
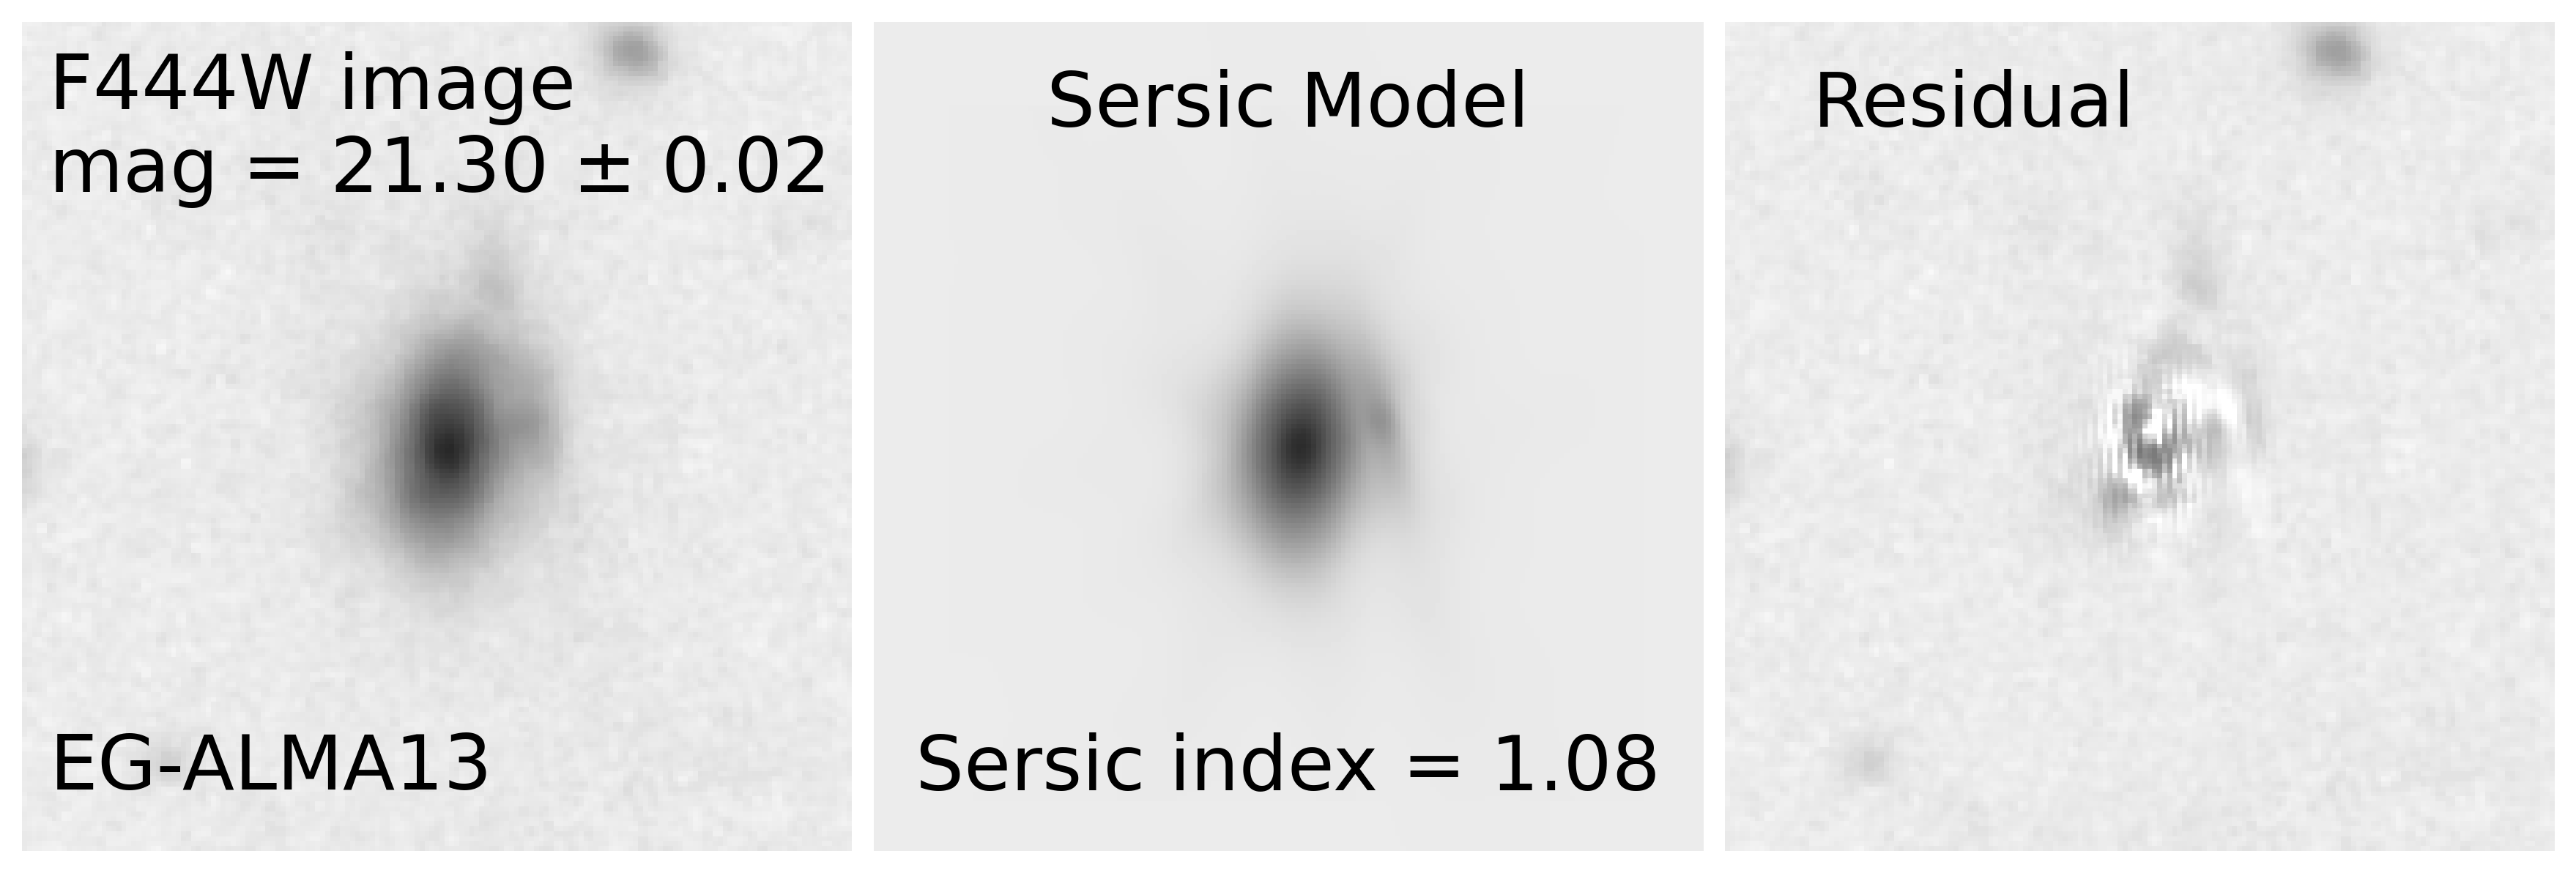
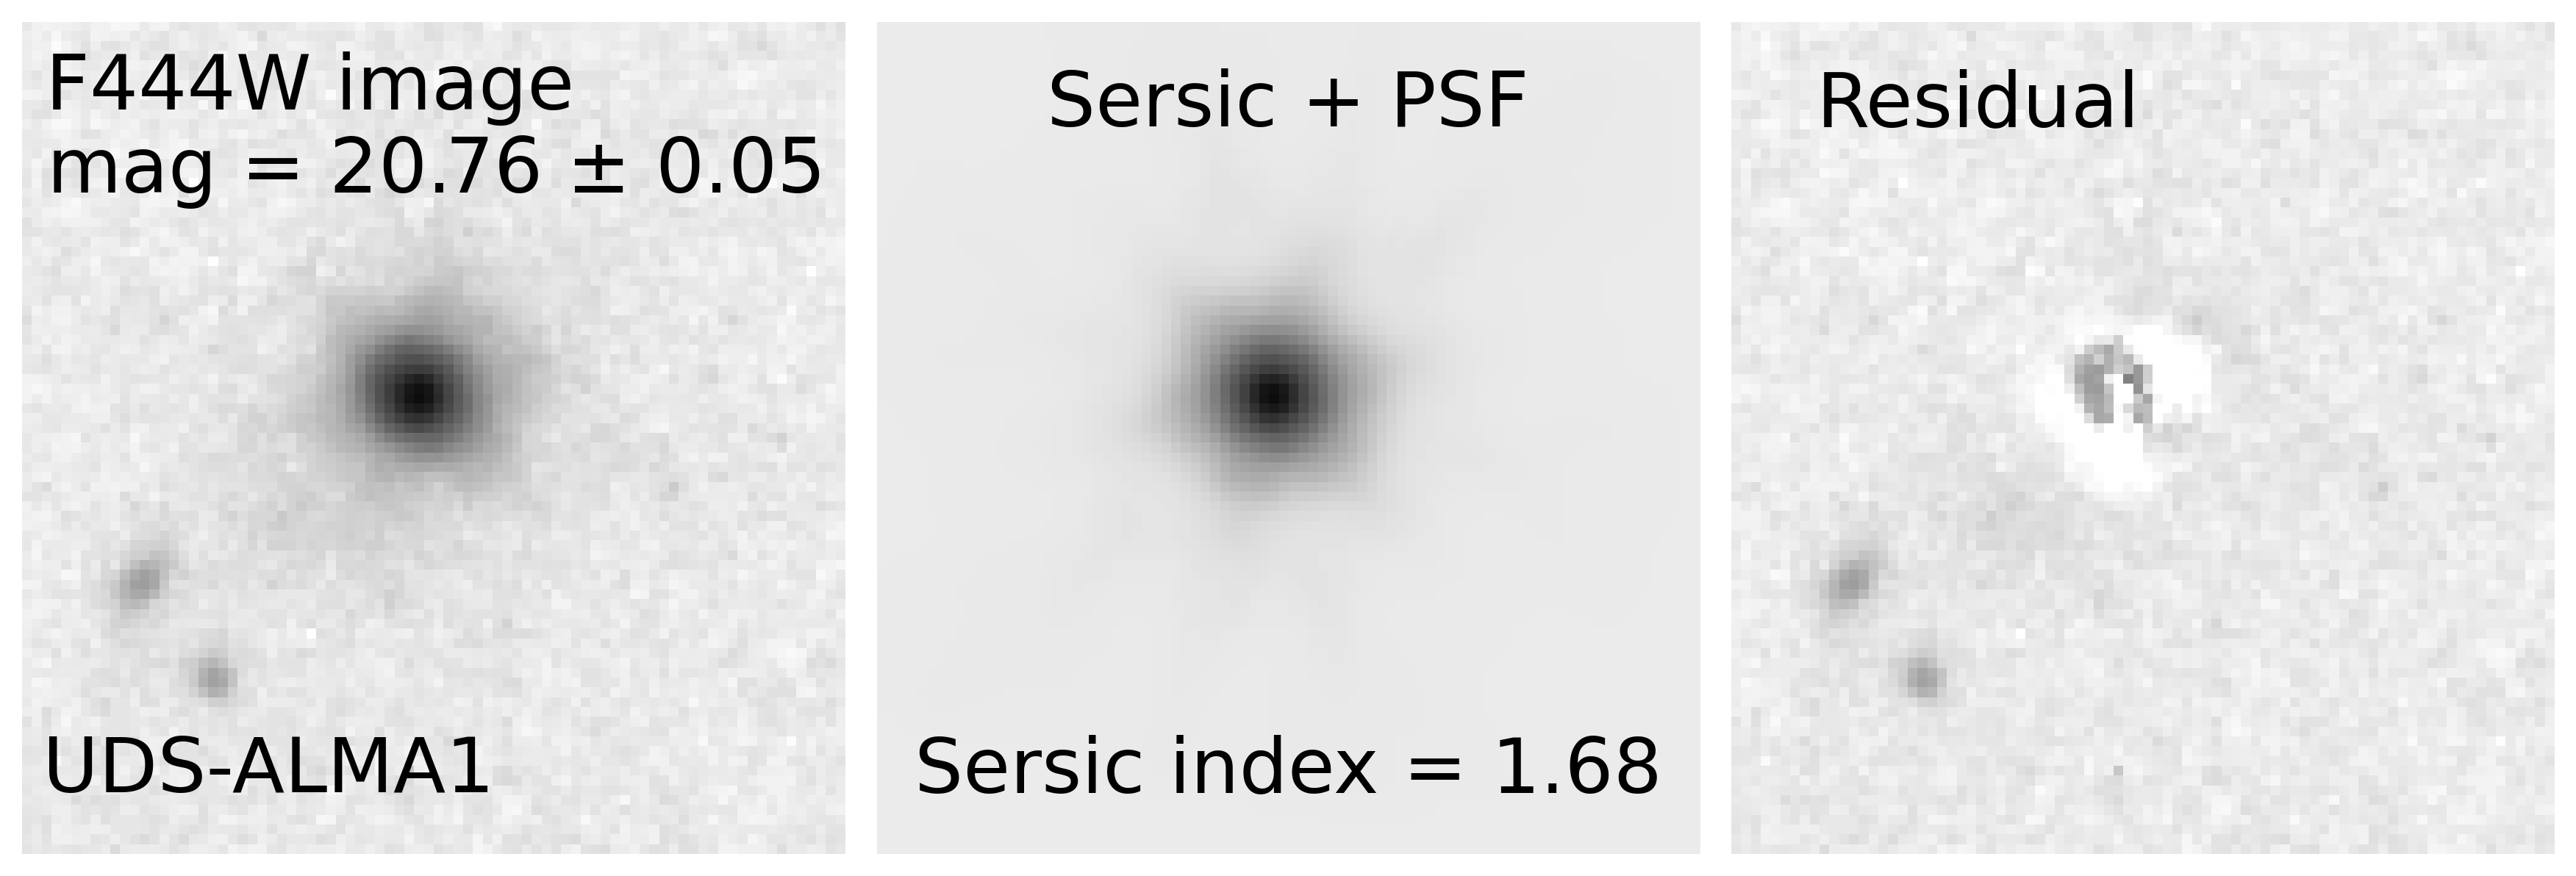
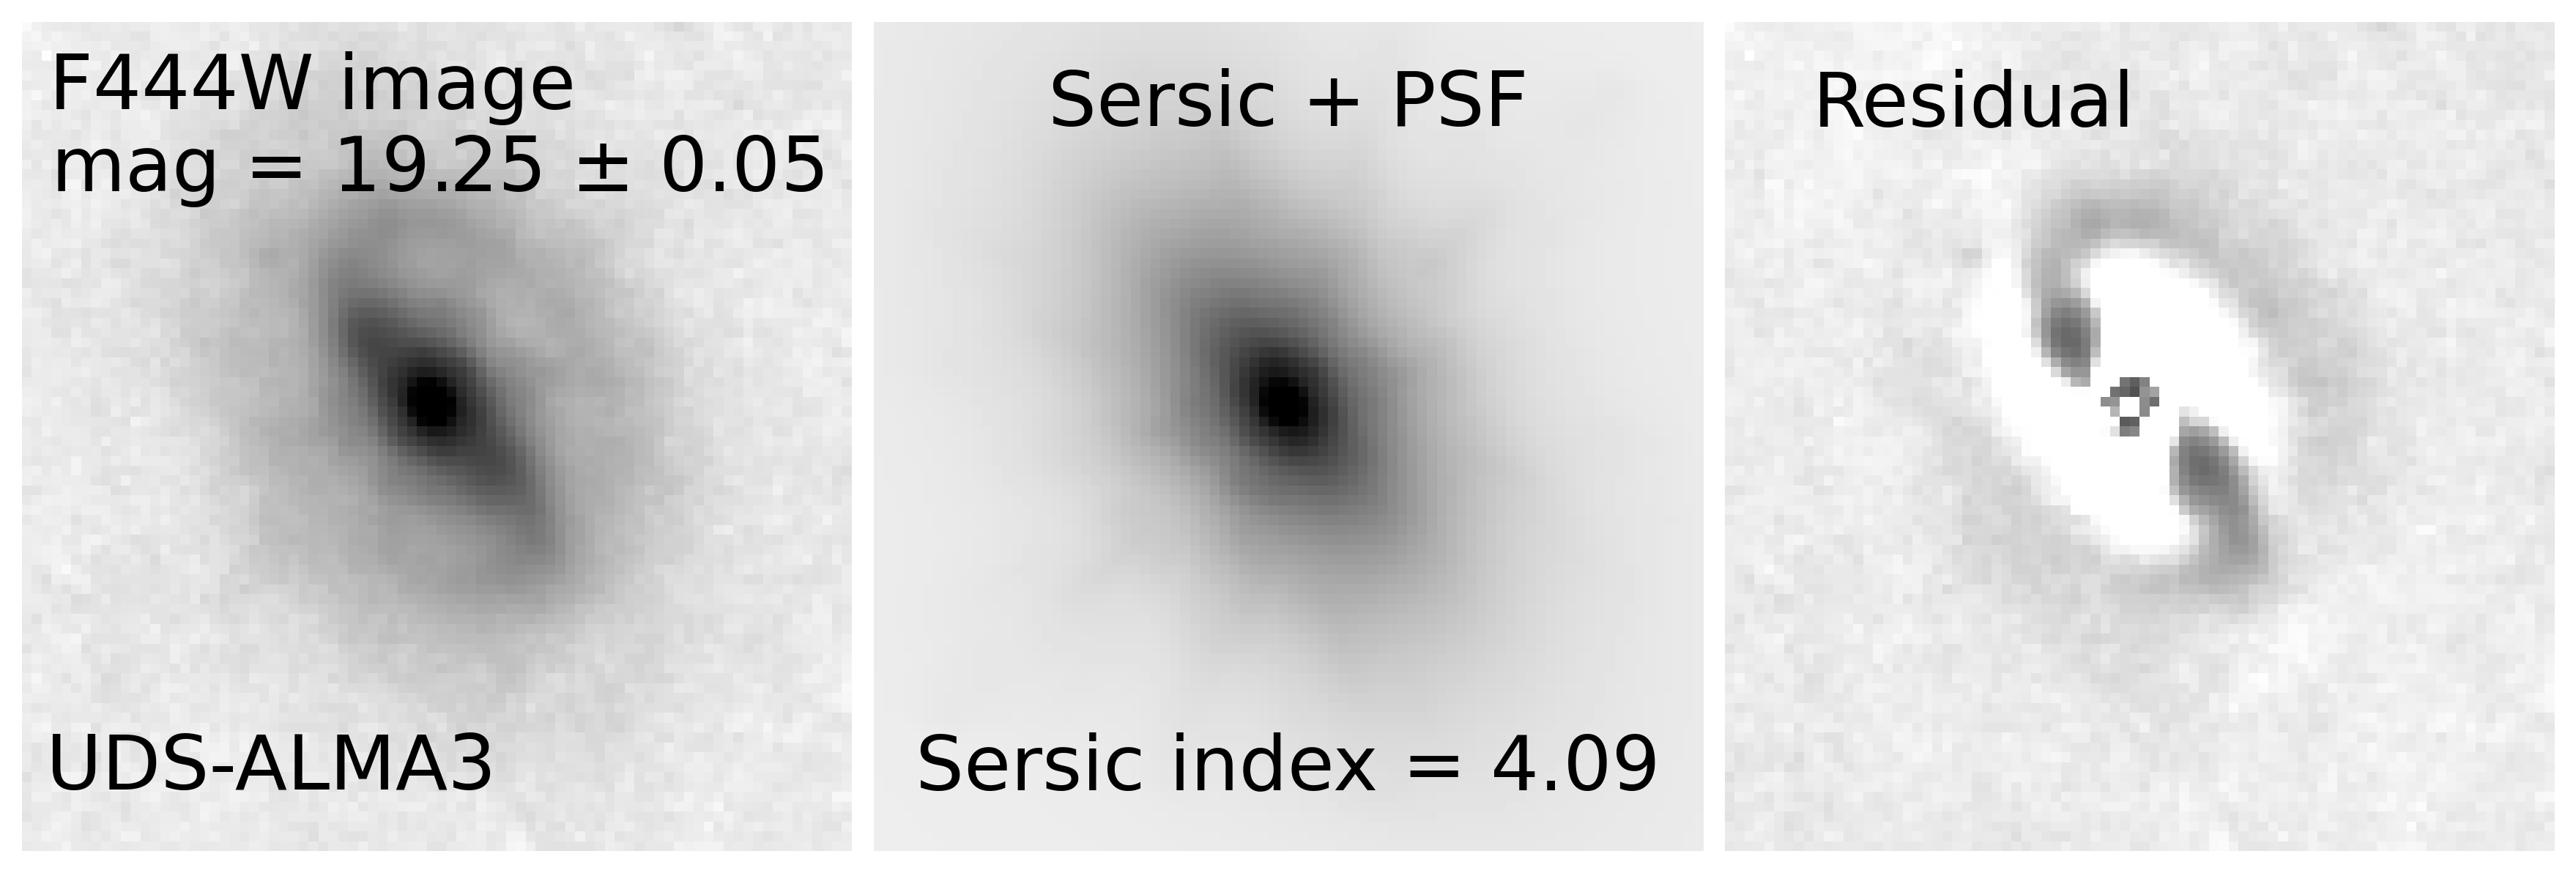
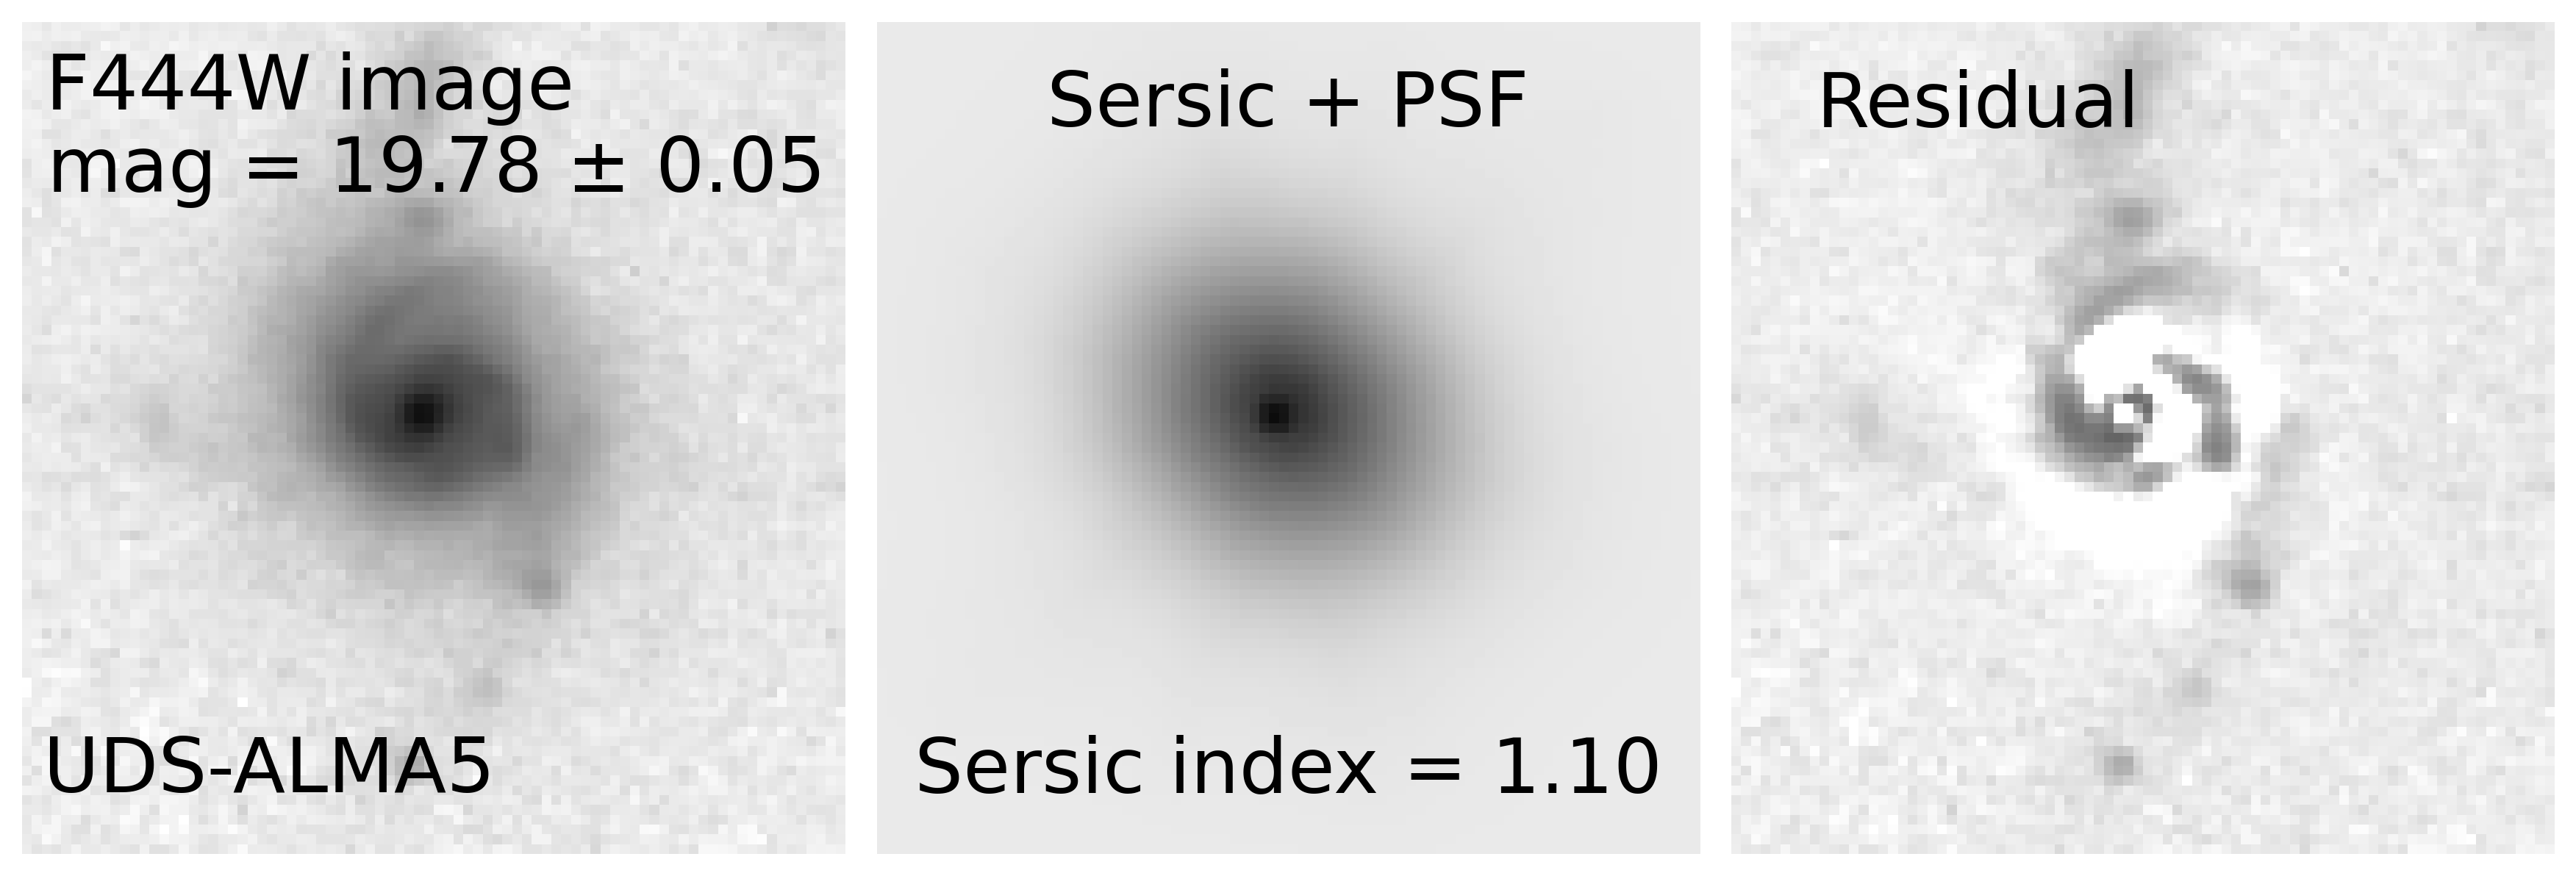
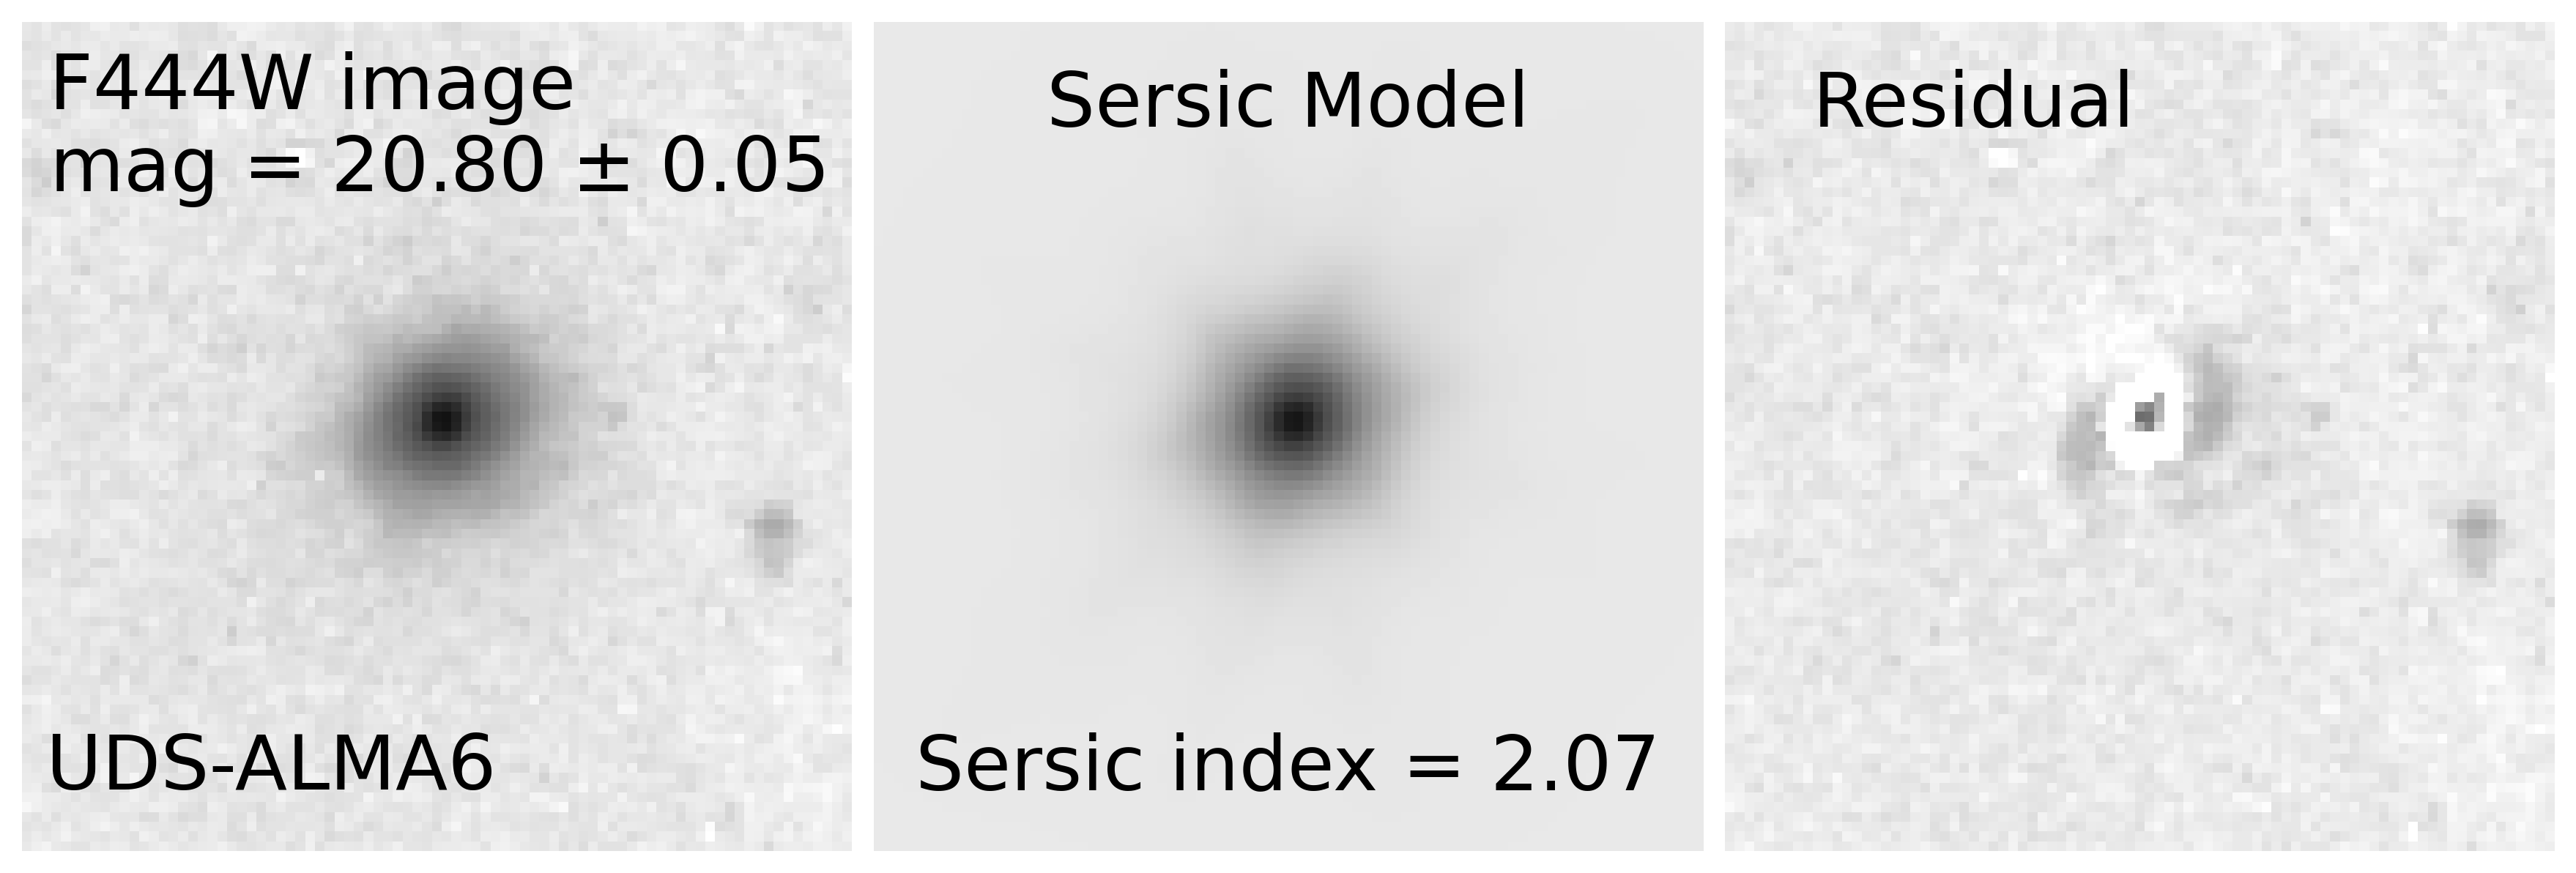
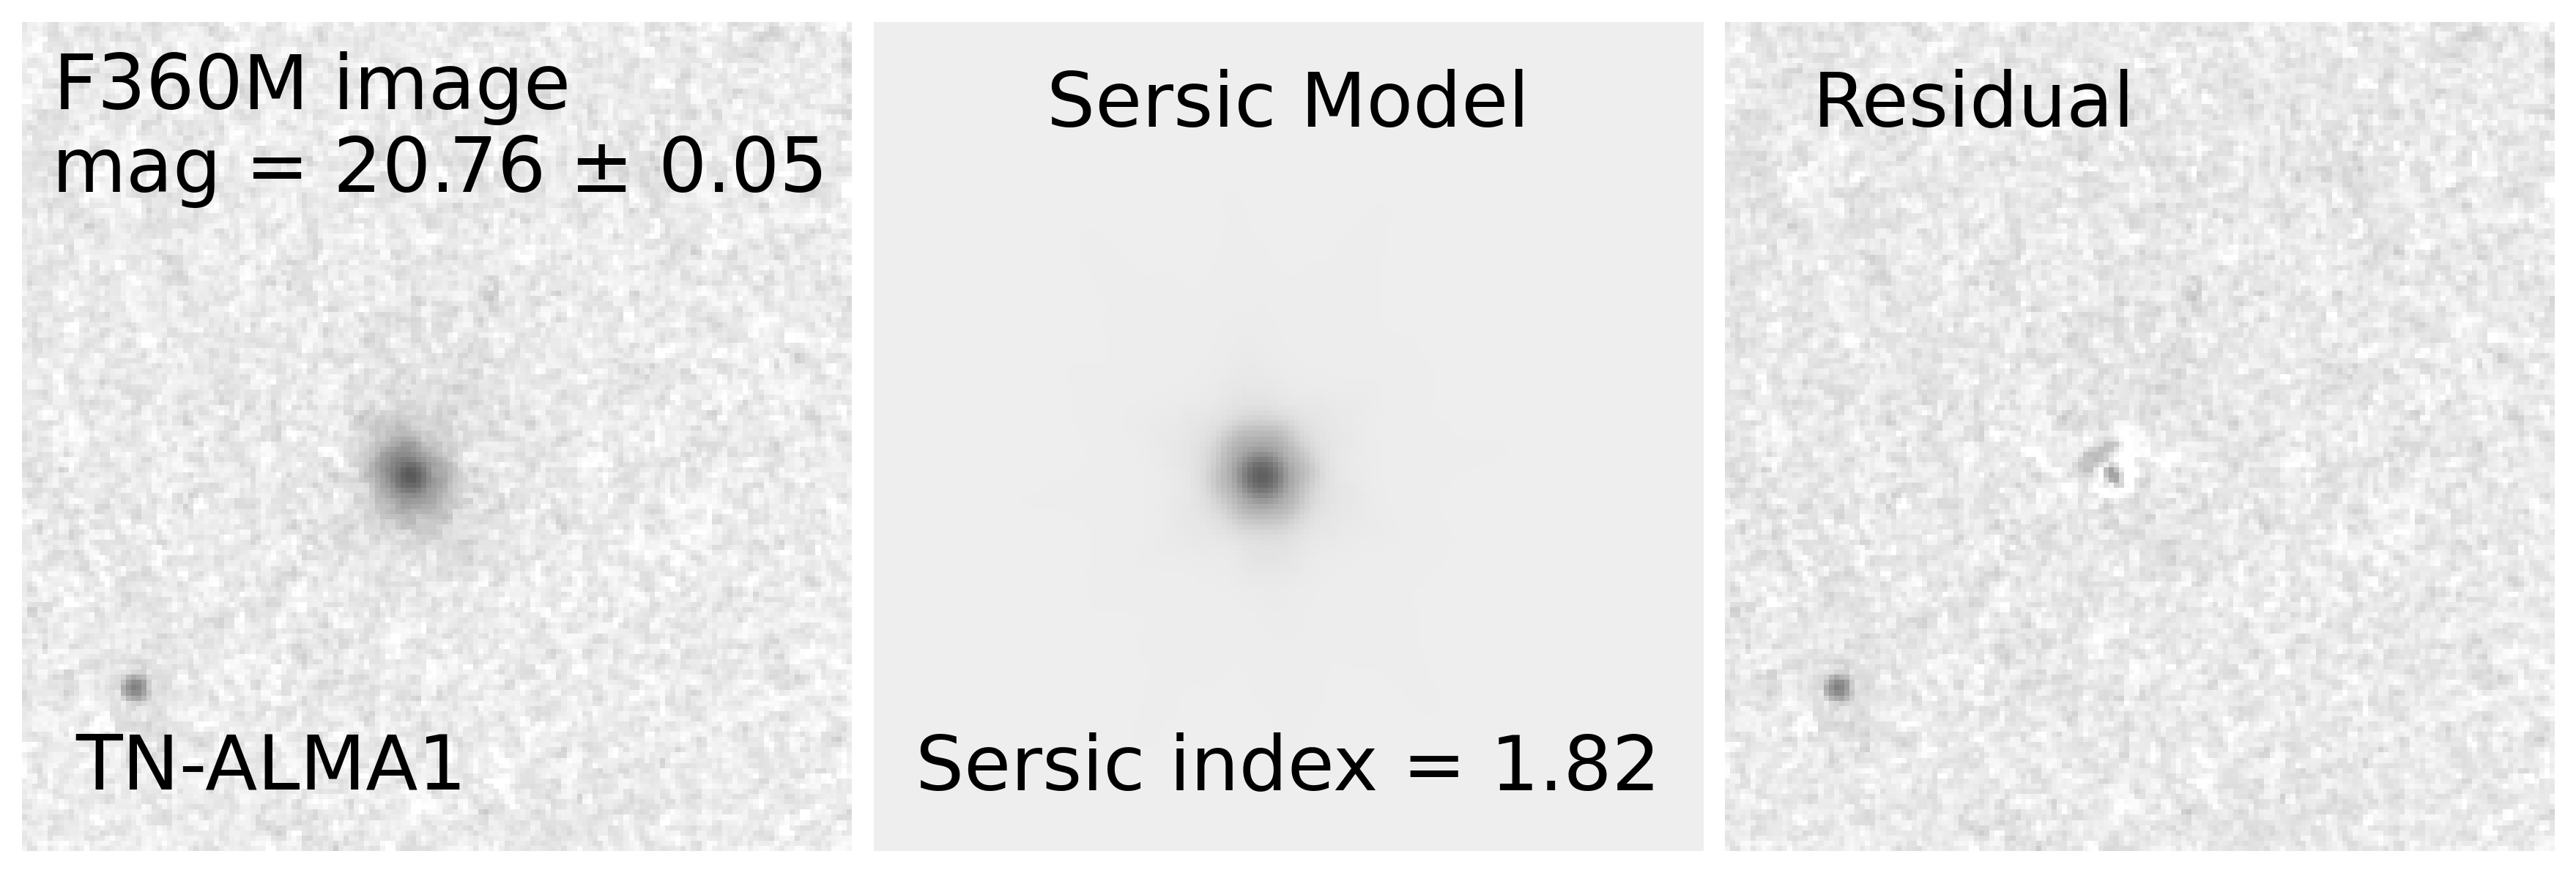
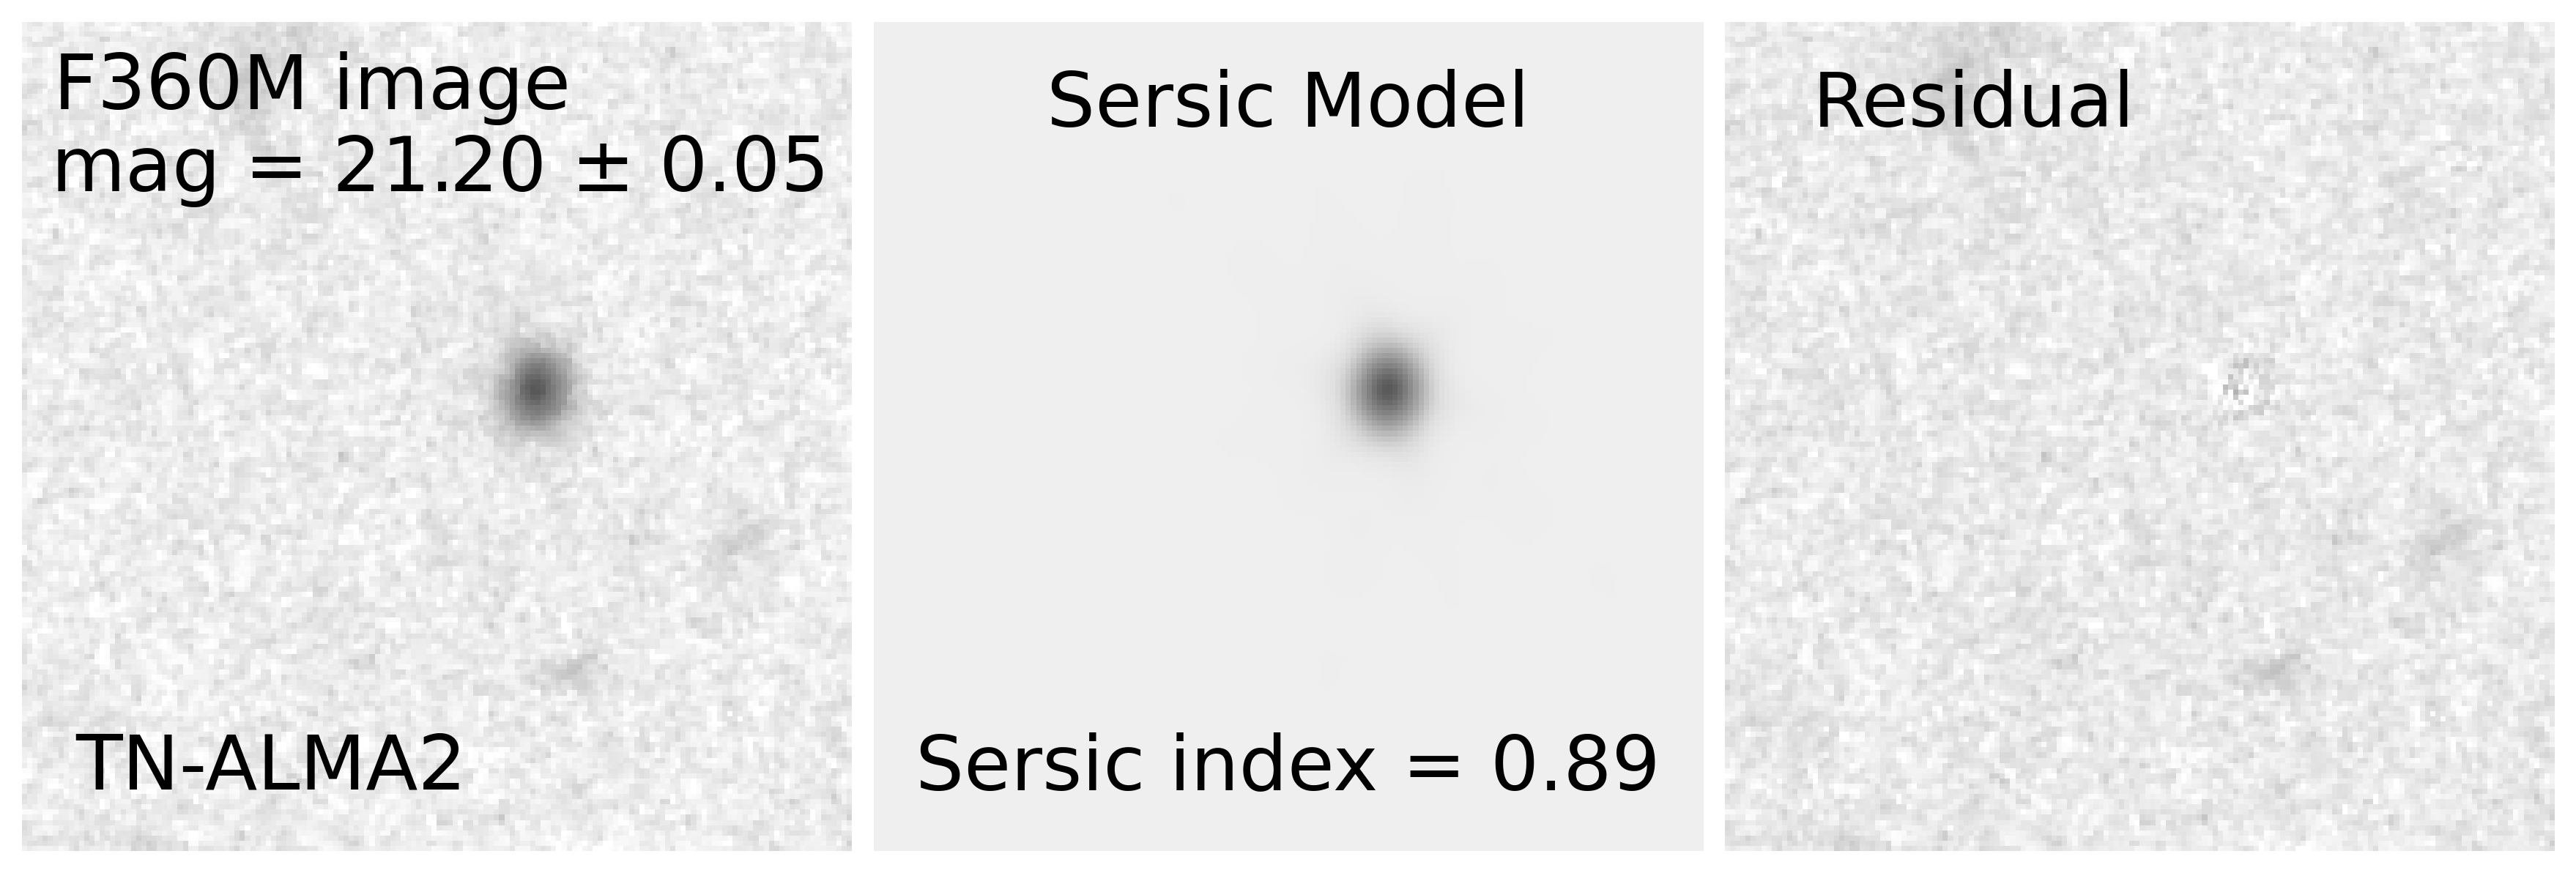
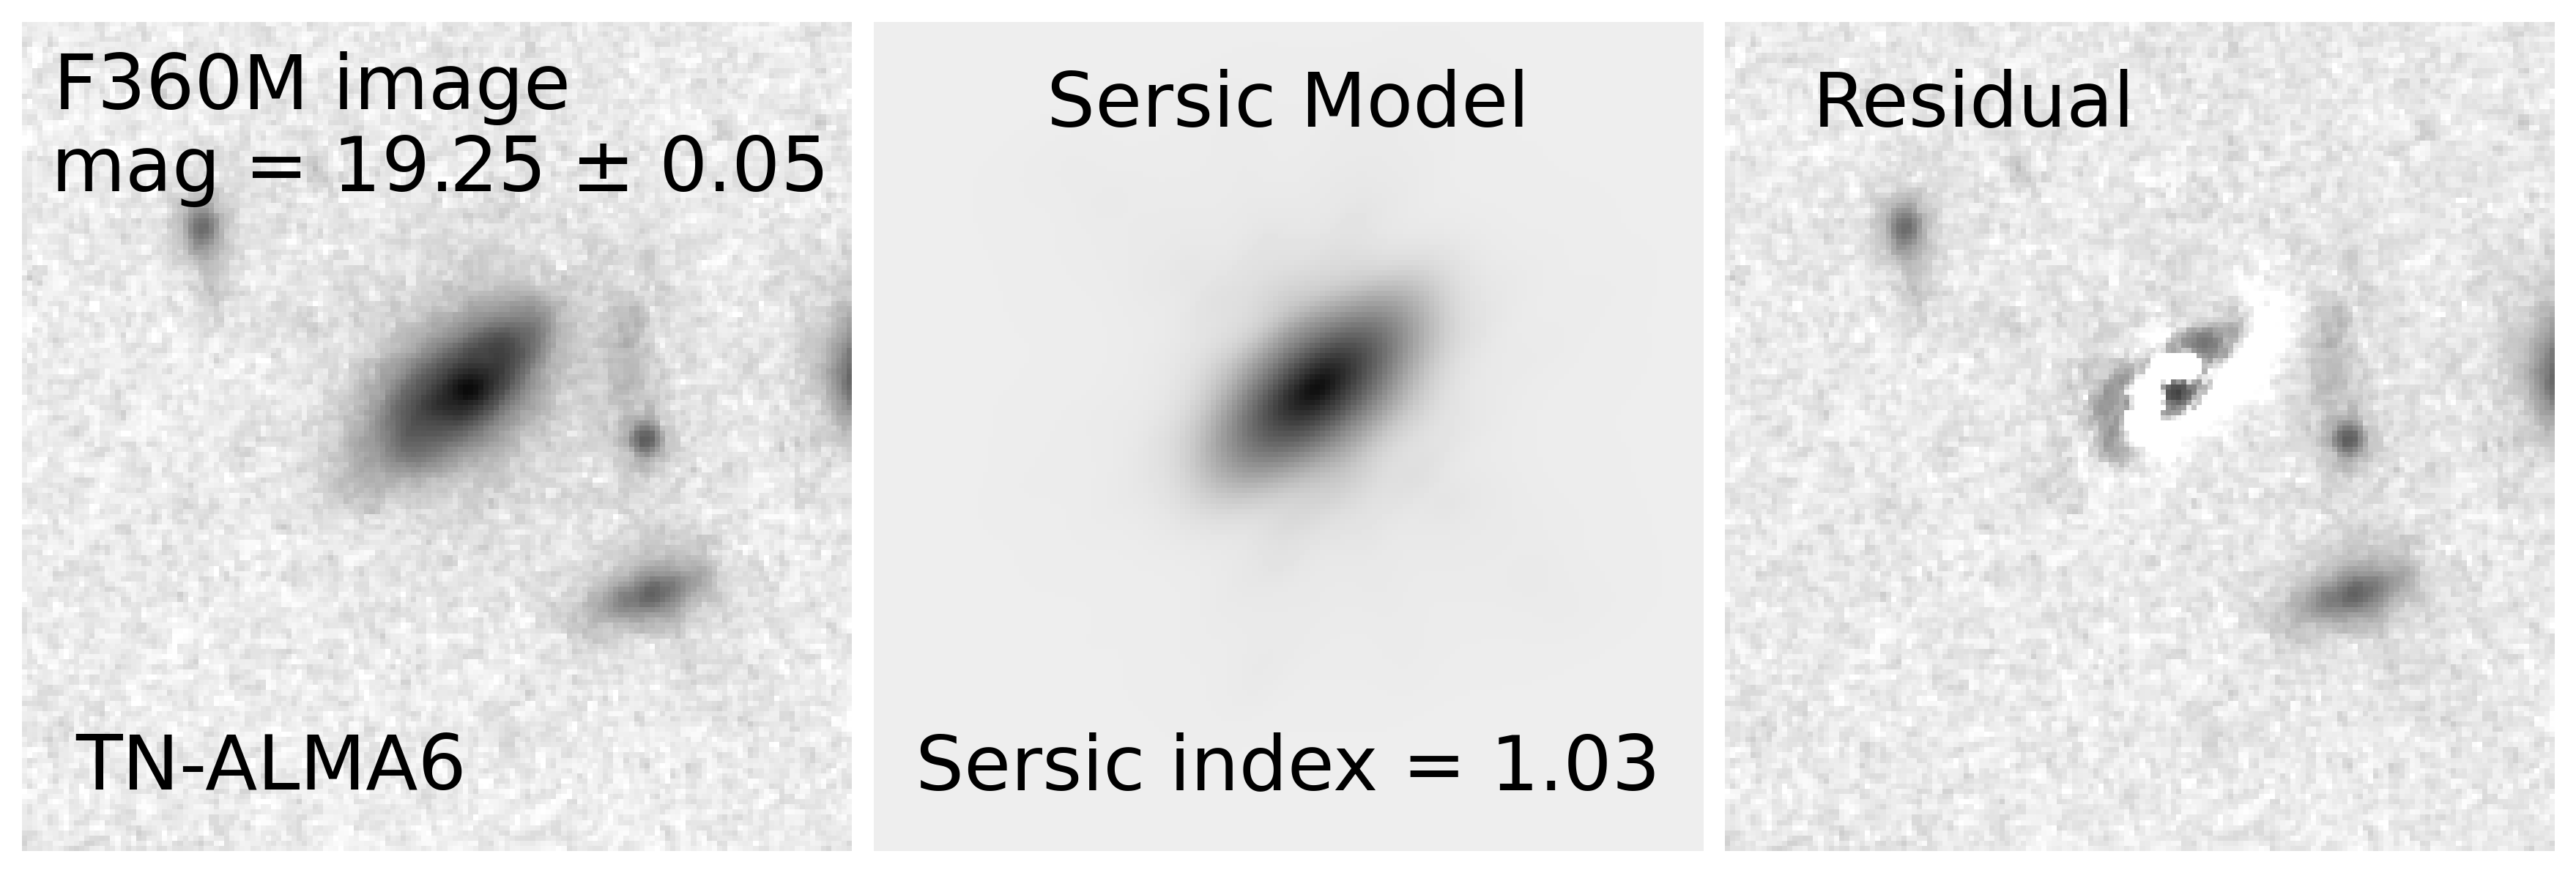
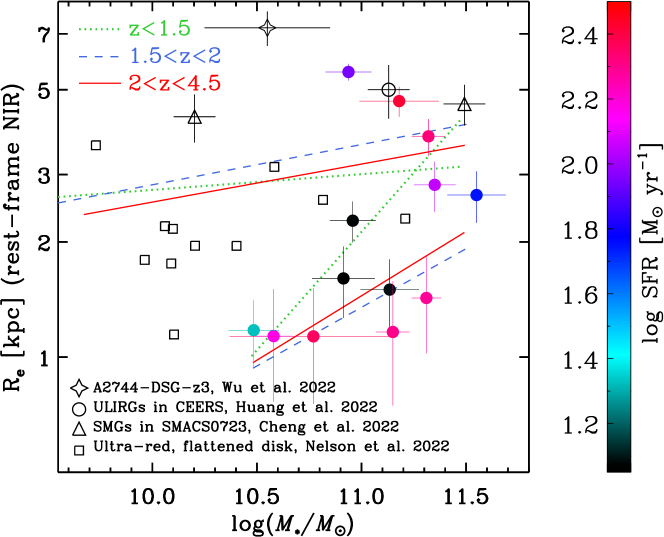
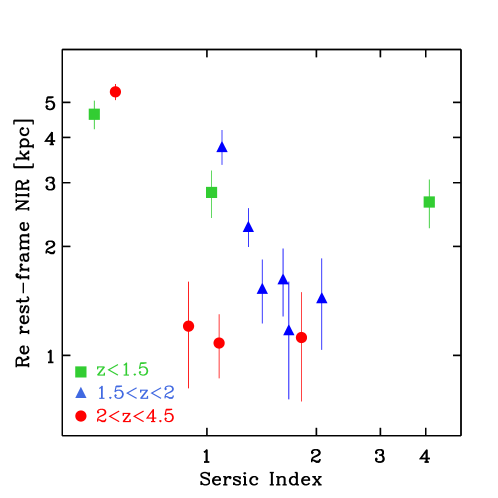
To further study the morphologies, we ran galfit (Peng et al., 2002) to fit Sérsic profiles to the galaxies’ F444W or F360M images (the latter only for the three TNJ1338 sources). The results are shown in Figure 5 and detailed in Appendix B. Briefly, the fitted Sérsic indices are near 1 (median ), consistent with disky galaxies. The galfit run also computed half-light radii () based on the best-fit profile and excluding a central point-source when one was present. At the source redshifts, F444W or F360M samples rest-frame visible to near-IR, and therefore this reflects the stellar mass distribution. In other words, is a proxy for the half-mass radius. The median of our sample is 1.6 kpc with bootstrap uncertainty 0.4 kpc. The dispersion of the whole sample is 1.4 kpc. For comparison, the median of the disk galaxies among the far-IR/SMG sample () of Ling & Yan (2022) is 3.6 kpc. Figure 6 shows the mass–size distributions of our ALMA sources as well as those of the few recently published NIRCam results in other fields. The mass–size relations of star-forming and quiescent galaxies from Suess et al. (2019, their Fig. 7) are also shown for comparison. Qualitatively, most of our sources fall below the relation for star-forming galaxies and are more in line with that of quiescent galaxies, despite the fact that most of our sources are not quiescent. In contrast, the ultra-red, flattened, disky galaxies recently found by Nelson et al. (2022) have larger and follow more closely the relation for star-forming galaxies. A larger sample will be needed to further investigate this problem.
4 Discussion
4.1 Sample selection effect
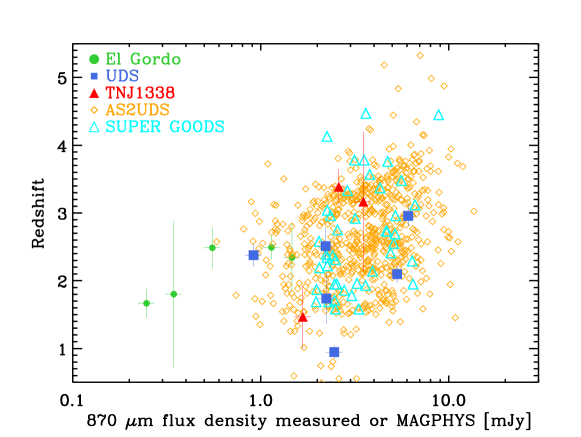
By virtue of their submm/mm emission, the ALMA sources discussed in this work are SMGs. However, they include many sources fainter than the bulk of the SMG population previously studied in the literature. This is because of the combination of the gravitational lensing by a cluster in one of our survey fields and that most of our sources were not pre-selected by surveys using single-dish submm/mm telescopes but were serendipitous discoveries in ALMA maps of various depths. The ALMA maps are deeper than any single-dish survey, and therefore most of our ALMA sources are fainter than those from the usual SMG samples. This is demonstrated in Figure 7. Specific to the El Gordo field, the median flux density of our sample is 1.1 mJy after correcting for the lensing magnification. If we exclude the two multiply imaged systems, the median drops to 0.5 mJy in the El Gordo field, and the median of the whole sample is 2 mJy. In contrast, the AS2UDS sample has median mJy and reaches down to 0.6 mJy. Our sample therefore includes more SMGs with low-to-moderate SFRs, which explains why most of our sources exhibit properties (e.g., their non-disturbed disky morphologies) different from those often described in the literature. On the other hand, it is not surprising that most 2 galaxies should have some low-level, ongoing star formation. Due to the high sensitivity of ALMA, our sample is more sensitive than the single-dish-pre-selected SMG samples in probing such activity.
4.2 Disk galaxy evolution
After excluding the two multiply imaged systems (EG-ALMA 2a/2b and EG-ALMA 6a/6b/6c) and the quasar (UDS-ALMA 2), the remaining 13 ALMA source hosts in our sample are all disk galaxies, mostly showing little sign of disturbance suggestive of major mergers. The two ALMA sources of Cheng et al. (2022) that are large enough for morphological study are similar systems. This would be a surprising result in the pre-JWST era. However, recent JWST/NIRCam morphological studies of the general galaxy population have shown that disk galaxies are already common at (Ferreira et al., 2022a, b; Jacobs et al., 2022). If star formation at –3 mostly happens in disk galaxies, it can explain why our ALMA source hosts are mostly such systems.
All these 13 disk galaxies have already acquired large stellar masses, which range from 0.3 to M⊙. As they have no indication of being major mergers, these galaxies most likely assembled the majority of their stars through secular growth (e.g., Guo et al., 2022), although we cannot rule out the role of minor mergers. Given their SFRs of 10 to 300 M⊙ yr-1, their sSFRs spread them over both the star-forming main sequence and the quiescent categories. Three of them are deemed quiescent galaxies based on their sSFRs. These same three galaxies are also in the quiescent region in the rest-frame UVJ diagram, which is to say that their UV-to-near-IR emissions show no sign of ongoing star formation. Had there not been ALMA revealing their low-level star formation hidden by dust (SFRs of 10–15 M⊙ yr-1), they would be viewed as “red-and-dead” and yet disky galaxies. These galaxies are similar to those recently reported by Nelson et al. (2022) in the sense that they are also red disky galaxies; the difference is that ours are still detected in the HST bands. Future morphological study within the same ALMA coverage will reveal whether there really are disk galaxies that have completely ceased star formation.
Another interesting result is that our galaxies have a wide range of half-light (equivalently, half-mass) radii . EG-ALMA 3 has the largest kpc, while EG-ALMA 13 has the smallest kpc. EG-ALMA 3 (, M⊙, M⊙ yr-1) is similar to the recently reported grand-design spiral galaxy A2744-DSG-z3 at (Wu et al., 2022), which has kpc and M⊙. The latter is also an ALMA source and has M⊙ yr-1 based on its far-IR-to-mm luminosity (Sun et al., 2022). Such large disks are rare in our sample, however, the median of our sample is 1.6 kpc, which means that our targets are predominantly small disks. The sizes of the general disk-galaxy population at is still awaiting investigation, and therefore it is unclear whether our sample being dominated by small disks is normal or is caused by some selection bias that is still unknown to us.
5 Summary
While our sample consists of only 16 unique objects, it is the largest to date that has both ALMA and JWST/NIRCam data. The ALMA positions enabled us to pinpoint unambiguous NIRCam counterparts. Due to the high sensitivities of the ALMA data, our sample is more inclusive than the classic SMG samples in that our sources show a much wider range of properties. We are able to probe dust-embedded star formation as low as M⊙ yr-1. The deep, high-resolution NIRCam data detect the rest-frame near-IR emission from long-lived stars that dominate the stellar masses, and most of our sources are high-mass ( M⊙) galaxies with typically non-disturbed disks. Furthermore, most of them have small-to-medium half-mass radii (median of only 1.6 kpc), suggesting that they are small disks. We postulate that secular growth can be a viable route to build high-mass disk galaxies and that we can now see snapshots of such processes in the submm/mm regime in a similar way as in UV-to-IR wavelengths. Of course, we will need a much larger sample to have sufficient statistics in different mass, morphology, and redshift bins. This calls for the synergy of ALMA and JWST.
References
- Astropy Collaboration et al. (2013) Astropy Collaboration, Robitaille, T. P., Tollerud, E. J., et al. 2013, A&A, 558, A33, doi: 10.1051/0004-6361/201322068
- Astropy Collaboration et al. (2018) Astropy Collaboration, Price-Whelan, A. M., Sipőcz, B. M., et al. 2018, AJ, 156, 123, doi: 10.3847/1538-3881/aabc4f
- Battisti et al. (2019) Battisti, A. J., da Cunha, E., Grasha, K., et al. 2019, ApJ, 882, 61, doi: 10.3847/1538-4357/ab345d
- Bertin & Arnouts (1996) Bertin, E., & Arnouts, S. 1996, A&AS, 117, 393, doi: 10.1051/aas:1996164
- Birkin et al. (2021) Birkin, J. E., Weiss, A., Wardlow, J. L., et al. 2021, MNRAS, 501, 3926, doi: 10.1093/mnras/staa3862
- Blain (1996) Blain, A. W. 1996, MNRAS, 283, 1340, doi: 10.1093/mnras/283.4.1340
- Blain et al. (2002) Blain, A. W., Smail, I., Ivison, R. J., Kneib, J. P., & Frayer, D. T. 2002, Phys. Rep., 369, 111, doi: 10.1016/S0370-1573(02)00134-5
- Bourne et al. (2019) Bourne, N., Dunlop, J. S., Simpson, J. M., et al. 2019, MNRAS, 482, 3135, doi: 10.1093/mnras/sty2773
- Brammer et al. (2008) Brammer, G. B., van Dokkum, P. G., & Coppi, P. 2008, ApJ, 686, 1503, doi: 10.1086/591786
- Caputi et al. (2021) Caputi, K. I., Caminha, G. B., Fujimoto, S., et al. 2021, ApJ, 908, 146, doi: 10.3847/1538-4357/abd4d0
- Cardona-Torres et al. (2022) Cardona-Torres, L., Aretxaga, I., Montaña, A., Zavala, J. A., & Faber, S. M. 2022, arXiv e-prints, arXiv:2210.04437. https://arxiv.org/abs/2210.04437
- Carilli & Walter (2013) Carilli, C. L., & Walter, F. 2013, ARA&A, 51, 105, doi: 10.1146/annurev-astro-082812-140953
- Casey et al. (2014) Casey, C. M., Narayanan, D., & Cooray, A. 2014, Phys. Rep., 541, 45, doi: 10.1016/j.physrep.2014.02.009
- Chen et al. (2022) Chen, C.-C., Gao, Z.-K., Hsu, Q.-N., et al. 2022, arXiv e-prints, arXiv:2208.05296. https://arxiv.org/abs/2208.05296
- Chen et al. (2015) Chen, C.-C., Smail, I., Swinbank, A. M., et al. 2015, ApJ, 799, 194, doi: 10.1088/0004-637X/799/2/194
- Cheng et al. (2022) Cheng, C., Yan, H., Huang, J.-S., et al. 2022, ApJ, 936, L19, doi: 10.3847/2041-8213/ac8d08
- Cheng et al. (2020) Cheng, C., Ibar, E., Smail, I., et al. 2020, MNRAS, 499, 5241, doi: 10.1093/mnras/staa3036
- Coe et al. (2019) Coe, D., Salmon, B., Bradač, M., et al. 2019, ApJ, 884, 85, doi: 10.3847/1538-4357/ab412b
- Cowie et al. (2018) Cowie, L. L., González-López, J., Barger, A. J., et al. 2018, ApJ, 865, 106, doi: 10.3847/1538-4357/aadc63
- da Cunha et al. (2008) da Cunha, E., Charlot, S., & Elbaz, D. 2008, MNRAS, 388, 1595, doi: 10.1111/j.1365-2966.2008.13535.x
- De Breuck et al. (1999) De Breuck, C., van Breugel, W., Minniti, D., et al. 1999, A&A, 352, L51. https://arxiv.org/abs/astro-ph/9909178
- Diego et al. (2020) Diego, J. M., Molnar, S. M., Cerny, C., et al. 2020, ApJ, 904, 106, doi: 10.3847/1538-4357/abbf56
- Diego et al. (2022) Diego, J. M., Meena, A. K., Adams, N. J., et al. 2022, arXiv e-prints, arXiv:2210.06514. https://arxiv.org/abs/2210.06514
- Dudzevičiūtė et al. (2020) Dudzevičiūtė, U., Smail, I., Swinbank, A. M., et al. 2020, MNRAS, 494, 3828, doi: 10.1093/mnras/staa769
- Duncan (2022) Duncan, K. J. et al.. 2022, in preparation
- Dunlop et al. (2017) Dunlop, J. S., McLure, R. J., Biggs, A. D., et al. 2017, MNRAS, 466, 861, doi: 10.1093/mnras/stw3088
- Dunlop et al. (2021) Dunlop, J. S., Abraham, R. G., Ashby, M. L. N., et al. 2021, PRIMER: Public Release IMaging for Extragalactic Research, JWST Proposal. Cycle 1, ID. #1837
- Ferreira et al. (2022a) Ferreira, L., Adams, N., Conselice, C. J., et al. 2022a, arXiv e-prints, arXiv:2207.09428. https://arxiv.org/abs/2207.09428
- Ferreira et al. (2022b) Ferreira, L., Conselice, C. J., Sazonova, E., et al. 2022b, arXiv e-prints, arXiv:2210.01110. https://arxiv.org/abs/2210.01110
- Fiore et al. (2008) Fiore, F., Grazian, A., Santini, P., et al. 2008, ApJ, 672, 94, doi: 10.1086/523348
- Fomalont et al. (2014) Fomalont, E., van Kempen, T., Kneissl, R., et al. 2014, The Messenger, 155, 19
- Frayer et al. (2004) Frayer, D. T., Reddy, N. A., Armus, L., et al. 2004, AJ, 127, 728, doi: 10.1086/380943
- Frye (2022) Frye, B. et al.. 2022, in preparation
- Grogin et al. (2011) Grogin, N. A., Kocevski, D. D., Faber, S. M., et al. 2011, ApJS, 197, 35, doi: 10.1088/0067-0049/197/2/35
- Guo et al. (2022) Guo, Y., Jogee, S., Finkelstein, S. L., et al. 2022, arXiv:2210.08658 https://arxiv.org/abs/2210.08658
- Hodge et al. (2013) Hodge, J. A., Karim, A., Smail, I., et al. 2013, ApJ, 768, 91, doi: 10.1088/0004-637X/768/1/91
- Hodge et al. (2016) Hodge, J. A., Swinbank, A. M., Simpson, J. M., et al. 2016, ApJ, 833, 103, doi: 10.3847/1538-4357/833/1/103
- Hodge et al. (2019) Hodge, J. A., Smail, I., Walter, F., et al. 2019, ApJ, 876, 130, doi: 10.3847/1538-4357/ab1846
- Huang (2022) Huang, J.-S. et al.. 2022, in preparation
- Huang et al. (2011) Huang, J. S., Zheng, X. Z., Rigopoulou, D., et al. 2011, ApJ, 742, L13, doi: 10.1088/2041-8205/742/1/L13
- Jacobs et al. (2022) Jacobs, C., Glazebrook, K., Calabrò, A., et al. 2022, arXiv e-prints, arXiv:2208.06516. https://arxiv.org/abs/2208.06516
- Jee et al. (2014) Jee, M. J., Hughes, J. P., Menanteau, F., et al. 2014, ApJ, 785, 20, doi: 10.1088/0004-637X/785/1/20
- Koekemoer et al. (2011) Koekemoer, A. M., Faber, S. M., Ferguson, H. C., et al. 2011, ApJS, 197, 36, doi: 10.1088/0067-0049/197/2/36
- Labbé et al. (2005) Labbé, I., Huang, J., Franx, M., et al. 2005, ApJ, 624, L81, doi: 10.1086/430700
- Lang et al. (2019) Lang, P., Schinnerer, E., Smail, I., et al. 2019, ApJ, 879, 54, doi: 10.3847/1538-4357/ab1f77
- Lindner et al. (2014) Lindner, R. R., Baker, A. J., Hughes, J. P., et al. 2014, ApJ, 786, 49, doi: 10.1088/0004-637X/786/1/49
- Ling & Yan (2022) Ling, C., & Yan, H. 2022, ApJ, 929, 40, doi: 10.3847/1538-4357/ac57c1
- Marriage et al. (2011) Marriage, T. A., Acquaviva, V., Ade, P. A. R., et al. 2011, ApJ, 737, 61, doi: 10.1088/0004-637X/737/2/61
- McMullin et al. (2007) McMullin, J. P., Waters, B., Schiebel, D., Young, W., & Golap, K. 2007, in Astronomical Society of the Pacific Conference Series, Vol. 376, Astronomical Data Analysis Software and Systems XVI, ed. R. A. Shaw, F. Hill, & D. J. Bell, 127
- Menanteau et al. (2010) Menanteau, F., González, J., Juin, J.-B., et al. 2010, ApJ, 723, 1523, doi: 10.1088/0004-637X/723/2/1523
- Menanteau et al. (2012) Menanteau, F., Hughes, J. P., Sifón, C., et al. 2012, ApJ, 748, 7, doi: 10.1088/0004-637X/748/1/7
- Miley et al. (2004) Miley, G. K., Overzier, R. A., Tsvetanov, Z. I., et al. 2004, Nature, 427, 47, doi: 10.1038/nature02125
- Negrello et al. (2010) Negrello, M., Hopwood, R., De Zotti, G., et al. 2010, Science, 330, 800, doi: 10.1126/science.1193420
- Negrello et al. (2017) Negrello, M., Amber, S., Amvrosiadis, A., et al. 2017, MNRAS, 465, 3558, doi: 10.1093/mnras/stw2911
- Nelson et al. (2022) Nelson, E. J., Suess, K. A., Bezanson, R., et al. 2022, arXiv e-prints, arXiv:2208.01630. https://arxiv.org/abs/2208.01630
- Patel et al. (2012) Patel, S. G., Holden, B. P., Kelson, D. D., et al. 2012, ApJ, 748, L27, doi: 10.1088/2041-8205/748/2/L27
- Peng et al. (2002) Peng, C. Y., Ho, L. C., Impey, C. D., & Rix, H.-W. 2002, AJ, 124, 266, doi: 10.1086/340952
- Perrotta et al. (2002) Perrotta, F., Baccigalupi, C., Bartelmann, M., De Zotti, G., & Granato, G. L. 2002, MNRAS, 329, 445, doi: 10.1046/j.1365-8711.2002.05009.x
- Smail et al. (1997) Smail, I., Ivison, R. J., & Blain, A. W. 1997, ApJ, 490, L5, doi: 10.1086/311017
- Smail et al. (2021) Smail, I., Dudzevičiūtė, U., Stach, S. M., et al. 2021, MNRAS, 502, 3426, doi: 10.1093/mnras/stab283
- Speagle et al. (2014) Speagle, J. S., Steinhardt, C. L., Capak, P. L., & Silverman, J. D. 2014, ApJS, 214, 15, doi: 10.1088/0067-0049/214/2/15
- Stach et al. (2018) Stach, S. M., Smail, I., Swinbank, A. M., et al. 2018, ApJ, 860, 161, doi: 10.3847/1538-4357/aac5e5
- Stach et al. (2019) Stach, S. M., Dudzevičiūtė, U., Smail, I., et al. 2019, MNRAS, 487, 4648, doi: 10.1093/mnras/stz1536
- Suess et al. (2019) Suess, K. A., Kriek, M., Price, S. H., & Barro, G. 2019, ApJ, 877, 103, doi: 10.3847/1538-4357/ab1bda
- Sun et al. (2021) Sun, F., Egami, E., Pérez-González, P. G., et al. 2021, ApJ, 922, 114, doi: 10.3847/1538-4357/ac2578
- Sun et al. (2022) Sun, F., Egami, E., Fujimoto, S., et al. 2022, ApJ, 932, 77, doi: 10.3847/1538-4357/ac6e3f
- Venemans et al. (2002) Venemans, B. P., Kurk, J. D., Miley, G. K., et al. 2002, ApJ, 569, L11, doi: 10.1086/340563
- Wang et al. (2019) Wang, T., Schreiber, C., Elbaz, D., et al. 2019, Nature, 572, 211, doi: 10.1038/s41586-019-1452-4
- Williams et al. (2009) Williams, R. J., Quadri, R. F., Franx, M., van Dokkum, P., & Labbé, I. 2009, ApJ, 691, 1879, doi: 10.1088/0004-637X/691/2/1879
- Windhorst et al. (2022) Windhorst, R. A., Cohen, S. H., Jansen, R. A., et al. 2022, arXiv e-prints, arXiv:2209.04119. https://arxiv.org/abs/2209.04119
- Wu et al. (2022) Wu, Y., Cai, Z., Sun, F., et al. 2022, arXiv e-prints, arXiv:2208.08473. https://arxiv.org/abs/2208.08473
- Yan et al. (2022) Yan, H., Cohen, S. H., Windhorst, R. A., et al. 2022, arXiv e-prints, arXiv:2209.04092. https://arxiv.org/abs/2209.04092
- Zavala et al. (2022) Zavala, J. A., Buat, V., Casey, C. M., et al. 2022, arXiv e-prints, arXiv:2208.01816. https://arxiv.org/abs/2208.01816
- Zitrin et al. (2013) Zitrin, A., Menanteau, F., Hughes, J. P., et al. 2013, ApJ, 770, L15, doi: 10.1088/2041-8205/770/1/L15
Appendix A with different methods
Figure A1 compares the fitting results with eazy and magphys+photo-z (Battisti et al., 2019), which take the ALMA flux into account. The results are consistent, implying that the main results of this work would not change if we used , stellar mass, and SFR from magphys+photo-z instead of taking from eazy.
Appendix B Sérsic profile fitting
Figure 5 shows the fitted galfit models, which are based on a Sérsic function plus a central point source. Figure B1 shows the distribution of the derived Sérsic indices with size. The NIRCam images of TNJ1338 were obtained through medium-band filters and are shallower. To check whether this biases the fitting, we combined all three long-wavelength medium-band images and ran galfit again on this composite image. The values thus derived agree with the ones based on the F360M image.
Appendix C EG-ALMA 6c: an F160W-faint SMG
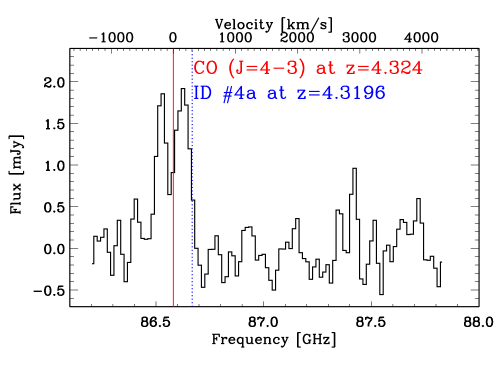
Previous studies have revealed a population of dusty near-IR-faint galaxies (Frayer et al., 2004; Huang et al., 2011; Wang et al., 2019; Smail et al., 2021; Sun et al., 2021) that are very faint or even invisible in HST/WFC3 F160W (the reddest HST band). This has led to the name “HST dark,” but they are prominent sources in Spitzer/IRAC 3.6 and 4.5 m images. These could be either passive or dusty galaxies at . Our sample contains one such source, the triply imaged system EG-ALMA 6a/6b/6c. EG-ALMA 6c is the most highly magnified of the three images. It is adjacent to the source “ID #4a” 333In the naming scheme of Caputi et al., ID #4 refers to the lensed source, and suffixes a, b, and c refer to the three lensed images. of Caputi et al. (2021), which is part of their galaxy group at . The MUSE spectrum of ID #4a yields based on absorption lines such as Ly, Si II, and C II. From our NIRCam images, ID #4a and EG-ALMA 6c are separated by 14, which corresponds to 9 kpc at . The host of this ALMA source is much redder than ID #4a. Fortunately, there are archival ALMA Band-3 spectral scans in this region, which we reduced following the standard process. There is a strong, double-peaked emission line at 86.6 GHz (Figure C1). If EG-ALMA 6c is at a similar redshift to ID #4a, this line is CO –3, and the redshift corresponds to , showing that ID #4a and EG-ALMA 6c are distinct sources. The two peaks of the 86.6 GHz line are separated by 380 km s-1, which suggests that the source is likely massive but similar to other submm galaxies (Birkin et al., 2021) The integrated CO (4–3) flux is 0.79 mJy km s-1, which corresponds to M⊙ (magnification-factor corrected), adopting , M⊙ for SMGs (Carilli & Walter, 2013). The depletion timescale is about 70 Myr, which is close to the typical depletion timescales for local ULIRGs.
The velocity difference between EG-ALMA 6c and ID #4a is 250 km s-1, suggesting that the two might be interacting. As ID #4a is not seen in the ALMA map, it must have very little cold dust. Its low gas content is consistent with the absence of emission lines in the ID #4a MUSE spectrum.
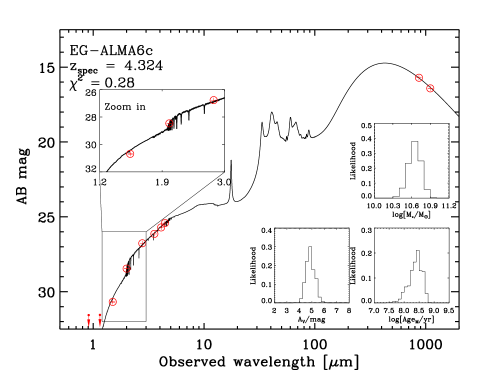
Figure C2 shows the magphys SED-fitting results (de-magnified) for EG-ALMA 6c at . We highlight the F150W, F200W, and F277W SED to show that F150W-faint targets could be dusty galaxies at .