Kerr and free-carrier ultrafast all-optical switching of GaAs/AlAs nanostructures near the three-photon edge of GaAs
Abstract
We performed non-degenerate pump-probe experiments on a GaAs/AlAs photonic structure. We switched the photonic properties using the optical Kerr effect and free carriers excited by three photon absorption. From these measurements we extracted the non-degenerate Kerr coefficients over a broad wavelength range and we extracted the three photon absorption coefficient for GaAs at three wavelengths in the near infrared. We show that the optical Kerr effect is large enough to switch a cavity resonance with a high Q () photonic cavity.
I Introduction
Exciting prospects arise when photonic structures are switched on ultrafast timescales. For example, switching would allow the capture or release of photons from photonic band gap cavities Johnson02 , which is relevant to solid-state slow-light schemes Yanik04 . Switching the directional properties of photonic crystals also leads to fast changes in the reflectivity, where interesting changes have been reported for Bragg stacks Hache00 ; Hastings05 , 2D photonic crystals Leonard02 ; Tan2004 ; Bristow03 , and first-order stop bands of 3D opaline crystals Mazur03 ; Beck05 . Ultrafast control of the propagation of light is essential to applications in active photonic integrated circuits nakamura04 .
Different mechanisms are possible for switching photonic structures. The switching of photonic structures with free carriers Leonard02 ; Tan2004 ; Harding2007 ; Hu2008 and a phase transition of Mazur05 have been reported recently. The disadvantage of a phase transition is that the material changes from a transparent material to a metal, which absorbs light. On the other hand free carrier excitation is ultrafast, but the recombination of the carriers is limited to a picosecond time scale.
With instantaneous switching it would be possible to ultimately control the on- and off-time of the switching event. This is possible with the optical Kerr effect, where the on- and off-time are determined by the pulse duration. This extreme of fast switching can be used for capturing and releasing photons on demand for example in a vertical-cavity surface emitting laser Hense1997 .
In order to release photons from cavity, the refractive index change induced with the optical Kerr effect should be large enough. To shift the cavity resonance by one linewidth the refractive index change should be equal to Euseretal:08 . Thus for an experiment with a cavity having a quality factor Q of 1000, this means a refractive index change of 0.1%. It is well known (see Johnson02 ) that the magnitude of the refractive index change by the Kerr effect is much smaller than the change due to a free carrier switch.
A problem which occurs at coincidence of pump and probe pulse is non-degenerate two-photon absorption Harding2007 . Here, a probe photon is absorbed together with a pump photon when the summed energy of the pump and probe exceed the bandgap energy. The change in imaginary part of the refractive index can be large compared to the change in the real part, giving rise to absorptive changes in the optical properties.
In this work we propose a method to decrease non-degenerate two photon absorption at pump and probe coincidence. Because of this, we are able to show that the optical Kerr effect is large enough to switch a cavity resonance with a moderate Q of 1000 or higher. We derive the Kerr coefficient and the three photon absorption coefficient over a broad wavelength range.
II Experimental
II.1 Sample
Our structure consists of a GaAs thick layer (277 nm thick) sandwiched between two Bragg stacks consisting of 12 and 16 pairs of thick layers of nominally pure GaAs or AlAs. The sample is grown with molecular beam epitaxy at 5500C to optimize the optical quality Gerard1996 . For experiments outside the present scope the sample was doped with cm-2 InGaAs/GaAs quantum dots, which hardly influence our experiment noteQD .
II.2 Optical measurements
Our setup consists of two independently tunable optical parametric amplifiers (OPA, Topas), that are the sources of the pump and probe beams. The setup has been described in Euser:07a therefore we present only a brief outline here. The OPAs have pulse durations fs. The pump beam has a much larger Gaussian focus of 113 m full width at half maximum than the probe beam (28 m), ensuring that only the central flat part of the pump focus is probed. A versatile measurement scheme was developed to subtract the pump background from the probe signal, and to compensate for possible pulse-to-pulse variations in the output of our laser Euser:07a . Separately, continuous-wave (cw) reflectivity was measured with a broad band white light setup with a resolution of nm Thijssen1999 .
In this work we varied the pump wavelength from 2000 nm to 2400 nm in steps of 200 nm. The probe wavelength was varied independently of the pump wavelength between 1150 nm and 1650 nm, with steps of 5 nm. Measured data was corrected for dispersion in the system.
III Results
III.1 Linear reflectivity
Figure 1C shows the measured linear reflectivity spectrum of our sample and a transfer matrix (TM) calculation BornWolf . The transfer matrix calculation including the dispersion of GaAs Blakemore1982 and AlAs Fern1971 reproduces the experimental resonance, stopband, and Fabry- Pérot fringes. The only free parameters in the model were the thicknesses of the GaAs (dGaAs = 69.2 nm) and AlAs (dAlAs = 81.0 nm), which agree to the measured values.
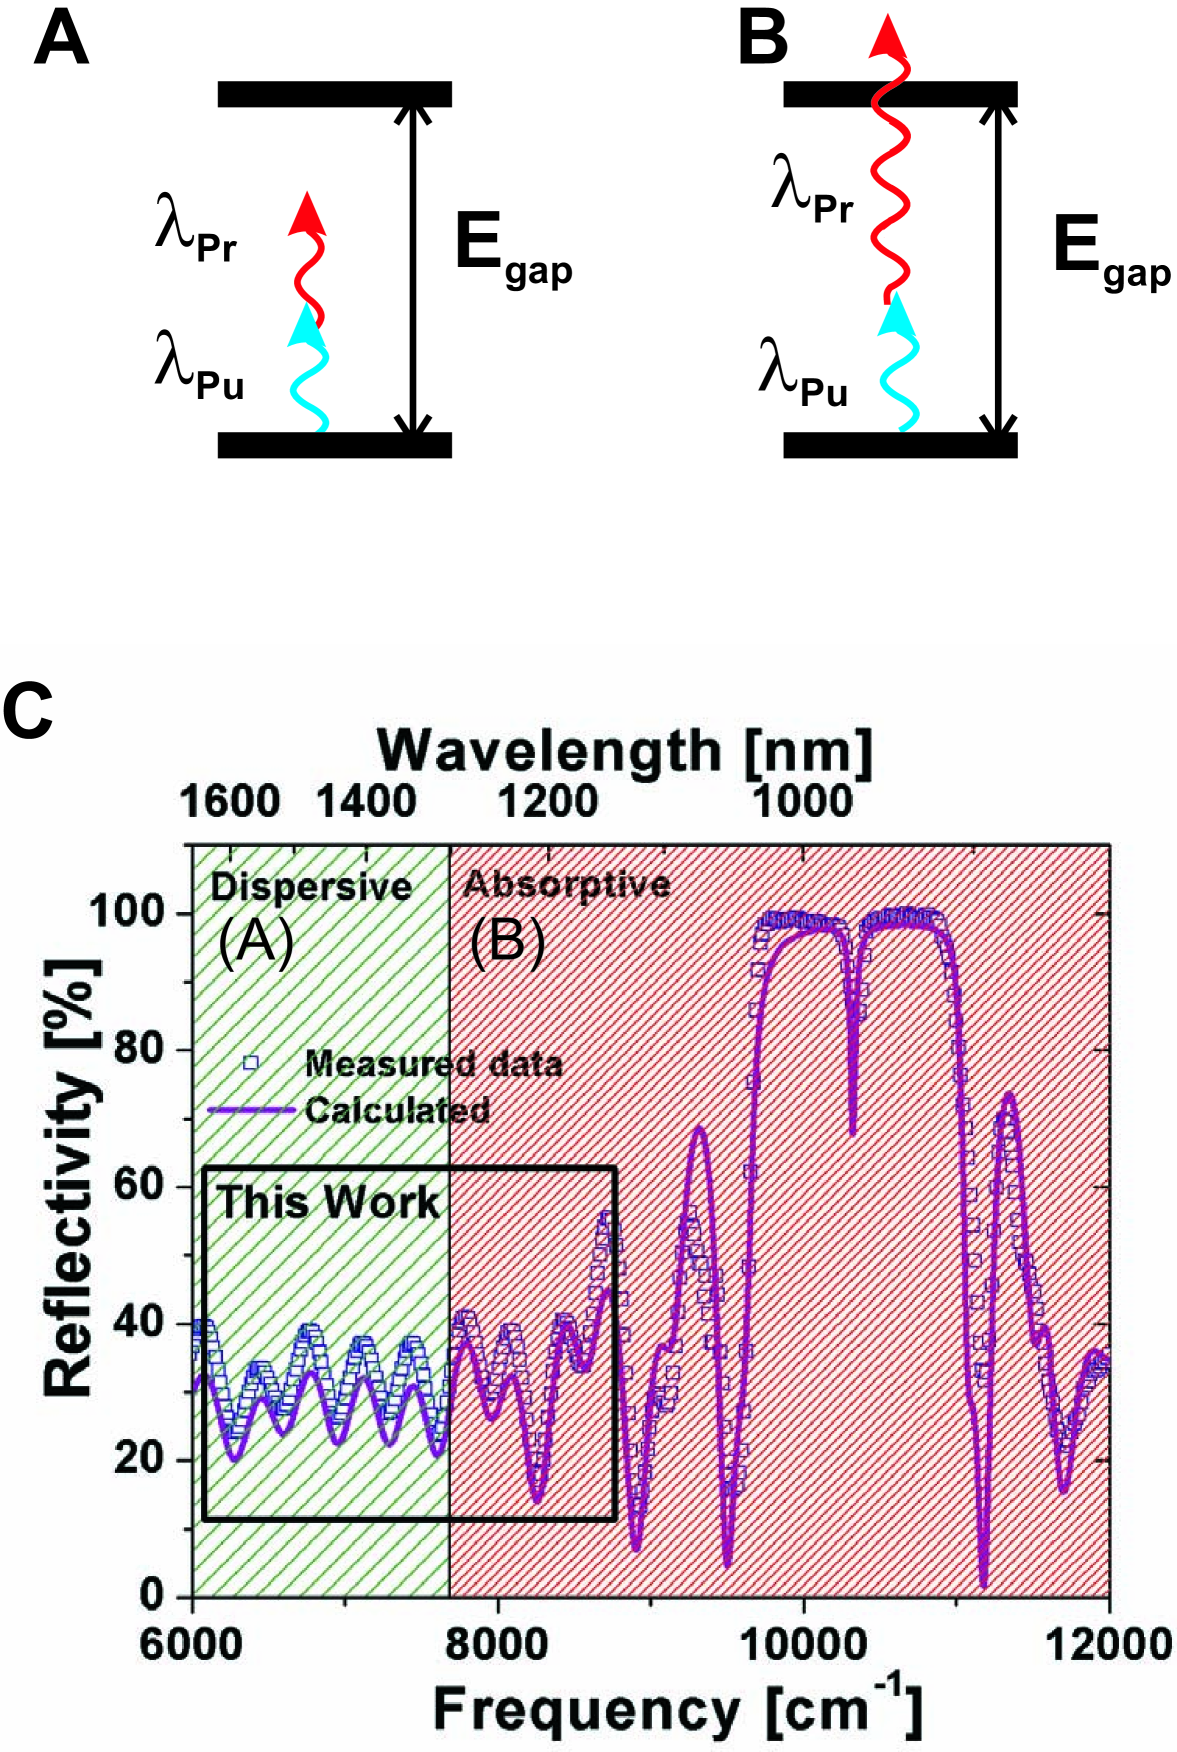
The reflectivity spectrum shows the stopband with cavity resonance and Fabry-Pérot fringes. The spectrum can be divided into two spectral regions, namely ’Absorptive’ (right, densely hatched) and ’Dispersive’ (left, hatched), referring to the expected behavior if pump and probe coincide.
The origin of the absorption is explained in figure 1A and 1B, which show schematic energy diagrams at coincidence of pump and probe. The regions are separated at a wavelength which corresponds to the bandgap at a pump wavelength of 2400 nm. In the densely hatched spectral region, the pump and probe photon will be absorbed since the sum of the photon energies is higher than the bandgap of GaAs. In the sparsely hatched (dispersive) spectral region however, the sum of pump and probe photon energies is not larger than the bandgap of GaAs. Therefore absorption is low in this region and behavior at coincidence is therefore mainly dispersive. Only the real part of the refractive index n’ changes.
The origin of the dispersion is the optical Kerr effect. There will be a change in the real part of the refractive index (n’), due to the pump field. The edge of the hatched regions in figure 1C will shift to the red at a pump wavelength of 2000 nm, indicating that we expect absorption in a large part of the spectrum. The behavior at coincidence is therefore mainly absorptive, meaning a change in the imaginary part of the refractive index, (n”).
We focus in this work on the spectral region indicated by the black rectangle. In this region we expect to observe effects of the optical Kerr effect but only little absorption at 2400 nm pump wavelength, while we expect mainly absorption at 2000 nm pump wavelength.
III.2 Ultrafast switched reflectivity
The two plots in figure 2 show the differential reflectivity measured at 2000 nm, = 90 (A) and 2400 nm, = 95 (C) pump wavelength as a function of probe wavelength and delay. Cross sections of figure 2A and C are given in figure 2B and D respectively.
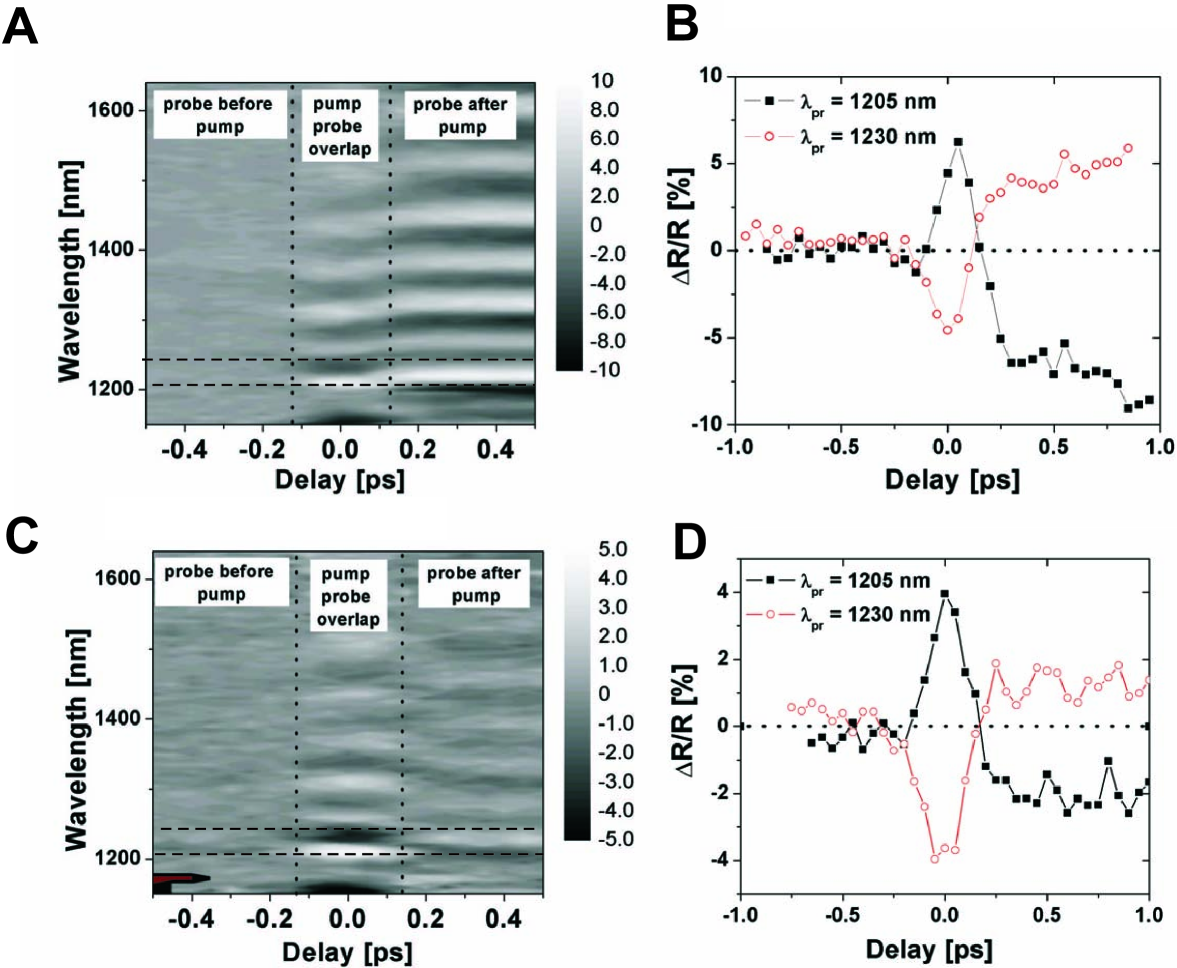
A fringe pattern is visible in figure 2A and C for coincidence of pump and probe and for positive delay. Figure 2B and D show cross sections of 2A and C. The sign difference of differential reflectivity between pump and probe overlap and positive delay is apparent and is a result from the fringe patterns at coincidence and positive delay, which are spectrally shifted with respect to each other. This indicates that the switch mechanism at coincidence is different from the free-carrier mechanism at positive delay.
At a pump wavelength of 2000 nm we expect a change in n”, since we are in the absorptive regime. At 2400 nm pump wavelength we expect a change in n’ and a negligible change in n”, since we are in the dispersive region (see figure 1).
The differential reflectivity at positive delay is caused by excited free carriers. Figure 3 shows the power dependence of differential reflectivity () at positive delay.
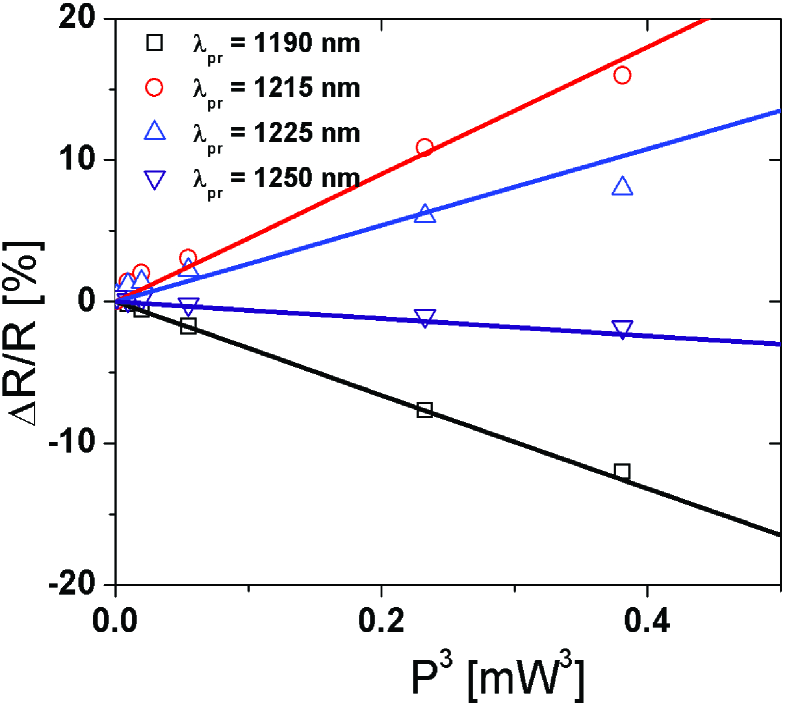
There is a linear relation between the differential reflectivity and the power cubed, as shown in figure 3. We therefore conclude that the differential reflectivity is caused by free carriers generated by a three photon absorption process.
III.3 Interpretation of time-resolved reflectivity
The fringe pattern in figure 2A and 2C results from Fabry-Pérot interferences within the stack forming the optical microcavity. A change in n’ modifies the optical thickness of the GaAs layers; it induces a spectral shift of the Fabry-Pérot fringes, which results in a periodic differential reflectivity. A change in n” decreases the modulation depth of the Fabry-Pérot fringes.
The differential reflectivity due to a change in the real part of the refractive index depends on measured intensities as follows:
| (1) |
Where is the differential reflectivity, is the delay between pump and probe, is the probe frequency, is the pump frequency, is the reflectance measured if the structure is unpumped and is the reflectance measured if the structure is pumped.
In case of a change in the real part of the refractive index, the fringe pattern shifts spectrally , with a proportionality constant that depends on the exact structure of the fringe pattern. is then given by:
| (2) |
Which can be written as
| (3) |
which yields a differential reflectivity:
| (4) |
Equation 4 shows that in the case of a change in the real part of the refractive index a large differential reflectivity will be measured where the unpumped reflectivity has a large derivative, which is spectrally between successive maxima and minima of the Fabry-Pérot fringes. This is illustrated in figure 4.
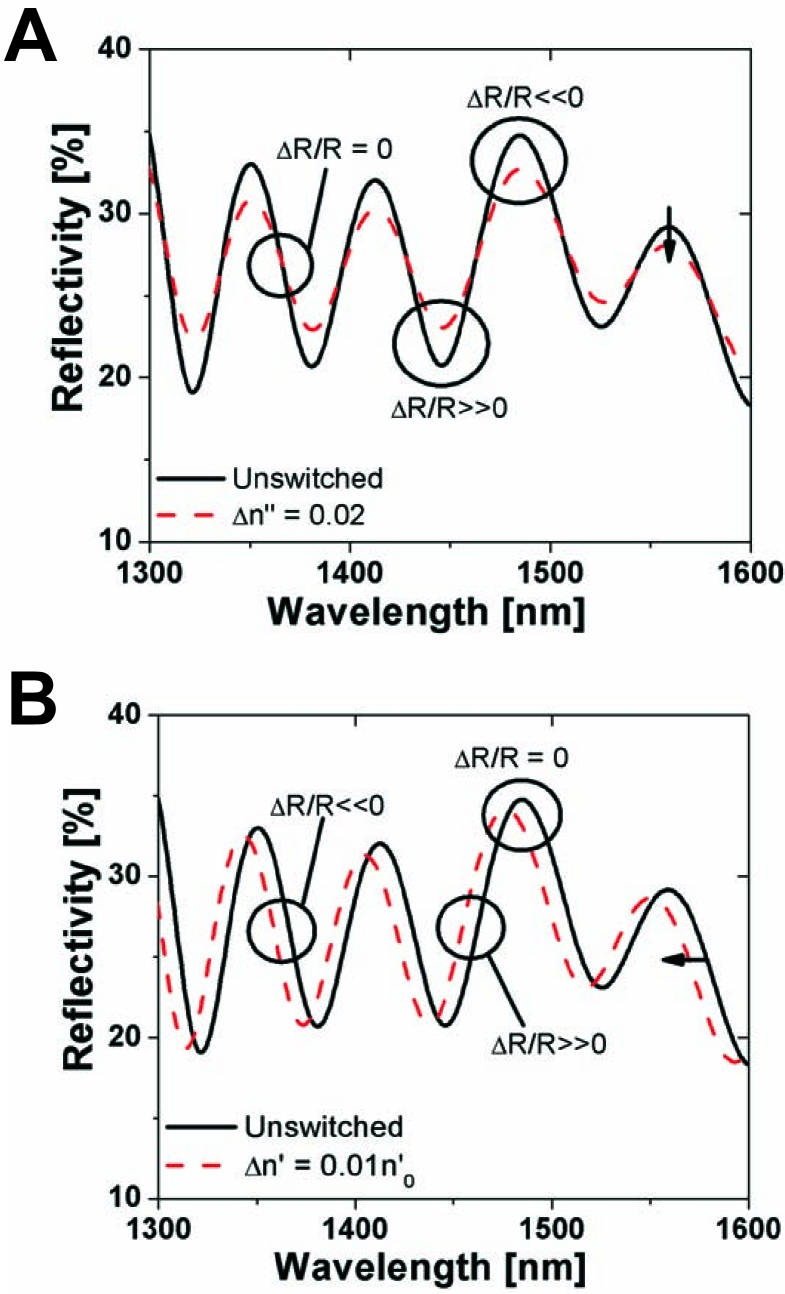
In the case of a change in n” the modulation depth of the fringe pattern is affected, while in the case of a change in n’ the position of the fringe pattern is shifted. For this reason the differential reflectivity has maxima at different positions making it possible to distinguish between a purely dispersive and a purely absorptive regime.
Figure 5 shows a TM calculation of the differential reflectivity spectrum of the planar microcavity. The intensity profile in the structure is homogeneous, leading to a homogeneous refractive index change. The intensity profile is homogenous since we pump at a long wavelength in the three photon absorption regime. The homogeneity length (Euser2005 ) is longer than our sample.
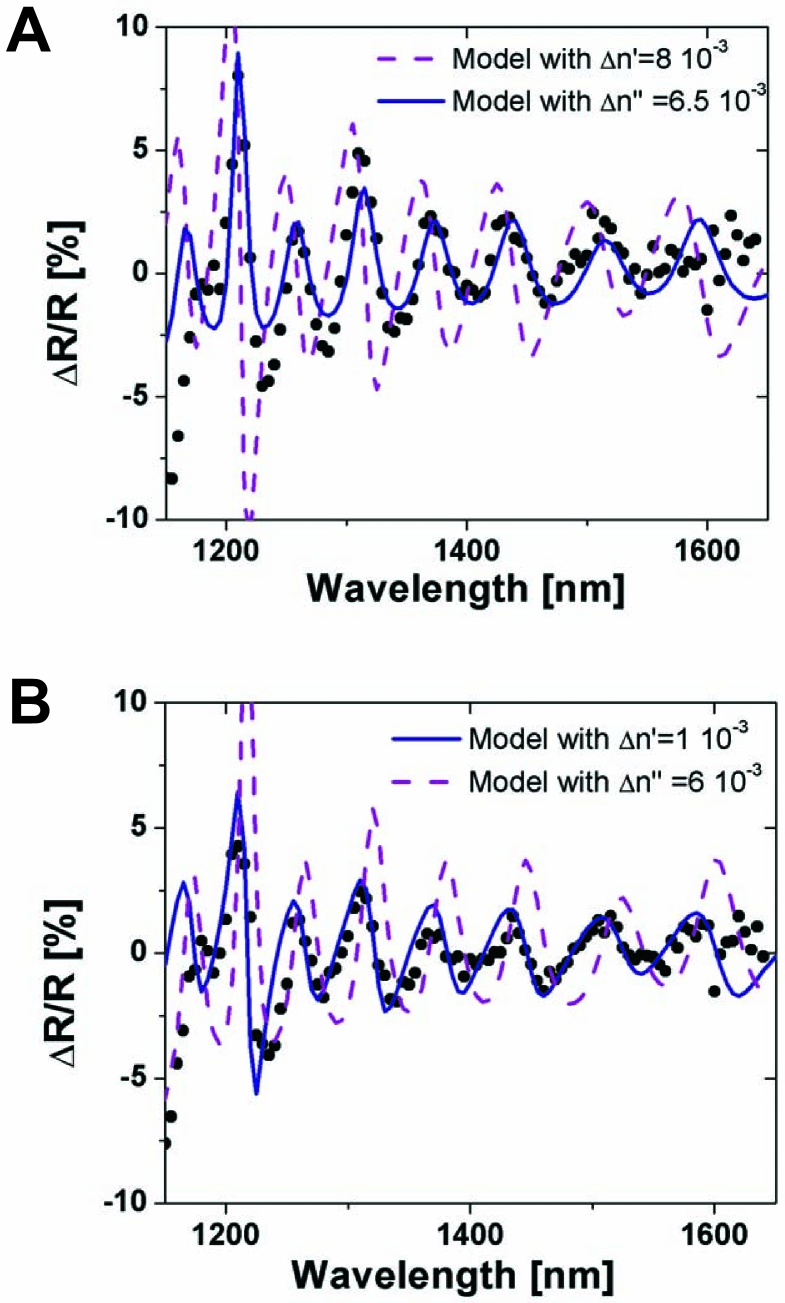
Figure 5 shows a comparison between the measured and calculated differential reflectivity pattern. Comparing the measured and calculated patterns shows that the positions of the peaks and troughs in the differential reflectivity pattern near zero delay, are caused by a change in the imaginary part of the refractive index (n”) in the case of 2000 nm pump and a change in the real part of the refractive index (n’) in the case of 2400 nm pump. We conclude that in the case of 2400 nm pump wavelength the fringe pattern near zero delay in the differential reflectivity originates from a Kerr switch, since the process is ultrafast, instantaneous with the laser pulse and is dispersive. In case of 2000 nm pump wavelength the fringe pattern originates from non-degenerate two photon absorption. Furthermore we see a slight deviation of our model near the blue side of the spectrum, indicating some dispersion in the nonlinear effect. We further conclude from figure 5 that absorption can be neglected at 2400 nm pump wavelength, while dispersion can be neglected at 2000 nm pump wavelength.
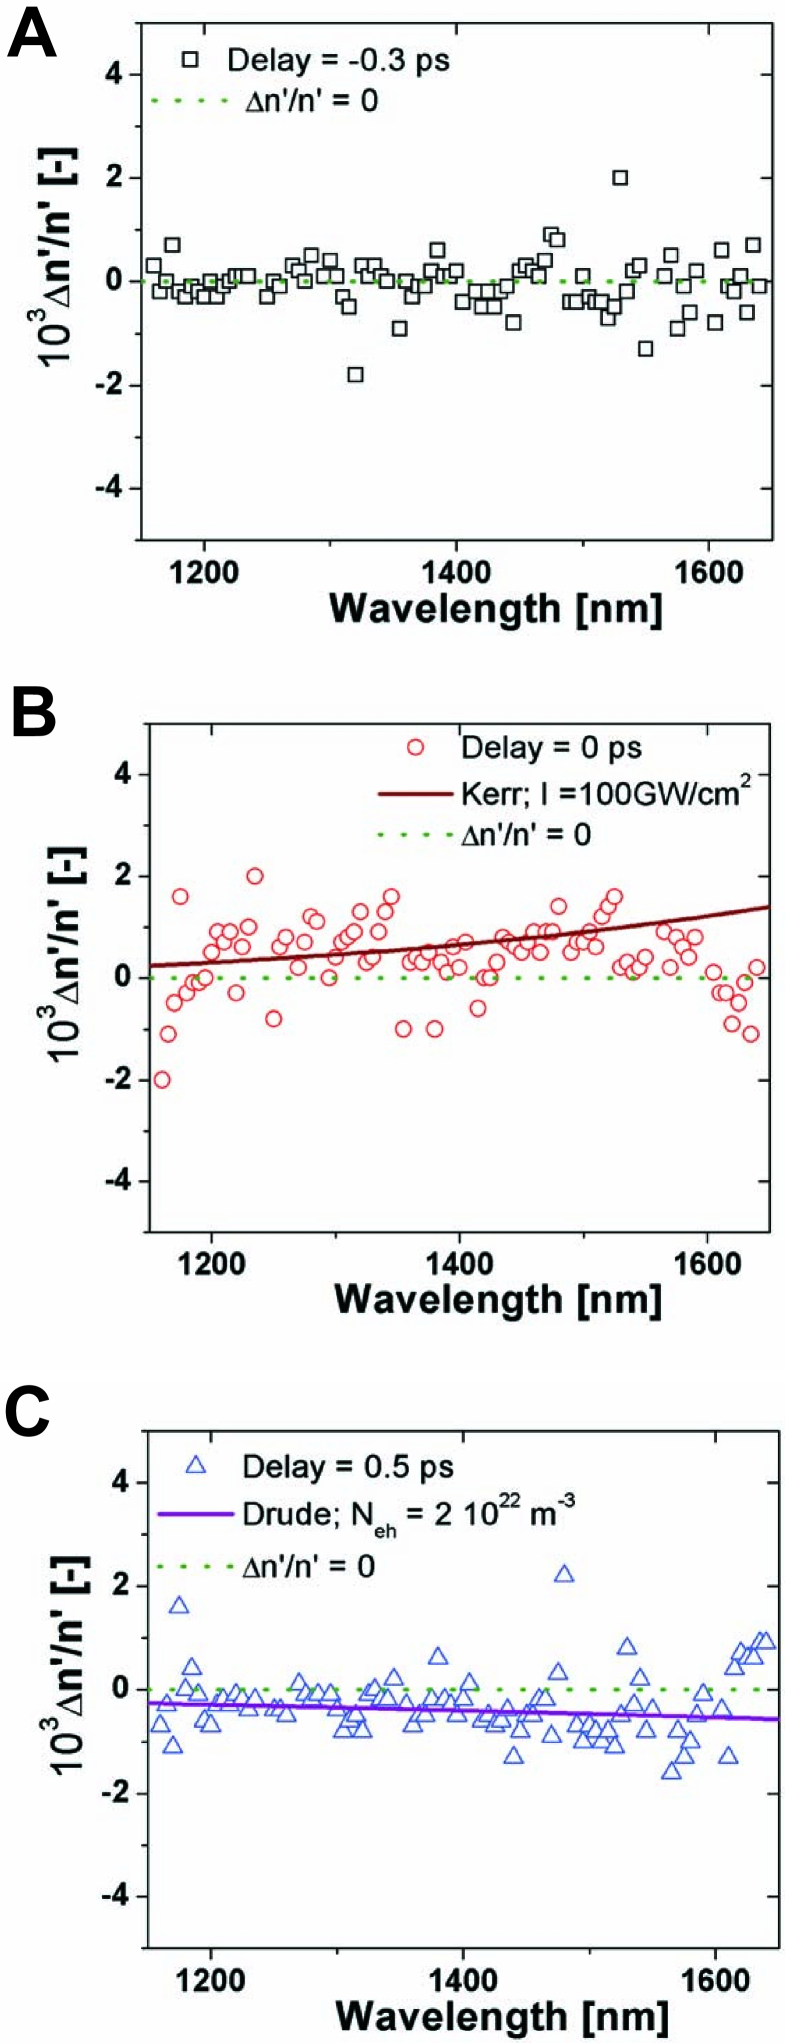
By varying the size of the change in n’ we extracted the change in refractive index at each wavelength. The results are plotted together with dispersion curves in figure 6. Figure 6 shows no change in refractive index for a negative delay (A), a positive change for zero delay (B) and a negative change for positive delay (C). Furthermore there is a good agreement between the data and the dispersion of the optical Kerr effect sheikbahae1994 and the dispersion of the free carrier excitation Euser:07a .
The scattered symbols deviating strongly from the theoretical model can be attributed to small differences in shape of the measured and calculated reflectivity spectrum. A slight deviation is amplified by the fitting procedure since we extract the refractive index change by fitting the differential reflectivity at one wavelength position.
Figure 6B shows that the change in refractive index induced by the optical Kerr effect is in the order of 0.1%. This is large enough to switch a cavity with a moderate Q of 1000.
III.4 Non linear coefficients GaAs
III.4.1 Kerr coefficient for GaAs
The non-degenerate Kerr coefficient can directly be extracted from the data in figure 6 using the relation Boyd ; sheikbahae1994 ,
| (5) |
where is the pump intensity. Since scales with sheikbahae1994 , the contribution of AlAs is only 20% of the total . For simplicity we therefore assume that mainly the GaAs is switched.
The resulting Kerr coefficients are plotted in figure 7.
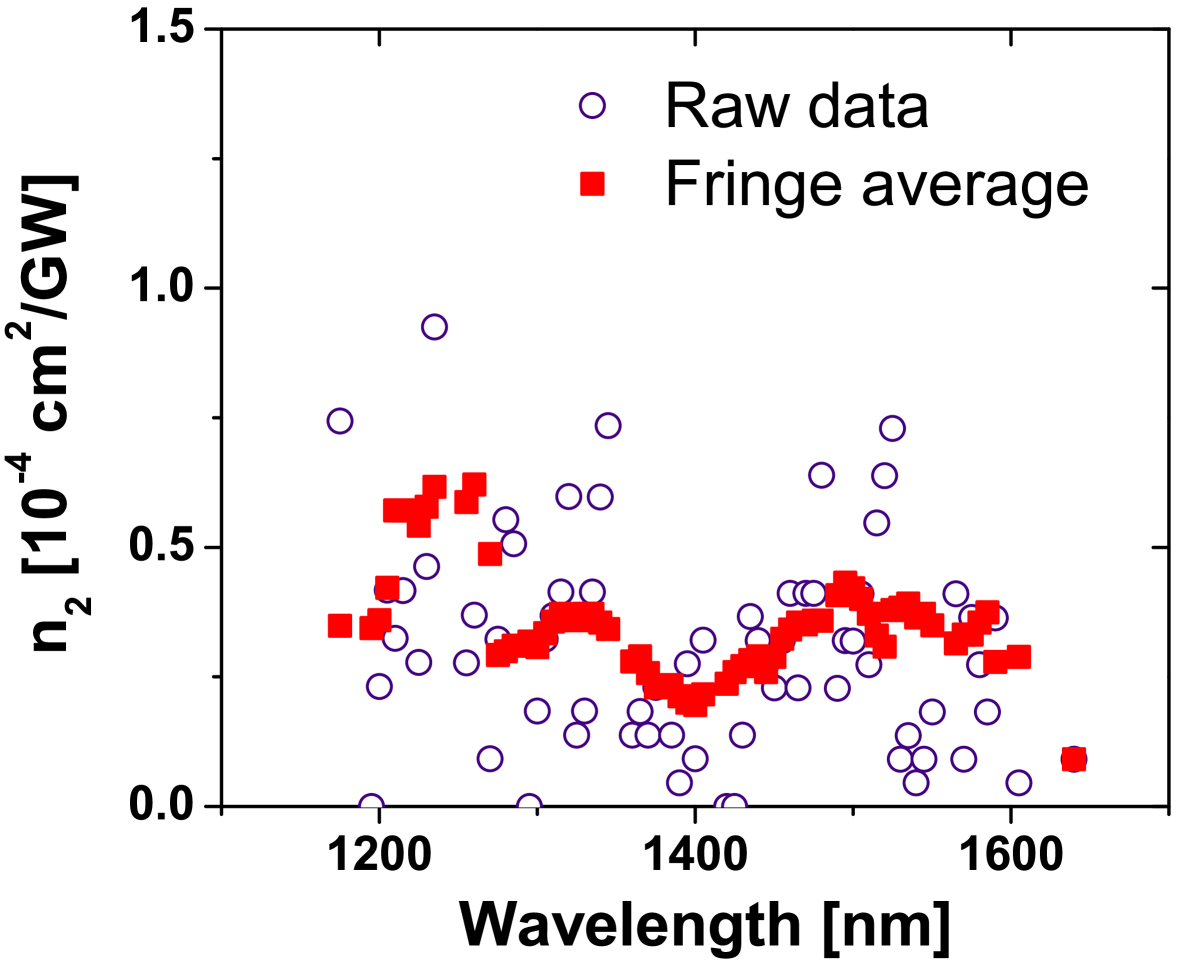
Figure 7 shows the raw data extracted from figure 6 (open circles) and the data averaged over the width of a fringe (solid squares). The order of magnitude of is . The non-degenerate Kerr coefficient decreases with increasing wavelength. This dispersive behavior was already observed in figure 5.
The values of measured in our non-degenerate pump-probe experiment are similar to the ones reported in the literature for degenerate pump-probe experiments Hurlbut2007 ; Dinu2003 ; Ulmer1999 . We find this surprising since we pump at a wavelength twice as long as in the degenerate case. This result enables us to modify efficiently the refractive index with a far detuned pump wavelength.
III.4.2 Three photon absorption coefficient for GaAs
Figure 6 shows that we are able to derive a carrier density from the measured change in refractive index with the use of the Drude model. We will discuss in this section the three photon absorption coefficient .
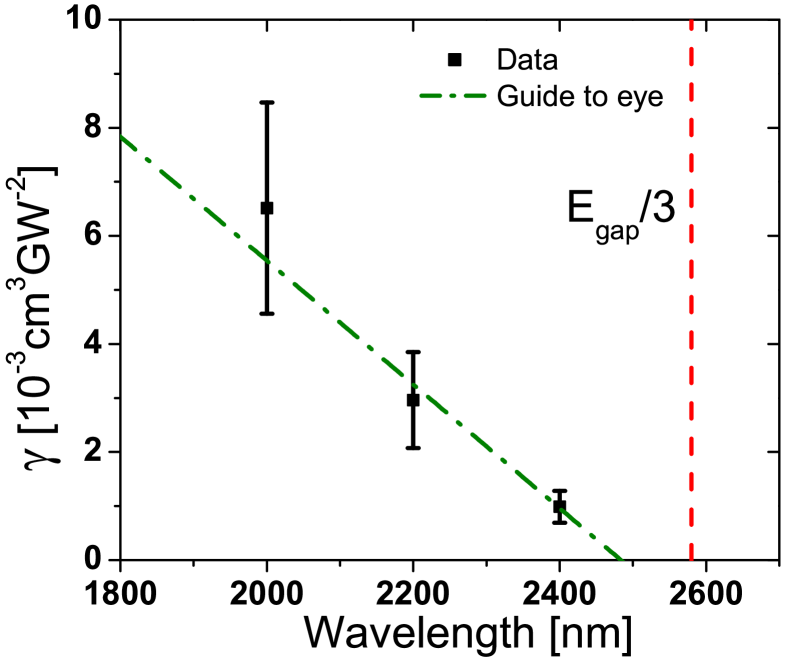
Figure 8 shows the three photon absorption coefficient as a function of pump wavelength. The order of magnitude of is . Our data are two orders of magnitude smaller than the values reported in the literature Hurlbut2007 , measured with the z-scan method. We attribute this difference to the fact that our data have been obtained on an epitaxially-grown GaAs/AlAs heterostructure, instead of a GaAs wafer obtained with a different technique.
The three photon absorption coefficient decreases as a function of wavelength since the summed energy of a pump and probe photon, and therefore the probability of generating an electron hole pair, decreases with increasing wavelength. The three photon absorption edge is 2580 nm.
IV Conclusion
We showed switching of the fringes of a GaAs/AlAs planar optical microcavity using the optical Kerr effect and three photon absorption.
From the switching measurements we extracted the non-degenerate Kerr coefficients over a broad wavelength range. Furthermore we extracted the three photon absorption coefficients for three different wavelengths in the near infrared.
We conclude from our results that it is possible to switch a cavity with a Q higher than 1000, using the optical Kerr effect. The refractive index change is in the order of the required 0.1%.
Acknowledgments
We want to thank Allard Mosk and Patrick Johnson for stimulating discussion. This research was supported by NanoNed, a nanotechnology programme of the Dutch Ministry of Economic Affairs, and by a VICI fellowship from the ”Nederlandse Organisatie voor Wetenschappelijk Onderzoek” (NWO) to WLV. This work is also part of the research programme of the ”Stichting voor Fundamenteel Onderzoek der Materie” (FOM), which is financially supported by the NWO.
References
- (1) P. M. Johnson, A. F. Koenderink, W. L. Vos, Phys. Rev. B 66, 081102(R) (2002)
- (2) M. F. Yanik, S. Fan, Phys. Rev. Lett. 92, 083901 (2004)
- (3) A. Haché, M. Bourgeois, Appl. Phys. Lett. 77, 4089 (2000)
- (4) S. R. Hastings, M. J. A. de Dood, H. Kim, W. Marshall, H. S. Eisenberg, D. Bouwmeester, Appl. Phys. Lett. 86, 031109 (2005)
- (5) S. W. Leonard, H. M. van Driel, J. Schilling, R. B. Wehrspohn, Phys. Rev. B 66, 161102(R) (2002)
- (6) H. W. Tan, H. M. van Driel, S. L. Schweizer, R. B. Wehrspohn, U. Gösele, Phys. Rev. B. 70, 205110 (2004)
- (7) A. D. Bristow, J.-P. R. Wells, W. H. Fan, A. M. Fox, M. S. Skolnick, D. M. Whittaker, A. Tahraoui, T. F. Krauss, J. S. Roberts, , Appl. Phys. Lett. 83, 851 (2003)
- (8) D. A. Mazurenko, R. Kerst, J. I. Dijkhuis, A. V. Akimov, V. G. Golubev, D. A. Kurdyukov, A. B. Pevtsov, A. V. Sel’kin, Phys. Rev. Lett. 91, 213903 (2003)
- (9) C. Becker, S. Linden, G. von Freymann, M. Wegener, N. Tétreault, E. Vekris, V. Kitaev, G. A. Ozin, Appl. Phys. Lett. 87, 091111 (2005)
- (10) H. Nakamura, Y. Sugimoto, K. Kanamoto, N. Ikeda, Y. Tanaka, Y. Nakamura, S. Ohkouchi, Y. Watanabe, K. Inoue, H. Ishikawa, K. Asakawa, Opt. Express 12, 6606 (2004)
- (11) P. J. Harding, T. G. Euser, Y.-R. Nowicki-Bringuier, J.-M. Gérard, W. L. Vos Appl. Phys. Lett. 91, 111103 (2007)
- (12) X. Hu, P. Jiang, C. Ding, H. Yang, Q. Gong, Nat. Phot. 2, 185 (2008)
- (13) D. A. Mazurenko, R. Kerst, J. I. Dijkhuis, A. V. Akimov, V. G. Golubev, A. A. Kaplyanskii, D. A. Kurdyukov, A. B. Pevtsov, Appl. Phys. Lett. 86, 041114 (2005)
- (14) S. G. Hense, M. Wegener, Phys. Rev. B 55, 9255 (1997)
- (15) T. G. Euser, A. J. Molenaar, J. G. Fleming, B. Gralak, A. Polman, W. L. Vos, Phys. Rev. B 77, 115214 (2008)
- (16) J.-M. Gérard, D. Barrier, J. Y. Marzin, R. Kuszelewicz, L. Manin, V. Costard, V. Thierry-Mieg, T. Rivera, Appl. Phys. Lett. 69, 449 (1996)
- (17) The maximum unbroadened refractive index change of the dots amounts to only , while the absorption at resonance is less than cm-1.
- (18) T. G. Euser, Ph.D. thesis, University of Twente ISBN 978-90-365-2471-1 (2007)
- (19) M. S. Thijssen, R. Sprik, J. E. G. J. Wijnhoven, M. Megens, T. Narayanan, L. Lagendijk, W. L. Vos, Phys.Rev.Lett. 83, 2730 (1999)
- (20) M. Born, E. Wolf, Principles of Optics: Electromagnetic Theory of Propagation, Interference and Diffraction of Light. (Cambridge University Press 1999)
- (21) J. S. Blakemore, J. Appl. Phys. 53, R123 (1982)
- (22) R. E. Fern, A. Onton, J. Appl. Phys. 42, 3499 (1971)
- (23) T. G. Euser, W. L. Vos, J. Appl. Phys 97, 043102 (2005)
- (24) M. Sheik-Bahae, J. Wang, E. W. van Stryland, IEEE J. of Quantum Electron. 30, 249 (1994)
- (25) R. W. Boyd, Nonlinear Optics, Academic Press ISBN 0-12-121680-2, pp 162 (1992)
- (26) M. Dinu, F. Quochi, H. Garcia, Appl. Phys. Lett. 82, 2954 (2003)
- (27) T. G. Ulmer, R. K. Tan, Z. Zhou, S. E. Ralph, R. P. Kenan, C. M. Verber, Opt. lett. 24, 756 (1999)
- (28) A. A. Said, M. Sheik-Bahae, D. J. Hagan, T. H. Wei, J. Wang, J. Young, E. W. Van Stryland, J. Opt. Soc. Am. B 9, 405 (1992)
- (29) W. C. Hurlbut, Y.-S. Lee, K. L. Vodopyanov, P. S. Kuo, M. M. Fejer, Opt. Lett. 32, 668 (2007)