L2C: Describing Visual Differences
Needs Semantic Understanding of Individuals
Abstract
Recent advances in language and vision push forward the research of captioning a single image to describing visual differences between image pairs. Suppose there are two images, and , and the task is to generate a description comparing them, existing methods directly model mapping without the semantic understanding of individuals. In this paper, we introduce a Learning-to-Compare (L2C) model, which learns to understand the semantic structures of these two images and compare them while learning to describe each one. We demonstrate that L2C benefits from a comparison between explicit semantic representations and single-image captions, and generalizes better on the new testing image pairs. It outperforms the baseline on both automatic evaluation and human evaluation for the Birds-to-Words dataset.
1 Introduction
The task of generating textual descriptions of images tests a machine’s ability to understand visual data and interpret it in natural language. It is a fundamental research problem lying at the intersection of natural language processing, computer vision, and cognitive science. For example, single-image captioning (Farhadi et al., 2010; Kulkarni et al., 2013; Vinyals et al., 2015; Xu et al., 2015) has been extensively studied.

Recently, a new intriguing task, visual comparison, along with several benchmarks (Jhamtani and Berg-Kirkpatrick, 2018; Tan et al., 2019; Park et al., 2019; Forbes et al., 2019) has drawn increasing attention in the community. To complete the task and generate comparative descriptions, a machine should understand the visual differences between a pair of images (see Figure 1). Previous methods Jhamtani and Berg-Kirkpatrick (2018) often consider the pair of pre-trained visual features such as the ResNet features He et al. (2016) as a whole, and build end-to-end neural networks to predict the description of visual comparison directly. In contrast, humans can easily reason about the visual components of a single image and describe the visual differences between two images based on their semantic understanding of each one. Humans do not need to look at thousands of image pairs to describe the difference of new image pairs, as they can leverage their understanding of single images for visual comparison.
Therefore, we believe that visual differences should be learned by understanding and comparing every single image’s semantic representation. A most recent work Zhang et al. (2020) conceptually supports this argument, where they show that low-level ResNet visual features lead to poor generalization in vision-and-language navigation, and high-level semantic segmentation helps the agent generalize to unseen scenarios.
Motivated by humans, we propose a Learning-to-Compare (L2C) method that focuses on reasoning about the semantic structures of individual images and then compares the difference of the image pair. Our contributions are three-fold:
-
•
We construct a structured image representation by leveraging image segmentation with a novel semantic pooling, and use graph convolutional networks to perform reasoning on these learned representations.
-
•
We utilize single-image captioning data to boost semantic understanding of each image with its language counterpart.
-
•
Our L2C model outperforms the baseline on both automatic evaluation and human evaluation, and generalizes better on the testing image pairs.
2 L2C Model
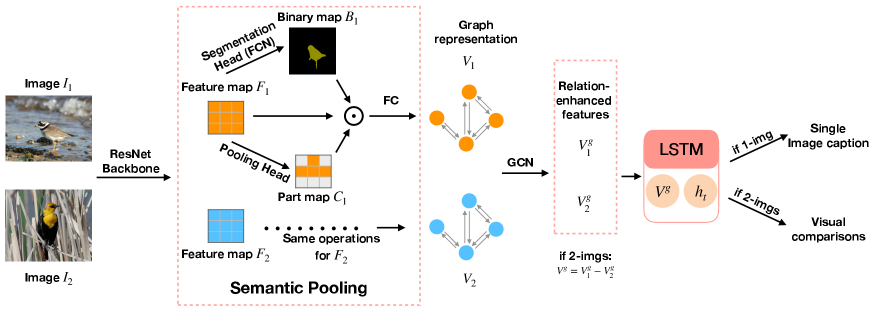
We present a novel framework in Figure 2, which consists of three main components. First, a segmentation encoder is used to extract structured visual features with strong semantic priors. Then, a graph convolutional module performs reasoning on the learned semantic representations. To enhance the understanding of each image, we introduce a single-image captioning auxiliary loss to associate the single-image graph representation with the semantic meaning conveyed by its language counterpart. Finally, a decoder generates the visual descriptions comparing two images based on differences in graph representations. All parameters are shared for both images and both tasks.
2.1 Semantic Representation Construction
To extract semantic visual features, we utilize pre-trained fully convolutional networks (FCN) (Long et al., 2015) with ResNet-101 as the backbone. An image is fed into the ResNet backbone to produce a feature map , which is then forwarded into an FCN head that generates a binary segmentation mask for the bird class. However, the shapes of these masks are variable for each image, and simple pooling methods such as average pooling and max pooling would lose some information of spatial relations within the mask.
To address this issue and enable efficient aggregation over the area of interest (the masked area), we add a module after the ResNet to cluster each pixel within the mask into classes. Feature map is forwarded through this pooling module to obtain a confidence map , whose entry at each pixel is a -dimensional vector that represents the probability distribution of classes.
Then a set of nodes is constructed as following:
| (1) |
where = =, is the -th probability map and denotes element-wise multiplication.
To enforce local smoothness, i.e., pixels in a neighborhood are more likely belong to one class, we employ total variation norm as a regularization term:
| (2) |
2.2 Comparative Relational Reasoning
Inspired by recent advances in visual reasoning and graph neural networks (Chen et al., 2018; Li et al., 2019), we introduce a relational reasoning module to enhance the semantic representation of each image. A fully-connected visual semantic graph is built, where is the set of nodes, each containing a regional feature, and is constructed by measuring the pairwise affinity between each two nodes in a latent space.
| (3) |
where are learnable matrices, and is the constructed adjacency matrix.
We apply Graph Convolutional Networks (GCN) (Kipf and Welling, 2016) to perform reasoning on the graph. After the GCN module, the output will be a relationship enhanced representation of a bird. For the visual comparison task, we compute the difference of each two visual nodes from two sets, denoted as .
2.3 Learning to Compare while Learning to Describe
After obtaining relation-enhanced semantic features, we use a Long Short-Term Memory (LSTM) (Hochreiter and Schmidhuber, 1997) to generate captions. As discussed in Section 1, semantic understanding of each image is key to solve the task. However, there is no single dataset that contains both visual comparison and single-image annotations. Hence, we leverage two datasets from similar domains to facilitate training. One is for visual comparison, and the other is for single-image captioning. Alternate training is utilized such that for each iteration, two mini-batches of images from both datasets are sampled independently and fed into the encoder to obtain visual representations (for single-image captioning) or (for visual comparison).
The LSTM takes or with previous output word embedding as input, updates the hidden state from to , and predicts the word for the next time step. The generation process of bi-image comparison is learned by maximizing the log-likelihood of the predicted output sentence. The loss function is defined as follows:
| (4) |
Similar loss is applied for learning single-image captioning:
| (5) |
Overall, the model is optimized with a mixture of cross-entropy losses and total variation loss:
| (6) |
where is an adaptive factor that weighs the total variation loss.
3 Experiments
3.1 Experimental Setup
Datasets
The Birds-to-Words (B2W) has 3347 image pairs, and each has around 5 descriptions of visual difference. This leads to 12890/1556/1604 captions for train/val/test splits. Since B2W contains only visual comparisons, We use the CUB-200-2011 dataset (CUB) (Wah et al., 2011), which consists of single-image captions as an auxiliary to facilitate the training of semantic understanding. CUB has 8855/2933 images of birds for train/val splits, and each image has 10 captions.
Evaluation Metrics
Performances are first evaluated on three automatic metrics111https://www.nltk.org: BLEU-4 (Papineni et al., 2002), ROUGE-L (Lin, 2004), and CIDEr-D (Vedantam et al., 2015). Each generated description is compared to all five reference paragraphs. Note for this particular task, researchers observe that CIDEr-D is susceptible to common patterns in the data (See Table 1 for proof), and ROUGE-L is anecdotally correlated with higher-quality descriptions (which is noted in previous work (Forbes et al., 2019)). Hence we consider ROUGE-L as the major metric for evaluating performances. We then perform a human evaluation to further verify the performance.
| Validation | Test | |||||
| Model | BLEU-4 | ROUGE-L | CIDEr-D | BLEU-4 | ROUGE-L | CIDEr-D |
| Most Frequent | 20.0 | 31.0 | 42.0 | 20.0 | 30.0 | 43.0 |
| Text-Only | 14.0 | 36.0 | 5.0 | 14.0 | 36.0 | 7.0 |
| Neural Naturalist | 24.0 | 46.0 | 28.0 | 22.0 | 43.0 | 25.0 |
| CNN+LSTM | 25.1 | 43.4 | 10.2 | 24.9 | 43.2 | 9.9 |
| L2C [B2W] | 31.9 | 45.7 | 15.2 | 31.3 | 45.3 | 15.1 |
| L2C [CUB+B2W] | 32.3 | 46.2 | 16.4 | 31.8 | 45.6 | 16.3 |
| Human | 26.0 | 47.0 | 39.0 | 27.0 | 47.0 | 42.0 |
Implementation Details
We use Adam as the optimizer with an initial learning rate set to 1e-4. The pooling module to generate classes is composed of two convolutional layers and batch normalization, with kernel sizes 3 and 1 respectively. We set to 9 and to 1. The dimension of graph representations is 512. The hidden size of the decoder is also 512. The batch sizes of B2W and CUB are 16 and 128. Following the advice from (Forbes et al., 2019), we report the results using models with the highest ROUGE-L on the validation set, since it could correlate better with high-quality outputs for this task.
3.2 Automatic Evaluation
As shown in Table 1, first, L2C[B2W] (training with visual comparison task only) outperforms baseline methods on BLEU-4 and ROUGE-L. Previous approaches and architectures failed to bring superior results by directly modeling the visual relationship on ResNet features. Second, joint learning with a single-image caption L2C[B2W+CUB] can help improve the ability of semantic understanding, thus, the overall performance of the model. Finally, our method also has a smaller gap between validation and test set compared to neural naturalist, indicating its potential capability to generalize for unseen samples.
| Choice (%) | L2C | CNN+LSTM | Tie |
| Score | 50.8 | 39.4 | 9.8 |
3.3 Human Evaluation
To fully evaluate our model, we conduct a pairwise human evaluation on Amazon Mechanical Turk with 100 image pairs randomly sampled from the test set, each sample was assigned to 5 workers to eliminate human variance. Following Wang et al. (2018), for each image pair, workers are presented with two paragraphs from different models and asked to choose the better one based on text quality222We instruct the annotators to consider two perspectives, relevance (the text describes the context of two images) and expressiveness (grammatically and semantically correct).. As shown in Table 2, L2C outperforms CNN+LSTM, which is consistent with automatic metrics.
3.4 Ablation Studies
Effect of Individual Components
We perform ablation studies to show the effectiveness of semantic pooling, total variance loss, and graph reasoning, as shown in Table 3. First, without semantic pooling, the model degrades to average pooling, and results show that semantic pooling can better preserve the spatial relations for the visual representations. Moreover, the total variation loss can further boost the performance by injecting the prior local smoothness. Finally, the results without GCN are lower than the full L2C model, indicating graph convolutions can efficiently modeling relations among visual regions.
| Validation | |||
|---|---|---|---|
| Model | BLEU-4 | ROUGE-L | CIDEr-D |
| L2C | 31.9 | 45.7 | 15.2 |
| Semantic Pooling | 24.5 | 43.2 | 7.2 |
| TV Loss | 29.3 | 44.8 | 13.6 |
| GCN | 30.2 | 43.5 | 10.7 |
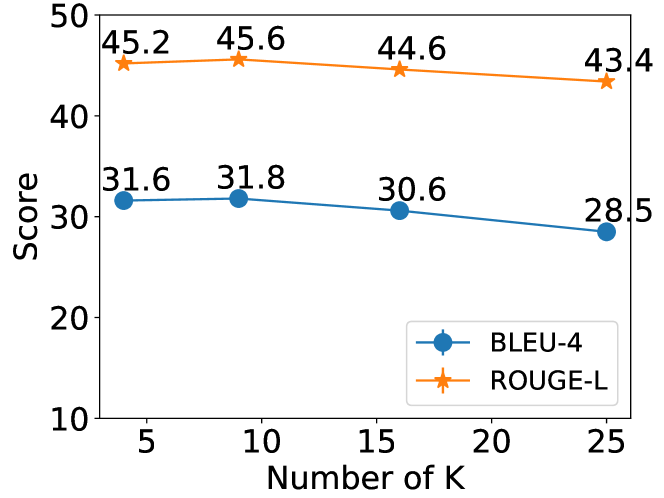
Sensitivity Test
We analyze model performance under a varying number of ( is the number of classes for confidence map ), as shown in Figure 3. Empirically, we found the results are comparable when is small.
4 Conclusion
In this paper, we present a learning-to-compare framework for generating visual comparisons. Our segmentation encoder with semantic pooling and graph reasoning could construct structured image representations. We also show that learning to describe visual differences benefits from understanding the semantics of each image.
Acknowledgments
The research was partly sponsored by the U.S. Army Research Office and was accomplished under Contract Number W911NF19-D-0001 for the Institute for Collaborative Biotechnologies. The views and conclusions contained in this document are those of the authors and should not be interpreted as representing the official policies, either expressed or implied, of the U.S. Government. The U.S. Government is authorized to reproduce and distribute reprints for Government purposes notwithstanding any copyright notation herein.
References
- Chen et al. (2018) Xinlei Chen, Li-Jia Li, Li Fei-Fei, and Abhinav Gupta. 2018. Iterative visual reasoning beyond convolutions. In Proceedings of the IEEE Conference on Computer Vision and Pattern Recognition, pages 7239–7248.
- Farhadi et al. (2010) Ali Farhadi, Mohsen Hejrati, Mohammad Amin Sadeghi, Peter Young, Cyrus Rashtchian, Julia Hockenmaier, and David Forsyth. 2010. Every picture tells a story: Generating sentences from images. In European conference on computer vision, pages 15–29. Springer.
- Forbes et al. (2019) Maxwell Forbes, Christine Kaeser-Chen, Piyush Sharma, and Serge Belongie. 2019. Neural naturalist: Generating fine-grained image comparisons. arXiv preprint arXiv:1909.04101.
- He et al. (2016) Kaiming He, Xiangyu Zhang, Shaoqing Ren, and Jian Sun. 2016. Deep residual learning for image recognition. In Proceedings of the IEEE conference on computer vision and pattern recognition, pages 770–778.
- Hochreiter and Schmidhuber (1997) Sepp Hochreiter and Jürgen Schmidhuber. 1997. Long short-term memory. Neural computation, 9(8):1735–1780.
- Jhamtani and Berg-Kirkpatrick (2018) Harsh Jhamtani and Taylor Berg-Kirkpatrick. 2018. Learning to describe differences between pairs of similar images. arXiv preprint arXiv:1808.10584.
- Kipf and Welling (2016) Thomas N Kipf and Max Welling. 2016. Semi-supervised classification with graph convolutional networks. arXiv preprint arXiv:1609.02907.
- Kulkarni et al. (2013) Girish Kulkarni, Visruth Premraj, Vicente Ordonez, Sagnik Dhar, Siming Li, Yejin Choi, Alexander C Berg, and Tamara L Berg. 2013. Babytalk: Understanding and generating simple image descriptions. IEEE Transactions on Pattern Analysis and Machine Intelligence, 35(12):2891–2903.
- Li et al. (2019) Kunpeng Li, Yulun Zhang, Kai Li, Yuanyuan Li, and Yun Fu. 2019. Visual semantic reasoning for image-text matching. In Proceedings of the IEEE International Conference on Computer Vision, pages 4654–4662.
- Lin (2004) Chin-Yew Lin. 2004. ROUGE: A package for automatic evaluation of summaries. In Text Summarization Branches Out, pages 74–81, Barcelona, Spain. Association for Computational Linguistics.
- Long et al. (2015) Jonathan Long, Evan Shelhamer, and Trevor Darrell. 2015. Fully convolutional networks for semantic segmentation. In Proceedings of the IEEE conference on computer vision and pattern recognition, pages 3431–3440.
- Papineni et al. (2002) Kishore Papineni, Salim Roukos, Todd Ward, and Wei-Jing Zhu. 2002. Bleu: a method for automatic evaluation of machine translation. In Proceedings of the 40th annual meeting on association for computational linguistics, pages 311–318. Association for Computational Linguistics.
- Park et al. (2019) Dong Huk Park, Trevor Darrell, and Anna Rohrbach. 2019. Robust change captioning. In Proceedings of the IEEE International Conference on Computer Vision, pages 4624–4633.
- Tan et al. (2019) Hao Tan, Franck Dernoncourt, Zhe Lin, Trung Bui, and Mohit Bansal. 2019. Expressing visual relationships via language. arXiv preprint arXiv:1906.07689.
- Vedantam et al. (2015) Ramakrishna Vedantam, C Lawrence Zitnick, and Devi Parikh. 2015. Cider: Consensus-based image description evaluation. In Proceedings of the IEEE conference on computer vision and pattern recognition, pages 4566–4575.
- Vinyals et al. (2015) Oriol Vinyals, Alexander Toshev, Samy Bengio, and Dumitru Erhan. 2015. Show and tell: A neural image caption generator. In Proceedings of the IEEE conference on computer vision and pattern recognition, pages 3156–3164.
- Wah et al. (2011) Catherine Wah, Steve Branson, Peter Welinder, Pietro Perona, and Serge Belongie. 2011. The caltech-ucsd birds-200-2011 dataset.
- Wang et al. (2018) Xin Wang, Wenhu Chen, Yuan-Fang Wang, and William Yang Wang. 2018. No metrics are perfect: Adversarial reward learning for visual storytelling. In Proceedings of the 56th Annual Meeting of the Association for Computational Linguistics (Volume 1: Long Papers), pages 899–909.
- Xu et al. (2015) Kelvin Xu, Jimmy Ba, Ryan Kiros, Kyunghyun Cho, Aaron Courville, Ruslan Salakhudinov, Rich Zemel, and Yoshua Bengio. 2015. Show, attend and tell: Neural image caption generation with visual attention. In International conference on machine learning, pages 2048–2057.
- Zhang et al. (2020) Yubo Zhang, Hao Tan, and Mohit Bansal. 2020. Diagnosing the environment bias in vision-and-language navigation. arXiv preprint arXiv:2005.03086.