Life after eruption – VI. Recovery of the old novae EL Aql, V606 Aql, V908 Oph, V1149 Sgr, V1583 Sgr and V3964 Sgr
Abstract
We report on the recovery of the six old novae EL Aql, V606 Aql, V908 Oph, V1149 Sgr, V1583 Sgr and V3964 Sgr, using photometric and spectroscopic data. Analysing several properties, we find that EL Aql is a good candidate for an intermediate polar. Furthermore, the system inclination of EL Aql, V606 Aql, V1583 Sgr and V3964 Sgr appears to be sufficiently high to suggest them as good targets for time series observations. We also eliminate some previously suggested candidates for the post-novae V1301 Aql and V1151 Sgr.
keywords:
novae, cataclysmic variables1 Introduction
A classical nova eruption plays an important role in the evolution of cataclysmic variable stars (CVs; see the books by Warner, 1995; Hellier, 2001). It represents the primary mechanism for mass-loss in these systems, preventing (most of) them to end up as supernovae Ia. Irradiation of the donor star by the eruption-heated white dwarf is furthermore suspected to cause an increase in the mass-transfer rate, which would have a strong effect on the evolutionary time-scale (Prialnik & Shara, 1986; Shara et al., 1986; Kovetz, Prialnik, & Shara, 1988; Patterson et al., 2013). Still, the connection between the nova eruption and the physical parameters of CVs is not very well known, mainly due to the fact that a large fraction of the post-nova systems remain unidentified (Tappert et al., 2012).
We are carrying out a systematic observing campaign in order to recover and study classical novae that erupted at least 30 yr ago (earlier than 1986). This implies that sufficient time has passed since the nova eruption for the optical signal to become dominated by the underlying CV instead of representing mainly the ejected material. The targets presented here were selected from Downes et al. (2005) and refer to fields with hitherto ambiguous identification of the post-nova (EL Aql, V606 Aql, V908 Oph, V1149 Sgr and V1583 Sgr). They were investigated by means of photometry to identify potential candidates for the post-nova, based on their colours. The selected candidates were subsequently observed spectroscopically to confirm the post-nova via their spectroscopic characteristics (mainly the presence of characteristic emission lines). In addition, we also obtained spectrograms of candidates for the post-novae V1301 Aql, V1151 Sgr and V3964 Sgr that were included in Tappert et al. (2015). Other collections of post-nova spectra can be found in Ringwald, Naylor, & Mukai (1996), Tomov et al. (2015) and parts of our own series (Tappert et al., 2012, 2014, 2015, the latter hereafter is referred to as Paper V).
2 Observations and reduction
| Object | RA (2000.0) | Dec. (2000.0) | rms (arcsec) | Date | Filter/grating | (s) | mag |
|---|---|---|---|---|---|---|---|
| EL Aql | 18:56:01.87 | 03:19:18.8 | 0.21 | 2012-07-18 | /// | 1576/420/160/120 | 20.9V |
| 2015-04-27 | B600 (1.5 arcsec) | 4760 | 19.9R | ||||
| V606 Aql | 19:20:24.29 | 00:08:07.8 | 0.30 | 2012-06-24 | /// | 1576/420/160/120 | 20.4V |
| 2015-06-15 | B600 (1.5 arcsec) | 3600 | 20.1R | ||||
| V908 Oph | 17:28:04.58 | 27:43:04.4 | 0.33 | 2014-04-03 | /// | 1655/495/200/170 | 20.5V |
| 2015-04-28 | B600 (1.5 arcsec) | 3600 | 18.5R | ||||
| V1149 Sgr | 18:18:29.85 | 28:17:24.9 | 0.21 | 2012-08-15 | /// | 1576/420/160/120 | 18.4V |
| 2015-06-06 | B600 (1.5 arcsec) | 1350 | 18.1R | ||||
| V1583 Sgr | 18:15:26.53 | 23:23:17.5 | 0.27 | 2012-07-24 | /// | 1576/420/160/120 | 20.5V |
| 2015-04-21 | B600 (1.5 arcsec) | 3600 | 19.5R | ||||
| V3964 Sgr | 17:49:42.42 | 17:23:34.8 | 0.17 | 2015-04-26 | B600 (1.5 arcsec) | 3600 | 19.0R |
The photometric data for the objects with ambiguous identification were taken in two service mode runs in 2012 (EL Aql, V606 Aql, V1149 Sgr and V1583 Sgr) and in 2014 (V908 Oph) at the Antu 8 m telescope that is part of the Very Large Telescope of the European Southern Observatory (ESO), at Cerro Paranal, Chile, using the FOcal Reducer/low dispersion Spectrograph (FORS2; Appenzeller et al., 1998) system with the high-throughput broad-band filters u_High, b_High, v_High and R_Special. Series of four and three frames per filter were obtained in the 2012 and the 2014 observations, respectively. In service mode, FORS2 usually operates with a mosaic of two 2k4k MIT CCDs. For the data obtained on 2012 August 18, exceptionally, the blue-sensitive E2V CCDs were used. The field of view of FORS2 is 6.86.8 arcmin2.
After combining the two mosaic CCD frames into one with the fsmosaic routine from the FORS Instrument Mask Simulator package, the further reduction was performed using the ccdred package of iraf. The bias-subtracted and flat-fielded data were then corrected for the telescope offsets between them and averaged to a single frame per filter. A 3 clipping algorithm was applied to exclude bad pixels and cosmic rays.
Subsequent photometry was performed using iraf’s daophot package and the stand-alone daomatch and daomaster routines (Stetson, 1992). The aperture radius for the photometry was chosen to be slightly smaller than the full width at half-maximum (FWHM) of the point spread function (PSF). The conversion to calibrated magnitudes was obtained using observations of standard fields (Landolt, 1983, 1992; Stetson, 2000). The passband is not a part of ESO’s standard calibration plan, and in most nights, the standard field observations in this filter covered only a very limited range of airmasses that did not allow us to derive a value for the extinction from them. Thus, a standard value for the extinction was used that was taken from the La Silla observatory website111http://www.eso.org/sci/facilities/lasilla/instruments/efosc/inst/zp/.html. While this observatory is located roughly 480 km south of Cerro Paranal, comparison of the passbands and also the data for the few nights, where a sufficiently large airmass range was covered, showed identical values within the uncertainties. Similarly, for some nights, also the standard data proved insufficient. For those filters, median values for a 60 d range are available at the observatory’s Health Check Monitor222http://www.eso.org/observing/dfo/quality/ALL/daily_qc1.html.
The spectroscopic data were obtained using the Gemini Multi-Object Spectrograph (GMOS; Hook et al., 2004) mounted at the Gemini-South 8 m telescope situated on Cerro Pachón, Chile. Three spectra were taken per object, in most cases subsequently. Since 2014, GMOS is equipped with a row of three 20484176 Hamamatsu CCDs. Grating B600 was employed with a 1.5 arcsec slit and a two and four pixels binning in spatial and dispersion direction, respectively. This combination yielded a typical wavelength range of 4100 – 7100 Å and a resolving power of 800. The grating was operated at a central wavelength of 5600 Å to put the two 0.915 mm wide gaps between the chips at regions of comparatively low scientific interest. The typically affected wavelength ranges are 5030 – 5080 Å and, in principle, 6100 – 6050 Å. However, all observations suffered from a bright large-scale distortion in spatial direction that severely affected the signal at a much broader wavelength range of roughly 5900 – 6200 Å and could not be properly corrected for.
The data were reduced using the gemini – gmos extension for iraf as contained in the ureka software package333http://ssb.stsci.edu/ureka/. After subtraction of an averaged bias frame and subsequent division by a flat-field that was normalized by fitting a high-order cubic spline, a two-dimensional wavelength correction was applied that was obtained from spectra taken with a CuAr comparison lamp. After this transformation, the individual spectra were combined employing a 2 clipping algorithm to correct for cosmic rays. The sky was subtracted by fitting a Chebychev function of typically third order in spatial direction. Finally, the spectra were extracted and corrected for the instrumental response function by comparison with a spectrum of the standard star LTT 3864 taken on 2015 February 25. Since all calibrations are based on this single observation of a standard, we emphasize that, while the spectral energy distribution (SED) of our objects should be sufficiently well reproduced, the zero-point is not well determined, and thus the data cannot be regarded as flux calibrated. Above steps were performed both for the combined and the individual spectra to examine them for variability.
The details of the observations of the confirmed post-novae are summarized in Table 1. The coordinates in columns two and three were determined by calculating an astrometric correction on the photometric FORS2 images or the GMOS acquisition frames using Starlink’s gaia444http://astro.dur.ac.uk/~pdraper/gaia/gaia.html tool (version 4.4.6) with the US Naval Observatory CCD Astrograph Catalogue version 4 (Zacharias et al., 2013). The associated root mean square (rms) is given in column four. The fifth column states the date of the observations referring to the start of the night, while the sixth column gives details on the instrumental setup, i.e. filter or grating and slit, and column seven contains the total exposure time per object. Finally, the brightness of the object at the time of the observations is presented in column eight, with the corresponding passband indicated by a letter. For the spectroscopic data, the magnitudes were determined via differential photometry on the acquisition frames with respect to five comparison stars in the vicinity of the target. These values were calibrated with respect to previous photometric data, where available, or with the Guide Star Catalogue, version 2.2 (Lasker et al., 2008).
3 Results
| Object | ||||
|---|---|---|---|---|
| EL Aql | 20.88(03) | 0.10(15) | 0.62(08) | 0.70(08) |
| V606 Aql | 20.41(03) | 0.28(15) | 0.40(07) | 0.44(07) |
| V908 Oph | 20.54(11) | 0.10(15) | 1.02(15) | 1.23(17) |
| V1149 Sgr | 18.36(05) | 1.44(15) | 0.30(12) | 0.30(07) |
| V1583 Sgr | 20.54(04) | 0.16(18) | 0.96(09) | 0.83(06) |
| Object | Balmer | He i | Bowen | He ii | C iv | ||||||
|---|---|---|---|---|---|---|---|---|---|---|---|
| 4340 | 4861 | 6563 | 4922 | 5016 | 6678 | 7065 | 4645 | 4686 | 5412 | 5812 | |
| EL Aql | 26(1) | 35(1) | 47(1) | 4(1) | 3(1) | 8(1) | 5(1) | 45(2)1 | 3(1) | 4(1) | |
| V606 Aql | 18(1) | 21(1) | 26(1) | 4(1) | 2(1) | 4(1) | 2(1) | 16(1)1 | – | – | |
| V908 Oph | 1(1)2 | 1(1)2 | 3(1) | – | – | – | – | – | – | – | – |
| V1149 Sgr | 3(1) | 2(1) | 6(1) | – | – | 1(1) | – | 5(1) | 3(1) | 1(1) | 3(1) |
| V1583 Sgr | 6(1) | 9(1) | 26(5) | 3(1) | – | 4(1) | 2(1) | 5(1) | 2(1) | – | – |
| V3964 Sgr | 3(1) | 5(1) | 12(1) | 1(1) | – | 2(1) | – | 3(1) | 2(1) | – | – |
1 Bowen/He ii blend.
2 Emission cores in absorption troughs.
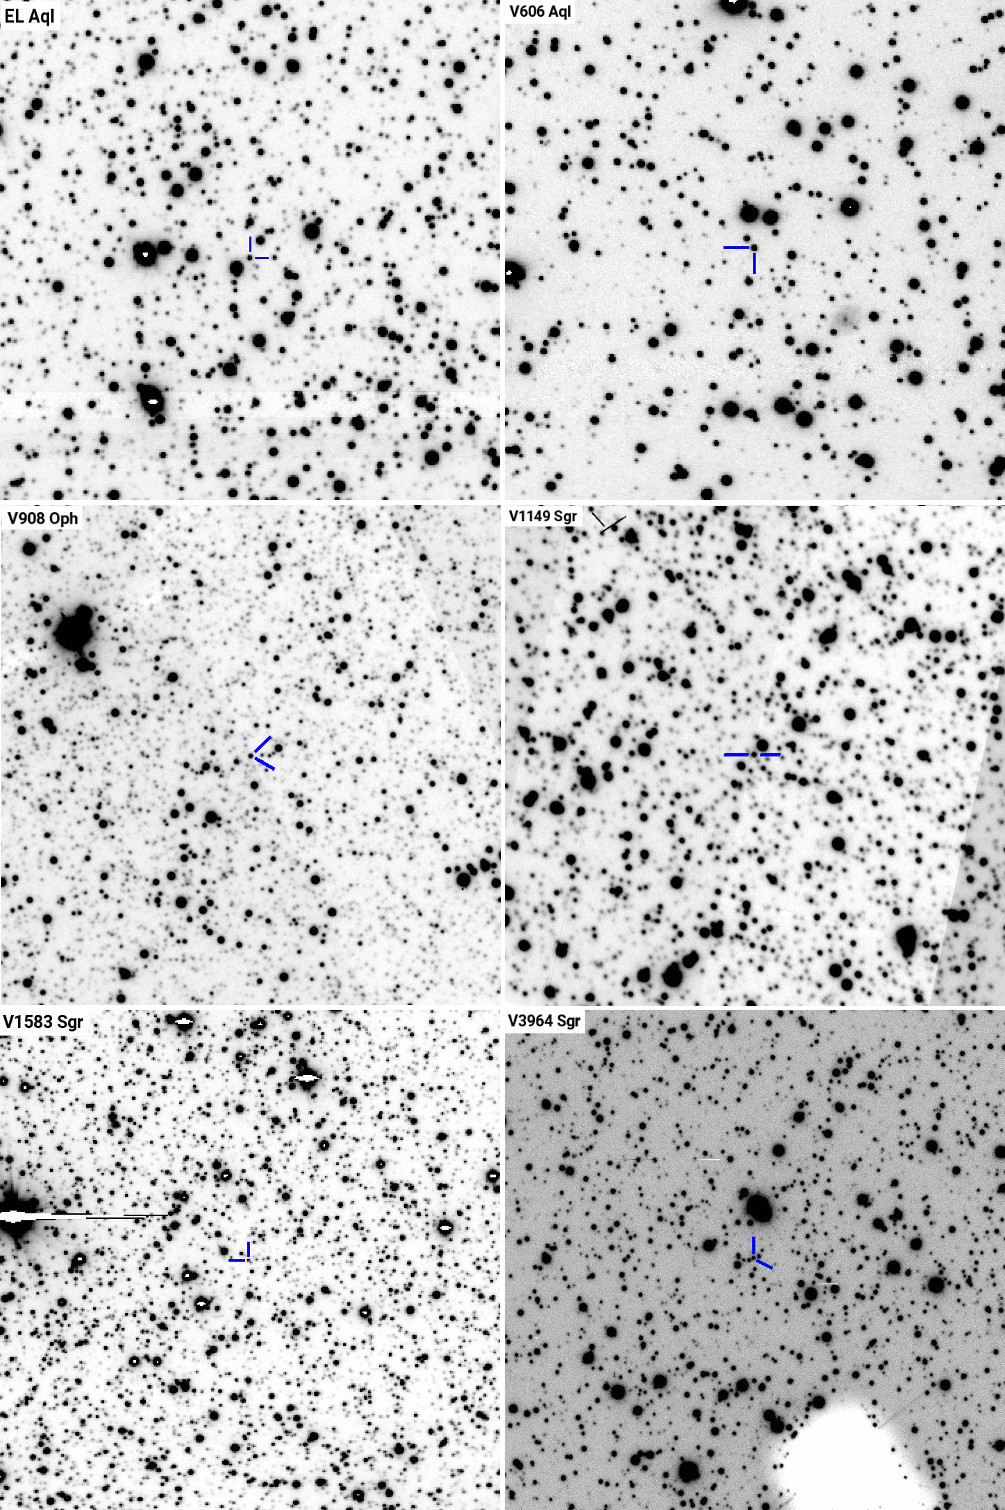
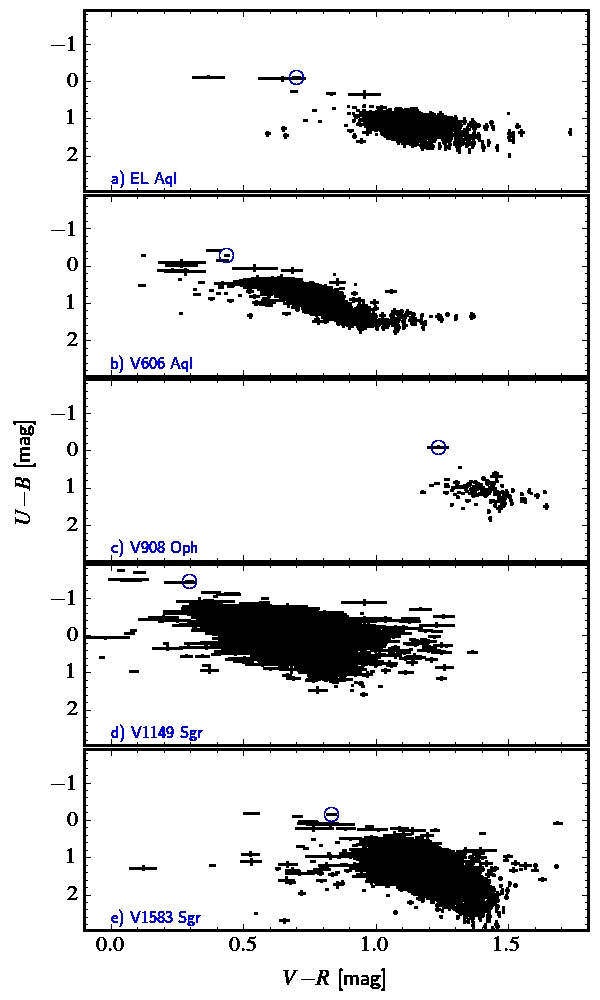
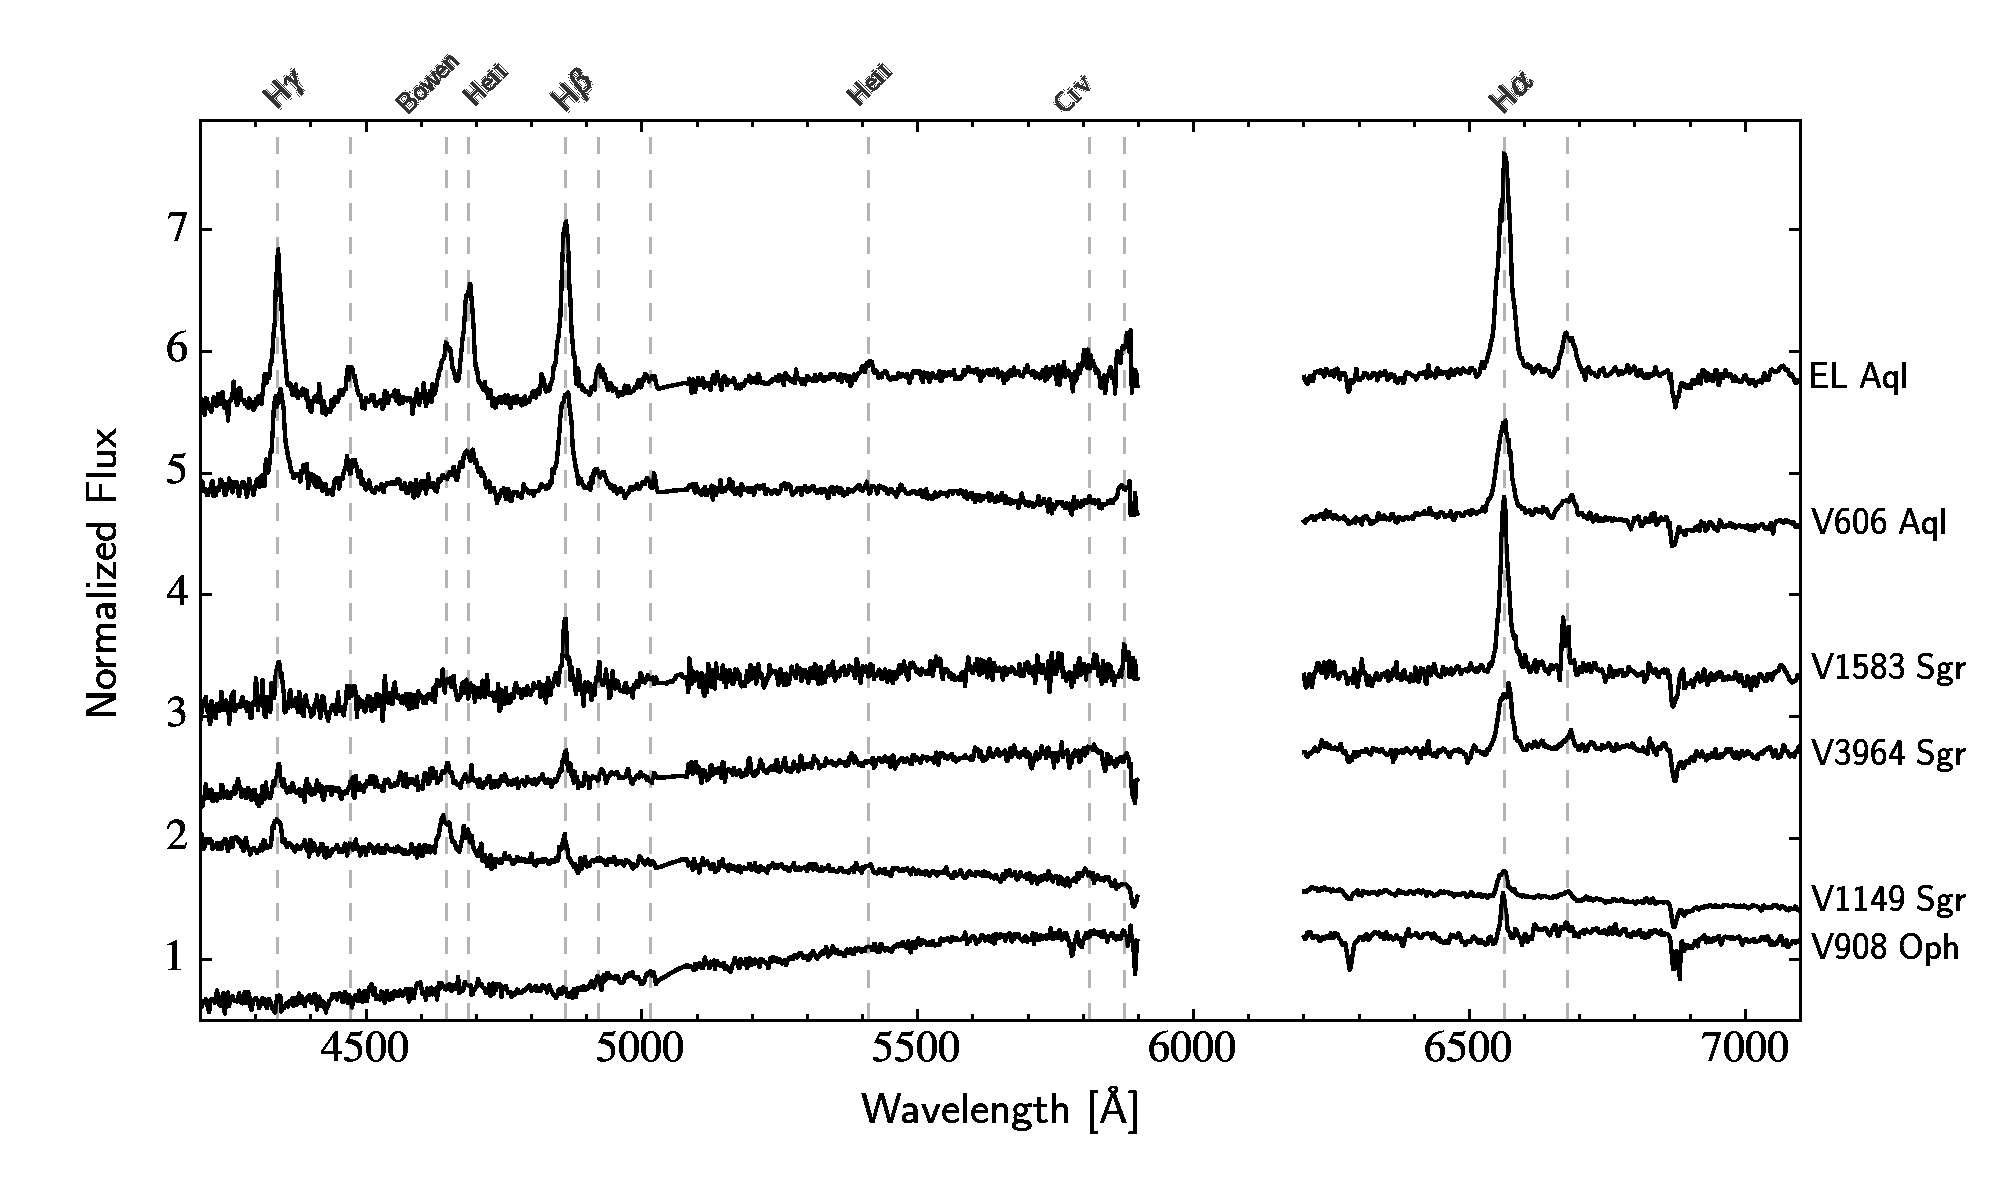
Colour–colour diagrams for the fields of reported novae with ambiguous identification for the post-nova are presented in Fig. 1. We have excluded objects with photometric errors 0.1 mag or 0.005 mag to minimize contamination by very faint sources and artefacts, respectively. Candidates for subsequent spectroscopy were selected based on their position in the colour–colour diagram with respect to the other stars in the field. An additional selection criterion was the distance to the reported coordinates of the nova, taking into account their detection history. For example, the search area for novae that were identified on photographic plates was limited to the central 1 arcmin2. Subsequent long-slit spectroscopic data were used to confirm the post-nova. The spectra of the confirmed novae are presented in Fig. 2, their photometric data are summarized in Table 2.
We briefly describe the methods used to analyse the spectroscopic properties that apply to all targets. The emission line strength is characterized via the equivalent width , which is calculated with respect to three manually selected wavelength ranges. Two of them are used to define the continuum and the noise on either side of the line, while the third one contains the line itself. We then integrate over the range of the latter divided by a linear fit to the continuum. The uncertainty of the resulting is estimated via a Monte Carlo simulation by repeating the measurement a thousand times to a variation of the data with respect to the addition of a random value within the noise interval. The resulting equivalent widths are presented in Table 3.
We make an attempt at recovering the intrinsic SED by correcting for the interstellar extinction in the line of sight. We use the interface on NASA’s Infrared Science Archive (IRSA) web pages555http://irsa.ipac.caltech.edu/applications/DUST/ to obtain values from Schlafly & Finkbeiner (2011). These serve as input for the dereddening routine implemented in iraf and based on the relations from Cardelli, Clayton, & Mathis (1989). A standard value for the ratio of the total to the selective extinction is employed. In order to characterize the corrected continuum slope, we fit the wavelength range between 5000 and 7000 Å with a power law . For the intrinsic SED, the exponent then depends on the mass-transfer rate and the system inclination. Larger values for correspond to higher mass-transfer rates (hotter and thus bluer discs) and lower inclinations (a larger fraction of the hotter inner disc is visible). However, there are large uncertainties involved in the reddening correction, because these are large-scale extinction maps with a resolution of 22 deg and local fluctuations may be present. Furthermore, the exact depth position of the nova with respect to the absorbing material is also unknown. These uncertainties propagate to the derived , which should thus be taken only as an approximate indicator of the intrinsic SED.
3.1 EL Aquilae = Nova Aql 1927
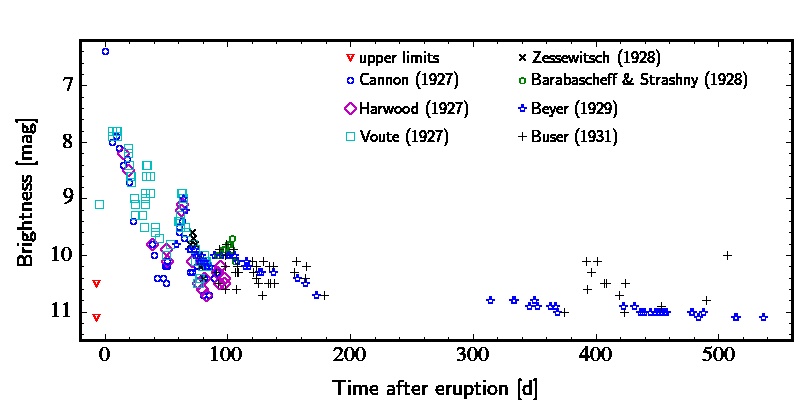
The nova was discovered by Wolf (1927) as a star of ninth magnitude on photographic plates taken on 1927 July 30 and 31. Examination of pre-discovery Harvard plates by Cannon (1927) revealed the object having reached its peak brightness before that date. The brightest recorded value is 6.4 mag on 1927 June 15, which is thus taken as maximum brightness, although observational gaps before and after that date leave room for an even brighter peak value. The decline of the nova is comparatively well covered, especially in the first 200 d after eruption. Description of the spectral evolution during the decline is found in a number of publications. The most detailed data can be found in Wyse (1940), while Schajn & Nikonoff (1928) present the only drawing of the spectrum.
In spite of the good photometric coverage, there is no complete representation of the long-term light curve in the literature. The plot in Wyse (1940) is limited to the first 100 d, and Beyer (1929) does not include the Harvard data. In Fig. 3, we collect the observations from Cannon (1927), Harwood (1927), Voûte (1927), Zessewitsch (1928), Barabascheff & Strashny (1928), Beyer (1929) and Buser (1931). The dates and brightness values from Voûte (1927) were extracted from his plot with a precision of 0.25 d and 0.1 mag, respectively. All other data were available in tabulated form. For data where only the start of night was given, UT = 0 h was assumed for the observation. We omitted from the plot the first four data points from Buser (1931), where he describes the target as ‘blurred’, because they differ drastically from those of other authors. The upper limits in the plot are from Cannon (1927) and Voûte (1927). For reasons of visualization, we omit another upper limit (16 mag) from 1927 May 28 (Cannon, 1927).
After the initial decline, the nova experienced a series of minor rebrightenings and then settled on a prolonged plateau phase. There also appear to be further fluctuations around 400 and 500 d after eruption. These are based on the Buser (1931) data only, but since in the overlapping regions his magnitudes usually agree within 0.2 mag to those of other authors, there is no reason to doubt the reality of these rebrightenings. To our knowledge, there are no further data on the nova after the seasonal gap between 540 and 720 d after eruption. Assuming that this is not due to the lack of observations, the final decline must have occurred sometime during that period. Wyse (1940) observed the field again on 1940 June 5 and reported a brightness of 19 mag for the nova, but, as we argue below, this is a likely misidentification.
The decline light curve is classified in Duerbeck (1981) as ‘Ba’ that includes novae with ‘standstills or other minor irregular fluctuations during decline’. Although EL Aql is not included in the Strope, Schaefer, & Henden (2010) catalogue, its light curve likely corresponds to the ‘P’ (plateau) class, and in particular, shows some similarity to HS Sge, especially with respect to the rebrightenings. In EL Aql, the major peak around day 63 makes it difficult to define the end of the initial decline and the start of the plateau phase. If we select the end of this event as the corresponding point, we find the following approximate values for the light-curve parameters as defined by Strope et al. (2010): the time of the start of the plateau phase, and thus the duration of the initial decline, 87 d, the duration of the plateau phase 450–630 d, the brightness difference between the start of the plateau phase and the peak magnitude 3.9 mag, and the slope of the decline during the plateau phase to . These are typical values for class P novae and justify the inclusion of EL Aql into this category. Strope et al. (2010) find that this class contains a large fraction (60–90%) of the recurrent novae and suggest that some of the other systems in this class are yet unrecognized recurrent novae. The remaining members of the P class novae appear to be magnetic systems.
A candidate for the post-nova was selected from our photometric data on the basis of its colours (Fig. 1, Table 2) and its proximity (3 arcsec) to the coordinates reported in Downes et al. (2005). The spectrum of this object presents emission lines typical for a CV and we conclude that it is indeed the post-nova. Its brightness is mag and thus considerably fainter than the 19th magnitude star observed by Wyse (1940) in 1940. Szkody (1994) gives a value of mag for EL Aql for observations made in 1989. It is, in principle, possible that both observations above caught the post-nova in a bright state (or our data were taken in a low state). However, we consider this unlikely, because CVs in bright states are also expected to have bluer colours than in low states, and the object observed by Szkody (1994) is significantly redder in the visual range ( mag compared to our 0.62 mag, see Table 2). We thus conclude that those observations did not concern the post-nova, but a different object. Similarly, Harrison (1992) gives infrared data mag, mag, mag for EL Aql. This led Pagnotta & Schaefer (2014) to suspect the nova to contain a giant secondary star. However, the spectral appearance of the post-nova (Fig. 2) and its position in the colour–colour diagram does not support this interpretation, and it thus again appears more likely that Harrison (1992) observed a different object. We furthermore note that the resulting eruption amplitude (defined as the difference between the brightness of the post-nova and the maximum brightness) of 14.5 mag basically excludes EL Aql as a recurrent nova candidate.
EL Aql presents a rich emission line spectrum (Fig. 2, Table 3). The Balmer lines are exceptionally strong for an old nova, which might be indicative of a low mass-transfer rate (Patterson, 1984). The strength of He ii 4686 and the presence of He ii 5412 points to a magnetic system, but since the former does not quite match the strength of H, EL Aql is more likely to be an intermediate polar rather than a discless system. The continuum has a slightly red slope, but as can be seen from the comparison of the colour–colour diagrams (Fig. 1), the field of EL Aql is significantly affected by interstellar reddening. From the IRSA website, we find = 1.11(08) mag, and when corrected for that value, an inverse power law with an exponent provides an excellent fit to the continuum slope.
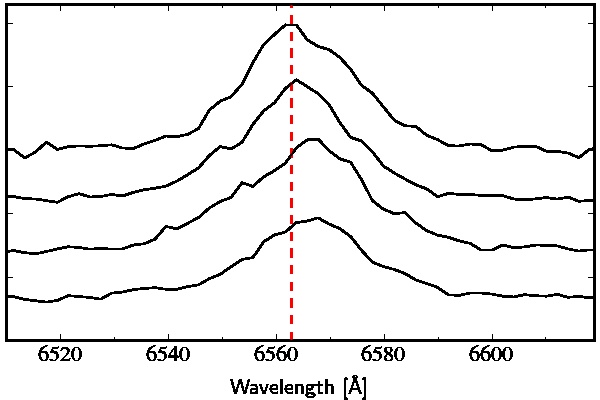
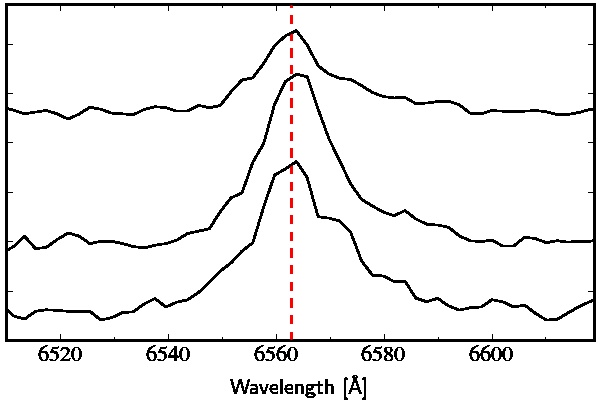
The spectroscopic data on EL Aql consist of four individual spectra. In Fig. 4, we examine the variation of the H line profile over the course (1 h) of our observations. We find that the line as a whole shows a significant Doppler shift. Estimating the shift in radial velocity units by fitting a single Gaussian function to the line profiles yields a variation of 100 km s-1 over the observed time range. Furthermore, also the shape of the line profile appears to be variable, pointing to the presence of an additional emission source in the system, such as from an irradiated secondary star or a bright spot (e.g. Tappert & Hanuschik, 2001).
From the gathered evidence, we conclude that EL Aql is a likely intermediate polar seen at a moderately high inclination. In spite of its faintness, its orbital period might therefore be accessible with time series photometry.
3.2 V606 Aquilae = Nova Aql 1899
This is a little observed nova that was discovered by Fleming as an object of seventh magnitude on a photographic plate from 1899 April 21, as reported by Pickering (1900). The brightness of the nova on this plate was later more precisely determined to 6.75 mag by Leavitt (1933). There is a 200 d gap of observations prior to the discovery, and it is thus possible that the real maximum has been missed. Duerbeck (1987) estimates the peak brightness to 5.5 mag. The observed decline light curve as shown in Leavitt (1933) covers 160 d, and suggests a classification as type ‘P’ (Strope et al., 2010). In 1991, Ringwald et al. (1996) obtained spectroscopy of the suspected post-nova, but found a G7–K4 type spectrum for a = 16.3 mag object.
The south-western component of an unresolved visual binary that was marked in Downes et al. (2005) as the possible post-nova showed promising colours (Fig. 1, Table 2). Subsequent spectroscopy of the = 20.4 mag object confirmed the nova (Fig. 2). The spectrum presents comparatively strong Balmer emission lines, although not as strong as in EL Aql. The high excitation lines are even considerably weaker, and we do not detect He ii 5412. As discussed in Section 3.1, most members of the ‘P’-class appear to be recurrent or magnetic novae. Even if we use the actually observed brightness maximum to calculate the eruption amplitude, the result of mag appears much too large for a recurrent nova (Pagnotta & Schaefer, 2014). On the other hand, the spectroscopic properties do not present particularly strong evidence for a magnetic nature either. Apparently, V606 Aql is an unusual member of the P class.
The spectrum presents a slightly blue continuum slope, and the colour–colour diagram shows that the field is only moderately affected by interstellar extinction. After dereddening with a value = 0.35(03) mag, it became apparent that the continuum was distorted by a number of large ‘bumps’. After examining the three individual spectra, we concluded that the bumpy structure is not intrinsic but an artefact. However, the presence of the bumps rendered large parts of the continuum unusable for fitting. We thus chose a number of small regions of continuum between the blue emission lines as well as a couple of regions around 6000 Å to determine an inverse power-law exponent of 2.02(02).
When examining the H line profile of the individual spectra, the changes are not as pronounced as in EL Aql, and the Dopper shift of the whole profile is not as large (Fig. 5). Still, the shape of the line profile is clearly variable, and the width of the emission lines is basically identical to those in EL Aql. We thus tentatively conclude that also V606 Aql is likely seen at a moderately high inclination, which makes it a potential target for follow-up time series observations.
3.3 V908 Ophiuchi = Nova Oph 1954
Very few data are available for V908 Oph. Its discovery was reported by Blanco (1954) who detected O i emission in a near-infrared spectrum taken on 1954, July 2. He estimated the brightness in this spectral range to 9 mag, but suspected that the nova was observed about a week after its maximum brightness. The only other observations consist of two objective prism spectra taken on 1954 July 27 by Seyfert & Yoss (1954). Apart from strong H emission, they could not distinguish more detailed spectral features due to the object having declined to a blue magnitude ‘probably less than 14’. If the object was indeed observed several days after having reached its maximum brightness, and accounting for the colour differences between the two observations and for the strong interstellar reddening, the time to have declined by 3 mag below maximum brightness is likely to be in the order of 30–40 d, which would classify the object as a moderately fast nova.
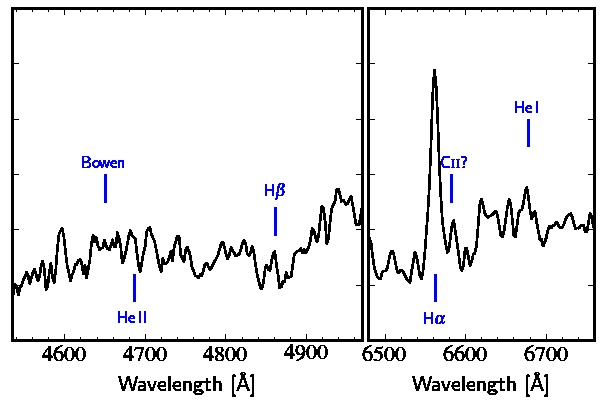
The coordinates of the nova had only been recorded with a precision in the order of arcmin, but fortunately, a candidate for the post-nova can be easily identified in the colour–colour diagram (Fig. 1). Its spectrum presents a few weak hydrogen emission lines, with those bluewards of H being embedded in absorption troughs, and a red continuum slope (Fig. 2). From the photometry, it is clear that the field is strongly affected by interstellar reddening, and the respective catalogue yields an accordingly high = 1.26(02) mag. Once corrected for this value, the SED corresponds to a steep blue power law with a negative exponent . Thus, the spectral characteristics are consistent with a high mass-transfer system. In Fig. 6, we show the soectral regions around H and H . in more detail. We note that high excitation emission lines like the Bowen blend and He ii are absent or, at least, very weak. This is in stark contrast to other likely high mass-transfer post-novae like GR Sgr (Paper V).
Towards the red side of H emission there appears to be another peak that could be identified with the C ii 6578,6583 doublet. This line has been previously detected in a few old novae with sufficiently narrow H emission lines (Tappert et al., 2013), and the latter also applies to V908 Oph. However, the signal-to-noise ratio (S/N) in that part of the spectrum is low, and there are a number of similar large features close-by, which we were unable to identify and thus suspect to be artefacts. In consequence, the detection of C ii in this object remains ambiguous.
We finally remark that we did not detect any significant positional variation of the H line in the three individual spectra. Together with the narrowness of that line, this suggests that the system is seen at low inclination, and that it will be difficult to determine its orbital period.
3.4 V1149 Sagitarii = Nova Sgr 1945
The nova was discovered by Mayall (1949) on an objective prism plate at a photographic brightness of about 9 mag. Later research by Warren (1965) revealed the maximum brightness to 7.4 mag. The light curve is described as a ‘very steep increase in brightness […] followed by a rapid initial decrease’, reaching a plateau by 1946 May 28. The nova was visible from 1945 May 16 to 1948 May 30, and afterwards fainted below 14.7 mag. Large gaps in the observations prevent a more detailed analysis.
From our photometry (Fig. 1), we selected two potential candidates for the post-nova based on their colours and coordinates. Spectroscopy showed one of those to present emission lines and a blue continuum, and we thus identify this object as the post-nova. It is located 11 arcsec south-west of the previously reported position. We note that these coordinates do not coincide with the objects labelled as V1149 Sgr in Saito et al. (2013) and in Mróz et al. (2015).
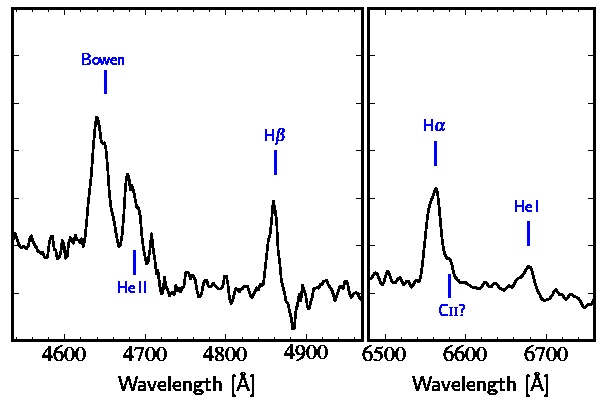
The spectrum shows a blue continuum, that becomes somewhat steeper () when corrected for the catalogued interstellar reddening of = 0.39(03) mag, and weak emission lines (Fig. 2). In contrast to V908 Oph (Section 3.3), V1149 Sgr counts with a strong Bowen blend and He ii 4686 emission (Fig. 7). Since no other He ii lines can be identified, the system is not a strong candidate for a magnetic CV. The Balmer lines are comparatively narrow, and a bump on the red wing of H could tentatively identified with C ii (see also Section 3.3). The three individual spectra do not show any significant radial velocity variations, and thus, like V908 Oph, this object is likely to be seen at a rather low system inclination.
3.5 V1583 Sagitarii = Nova Sgr 1928
An examination of archival photographic plates by Dishong & Hoffleit (1955) led to the discovery of this nova almost 30 yr after its eruption. Still, in contrast to other novae, the maximum brightness of 8.9 mag on 1928 June 24 appears to be well established. The authors report that two days before that night, the nova was fainter than 15.6 mag and that it fell again below the plate detection limit 75 d after maximum brightness. The system is classified as a moderately fast nova with a decline time d (Duerbeck, 1987).
From its colours (Fig. 1, Table 2) and its position only 3.5 arcsec off the reported coordinates, we identified a candidate for the nova. Subsequent spectroscopy show a slightly reddish continuum (Fig. 2), which is likely the consequence of a comparatively strong interstellar reddening ( = 1.09(04) mag). Like for most of the other systems, the corrected SED presents a blue slope, with . Superposed are moderately strong emission lines (Table 3) of the Balmer and He i series. Similar to V908 Oph (Section 3.3), the Bowen blend and He ii 4686 lines are weak and hardly detectable.
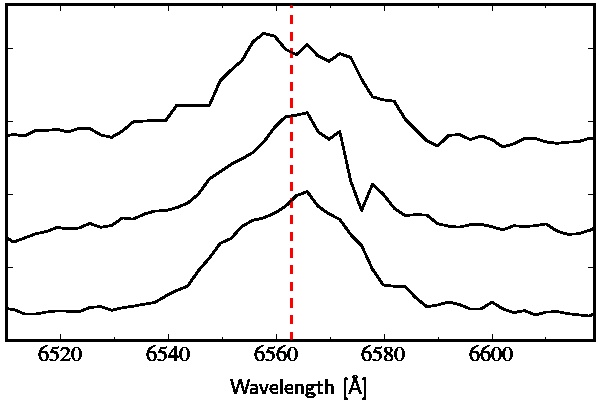
The emission lines are also comparatively narrow, but still the line profile shows some clear asymmetric structure and marked differences between the individual exposures (Fig. 8). We especially notice that the line strength in the third spectrum of that series is significantly diminished, which indicates that the emission source is being obscured. A possible explanation for this apparent discrepancy between narrow lines and an obscuration effect is that the system is seen at high inclination, but that the Doppler-broadened component of the line profile produced by the disc is weak and that the line profile is dominated by a narrow component that originates on the secondary star. In any case, the observed obscuration makes V1583 Sgr an attractive target for time series photometry.
3.6 V3964 Sagittarii = Nova Sgr 1975
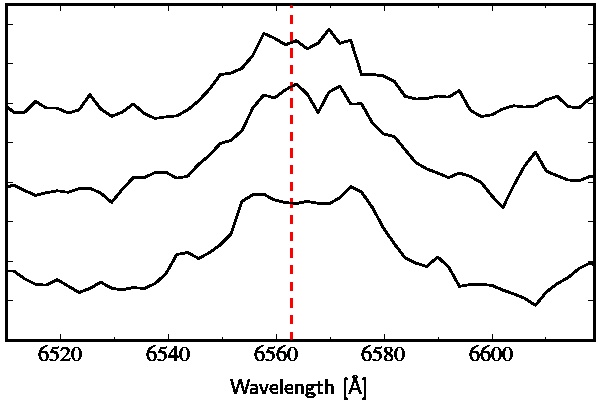
In Paper V, we had observed a candidate for this nova that turned out to be a K1V star. However, examination of the 2D spectra showed the possibility of H emission from a different star in the slit, and a likely source of this emission was identified. Here, we present further spectroscopic observations of that target. The spectrum in Fig. 2 clearly reveals it as the post-nova system, presenting the typical hydrogen and helium emission lines, as well as a weak Bowen blend. The continuum has a red slope, but like in the other objects, this is due to interstellar reddening. Still, even after the correction for = 0.56(01) mag, the slope appears significantly flatter than in the other systems, being represented by an exponent = 1.43(03). The emission lines are not particularly strong (Table 3), but broad, and even show, at times, a hint of a double-peaked disc profile (Fig. 9). Furthermore, like in V1583 Sgr (Section 3.5), the emission line in the third spectrum is significantly diminished compared to the other two spectra. On the other hand, a possible Doppler shift of the line is less clear. Still, the width of the line, the potential obscuration effect and the flat slope of the corrected continuum suggest that V3964 Sgr is seen at a comparatively high inclination. Thus, it should be feasible to determine the orbital period with time series photometry.
3.7 V1301 Aquilae and V1151 Sagitarii
Together with V3964 Sgr (Section 3.6), we had also reported on candidates for the novae V1301 Aql and V1151 Sgr that turned out to be misidentifications (Paper V). For both targets, we had indicated alternative candidates in the immediate vicinity of the original targets. In the current observing run, we incorporated some of these new candidates, namely the objects marked as ‘W1’ and ‘W2’ for V1301 Aql, and the one marked as ‘1’ in the case of V1151 Sgr. All objects show rather unremarkable spectra with reddish continua and Balmer lines in absorption. ‘1’ turned out to be a close visual binary, but neither component presented any emission lines. These two post-novae thus remain unidentified. Likely, additional photometric data will be needed to select further candidates for spectroscopy.
4 Discussion
| Object | 1 | 1 | FWHM(H) | ||||||||
|---|---|---|---|---|---|---|---|---|---|---|---|
| (mag) | (mag) | (mag) | (yr) | (d) | (mag) | (Å) | (Å) | (km s-1) | (arcsec) | ||
| EL Aql | 6.4 | 20.9 | 14.5 | 88 | 25 | 1.11 | 3.12 | 47 | 27 | 1230 | 3 |
| V606 Aql | 6.8 | 20.4 | 13.6 | 116 | 65 | 0.35 | 2.02 | 26 | 28 | 1280 | 2 |
| V908 Oph | 9 | 20.5 | 11.5 | 61 | 30 | 1.26 | 3.38 | 3 | 12 | 550 | 234 |
| V1149 Sgr | 7.4 | 18.4 | 11.0 | 70 | 270 | 0.39 | 2.41 | 6 | 21 | 960 | 11 |
| V1583 Sgr | 8.9 | 20.5 | 11.6 | 87 | 37 | 1.09 | 3.27 | 26 | 17 | 780 | 4 |
| V3964 Sgr | 8.5 | 19.0 | 11.5 | 40 | 32 | 0.56 | 1.43 | 12 | 29 | 1320 | 3 |
1 : photographic, : band, : band, : near-infrared.
In Table 4 we have collected several distinguished properties of the here presented post-novae. These are the maximum brightness , the brightness of the post-nova at the time of our observations and the resulting eruption amplitude defined as . In the next two columns, we give the time that has passed between the nova eruption and our spectroscopic data and the time by which the nova had declined to 3 mag below maximum brightness. The parameters in the subsequent two columns are associated with the determination of the continuum slope, representing the catalogued value for the interstellar reddening and the negative exponent of the fitted power law (Section 3). The next three columns give selected properties of the H emission line: the equivalent width and the FWHM of a Gaussian fit to the line, the latter both in wavelength and in velocity units. The final column states the deviation of the position of an object from the originally recorded coordinates of the nova eruption as given by Downes et al. (2005).
Since the absolute maximum brightness of novae shows a scatter of typically only 2–3 mag (della Valle & Livio, 1995; Kasliwal et al., 2011), but the absolute brightness of CVs in quiescence is distributed over a range of 9 mag (e.g., Patterson, 1984), differences in will mostly reflect the difference in the brightness of the post-nova. The latter principally depends on the brightness of the accretion disc (or, more generally, on the emission from the accretion process), and thus on the mass-transfer rate and on the system inclination (Warner, 1986). Because can be assumed to be largely independent of these two quantities, can be taken as an indicator of the absolute brightness of the post-nova and of the involved parameters. Apart from the spread in the absolute maximum brightness, additional uncertainties are introduced by the possibility that the recorded does not correspond to the real maximum brightness, but that the nova was observed at some later point, and by the different passbands used for and for . While in general, the colour differences in the optical range for CVs will amount to less than 1 mag (e.g., Szkody, 1994), these differences will be enhanced in regions with strong interstellar reddening. A thorough analysis of will thus have to correct for these effects. However, here we only aim at a rough classification of our post-novae within the CV subtypes, and we will do so by also considering other parameters, thus reducing the weight of above uncertainties.
Further quantities of Table 4 that are indicative of are and . The significance of the former and the involved uncertainties have already been presented in Section 3. The indicative power of the latter stems from low-, optically thin discs producing stronger emission lines than high-, optically thick ones (Tylenda, 1981; Patterson, 1984). However, in CVs, typically the accretion disc is not the sole contributor to the emission line profile (Tappert & Hanuschik, 2001). Because post-novae contain an eruption heated white dwarf, irradiation of the secondary star is likely to produce an additional emission component. Furthermore, there is also the possibility that the ejected material still contributes to the line profile especially in ‘younger’, i.e. more recent post-novae. Finally, because the continuum emission depends on , so does (Warner, 1987), and thus in our interpretation, we will also use the width of the line FWHM, which is indicative of due to the larger projected velocity values sampled in the line profile.
EL Aql and V606 Aql are the novae with the largest eruption amplitudes in the present sample. Indeed, a comparison with fig. 7 in Paper V shows that there are only 10 novae in our sample of pre-1986 eruptions with similar large . The idea of this parameter being an indicator for the disc brightness in these two systems fits well with the comparatively strong emission lines. On the other hand, the lines are also broad, and thus additionally, the inclination will have contributed to the high value of . While, for V606 Aql, also is in agreement with a comparatively low- disc, this is not the case for EL Aql. However, we note that the steepest continuum slopes are found for the systems with the largest interstellar reddening. This appears suspicious and suggests a tendency to overcorrect for this effect.
V908 Oph and V1149 Sgr have the smallest and are also spectroscopically consistent with an optically thick disc and thus high in that they present only weak emission lines. In V908 Oph, the bluer hydrogen lines are even embedded in absorption troughs. Still, also here the line width suggests that the inclination is such that it amplifies that effect. In conclusion, because of the strong dependence of and on , those four post-novae could have very similar intrinsic properties with respect to in spite of their different spectroscopic appearance.
The picture is somewhat different for the remaining two systems. V1583 Sgr presents narrow, but comparatively strong emission lines with a variable line profile and medium . We interpret this as the combination of a broad but weak disc line profile and a narrow component that likely originates in the secondary star. In this way, all parameters would agree with V1583 Sgr having a medium to high and a medium to high inclination. Assuming that the narrow component is produced by irradiation, we would also expect that either the white dwarf in this system is still very hot or that the orbital period is comparatively short. Because of the ‘age’ of the post-nova ( = 87 yr), the latter appears more likely. Finally, V3964 Sgr has broad and weak lines and shows a possible obscuration effect in one spectrum. This points to a high- system seen at high inclination. The recorded medium represents only a lower limit that, if the speculations by Lundström & Stenholm (1976, 1977) are correct, could be up to 3 mag larger (see also Paper V, ). Thus, it would also be in agreement with a high . Last, not least, the continuum slope appears rather flat for the suspected high , but again might reflect a high system inclination.
In Paper V, we have argued that there is a high probability that the CVs detected by us do, in fact, represent the post-novae corresponding to the respective nova eruption and not different CVs that coincidentally have similar coordinates. Our first point was that the low space density of CVs (Pretorius, 2014, and references therein) makes it unlikely that more than one CV could be present in a field of a few square arcmin and a limiting magnitude of 24 mag, although a proper quantitative treatment would have to take into account a detailed model of the Galactic structure. As a second point of support to our argumentation, we estimated our detection probability of a specific post-nova system. This is based on the limiting magnitude of our photometry, calculated as the faintest object that is detected in and has S/N = 5 in , corresponding to an uncertainty in the brightness of 0.198 mag. This gives us the maximum amplitude that a nova with a brightness at maximum can have to still be detected in that specific photometry. Finally, the fraction of novae with translates into the detection probability. This probability is not fixed, but depends on our current knowledge of the distribution. As of 2016 May 15, we count 92 pre-1986 post-novae with known , with the shape of the distribution suggesting that it is biased to bright, small- post-novae (Paper V). Our estimate furthermore ignores the possibility that a nova could have very unusual colours and thus is not recognized as such.
Table 4 shows that four of our objects were detected within 5 arcsec of the reported eruption and thus in its immediate vicinity. We estimate the possibility of a different CV being present within this radius to have a very low probability, making it unnecessary to additionally calculate the detection probability for them. V1149 Sgr is slightly farther off, but only V908 Oph shows a very large discrepancy, due to the low precision of the coordinates of the nova eruption. For the photometries of V1149 Sgr and of V908 Oph we find = 23.0 and 20.5 mag, and thus = 15.6 and 11.5 mag, respectively. The much lower brightness and limit for V908 Oph is not due a lower quality of the photometry but a result of the strong interstellar reddening causing less than 1 per cent of the objects detected in being also detected in . The corresponding detection probabilities then calculate to 99 and 55 per cent. Additionally taking into account the small positional deviation to the reported coordinates, we can thus be confident that V1149 Sgr is indeed the post-nova. For V908 Oph, the case is less clear, and both parameters leave room for speculation. Here, basically the only argument supporting the identification of this system with the post-nova of Nova Oph 1954 is the absence of other candidates in the field.
5 Summary
-
1.
We have used photometry and optical spectroscopy to recover the post-novae EL Aql, V606 Aql, V908 Oph, V1149 Sgr, V1583 Sgr and V3964 Sgr. We furthermore report on spectroscopy of candidates for the post-novae V1301 Aql and V1151 Sgr,
-
2.
Historic observations of EL Aql were collected to build a complete eruption light curve that allows it to be classified as a class P nova (Strope et al., 2010). Its eruption amplitude and colours indicate that the previously suspected possibility that EL Aql is a recurrent nova, is based on source confusion. Furthermore, its spectroscopic features suggest that the object belongs to the group of intermediate polars.
-
3.
Comparison of several properties of the novae indicates that the differences in the spectroscopic appearances of EL Aql, V606 Aql, V908 Oph and V1149 Sgr regarding the aspect of the mass-transfer rate are likely to be an effect of the system inclination and thus do not allow for a conclusive classification.
-
4.
The shape of the H emission line profile in V1583 Sgr indicates that it is dominated by a non-disc emission component, likely originating in the irradiated donor star.
-
5.
Inspection of the emission line profiles of the individual spectra proposes EL Aql, V606 Aql, V1583 Sgr and V3964 Sgr as good candidates for time series observations in order to determine the orbital period.
-
6.
We have calculated the probability that the detected objects are, in fact, the post-novae corresponding to the reported eruptions. We have found that the only potentially ambiguous case is that of V908 Oph, where the low precision of the reported nova coordinates and the strong interstellar reddening strongly reducing the number of objects detected in leave some room for doubt. Still, in the absence of other candidates, the here presented object should be regarded as the post-nova.
Acknowledgements
This paper is based on observations with Gemini-South, program IDs GS-2015A-Q-54 and GS-2015A-Q-75, and ESO telescopes, proposal numbers 089.D-0505(A) and 092.D-0225(A). We are indebted to the Gemini and ESO astronomers who performed the service observations. ESO furthermore provided office space and infrastructure for the two week stay of AE in Chile, during which large parts of the work were discussed and prepared. Many thanks for the kind hospitality!
This research was supported by FONDECYT Regular grant 1120338 (CT and NV). AE acknowledges support by the Spanish Plan Nacional de Astrononomía y Astrofísica under grant AYA2015-66211-C2-1. CT, NV and IFM acknowledge support by the Centro de Astrofísica de Valparaíso.
We gratefully acknowledge ample use of the SIMBAD data base, operated at CDS, Strasbourg, France, and of NASA’s Astrophysics Data System Bibliographic Services. iraf is distributed by the National Optical Astronomy Observatories.
The Guide Star Catalogue-II is a joint project of the Space Telescope Science Institute and the Osservatorio Astronomico di Torino. Space Telescope Science Institute is operated by the Association of Universities for Research in Astronomy, for the National Aeronautics and Space Administration under contract NAS5-26555. The participation of the Osservatorio Astronomico di Torino is supported by the Italian Council for Research in Astronomy. Additional support is provided by European Southern Observatory, Space Telescope European Coordinating Facility, the International GEMINI project and the European Space Agency Astrophysics Division.
Gemini Observatory is operated by the Association of Universities for Research in Astronomy, Inc., under a cooperative agreement with the NSF on behalf of the Gemini partnership: the National Science Foundation (United States), the National Research Council (Canada), CONICYT (Chile), the Australian Research Council (Australia), Ministério da Ciência, Tecnologia e Inovação (Brazil) and Ministerio de Ciencia, Tecnología e Innovación Productiva (Argentina).
References
- Appenzeller et al. (1998) Appenzeller I. et al., 1998, The Messenger, 94, 1
- Barabascheff & Strashny (1928) Barabascheff N., Strashny G., 1928, Astron. Nachr., 234, 213
- Beyer (1929) Beyer M., 1929, Astronomische Nachrichten, 235, 427
- Blanco (1954) Blanco V. M., 1954, IAU Circ., 1461, 1
- Buser (1931) Buser F., 1931, Astronomische Nachrichten, 244, 207
- Cannon (1927) Cannon A. J., 1927, Harvard College Observatory Bulletin, 851, 9
- Cardelli et al. (1989) Cardelli J. A., Clayton G. C., Mathis J. S., 1989, ApJ, 345, 245
- della Valle & Livio (1995) della Valle M., Livio M., 1995, ApJ, 452, 704
- Dishong & Hoffleit (1955) Dishong J., Hoffleit D., 1955, AJ, 60, 259
- Downes et al. (2005) Downes R. A., Webbink R. F., Shara M. M., Ritter H., Kolb U., Duerbeck H. W., 2005, Journal of Astronomical Data, 11, 2
- Duerbeck (1981) Duerbeck H. W., 1981, PASP, 93, 165
- Duerbeck (1987) Duerbeck H. W., 1987, Space Sci. Rev., 45, 1
- Harrison (1992) Harrison T. E., 1992, MNRAS, 259, 17P
- Harwood (1927) Harwood M., 1927, Harvard College Observatory Bulletin, 851, 10
- Hellier (2001) Hellier C., 2001, Cataclysmic Variable Stars. Springer
- Hook et al. (2004) Hook I. M., Jørgensen I., Allington-Smith J. R., Davies R. L., Metcalfe N., Murowinski R. G., Crampton D., 2004, PASP, 116, 425
- Kasliwal et al. (2011) Kasliwal M. M., Cenko S. B., Kulkarni S. R., Ofek E. O., Quimby R., Rau A., 2011, ApJ, 735, 94
- Kovetz et al. (1988) Kovetz A., Prialnik D., Shara M. M., 1988, ApJ, 325, 828
- Landolt (1983) Landolt A. U., 1983, AJ, 88, 439
- Landolt (1992) Landolt A. U., 1992, AJ, 104, 340
- Lasker et al. (2008) Lasker B. M. et al., 2008, AJ, 136, 735
- Leavitt (1933) Leavitt H. S., 1933, Annals of Harvard College Observatory, 84, 121
- Lundström & Stenholm (1976) Lundström I., Stenholm B., 1976, IAU Circ., 2997, 2
- Lundström & Stenholm (1977) Lundström I., Stenholm B., 1977, Information Bulletin on Variable Stars, 1351, 1
- Mayall (1949) Mayall M. W., 1949, AJ, 54, 191
- Mróz et al. (2015) Mróz P. et al., 2015, ApJS, 219, 26
- Pagnotta & Schaefer (2014) Pagnotta A., Schaefer B. E., 2014, ApJ, 788, 164
- Patterson (1984) Patterson J., 1984, ApJS, 54, 443
- Patterson et al. (2013) Patterson J. et al., 2013, MNRAS, 434, 1902
- Pickering (1900) Pickering E. C., 1900, ApJ, 12
- Pretorius (2014) Pretorius M., 2014, in The X-ray Universe 2014, p. 164
- Prialnik & Shara (1986) Prialnik D., Shara M. M., 1986, ApJ, 311, 172
- Ringwald et al. (1996) Ringwald F. A., Naylor T., Mukai K., 1996, MNRAS, 281, 192
- Saito et al. (2013) Saito R. K. et al., 2013, A&A, 554, A123
- Schajn & Nikonoff (1928) Schajn G., Nikonoff W., 1928, Astronomische Nachrichten, 233, 221
- Schlafly & Finkbeiner (2011) Schlafly E. F., Finkbeiner D. P., 2011, ApJ, 737, 103
- Seyfert & Yoss (1954) Seyfert C. K., Yoss K. M., 1954, Harv. Coll. Obs. Ann. Card, 1260
- Shara et al. (1986) Shara M. M., Livio M., Moffat A. F. J., Orio M., 1986, ApJ, 311, 163
- Stetson (1992) Stetson P. B., 1992, in Astronomical Society of the Pacific Conference Series, Vol. 25, Astronomical Data Analysis Software and Systems I, Worrall D. M., Biemesderfer C., Barnes J., eds., p. 297
- Stetson (2000) Stetson P. B., 2000, PASP, 112, 925
- Strope et al. (2010) Strope R. J., Schaefer B. E., Henden A. A., 2010, AJ, 140, 34
- Szkody (1994) Szkody P., 1994, AJ, 108, 639
- Tappert et al. (2012) Tappert C., Ederoclite A., Mennickent R. E., Schmidtobreick L., Vogt N., 2012, MNRAS, 423, 2476
- Tappert & Hanuschik (2001) Tappert C., Hanuschik R., 2001, LNP Vol. 573: Astrotomography, Indirect Imaging Methods in Observational Astronomy, 573, 119
- Tappert et al. (2013) Tappert C., Schmidtobreick L., Vogt N., Ederoclite A., 2013, MNRAS, 436, 2412
- Tappert et al. (2014) Tappert C., Vogt N., Della Valle M., Schmidtobreick L., Ederoclite A., 2014, MNRAS, 442, 565
- Tappert et al. (2015) Tappert C., Vogt N., Schmidtobreick L., Ederoclite A., 2015, MNRAS, 450, 943 (Paper V)
- Tomov et al. (2015) Tomov T., Swierczynski E., Mikolajewski M., Ilkiewicz K., 2015, A&A, 576, A119
- Tylenda (1981) Tylenda R., 1981, Acta Astron., 31, 127
- Voûte (1927) Voûte J., 1927, Bull. Astron. Inst. Netherlands, 4, 106
- Warner (1986) Warner B., 1986, MNRAS, 222, 11
- Warner (1987) Warner B., 1987, MNRAS, 227, 23
- Warner (1995) Warner B., 1995, Cataclysmic variable stars. Cambridge Astrophysics Series, Cambridge, New York: Cambridge University Press
- Warren (1965) Warren J., 1965, AAVSO Abstracts, 8
- Wolf (1927) Wolf M., 1927, Astronomische Nachrichten, 230, 421
- Wyse (1940) Wyse A. B., 1940, Publications of Lick Observatory, 14, 217
- Zacharias et al. (2013) Zacharias N., Finch C. T., Girard T. M., Henden A., Bartlett J. L., Monet D. G., Zacharias M. I., 2013, AJ, 145, 44
- Zessewitsch (1928) Zessewitsch W., 1928, Astronomische Nachrichten, 231, 383
Appendix A Finding charts