Light simulation in
plastic scintillator strip
with embedded wavelength shifting fiber
Abstract
The simulation study of the light yield and attenuation in the plastic scintillator was performed. The wavelength shifting fiber readout was embedded in the grooves machined along the entire strip surface. The scintillator strips was irradiated with a radiation source or cosmic muons along and across the strip.
1 Introduction
Cosmic muons are the important contributors to background processes when search for the conversion of a muon to an electron[1, 2]. Cosmic ray veto geometry surrounding the detectors and stopping target should be carefully eliminated this background. Passive and active shielding should provide background of 0.1 events in signal window for 3 year run of experiments. Scintillator-based active shielding will consist of four layers. The scintillator strips will read out by multiclad wavelength shifting (WLS) fibers connected to photodetectors. Most promising devices based on new technologies used as photodetectors are the silicon photomultipliers (SiPM)[3]. Photon detection efficiency of SiPM is dependent on wavelength of the photon, temperature, dark count[4] etc., and very difficult to be measured and even more difficult to model[5]. For this reason, we are limited only to the study of the light propagation and collection. Even for this purpose, a Monte Carlo simulation can adequately predict the experimental results only if the detector parameters are sufficiently close to their true values. Some of parameter, e.g. surface boundaries descriptions, can be tuned by using measurements for particular scintillator strip configurations.

2 Some features of the plastic scintillator strip modeling
The Monte Carlo simulation with all possible processes play a crucial role in the feasibility study of the proposed detector module and in identifying detector parameter values. Low-energy optical photons (photons with a wavelength much greater than the typical atomic spacing) undergo the following processes: bulk absorption, Rayleigh scattering, reflection and refraction at medium boundaries, and wavelength shifting.

The boundary processes on all scintillator play an important role in tracing photons in strips. Compared to them, photon self-absorption in scintillator is less significant[6]. In Geant4.10.06 [7] simulation we combined the polished scintillator surface finishes with the backpainted wrapping option which represents diffuse (Lambertian) reflection. In this simulation we use the UNIFIED model for the processes between two dielectric materials.

3 Simulation and results
The peak of emission light of a plastic scintillator (e.g., Saint Gobain BC400 series) does not matches the peak sensitivity of used photodetectors. To solve this problem it is necessary to use the WLS fiber to transfer light to the photodetector. In this simulation the fiber are multiclad consisting of a scintillating core surrounded by an acrylic inner cladding

and an outer cladding which made of a fluor-acrylic material (similar to the Kuraray double clad fibers of type Y11(200)[8]). It was assumed that in a scintillator strip a mean value of 10000 scintillation photons per MeV of deposited energy were emitted. For this scintillator, the maximum emission is at a wavelength of 431 nm and refractive index is 1.58.
For WLS fiber attenuation length of 500 cm for its own radiation, and for plastic scintillator attenuation length of 300 cm are assumed. The total diameter of fiber is 1.2 mm. The total thickness of cladding structure is 6% of the diameter of a fiber. In this simulation the strip contains one or two co-extruded grooves with 3 mm depth and 1.3 mm width for insertion of the WLS fiber. The selected strip and fiber parameters are close to those used in the test-beam measurements at JINR (Dubna, Russia).

This simulation was performed using Geant4 for plastic scintillator with the dimension 4*1*300 cm3 and co-extruded TiO2 white diffuse reflective (R=98) coating. The strip contain one at the center or two grooves at a distance of 2 cm from each other along the entire length of scintillator strip. We collect photons from a WLS fiber at one of the strip ends (hereinafter referred to as photodetector side). On the photodetector side at the fiber end the photons are fully absorbed. The opposite ends of the fibers are blackened.

The source was simulated in the Geant4 framework. The source provides an electron flux in a wide energy range up to 2.3 MeV (see Fig.1). The radiation source was enclosed in a shell with a lead collimator. The diameter of the collimator outlet was 1 mm. The source was located at a distance of 2 mm above or below the scintillator strip.
Cosmic muons were generated according to[9] in the range 0.3-5000 GeV. The zenith angle and energy distribution for simulated cosmic muons are displayed in Figure 2.

In Figure 3, we show the distribution of the energy deposited in the scintillation strip when the middle of the side 4*300 cm2 is irradiated with a source.
Figure 4 shows the light intensity distribution in the end of a fiber as seen by the photodetector side. This simulation study show that the light intensity increases towards the edge of the fiber core. The mean wavelength of light collected by the photodetector is 535 nm.
The distribution of the photon number at the photodetector side when the middle of the strip side 4*300 cm2 is irradiated with a is shown in Figure 5.
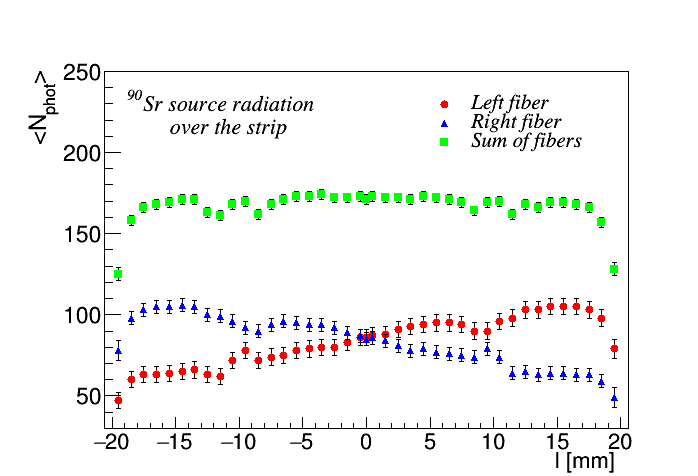
Figure 6 show the light yield when strip with one fiber irradiated with a source which located over or under the strip at Z=0.0 cm. The strip is located at X= 2.0 cm, Y= 0.5 cm, Z= 150.0 cm. The first point is 0.5 mm away from the side (X=19.5 mm) and each step is 1 mm (X-coordinate). Points close to X=0.0 mm are located at a distance of 0.5 mm. In this and the following Figures, 500 events were simulated for each point.
In Figures 7 and 8, the same thing is shown as in Figure 6 but for the case with two fibers in the strip. Note that, in both cases (strip with one and two fibers), the behaviors of the light yield when a radiation source is above and below the strip differ from each other. But this difference is not significant.
Figure 9 shows the relation between the mean number of optical photons detected at the photodetector side and the distance between point of impact of electrons from the radiation source and photodetector side. This graph is fitted by a function
Note that this formula was proposed by Kaiser et al.[10] for the case when light is collected from the ends of the scintillator using a photomultipliers. The first term is the transmission behavior for photons that travel directly to the photodetector side.

The second term is the transmission behavior for photons that hit the detector after a series of reflection on a scintillator surface. The first point in the Figure is 75 mm away from the photodetector side and each step is 75 mm. The curve in the figure corresponds to the parameters =43.5 m and =1.75 m with almost 100% errors.
To study the light attenuation when the strip surface is irradiated by cosmic muons we retreated on each side of the surface by 1 mm and divided it into 40 equal parts. Each sector has been uniformly irradiated by 500 muons with energies, azimuth and zenith angles modeled accordingly to[9]. In Figure 10, we demonstrate the light attenuation for this case. The points in the Figure are located in the center of each of the 40 sections. For the given points, the results of one exponential and double exponential fit are the same (blue curve in the Figure), =5.88 m. The green curve in Figure corresponds to the fit by the formula
where 2.32 m.

4 Conclusion
In this note, we modelled the light output and attenuation in a scintilltion strip with dimensions of 4*1*300 cm3. The simulated radiation source and cosmic muons were used as beam particles. The scintillation strip was irradiated both from the side of the embedded fibers and from the opposite side along and across the strip. Optical photons was collected from one and two fibers embedded in the strip along the entire length. It was shown that the attenuation of light depending on the distance to the photodetector is described by a double exponential function.
We are sincerely grateful to Z. Tsamalaidze and Yu. Davydov for initiating this work.
References
- [1] K. Akhmetshin et al., Letter of Intend for Phase-I of the COMET Experiment at J-PARC, KEK/J-PARC-PAC 2011-27, March 11, (2012).
- [2] L. Bartoszek et al., Mu2e Technical Design Report, FERMILAB-TM-2594, FERMILAB-DESIGN-2014-01, arXiv:1501.05241[physics.ins-det].
- [3] V. Golovin and V. Savelev, Nucl.Instrum.Meth. A442 (2000) 223; A518 (2004) 560.
- [4] S.K. Yang et al., Opt. Express 22 (2014) 216.
-
[5]
P. Eckert, R. Stamen, and H. Schultz-Coulon, JINST 7 (2012) P08011;
A.K. Jha et al., IEEE Trans.Nucl.Sci. 30(1) (2013) 336. - [6] G.F. Knoll, Radiation detection and measurement, Third Edition, John Wiley and Sons, Inc., Ann Arbor, (2000) 247.
-
[7]
S. Agostinelli et al., Geant4 - a simulation toolkit,
Nucl.Instrum.Meth. A506 (2003) 250,
https://geant4.web.cern.ch/support/user_documentation - [8] KURARAY CO., LTD., http://www.kuraray.co.jp/en/.
- [9] L.N. Volkova, G.T. Zatsepin, L.A. Kuzmichev, Yad.Fiz. 29 (1979) 1252; Sov.J.Nucl.Phys 29 (1979) 645.
- [10] S.C. Kaiser, J.A.M. de Villiers, IEEE Transactions on Nuclear Science, 1964, 11(3) 29.