Linking representations for multivariate extremes via a limit set
Abstract
The study of multivariate extremes is dominated by multivariate regular variation, although it is well known that this approach does not provide adequate distinction between random vectors whose components are not always simultaneously large. Various alternative dependence measures and representations have been proposed, with the most well-known being hidden regular variation and the conditional extreme value model. These varying depictions of extremal dependence arise through consideration of different parts of the multivariate domain, and particularly exploring what happens when extremes of one variable may grow at different rates to other variables. Thus far, these alternative representations have come from distinct sources and links between them are limited. In this work we elucidate many of the relevant connections through a geometrical approach. In particular, the shape of the limit set of scaled sample clouds in light-tailed margins is shown to provide a description of several different extremal dependence representations.
Key words: multivariate extreme value theory; conditional extremes; hidden regular variation; limit set; asymptotic (in)dependence.
1 Introduction
Multivariate extreme value theory is complicated by the lack of natural ordering in , and the infinite possibilities for the underlying set of dependence structures between random variables. Some of the earliest characterizations of multivariate extremes were inspired by consideration of the vector of normalized componentwise maxima. Let with , and consider a sample , , of independent copies of . For a fixed , defining , the extremal types theorem tells us that if we can find sequences such that converges to a non-degenerate distribution, then this is the generalized extreme value distribution. Moreover, the sequence , , i.e., is of the same order as the quantile. A natural multivariate extension is then to examine the distribution of the vector of componentwise maxima, . This is intrinsically tied up with the theory of multivariate regular variation, because it leads to examination of the joint behaviour of the random vector when all components are growing at the rate determined by their quantile. If all components were marginally standardized to focus only on the dependence, then all normalizations would be the same.
In normalizing all components by the same amount, we only consider the dependence structure in a single “direction” in . In some cases this turns out to provide a rich description of the extremal dependence: if the limiting distribution of componentwise maxima does not have independent components, then an infinite variety of dependence structures are possible, indexed by a moment-constrained measure on a dimensional unit sphere. However, when the limiting dependence structure is independence, or even when some pairs are independent, this representation fails to discriminate between qualitatively different underlying dependence structures. While consideration of componentwise maxima is not necessarily a common applied methodology these days, the legacy of this approach persists: statistical methods that assume multivariate regular variation, such as multivariate generalized Pareto distributions, are still very popular in practice (e.g., Engelke and Hitz,, 2020). A recent theoretical treatment of multivariate regular variation is given in Kulik and Soulier, (2020).
Various other representations for multivariate extremes have emerged that analyze the structure of the dependence when some variables are growing at different rates to others. These include the so-called conditional extreme value model (Heffernan and Tawn,, 2004; Heffernan and Resnick,, 2007), whereby the components of are normalized according to how they grow with a single component, say. Related work examines behaviour in relation to an arbitrary linear functional of (Balkema and Embrechts,, 2007). The conditional representation allows consideration of those regions where some or all variables grow at a lesser rate than if this is the region where the observations tend to lie. In other words, the limit theory is suited to giving a more detailed description of a broader range of underlying dependence structures. Another representation that explicitly considers different growth rates is that of Wadsworth and Tawn, (2013). They focus particularly on characterizing joint survival probabilities under certain classes of inhomogeneous normalization; this was found to reveal additional structure that is not evident when applying a common scaling. More recently, Simpson et al., (2020) have examined certain types of unequal scaling with a view to classifying the strength of dependence in any sub group of variables of .
An alternative approach to adding detail to the extremal dependence structure focuses not on different scaling orders, but rather on second order effects when applying a common scaling. This idea was introduced by Ledford and Tawn, (1996), and falls under the broader umbrella of hidden regular variation (Resnick,, 2002). Various manuscripts have focused on analogizing concepts from standard multivariate regular variation to the case of hidden regular variation (e.g., Ramos and Ledford,, 2009), but this approach still only focuses on a restricted region of the multivariate space where all variables are large simultaneously. For this reason, although higher-dimensional analogues exist, they are often not practically useful for dimension .
Another manner of examining the extremal behaviour of is to consider normalizing the variables such that they converge onto a limit set (e.g., Davis et al.,, 1988; Balkema and Nolde,, 2010), described by a so-called gauge function. This requires light-tailed margins, which may occur naturally or through a transformation. If the margins are standardized to a common light-tailed form, then the shape of the limit set is revealing about the extremal dependence structure of the random variables, exposing in which directions we expect to see more observations.
Although various connections have been made in the literature, many of these representations remain somewhat disjointed. For example, there is no obvious connection between the conditional extremes methodology and the representation of Ledford and Tawn, (1996, 1997), and whilst Wadsworth and Tawn, (2013) provided a modest connection to conditional extremes, many open questions remain. In this paper we reveal several hitherto unknown connections that can be made through the shape of the limit set and its corresponding gauge function, when it exists, and provide a step towards unifying the treatment of multivariate extremes.
We next provide further elaboration and definition of the different representations of extremal dependence. For some definitions, it is convenient to have a standardized marginal form; we focus mainly on standard Pareto or standard exponential margins with notation and , respectively. As mentioned above, working with common margins highlights dependence features. In Section 2 we recall the formulations of various representations for multivariate extremes, and provide a thorough background to the concepts of limit sets and their gauge functions, proving a useful new result on marginalization. Section 3 details connections linking conditional extremes, the representation of Wadsworth and Tawn, (2013), Ledford and Tawn, (1996), and that of Simpson et al., (2020). We provide severalillustrative examples in Section 4 and conclude in Section 5.
2 Background and definitions
2.1 Multivariate regular variation
A measurable function is regularly varying at infinity (respectively, zero) with index if, for any , , as (or, respectively, ). We write or , omitting the superscript in generic cases. If , then it is called slowly varying.
The random vector is multivariate regularly varying on the cone , with index , if for any relatively compact ,
| (2.1) |
with , , and the limit measure homogeneous of order ; see, e.g., Resnick, (2007), Section 6.1.4. The parts of where places mass reveal the broad scale extremal dependence structure of . Specifically, note that we have the disjoint union , where
| (2.2) |
and the union is over all possible subsets , excluding the empty set. If then the variables indexed by can take their most extreme values simultaneously, whilst those indexed by are non-extreme.
The definition of multivariate regular variation in equation (2.1) requires tail equivalence of the margins. In practice, it is rare to find variables that have regularly varying tails with common indices, and multivariate regular variation is a dependence assumption placed on standardized variables. Without loss of generality, therefore, we henceforth consider with standard Pareto(1) margins in which case and .
Frequently, the set in (2.1) is taken as , leading to the exponent function,
| (2.3) |
Suppose that derivatives of exist almost everywhere; this is the case for popular parametric models, such as the multivariate logistic (Gumbel,, 1960), Hüsler–Reiss (Hüsler and Reiss,, 1989) and asymmetric logistic distributions (Tawn,, 1990). Let . If the quantity is non-zero, then the group of variables indexed by places mass on (Coles and Tawn,, 1991).
Multivariate regular variation is often phrased in terms of a radial-angular decomposition. If (2.1) holds, then for ,
where and is any norm. That is, the radial variable and the angular variable are independent in the limit, with Pareto(1) and following distribution . The support of the so-called spectral measure can also be partitioned in a similar manner to . Letting
we have . The measure places mass on if and only if places mass on .
2.2 Hidden regular variation
Hidden regular variation arises when: (i) there is multivariate regular variation on a cone (say ), but the mass concentrates on a subcone , and (ii) there is multivariate regular variation on the subcone with a scaling function of smaller order than on the full cone. Suppose that (2.1) holds, and concentrates on , in the sense that . For measurable , we have hidden regular variation on if
| (2.4) |
with and the limit measure homogeneous of order (Resnick,, 2007, Section 9.4.1).
The most common cone to consider is . This leads to the residual tail dependence coefficient, (Ledford and Tawn,, 1996). That is, suppose that (2.4) holds on , then the regular variation index . The residual tail dependence coefficient for the subset is found through considering cones of the form
for which .
2.3 Different scaling orders
2.3.1 Coefficients
Simpson et al., (2020) sought to examine the extremal dependence structure of a random vector through determination of the cones for which . Direct consideration of (hidden) regular variation conditions on these cones is impeded by the fact that for all , , since no components of are equal to zero for . Simpson et al., (2020) circumvent this issue by assuming that if , then there exists such that
| (2.5) |
As such, under normalization by , components of the random vector indexed by remain positive, whereas those indexed by concentrate at zero. Note that if assumption (2.5) holds for some then it also holds for all . Simpson et al., (2020) expanded assumption (2.5) to
| (2.6) |
where (2.6) is viewed as a function of , and the regular variation coefficients . For a fixed , implies either that , or that , but that is too small for (2.5) to hold; see Simpson et al., (2020) for further details. Considering the coefficients over all and provides information about the cones on which concentrates.
2.3.2 Angular dependence function
Wadsworth and Tawn, (2013) detailed a representation for the tail of where the scaling functions were of different order in each component. They focussed principally on a sequence of univariate regular variation conditions, characterizing
| (2.7) |
where for each and . Equivalently, . When all components of are equal to , connection with hidden regular variation on the cone is restored, and we have . When the subcone of is charged with mass in limit (2.1), then . One can equally focus on sub-vectors indexed by to define for in a -dimensional simplex; we continue to have and implies .
2.4 Conditional extremes
For conditional extreme value theory (Heffernan and Tawn,, 2004; Heffernan and Resnick,, 2007), we focus on . Let represent the vector without the th component. The basic assumption is that there exist functions , and a non-degenerate distribution on with no mass at infinity, such that
| (2.8) |
Typically, such assumptions are made for each . The normalization functions satisfy some regularity conditions detailed in Heffernan and Resnick, (2007), but as Heffernan and Resnick, (2007) only standardize the marginal distribution of the conditioning variable (i.e, ), allowing different margins in other variables, these conditions do not strongly characterize the functions and as used in (2.8).
When joint densities exist, application of L’Hôpital’s rule gives that convergence (2.8) is equivalent to
We will further assume convergence of the full joint density
| (2.9) |
which is the practical assumption needed for undertaking likelihood-based statistical inference using this model.
Connected to this approach is work in Balkema and Embrechts, (2007), who study asymptotic behaviour of a suitably normalized random vector conditional on lying in , where is a half-space not containing the origin and . The distribution of is assumed to have a light-tailed density whose level sets are homothetic, convex and have a smooth boundary. In this setting, with taken to be the vertical half-space , the limit is the so-called Gauss-exponential distribution with density , , .
2.5 Limit sets
2.5.1 Background
Let be independent and identically distributed random vectors in . A random set represents a scaled -point sample cloud. We consider situations in which there exists a scaling sequence , such that scaled sample clouds converges onto a deterministic set, containing at least two points. Figure 1 illustrates examples of sample clouds for which a limit set exists. Let denote the family of non-empty compact subsets of , and denote the Hausdorff distance between two sets (Matheron,, 1975). A sequence of random sets in converges in probability onto a limit set if for . The following result gives convenient criteria for showing convergence in probability onto a limit set; see Balkema et al., (2010).
Proposition 1.
Random samples on scaled by converge in probability onto a deterministic set in if and only if
-
(i)
for any open set containing ;
-
(ii)
for all and any , where is the Euclidean unit ball.

Limit sets under various assumptions on the underlying distribution have been derived in Geffroy, (1958, 1959); Fisher, (1969); Davis et al., (1988); Balkema et al., (2010). Kinoshita and Resnick, (1991) give a complete characterization of the possible limit sets as well as describe the class of distribution functions for which sample clouds can be scaled to converge (almost surely) onto a limit set. Furthermore, convergence in probability onto a limit set is implied by the tail large deviation principle studied in de Valk, 2016b ; de Valk, 2016a .
Kinoshita and Resnick, (1991) showed that if sample clouds can be scaled to converge onto a limit set almost surely, then the limit set is compact and star-shaped. A set in is star-shaped if implies for all . For a set , if the line segment , is contained in the interior of for every , then can be characterized by a continuous gauge function:
A gauge function satisfies homogeneity: for all , and the set can be recovered from its gauge function via Examples of a gauge function include a norm on , in which case is the unit ball in that norm.
The shape of the limit set conveys information about extremal dependence properties of the underlying distribution. In particular, Balkema and Nolde, (2010) make a connection between the shape of the limit set and asymptotic independence, whilst Nolde, (2014) links its shape to the coefficient of residual tail dependence. We emphasize that the shape of the limit set depends on the choice of marginal distributions, as well as dependence structure. For example, if the components of are independent with common marginal distribution, then if the margins are exponential; if the margins are Laplace; and if the margins are Weibull with shape . In contrast, if the margins are exponential but takes the latter form, this implies some dependence between the components.
2.5.2 Conditions for convergence onto a limit set
Proposition 1 provides necessary and sufficient conditions for convergence onto the limit set , but these conditions are not particularly helpful for determining the form of in practice.
In the following proposition, we state a criterion in terms of the joint probability density for convergence of suitably scaled random samples onto a limit set. This result is an adaptation of Proposition 3.7 in Balkema and Nolde, (2010). The marginal tails of the underlying distribution are assumed to be asymptotically equal to a von Mises function. A function of the form is said to be a von Mises function if is a function with a positive derivative such that for . This condition on the margins says that they are light-tailed and lie in the maximum domain of attraction of the Gumbel distribution, i.e., for a random sample from such a univariate distribution, coordinate-wise maxima can be normalized to converge weakly to the Gumbel distribution (Resnick,, 1987, Proposition 1.1).
Proposition 2.
Let the random vector on have marginal distribution functions asymptotically equal to a von Mises function: for , () and a joint probability density satisfying:
| (2.10) |
for a continuous function on , which is positive outside a bounded set. Then a sequence of scaled random samples from converges in probability onto a limit set with . The scaling sequence can be chosen as . Moreover, .
Proof The mean measure of is given by with intensity . We show the convergence of that mean measure onto , implying convergence of scaled samples ; see Balkema et al., (2010), Proposition 2.3. By (2.10) and the choice of , we have
| (2.11) |
Continuous convergence in (2.11) with continuous implies uniform convergence on compact sets. Hence, is bounded on compact sets. For , we have on the interior of and on the complement of . Furthermore, applying L’Hôpital’s rule and Lemma 1.2(a) in Resnick, (1987), we have
Combining these results, we see that , which diverges to on the interior of and to outside of . This implies that
giving convergence (in probability) of onto limit set .
The form of the margins with gives ; i.e.,
This choice of implies that the coordinate-wise maxima scaled by converge in probability to 1 (Gnedenko, (1943); de Haan, (1970)), so that
Remark 1.
Condition (2.10) implies that is multivariate regularly varying on . Such densities are referred to as Weibull-like. The limit function is homogeneous of some positive order : for all . The gauge function of the limit set can thus be obtained from by setting .
When the margins are standard exponential, . Hence, for the random vector with a Lebesgue density on , condition (2.10) is equivalent to
| (2.12) |
with the limit function equal to the gauge function .
Whilst the assumption of a Lebesgue density might appear strict, it is a common feature in statistical practice of extreme value analysis. The assumption permits simple elucidation of the connection between different representations for multivariate extremes. Furthermore, many statistical models, including elliptical distributions and vine copulas (Joe,, 1996; Bedford and Cooke,, 2001, 2002), are specified most readily in terms of their densities.
Convergence at the density level such as in (2.10) may not always hold. The condition requires the limit function and hence the gauge function of the limit set to be continuous, excluding limit sets for which rays from the origin cross the boundary in more than one point. We provide an example of such a situation in Section 4; see Example 4.1.2. A less restrictive set of sufficient conditions for convergence of sample clouds onto a limit set can be obtained using the survival function. The following proposition is Theorem 2.1 in Davis et al., (1988), with a minor reformulation in terms of scaling.
Proposition 3.
Suppose that the random vector has support on , the margins are asymptotically equal to a von Mises function: for (), and the joint survival function satisfies
| (2.13) |
Further assume that is strictly increasing, such that if and . Then for satisfying , the sample cloud converges onto .
2.5.3 Marginalization
When , a key question is the marginalization from dimension to dimension . We prove below that, as long as the minimum over each coordinate of is well-defined, then the gauge function determining the limit set in dimensions is found through minimizing over the coordinates to be marginalized.
A continuous map from the vector space into the vector space is positive-homogeneous if for all and all . If , the map is determined by the coordinate maps , and in this case it suffices that these maps are continuous and positive-homogeneous.
Convergence onto a limit set is preserved under linear transformations (e.g., Lemma 4.1 in Nolde, (2014)) and more generally under continuous positive-homogeneous maps with the same scaling sequences (Theorem 1.9 in Balkema and Nolde, (2020)). A consequence of the latter result, referred to as the Mapping Theorem, is that projections of sample clouds onto lower-dimensional sub-spaces also converge onto a limit set.
Proposition 4.
Let be an -point sample cloud from a distribution of random vector on . Assume converges in probability, as , onto a limit set for a gauge function . Let denote an -dimensional marginal of , where is an index set with . Sample clouds from also converge, with the same scaling, and the limit set , where is a projection map onto the coordinates of and
Proof Consider the bivariate case first with . Sample clouds from converge onto the limit set , which is the projection of onto the -coordinate axis, by the Mapping Theorem. The projection is determined by the tangent to the level curve orthogonal to the -coordinate axis. Similarly, level curves of the gauge function of the set are determined by tangents to the level curves for orthogonal to the -coordinate axis. These projections correspond to values which minimize . Sequentially minimizing over each of the coordinates to be marginalized gives the result.
An illustration of this result is given in Section 4.2.
3 Linking representations for extremes to the limit set
For simplicity of presentation, in what follows we standardize to consider exponential margins for the light-tailed case. This choice is convenient when there is positive association in the extremes, but hides structure related to negative dependence. We comment further on this case in Section 5. Owing to the standardized marginals, it makes sense to refer to the limit set, rather than a limit set.
Connections between multivariate and hidden regular variation are well established, with the latter requiring the former for proper definition. Some connection between regular variation and conditional extremes was made in Heffernan and Resnick, (2007) and Das and Resnick, (2011), although they did not specify to exponential-tailed margins. The shape of the limit set has been linked to the asymptotic (in)dependence structure of a random vector (Balkema and Nolde,, 2010, 2012). Asymptotic independence is related to the position of mass from convergence (2.1) on , but regular variation and the existence of a limit set in suitable margins are different conditions and one need not imply the other. Nolde, (2014) links the limit set to the coefficient of residual tail dependence, .
In this section we present some new connections between the shape of the limit set, when it exists, and normalizing functions in conditional extreme value theory, the residual tail dependence coefficient, the function and the coefficients .
3.1 Conditional extremes
For the conditional extreme value model, the form of the normalizing functions is determined by the pairwise dependencies between , . The two-dimensional marginalization of any -dimensional gauge function is given by Proposition 4, and we simply denote this by here.
Proposition 5.
Suppose that for convergence (2.9) and assumption (2.12) hold, where the domain of includes . Define , . Then
-
(i)
, .
-
(ii)
Suppose that , with or , and with either , or . For , if , then ; similarly if , then .
-
(iii)
If there are multiple values satisfying , then is the maximum such , and likewise for .
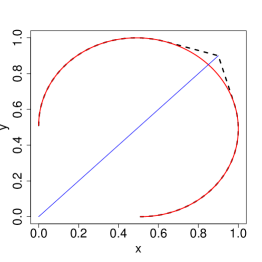
Before the proof of Proposition 5, we give some geometric intuition. Figure 2 presents several examples of the unit level set of possible gauge functions, illustrating the shape of the limit set, for two-dimensional random vectors with exponential margins. On each figure, the slope of the red line indicates the value of ; i.e., the equation of the red line is . Intuitively, conditional extreme value theory poses the question: “given that variable is growing, how does variable grow as a function of ?”. We can now see that this is neatly described by the shape of the limit set: to first order, the values of occurring with large are determined by the direction for which is growing at its maximum rate. The necessity of a scale normalization in the conditional extreme value limit depends on the local curvature and particularly the rate at which approaches 1 as . For cases (i), (iv), (v) and (vi) of Figure 2, the function approaches zero linearly in : as a consequence . For case (ii) the order of decay is and so , whilst for (iii) the order is so .
The class of distributions represented by gauge function (vi) (bottom left) can be thought of as those arising from a mixture of distributions with gauge functions (i) and (iii), up to differences in parameter values. In such an example, there are two normalizations that would lead to a non-degenerate limit in (2.8), but ruling out mass at infinity produces the unique choice , . If instead we chose to rule out mass at , then we would have and .
Proof of Proposition 5.
In all cases we just prove one statement as the other follows analogously.
(i) By assumption (2.12), have a joint density and so conditional extremes convergence (2.9) can be expressed as
with a density. Taking logs, we have
| (3.14) |
Now use assumption (2.12) with . That is,
| (3.15) |
with . As the support of includes , for all , and combining (3.14) and (3.15) we have
| (3.16) |
Suppose that . Then , and taking in (3.16) leads to for any . But since the coordinatewise supremum of is , which would entail . No such upper bound applies, so we conclude , i.e., . Now taking limits in (3.16) leads to
(ii) Let , . We also have from (3.16) , so that the function is a solution to the equation
| (3.17) |
Equation (3.17) admits a solution if is regularly varying at infinity. A rearrangement provides that
if is regularly varying then , so that using the fact that or , combined with , yields . We now argue that such a solution is unique in this context. We know that the normalization functions lead to a non-degenerate distribution that places no mass at infinity. By the convergence to types theorem (Leadbetter et al., (1983, p.7), see also part (iii) of this proof), any other function leading to a non-degenerate limit with no mass at infinity must satisfy , , for some , so that also. Finally, setting gives .
(iii) Suppose that
where neither nor has mass at . Then by the convergence to types theorem, and , for some , and . As such, . We conclude that if there was a non-degenerate limit for which then must place mass at ; since by assumption it does not, then is the maximum value satisfying .


For distributions whose sample clouds converge onto a limit set described by a gauge function with piecewise-continuous partial derivatives possessing finite left and right limits, further detail can be given about .
Proposition 6.
Let be a limit set whose gauge function has piecewise-continuous partial derivatives , possessing finite left and right limits, and for which the conditions of Proposition 5 hold. Then (i) if ; (ii) if . Further, if then , so that . Analogous statements hold for .
Proof.
Consider the partial derivative
as . We note , such that , . Since this is regularly varying with index by assumption, implies , hence , and implies , so (i) and (ii) follow. If is differentiable at the point , then since , and (i) holds. Otherwise, in a neighbourhood of , we can express
where the homogeneous functions and have continuous partial derivatives at . Euler’s homogeneous function theorem gives so that for , , and hence (i) or (ii) hold.
We remark on links with existing work on conditional extreme value limits for variables with a polar-type representation, whereby for and constrained by some functional dependence. Abdous et al., (2005), Fougères and Soulier, (2010) and Seifert, (2014) consider a type of conditional extremes limit for certain such polar constructions, where in the light-tailed case, the shape of the constraint on feeds into the normalization and limit distribution. However, limit sets are sensitive to marginal choice, and because the above papers do not consider conditional extreme value limits in standardized exponential-tailed margins, further connections are limited.
3.2 Different scaling orders:
We now focus on the connection with , as defined in Section 2.3. When , this yields the link with the residual tail dependence coefficient , which has already been considered in Nolde, (2014). Define the region
Proposition 7.
Suppose that the sample cloud converges onto a limit set , and that for each , equation (2.7) holds. Then
where
Corollary 1 (Nolde, (2014)).
Proof of Proposition 7.
The proof follows very similar lines to Proposition 2.1 of Nolde, (2014). Firstly note that , where is a 1-homogeneous function defined by
As a consequence,
| (3.18) |
Without loss of generality, suppose that , so that . Because of the convergence of the sample cloud onto , we have by Proposition 1 that for any and large enough
implying . Therefore , and combining with equation (3.18) gives the result.

The blue lines in Figure 2 represent , depicting the unit level set of , and the dots illustrate the value of . We can now see clearly how, in two dimensions, different dependence features are picked out by the conditional extremes representation and hidden regular variation based on . Often, values of or are associated with positive extremal dependence. From example (iv) of Figure 2 (bottom right), we observe but . We have that does grow with (and vice versa) but only at a specific rate. On the other hand, joint extremes, where take similar values, are rare, occurring less frequently than under independence.
From example (iv) we can also see that one of the conclusions following Proposition 2.1 in Nolde, (2014) is not true: the point need not lie on the boundary of , meaning that we do not necessarily have , although we can deduce the bound . Similarly, there are occasions when , implying , but clearly this is not always true. In Proposition 8, we resolve when this is the case by representing in terms of .
Define to be the boundary of the region , i.e.,
Proposition 8.
Assume the conditions of Proposition 7. Then
From Proposition 8, we observe that if , i.e., the vertex of the set . The proof of Proposition 8 is deferred until after Proposition 11, for which the proof is very similar.
Remark 2.
We note that .
3.3 Coefficients
3.3.1 Connections to limit set
In two dimensions, the coefficients and provide a somewhat complementary concept to the function . Rather than considering the impact of the limit set on the shape of the function defined by both variables exceeding thresholds growing at different rates, we are considering what is occurring when one variable exceeds a growing threshold and the other is upper bounded by a certain lesser growth rate. The left and centre panels in Figure 4 provide an illustration of and in two dimensions.
Define the region , so that, for example, when , .
Proposition 9.
Suppose that the sample cloud converges onto a limit set , and that the assumption in equation (2.6) holds. For , and ,
The coefficient , and does not depend on .
Proof.
The coefficient describes the order of hidden regular variation on the cone , which is precisely the same as . For , , we consider the function of
Take . Then
| (3.19) |
where the denominator in (3.19) can be expressed . As in the proof of Proposition 7, the convergence onto the limit set and exponential margins enables us to conclude that , and hence . Combining with (3.19) gives .
In the two-dimensional case, it is possible to express simply in terms of the gauge function. For higher dimensions, we refer to Proposition 11.
Proposition 10.
Assume the conditions of Proposition 9. When , and .
Proof.
For , the points lie on the curve . The value is the maximum value of for , hence . A symmetric argument applies to .
The right panel of Figure 4 provides an illustration: in blue the value of is such that ; in red the value of is such that . Further detail on this example is given in Section 4.1.6.


The question arises: does Proposition 10 still hold for ? Let denote the gauge function for the limit set of . By Proposition 4, we know that . As such, equality will hold if . Note that the dimension does indeed play a key role here: when looking at for a -dimensional problem, we are looking at the situation where coordinates are upper bounded by a growth rate determined by . In contrast, when marginalizing and looking at for a 2-dimensional problem, the coordinates that we have marginalized over are unrestricted and so can represent small or large values. As such, the answer to our question is negative in general.
Proposition 11 details the precise value of in terms of for any dimension . In a similar spirit to Section 3.2, define the boundary of the region as
where
so, for example, when ,
For , , and .
Proposition 11.
Assume the conditions of Proposition 9. For any ,
Proof.
The vertex of the region , or its boundary , which has components 1 on the coordinates indexed by , and in the other coordinates, lies on . The region , and because the coordinatewise supremum of is , the boundary of intersects with . Now consider scaling the region by until it intersects with . The point of intersection must lie on the boundary of the scaled region , i.e., on , and on the boundary of , . Therefore, there exists such that , which is rearranged to give . Furthermore, we must have that such a point , otherwise there exists some such that and so , meaning that . We conclude that , so .
To show that , let , , and let . Then , but , so and hence as .
When and , we note that , which gives the equality in Proposition 10.
3.3.2 Estimation of coefficients
When , equation (2.6) yields , implying that can be estimated as the reciprocal of the tail index of the so-called structure variable . This is identical to estimating the residual tail dependence coefficient , for which the Hill estimator is commonly employed. However, for with , we assume , but this representation does not lend itself immediately to an estimation strategy, as there is no longer a simple structure variable for which is the tail index.
In order to allow estimation, Simpson et al., (2020) considered , but they only offered empirical evidence that the assumed index of regular variation for this probability was the same as in equation (2.6). We now prove this to be the case.
Define , and to be its boundary, where
and we specifically note the equality .
Proposition 12.
Assume the conditions of Proposition 9. If , and then .
4 Examples
We illustrate several of the findings of Section 3 with some concrete examples. In Section 4.1 we focus on the intuitive and geometrically simple case ; in Section 4.2, we examine some three-dimensional examples for which visualization is still possible but more intricate.
Proposition 2 implies that on , the same limit set as in exponential margins will arise for any marginal choice with , , provided is a von Mises function. In some of the examples below, it is convenient to establish a limit set and its gauge function using this observation rather than transforming to exactly exponential margins.
Models with convenient dependence properties are often constructed through judicious combinations of random vectors with known dependence structures; see, for example, Engelke et al., (2019) for a detailed study of so-called random scale or random location constructions. In Section 4.3, we use our results to elucidate the shape of the limit set when independent exponential-tailed variables are mixed additively. The spatial dependence model of Huser and Wadsworth, (2019) provides a case study.
4.1 Examples and illustrations for
All of the examples considered in this section are symmetric, so, for the conditional extremes representation and coefficients , we only consider one case, omitting the subscript on the quantities and . Table LABEL:tab:bivariate summarizes the dependence information from various bivariate distributions described in Sections 4.1.1–4.1.5.
4.1.1 Meta-Gaussian distribution: nonnegative correlation
Starting with a Gaussian bivariate random vector and transforming its margins to standard exponential, we obtain a meta-Gaussian distribution with exponential margins. Such a distribution inherits the copula of the Gaussian distribution. For simplicity, we consider the case where the underlying Gaussian random vector has standard normal components with correlation .
Then, for , the joint probability density satisfies:
so that . The convergence in (2.10) holds on and hence the limit set exists and is given by . This is example (ii) in Figure 2.
Conditional extremes:
Setting leads to , i.e., . For we have , hence .
Function :
Coefficients :
4.1.2 Meta-Gaussian distribution: negative correlation
When , Proposition 2 cannot be applied as the continuous convergence condition (2.10) does not hold along the axes. Hence, we only gain a partial specification, when , through this route. Instead, here we can apply Proposition 3 since the limit function in (2.13) satisfies the monotonicity condition given immediately thereafter. This limit function is given by

Figure 5 illustrates the limit sets for the three cases and . In the latter case, large values of one variable tend to occur with small values of the other, which causes the limit set to include lines along the axes and the function is not continuous. Such difficulties can be alleviated by consideration of Laplace margins for distributions displaying negative dependence, which is discussed further in Section 5.
4.1.3 Logistic generalized Pareto copula
The logistic generalized Pareto distribution with conditionally exponential margins (, ) and dependence parameter satisfies
so the gauge function is . This form of gauge function is found throughout several symmetric asymptotically dependent examples, such as those distributions whose spectral measure places no mass on 0 and 1 and possess densities that are regularly varying at the endpoints 0, 1 such that , . This is example (i) in Figure 2.
Conditional extremes:
Solving for , we obtain , whilst , hence .
Function :
We have that , so and . Therefore .
Coefficients :
. This matches the value calculated in the Supplementary Material of Simpson et al., (2020).
4.1.4 Inverted extreme value distribution
The inverted extreme value copula is the joint lower tail of an extreme value copula, translated to be the joint upper tail. That is, if have an extreme value copula with uniform margins, then have an inverted extreme value copula. In two dimensions, its density in exponential margins may be expressed as
where , for the exponent function in (2.3), is the 1-homogeneous stable tail dependence function (e.g., Beirlant et al.,, 2004, Ch.8) of the corresponding extreme value distribution, and , etc. We thus have
so .
Conditional extremes:
Stable tail dependence functions always satisfy and so . Hence, if is the only solution to , then . An example of this is given by the inverted extreme value logistic copula, whereby . This is example (iii) of Figure 2, for which we have and .
Papastathopoulos and Tawn, (2016) study conditional extreme value limits for general classes of inverted extreme value distributions. One case they consider is where the spectral measure defining the distribution in two dimensions has support on a sub-interval . We give a simple example to illustrate their findings in this context. Let , and . Then
In this case, for all , so by Proposition 5 (iii), . Following a Taylor expansion in which linear terms in vanish, we have , so . Papastathopoulos and Tawn, (2016) show that for this distribution, and .
A further interesting example studied by Papastathopoulos and Tawn, (2016) is that of the inverted Hüsler–Reiss distribution, for which
The unique solution to is (obtained as a limit) and is rapidly varying, i.e., , corresponding to . The forms of the normalization functions detailed in Papastathopoulos and Tawn, (2016) are
for which and .
Function :
Since , and is a convex function satisfying , . Hence, in this case.
Coefficients :
Since , we have for all .
4.1.5 Hüsler–Reiss generalized Pareto copula
The bivariate Hüsler–Reiss generalized Pareto distribution with conditionally exponential margins has density
from which it can be seen that
While Proposition 2 cannot be applied here due to the lack of uniform convergence, the form of the limit set is nonetheless , which is the same limit set as arises under perfect dependence. This can be explained by the construction of the Hüsler–Reiss model, which has a dependence structure asymptotically equivalent to that of , where is independent of . The marginal distributions of such a construction satisfy , so that with the sample cloud constructed by taking , the contribution from the Gaussian component converges in probability to zero, leaving only the contribution from the common term .
Conditional extremes:
We have for , but cannot use Proposition 5 to determine since .
Function :
The quantity and so , and .
Coefficients :
for and for . This implies that , i.e., is rapidly varying.
4.1.6 Density defined by
If is a gauge function describing a limit set , then is a density (see Balkema and Nolde,, 2010). In general, except for the case of , the margins are not exactly exponential, and may be heavier than exponential, for example in the case .
We consider the density defined by , : this is example (vi) in Figure 2, and illustrated in Figure 4. The marginal density is given by
Conditional extremes:
Solving for , we obtain , whilst , hence .
Function :
If , then , or and ; otherwise, or , and . As such
and the residual tail dependence coefficient .
Coefficients :
. Therefore, if , else .
4.1.7 Boundary case between asymptotic dependence and independence
We give two examples of distributions whose limit set is described by the gauge function . The first of these displays asymptotic dependence, i.e., , for as in Section 2.1, while the second displays asymptotic independence. In both cases, , and for all . The conditional extremes convergences are however rather different, and need to be derived carefully as some of the hypotheses in Proposition 5 fail.
Example 1: asymptotic dependence
We consider a particular instance of a bivariate extreme value distribution with spectral measure density . The density is regularly varying at 0 and 1 with index , but its integral is finite. For the exponent function as in (2.3), with , so
and therefore
For the corresponding multivariate max-stable or generalized Pareto distribution with Gumbel/exponential margins, the gauge function is determined by
and . That is, .
We have for all , so is the maximum such value, and , giving . Taking , , we see
The limit is in fact exact for all here because of the multivariate generalized Pareto form.
Example 2: asymptotic independence
Consider the density , . The marginal densities are , which is a mixture of and densities, and is heavier tailed than standard exponential. We firstly verify asymptotic independence by examining . The joint survival function , while . Hence .
Again, Proposition 2 ensures that the limit set with gauge function would also arise in exponential margins. However, we make the transformation explicitly here to study the conditional extremes convergence on the same scale as previously. The change to exponential margins entails , leading to the density
from which we can also see .
If we were to suppose that a conditional extremes limit with support including exists, then Proposition 5 (i) and (iii) would mean , while , so that Proposition 5 (ii) would give . However, for positive , consideration of yields no possibilities for a non-degenerate limit. Nonetheless, for we can take leading to
i.e., a uniform limit distribution on .
We comment that the results of Proposition 5 do indeed focus predominantly on the positive end of the support for limit distributions, but most known examples of conditional limits have support including . A natural next step is to consider the implications relating to negative support. We particularly note the possibility that the order of regular variation of the two functions and need not be equal, though for each of our examples where both functions are regularly varying, . If , it seems likely that a limit distribution with positive support only would arise, and vice versa when .
4.2 Examples and illustrations for
In this section we give two examples, focusing on issues that arise for .
4.2.1 Gaussian copula
The general form of the gauge function for a meta-Gaussian distribution with standard exponential margins and correlation matrix with non-negative entries is
Figure 6 displays the level set when the Gaussian correlations in are . The red dots on the level set are the points , and for . The figure also provides an illustration of for and : in each case the light blue line from the origin is , , whilst the pink lines trace out the boundary and . We see that when (left panel), , i.e., . However, when , , for , so . We note that the same value of applies for any : for this example, when , .
The reason that for sufficiently large is because in this case , meaning that the two-dimensional marginalization , and we further have that , so . In Section 4.2.2 we will illustrate a gauge function for which , and consequently for all .
The right panel of Figure 6 illustrates for and . When , the boundary already touches , and so . In this example, for any . As such, as illustrated in the figure. We comment that if we had marginalized over , and were looking at for the variables , then we would have for any . This provides an illustration of the dimensionality of the problem interacting with , and is again related to the point at which the minimum point defining the lower-dimensional gauge function occurs.


4.2.2 Vine copula
Three-dimensional vine copulas are specified by three bivariate copulas: two in the “base layer”, giving the dependence between, e.g., and and a further copula specifying the dependence between and . Here we take the base copulas to be independence for , and the inverted Clayton copula with parameter for . The final copula is taken as inverted Clayton with parameter . The gauge function that arises in exponential margins is
| (4.20) |
Figure 7 displays the level set . In this figure we also give an illustration of a case where : in particular, for this example . The purple lines represent the boundary of the region , while the green lines represent the boundary of the region . Theorem 1 of Simpson et al., (2020) tells us that , where . Therefore guarantees that .
We also illustrate Proposition 4, minimizing (4.2.2) over . If then the minimum over occurs by setting and is equal to . If then owing to the final term we need to consider the cases . In both cases, the mimimum is attained at , and is equal to . As such, . This result is as expected since the bivariate margins of vine copulas that are directly specified in the base layer are equal to the specified copula: in this case, independence.

4.3 Mixing independent vectors
Here we exploit the results from previous sections to consider what happens when independent exponential random vectors are additively mixed such that the resulting vector still has exponential type tails. We consider as a case study the spatial model of Huser and Wadsworth, (2019), which following a reparameterization can be expressed
| (4.21) |
where is independent of the spatial process , which also possesses unit exponential margins and is asymptotically independent at all spatial lags . The process is assumed to possess hidden regular variation, with residual tail dependence coefficient satisfying for all . The resulting process is asymptotically independent for and asymptotically dependent for ; see also Engelke et al., (2019) for related results.
When , . In this case, Huser and Wadsworth, (2019) show that the residual tail dependence coefficient for the process is given by
| (4.22) |
That is, the strength of the extremal dependence as measured by the residual tail dependence coefficient is increasing in for . In contrast, Wadsworth and Tawn, (2019) showed that under mild conditions, the process (4.21) has the same conditional extremes normalization as the process , with identical limit distribution when the scale normalizations as . Here, the subscript alludes to the fact that the conditioning event in (2.8) is and we study the normalization at some other arbitrary location . In combination, we see that the results of Huser and Wadsworth, (2019) and Wadsworth and Tawn, (2019) suggest that the addition of the variable to affects the extremal dependence of differently for different extreme value representations. We elucidate these results further in the context of the limit sets and their gauge functions.
Let us suppose that has unit exponential margins, density , and gauge function , and is independent of , which has unit exponential margins, density , and gauge function . Let be the concatenation of these vectors. Then, since its density , it is clear that has unit exponential margins and gauge function .
Now consider the linear transformation of to
where is the matrix describing this transformation: the first rows have and in the th and th positions, respectively, for , while the second rows have in the th position for . All other entries are zero. The matrix has the same configuration but with in place of . By Lemma 4.1 of Nolde, (2014), the normalized sample cloud converges onto the set , where , so . Consequently, the gauge function of is , i.e., , for .
Next we apply Proposition 4 to the vector , marginalizing over the last coordinates, which are equal to . This leaves us with the gauge function of , denoted , and given by
To illustrate the results of Huser and Wadsworth, (2019) and Wadsworth and Tawn, (2019) concerning model (4.21), we need to take , i.e., perfect dependence. Although such a vector does not have a -dimensional Lebesgue density, convergence of the sample cloud based on the univariate random variable onto the unit interval implies that the limit set is . Such a set can be described by the gauge function
As such, in this case,
Residual tail dependence
To find the residual tail dependence coefficient , we require
For fixed , consider , where . As such
Recalling that and , this yields (4.22).
Conditional extremes
For the conditional extremes normalization, we now let and denote two-dimensional gauge functions. Suppose that are such that and . We have
| (4.23) |
Suppose that the right hand side of (4.23) is minimized at , i.e., . Because and , this yields 1=, therefore we must have for . Consequently, .
For the scale normalization, let . Then
| (4.24) |
and because , if then for sufficiently small
| (4.25) |
Combining inequalities (4.24) and (4.25) shows that for
| (4.26) |
meaning in particular that as . To examine the minimizing sequence in further detail, we consider the derivative of , assuming that has piecewise continuous partial derivatives possessing finite left and right limits, denoted by , such that
| (4.27) |
using Euler’s homogeneous function theorem on the second line. Consider (4.27) evaluated at and take the limit as , yielding
| (4.28) |
For differentiable at , , so the limit of (4.27) is , and hence there exists such that (4.27) is positive for all , giving for all . Consequently, , .
For not differentiable at , (4.28) is positive when , and again in this case , . When , then the minimizing sequence should be as large as possible, i.e., equal to its upper bound of from inequality (4.26). Further asymptotic detail on this bound is obtained through a Taylor expansion:
| (4.29) |
giving
Taking at this upper bound and using the expansion (4.29),
such that . Since we also have , the regular variation indices are identical with . This represents a case where the scale normalizations in the conditional extremes representation do not diverge to infinity, meaning a potential difference in the limit distribution.
Figure 8 displays examples of gauge functions and . We observe from this figure how, when is sufficiently large, the shape of is modified to produce . The modification is focussed around the diagonal, and explains visually why the residual tail dependence coefficient changes while the conditional extremes normalization does not. The left and right panels illustrate differentiable cases, with for sufficiently small ; the centre panel depicts an example with linear in as .


5 Discussion
In this work we have demonstrated how several concepts of extremal dependence can be unified through the shape of the limit set of the scaled sample cloud arising for distributions with light-tailed margins. For concreteness our focus has been on exponential margins, but other choices can be useful. In the case of negative dependence between extremes — such that large values of one variable are most likely to occur with small values of another — the double exponential-tailed Laplace margins can be more enlightening. As an example, for the bivariate Gaussian copula with we observed that the limit set is described by a discontinuous gauge function that cannot be established through the simple mechanism of Proposition 2. In Nolde, (2014), the gauge function for this distribution in Laplace margins is calculated as
When , this yields , and , so that extending Proposition 5, we would find that the conditional extremes normalizations are and , as given in Keef et al., (2013).
The study of extremal dependence features through the limit set is enlightening both for asymptotically dependent and asymptotically independent random vectors, particularly as it can be revealing for mixture structures where mass is placed on a variety of cones as defined in (2.2). However, many traditional measures of dependence within the asymptotically dependent framework, which are typically functions of the exponent function given in equation (2.3), or spectral measure , are not revealed by limit set . For example, it was noted in the example of Section 4.1.3 that the limit set described by the gauge function can arise for several different spectral measures, although clearly the parameter demonstrates some link between strength of dependence and shape of .
Nonetheless, multivariate regular variation and associated limiting measures have been well-studied in extreme value theory, but representations that allow greater discrimination between asymptotically independent or mixture structures much less so. The limit set elucidates many of these alternative dependence concepts and provides meaningful connections between them. We have not directly considered connections between the various dependence measures without reference to , and we note that the limit set might not always exist. We leave such study to future work.
Acknowledgements
The authors are grateful to the editor and two reviewers for constructive feedback and valuable comments that helped improve the paper. NN acknowledges financial support of the Natural Sciences and Research Council of Canada. JLW gratefully acknowledges funding from EPSRC grant EP/P002838/1.
References
- Abdous et al., (2005) Abdous, B., Fougères, A.-L., and Ghoudi, K. (2005). Extreme behaviour for bivariate elliptical distributions. Canadian Journal of Statistics, 33(3):317–334.
- Balkema et al., (2010) Balkema, A. A., Embrechts, P., and Nolde, N. (2010). Meta densities and the shape of their sample clouds. J. Multivariate Analysis, 101:1738–1754.
- Balkema and Embrechts, (2007) Balkema, G. and Embrechts, P. (2007). High Risk Scenarios and Extremes. A Geometric Approach. European Mathematical Society, Zurich.
- Balkema and Nolde, (2010) Balkema, G. and Nolde, N. (2010). Asymptotic independence for unimodal densities. Advances in Applied Probability, 42(2):411–432.
- Balkema and Nolde, (2012) Balkema, G. and Nolde, N. (2012). Asymptotic dependence for homothetic light-tailed densities. Adv. Appl. Prob., 44.
- Balkema and Nolde, (2020) Balkema, G. and Nolde, N. (2020). Samples with a limit shape, multivariate extremes, and risk. Advances in Applied Probability, 52:491–522.
- Bedford and Cooke, (2001) Bedford, T. and Cooke, R. M. (2001). Probability density decomposition for conditionally dependent random variables modeled by vines. Annals of Mathematics and Artificial intelligence, 32(1-4):245–268.
- Bedford and Cooke, (2002) Bedford, T. and Cooke, R. M. (2002). Vines: A new graphical model for dependent random variables. Annals of Statistics, pages 1031–1068.
- Beirlant et al., (2004) Beirlant, J., Goegebeur, Y., Segers, J., and Teugels, J. L. (2004). Statistics of extremes: theory and applications. John Wiley & Sons.
- Coles and Tawn, (1991) Coles, S. G. and Tawn, J. A. (1991). Modelling extreme multivariate events. Journal of the Royal Statistical Society: Series B (Methodological), 53(2):377–392.
- Das and Resnick, (2011) Das, B. and Resnick, S. I. (2011). Conditioning on an extreme component: Model consistency with regular variation on cones. Bernoulli, 17(1):226–252.
- Davis et al., (1988) Davis, R. A., Mulrow, E., and Resnick, S. I. (1988). Almost sure limit sets of random samples in . Advances in applied probability, 20(3):573–599.
- de Haan, (1970) de Haan, L. (1970). On Regular Variation and Its Application to Weak Convergence of Sample Extremes. CWI Tract 32, Amsterdam.
- (14) de Valk, C. (2016a). Approximation and estimation of very small probabilities of multivariate extreme events. Extremes, 19:687–717.
- (15) de Valk, C. (2016b). Approximation of high quantiles from intermediate quantiles. Extremes, 19:661–686.
- Engelke and Hitz, (2020) Engelke, S. and Hitz, A. S. (2020). Graphical models for extremes (with discussion). Journal of the Royal Statistical Society, Series B.
- Engelke et al., (2019) Engelke, S., Opitz, T., and Wadsworth, J. (2019). Extremal dependence of random scale constructions. Extremes, 22(4):623–666.
- Fisher, (1969) Fisher, L. (1969). Limiting sets and convex hulls of samples from product measures. Ann. Math. Statist., 40:1824–1832.
- Fougères and Soulier, (2010) Fougères, A.-L. and Soulier, P. (2010). Limit conditional distributions for bivariate vectors with polar representation. Stochastic models, 26(1):54–77.
- Geffroy, (1958) Geffroy, J. (1958). Contribution à la theorie des valeurs extrêmes. Publ. Inst. Statist. Univ. Paris, VII:37–121.
- Geffroy, (1959) Geffroy, J. (1959). Contribution à la theorie des valeurs extrêmes. Publ. Inst. Statist. Univ. Paris, VIII:3–65.
- Gnedenko, (1943) Gnedenko, B. (1943). Sur la distribution limité du terme d’une série aléatoire. Ann. Math., 44:423–453.
- Gumbel, (1960) Gumbel, E. J. (1960). Distributions des valeurs extremes en plusiers dimensions. Publ. Inst. Statist. Univ. Paris, 9:171–173.
- Heffernan and Resnick, (2007) Heffernan, J. E. and Resnick, S. I. (2007). Limit laws for random vectors with an extreme component. The Annals of Applied Probability, 17(2):537–571.
- Heffernan and Tawn, (2004) Heffernan, J. E. and Tawn, J. A. (2004). A conditional approach for multivariate extreme values (with discussion). Journal of the Royal Statistical Society: Series B (Statistical Methodology), 66(3):497–546.
- Huser and Wadsworth, (2019) Huser, R. and Wadsworth, J. L. (2019). Modeling spatial processes with unknown extremal dependence class. Journal of the American Statistical Association, 114(525):434–444.
- Hüsler and Reiss, (1989) Hüsler, J. and Reiss, R.-D. (1989). Maxima of normal random vectors: between independence and complete dependence. Statistics & Probability Letters, 7(4):283–286.
- Joe, (1996) Joe, H. (1996). Families of -variate distributions with given margins and bivariate dependence parameters. Lecture Notes-Monograph Series, pages 120–141.
- Keef et al., (2013) Keef, C., Papastathopoulos, I., and Tawn, J. A. (2013). Estimation of the conditional distribution of a multivariate variable given that one of its components is large: Additional constraints for the Heffernan and Tawn model. Journal of Multivariate Analysis, 115:396–404.
- Kinoshita and Resnick, (1991) Kinoshita, K. and Resnick, S. I. (1991). Convergence of scaled random samples in . The Annals of Probability, pages 1640–1663.
- Kulik and Soulier, (2020) Kulik, R. and Soulier, P. (2020). Heavy-tailed time series. Springer.
- Leadbetter et al., (1983) Leadbetter, M. R., Lindgren, G., and Rootzén, H. (1983). Extremes and related properties of random sequences and processes. Springer.
- Ledford and Tawn, (1996) Ledford, A. W. and Tawn, J. A. (1996). Statistics for near independence in multivariate extreme values. Biometrika, 83(1):169–187.
- Ledford and Tawn, (1997) Ledford, A. W. and Tawn, J. A. (1997). Modelling dependence within joint tail regions. Journal of the Royal Statistical Society: Series B (Statistical Methodology), 59(2):475–499.
- Matheron, (1975) Matheron, G. (1975). Random Sets and Integral Geometry. John Wiley & Sons, New York.
- Nolde, (2014) Nolde, N. (2014). Geometric interpretation of the residual dependence coefficient. Journal of Multivariate Analysis, 123:85–95.
- Papastathopoulos and Tawn, (2016) Papastathopoulos, I. and Tawn, J. A. (2016). Conditioned limit laws for inverted max-stable processes. Journal of Multivariate Analysis, 150:214–228.
- Ramos and Ledford, (2009) Ramos, A. and Ledford, A. (2009). A new class of models for bivariate joint tails. Journal of the Royal Statistical Society: Series B (Statistical Methodology), 71(1):219–241.
- Resnick, (1987) Resnick, S. (1987). Extreme Values, Regular Variation, and Point Processes. Springer.
- Resnick, (2002) Resnick, S. (2002). Hidden regular variation, second order regular variation and asymptotic independence. Extremes, 5(4):303–336.
- Resnick, (2007) Resnick, S. (2007). Heavy-tail Phenomena. Probabilistic and Statistical Modeling. Springer.
- Seifert, (2014) Seifert, M. I. (2014). On conditional extreme values of random vectors with polar representation. Extremes, 17(2):193.
- Simpson et al., (2020) Simpson, E. S., Wadsworth, J. L., and Tawn, J. A. (2020). Determining the dependence structure of multivariate extremes. Biometrika.
- Tawn, (1990) Tawn, J. A. (1990). Modelling multivariate extreme value distributions. Biometrika, 77(2):245–253.
- Wadsworth and Tawn, (2013) Wadsworth, J. and Tawn, J. (2013). A new representation for multivariate tail probabilities. Bernoulli, 19(5B):2689–2714.
- Wadsworth and Tawn, (2019) Wadsworth, J. and Tawn, J. (2019). Higher-dimensional spatial extremes via single-site conditioning. arXiv:1912.06560.