Long-Range Repulsion Between Chromosomes in Mammalian Oocyte Spindles
During eukaryotic cell division, a microtubule-based structure called the spindle exerts forces on chromosomes, thereby organizing and segregating them [1]. Extensive work demonstrates that the forces acting parallel to the spindle axis, including those responsible for separating sister chromatids, are generated by microtubule polymerization and depolymerization, and molecular-motors [2, 3, 4, 5]. In contrast, little is known about the forces acting perpendicular to the spindle axis, which determine the configuration of chromosomes at the metaphase plate, and thus impact nuclear localization and rates of segregation errors [6, 7]. Here, we use quantitative live-cell microscopy to show that metaphase chromosomes are spatially anti-correlated in mouse oocyte spindles, indicating the existence of hitherto unknown long-range forces acting perpendicular to the spindle axis. We explain this observation by first demonstrating that the spindle’s microtubule network behaves as a nematic liquid crystal, and then arguing that deformation of the nematic field around embedded chromosomes causes long-range repulsion between them. Our work highlights the surprising relevance of materials physics in understanding the structure, dynamics, and mechanics of cellular structures, and presents a novel and potentially generic mode of chromosome organization in large spindles.
Chromosome segregation is a physical and mechanical process, requiring precisely coordinated motion of micron-sized objects (chromosomes) through distances of tens of microns (the size of a typical metazoan cell) [1, 3]. The forces causing this motion are generated primarily by the spindle, a cellular structure comprising a network of microtubules – long, rigid polymers of the protein tubulin – in association with hundreds of additional proteins that modulate microtubule nucleation, polymerization/depolymerization, and interactions [8, 9]. However, despite our extensive knowledge of the spindle’s molecular constituents, we lack a general framework for understanding how it self-organizes to generate cellular-scale forces. This places a fundamental limit on our ability to predict when spindle dysfunction leads to errors in chromosomes segregation, and thus how it might contribute to diseases such as cancer and infertility [10, 11, 12].
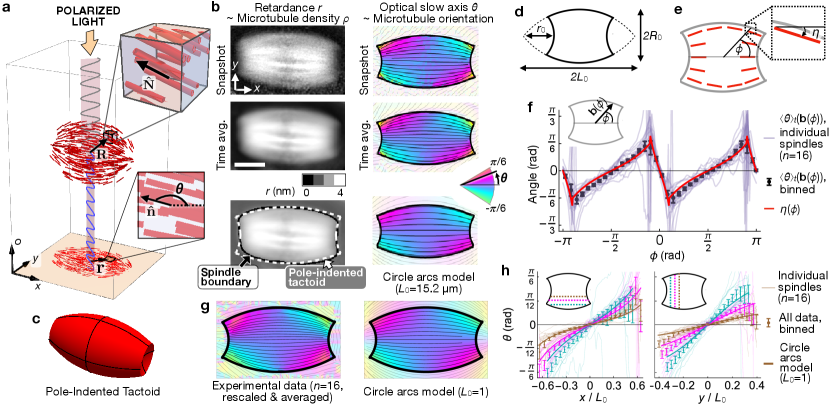
Metaphase II (MII) spindles in mammalian oocytes provide an ideal model system in which to study spindle-self organization in vivo, since their large sizes and long steady-state lifetimes facilitate detailed microscopy measurements (Supplemental Information S.I. 1, [13, 11, 14]). To characterize the structure and dynamics of the microtubule network in these spindles, we acquired LC-PolScope movies (Fig. 1(a); Methods 1 & 2). The LC-PolScope is a label-free quantitative polarization microscope that simultaneously measures the optical retardance and optical slow axis at a given time and each position in a two-dimensional (2D) image [13]. These measurements provide quantitive information regarding the coarse-grained microtubule cross-sectional density and the nematic director , both defined at every point in 3D space as well as in time [15]: if the spindle long axis is perpendicular to the optical axis ,
| (1) |
where the integrals are taken over the optical axis , the constant nm2 characterizes the retardance contribution of a single microtubule, is the sample thickness along the optical axis, and the 2D vector is the normalized projection of into the LC-PolScope image plane (Fig. 1(a); S.I. 2 & 3; [16, 17, 18]).
We first used LC-PolScope movies to determine the relationship between the surface geometry of MII oocyte spindles and microtubule orientation in the spindle interior. To characterize surface geometry, we identified spindle boundaries from time-averaged retardance images, , calculated in a spindle-referenced coordinate system where and (Fig. 1(b, left column), Methods 2-4). We find that those portions of the spindle boundary that are furthest from the central axis are well-fitted by a pair of circle arcs that intersect at “virtual poles” at , outside the spindle boundary. In 3D, the corresponding portion of the spindle surface is convex, and approximates a tactoid, the shape generated by rotating a circle arc about its chord. Since the convex surfaces of MII spindles do not extend all the way to the poles, we model them as “polar-indented tactoids,” truncated tactoids with concave spherical caps of radius replacing the poles (Fig. 1(c & d); S.I. 4). In materials physics, tactoid and tactoid-like droplets are a characteristic feature of nematic liquid crystals, and have been observed under a wide variety of conditions in both experiments and simulations [19, 20, 21]. We next examined how microtubule orientation at the spindle boundary depends on surface geometry. We found close agreement between the observed microtubule orientation and a purely geometrical model in which microtubules lie tangent to the spindle’s convex (tactoid) surface, and perpendicular to its concave (polar cap) surfaces (Fig. 1(e & f)). Thus, at the spindle surface, microtubules obey a “strong anchoring” boundary condition [22]. In tactoid-shaped nematic droplets with strong anchoring, the director is predicted to lie tangent to the unique family of circle arcs that intersect at [23, 24]. To test whether this is the case in MII spindles, we compared the time-averaged slow axis images to the predictions of the circle arcs model (Methods 5). For individual spindles, we find good agreement between the observed pattern of microtubule orientation and that predicted by the model (Fig. 1(b, bottom right); S.I. 5). To further probe the validity of the circle arcs model, we investigated whether steady-state orientation fields from different spindles collapse onto a master field when they are properly rescaled, as that model predicts they should. Using previously measured values of (and no additional fit parameters), we rescaled the orientation field of all spindles, , and observed excellent data collapse (Fig. 1(g & h)). Taken together, these results provide strong evidence for a model of spindle self-organization in which microtubule orientation is determined by a well-defined anchoring condition on the spindle boundary, together with a tendency for microtubules in the spinde interior to locally align with each other, i.e. nematic elasticity.
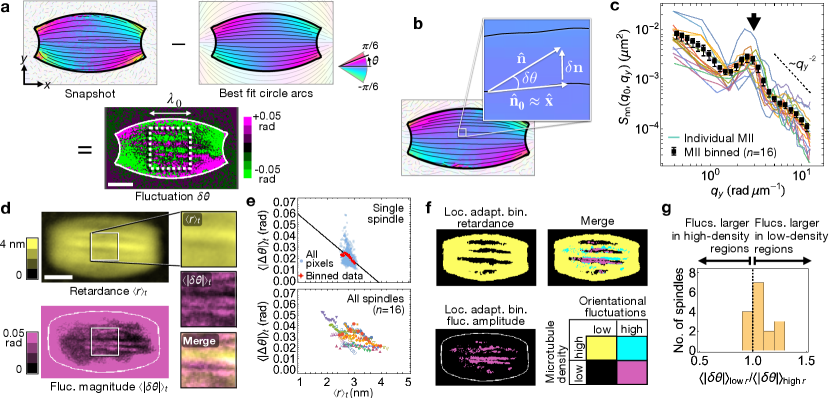
Since the steady-state orientation of microtubules in MII spindles is well-described by nematic liquid crystal physics, we next investigated if such a model can also describe the fluctuations in microtubule orientation around that steady-state. In synthetic materials, spatiotemporal correlations of fluctuations have long been used to characterize material properties [25, 22]. More recently, fluctuation analysis was used to show that the microtubule network of in vitro reconstituted Xenopus egg extract spindles behaves as an active nematic material [26]. To determine if a similar approach can be applied to spindles in living oocytes, we first subtracted the best-fit 2D director field, , from the instantaneous field to calculate the fluctuations in a box of side length placed at the center of the spindle (Fig. 2(a)). Fluctuations take a particularly simple form in this region since, to lowest order in , and (Fig. 2(b)). To quantify the fluctuation pattern, we plotted the equal time correlation function, , as a function of the wave-vector component perpendicular to the spindle axis, with the parallel component fixed at the lowest available mode (Methods 6). For the lowest and highest values of , displays behavior consistent with the inverse square power law predicted by active nematic theory and observed in previous experiments on reconstituted Xenopus spindles (Fig. 2(c), S.I. 6). At intermediate value of , however, displays a prominent feature neither predicted by theory nor observed in Xenopus extract: a peak centered at rad , corresponding to a real-space wavelength .
To elucidate the origins of the anomalous behavior of , we next explored the relationship between orientational fluctuations and microtubule density. We observed that the time-averaged orientational fluctuation magnitude was negatively correlated with the time-averaged retardance in 15 out of 16 spindles (Fig. 2(d & e); S.I. 7). To investigate the basis of this negative correlation, we used a local binarization filter (Methods 7), which revealed that spindles contain elongated regions with low microtubule density (Fig. 2(f)) in which orientational fluctuations are larger (Fig. 2(g)).
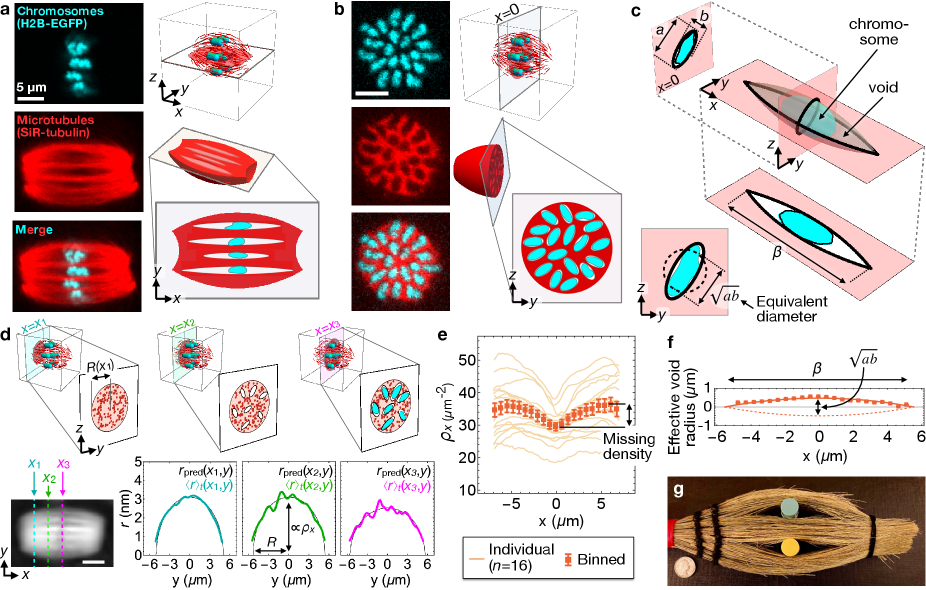
To understand the origins of these micron-scale density inhomogeneities and how they might affect orientational fluctuations, we labeled chromosomes by expressing H2B-EGFP and microtubules by SiR-tubulin staining, and used 3D confocal microscopy to image the internal structure of living oocyte spindles (Methods 8 & 9). Confocal micrographs show that the microtubule network is a contiguous material perforated by voids (i.e. regions of low microtubule density) surrounding each embedded chromosome (Fig. 3(a&b)). Consistent with recent results demonstrating that condensed chromosomes are microtubule-impermeable [27], void cross-sections in the metaphase plate (i.e. the plane) closely follow chromosome boundaries, and may be approximated as ellipses with long and short axes and respectively, where (S.I. 8). In the -direction, the voids extend much further than chromosomes, along most of the length of the spindle (Fig. 3(c)).
We were not able to use the micrographs to quantify individual void profiles along because, for a significant portion of their lengths, void widths are smaller than the microscope’s resolution. Instead, we used LC-PolScope data to infer the average void profile along . To do this, we fit the microtubule cross-sectional density as a function of position along the spindle long axis (Fig. 3 (d & e); S.I. 3). The density profile reaches a minimum at the metaphase plate and a maximum near the poles (Fig. 3(e)). By assuming all of this “missing” density in the central spindle is due to voids, we infer that 10% of the total volume, and 15 % of the metaphase plate area, of MII spindles is taken up by voids. Assuming further that all spindles contain voids (one per chromosome), we find that average void profiles along are well-approximated by circle arcs with waist diameter around (Fig. 3 (f)), which may be interpreted as the geometric mean of the long and short axes of the void’s cross-section, (Fig. 3(c, bottom left inset)). The simplest 3D shape that would generate such a missing retardance profile is a tactoid, the form generated by revolving a circle arc of chord length about its chord, which would have a circular cross-section in the metaphase plate (). Since the voids in MII spindles have non-circular cross-sections (), their 3D shapes are not true tactoids, but rather are “tactoid-like” in the sense that their average profile along is a circle arc. Tactoid-shaped holes have been observed previously in both synthetic and biological nematics, and are known as “negative tactoids” or “atactoids” [28, 29, 30]; as in spindles, these strutures tend to spontaneously align with the nematic director ([31, 32, 33], Fig. 3(g)).
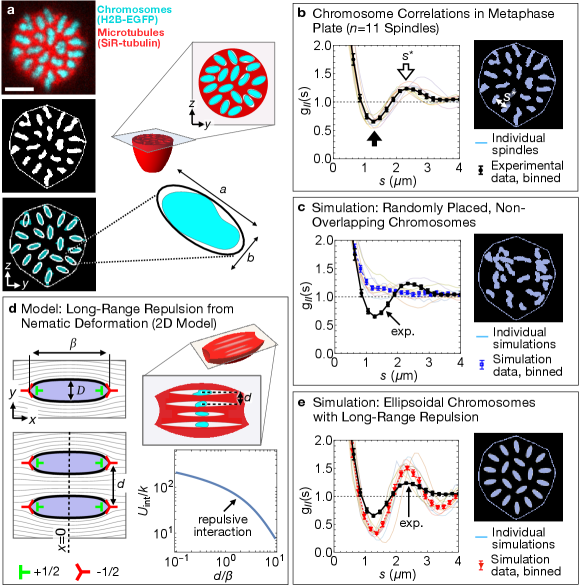
To investigate the configuration of voids within the metaphase plate, we took advantage of the fact that, in the plane, chromosome cross-sections provide a good proxy for void cross-sections (Fig. 3(b)), but are easier to identify since chromosomes are high-contrast, isolated, compact objects. To study chromosome cross-section configurations, we binarized images of the metaphase plates of several spindles (Fig. 4(a)). To detect correlations between chromosome positions, we use the pair correlation function , which quantifies the average correlation between the pixel value at pairs of points separated by a distance in the metaphase plate (S.I. 8). At separations much less than the smaller chromosome dimension (), ; this reflects the fact that a white pixel is very likely to immediately neighbor other white pixels. At larger separations, we observe a local minimum at corresponding to the the presence of a ring around each chromosome that is depleted of other chromosomes, and a local maximum at indicating a ring enriched in chromosomes (Fig. 4(b), black and white arrows; uncertainty given by empirical bootstrapping). To confirm this interpretation, we ran a Monte Carlo simulation that takes as inputs the experimentally determined set of binarized chromosome sections, and re-arranges them into a random configuration (S.I. 9). Random configurations appear strikingly different to the experimentally observed ones, and the corresponding lacks local maxima and minima (Fig. 4(c)), indicating that these simulations lack the local order (i.e. spatial anti-correlation) observed in the experimental data. Local ordering of chromosomes and their associated voids also explains the previously noted peak in (Fig. 2(c)), since large fluctuations concentrated in regularly-spaced voids cause a peak in the orientational correlation function (S.I. 6). Consistent with this interpretation, the characteristic spacing between voids, , agrees, within experimental uncertainty, with the position of the correlation function peak, .
We next turned to the origin of the forces responsible for chromosome ordering in the metaphase plate. In liquid crystal physics, it is well-known that deformation of the nematic field around micron-size inclusions can create long-range forces that cause the inclusions to self-organize into structured arrays [34, 35]. We therefore hypothesized that, in MII spindles, a similar force might cause the regularly spaced chromosome configurations we observe. To explore this effect, we constructed an analytically tractable 2D model in which the void surrounding a chromosome is represented as a topological quadrupole made up of two and two defects ([36]; Fig. 4(d, top left)). In this model, void boundaries are defined as those integral curves of the director that pass through the outer pair of defects. With this construction, the length and width of the void uniquely determine the spacing of the defects within a row and thus, for an isolated void, the orientation field everywhere in space (S.I. 10). For a pair of parallel, director-aligned voids whose centers lie along a line perpendicular to the far-field director , the deformation-induced interaction potential decays monotonically for all values of , and center-to-center separation , implying the existence of a repulsive force between 2D voids, independent of the details of void geometry (Fig. 4(d); S.I. 10).
To investigate whether long-range repulsion between 3D voids can account for the observed metaphase plate configurations, we performed a series of simulations where chromosome/void sections are represented by ellipses interacting via a long-ranged repulsive potential (S.I. 9). In each simulation, the ellipse geometry and metaphase plate boundary are determined from a specific experimental data set. Since we do not know the form of the interactions between non-axisymmetric voids in 3D, we repeat our simulations using four different long-range repulsive potentials, and find that the specific form of the interaction does not significantly affect the final chromosome configuration: all simulations produce configurations similar to the experimentally observed one, with features such as an outer ring of 15 mostly radially oriented chromosomes/ellipses, and local extrema of near 1.3 and (Fig. 4(e), S.I. 9). Thus, our observations of local ordering of chromosomes in the metaphase plate are consistent with the presence of long-range repulsion arising from deformation of the nematic field.
In this work, we have demonstrated that chromosomes are locally ordered in the metaphase plate of MII mouse oocytes, implying the existence of repulsive interchromsomal forces acting perpendicular to the spindle axis (Fig. 4). The micron-scale distances between chromosome surfaces (S.I. 9) are far larger than can be accounted for by known forces, such as those arising from electrostatic repulsion [37] or steric interactions between chromosome-associated proteins [38]. To explain this observation, we proposed a novel mechanism whereby distortion of the microtubule network around chromosomes causes repulsion between them. Our model relies on the key assumption that stress and torque propagate through the microtubule network according to the predictions of nematic elasticity, i.e. that the microtubule network has the mechanical properties of a nematic liquid crystal. This assumption is consistent with several other observations of mouse oocyte spindles, in particular the shape of the spindle boundary (Fig. 1(b-f)), the steady-state pattern of microtubule orientation in the spindle interior (Fig. 1(g&h)), the functional form of spatial correlations of orientational fluctuations (Fig. 2(c)), and the appearance of director-aligned, tactoid-like voids around embedded chromosomes (Fig. 3). Consistent with our findings, previous work in Xenopus egg extract [26, 39] and human tissue culture cells [15] showed that nematic models accurately predict several aspects of spindle structure and dynamics in those systems also. Taken together, these results suggest that nematic elasticity plays a fundamental role in determining both spindle structure and chromosome organization in large spindles across organisms and cell types.
1 References
References
- [1] Bruce Alberts, Alexander Johnson, Julian Lewis, David Morgan, Martin Raff, Keith Roberts, and Peter Walter. Molecular Biology of the Cell. Garland Science, 6 edition, 2015.
- [2] Helder Maiato, Ana Gomes, Filipe Sousa, and Marin Barisic. Mechanisms of chromosome congression during mitosis. Biology, 6:13, 2 2017.
- [3] Maya I. Anjur-Dietrich, Colm P. Kelleher, and Daniel J. Needleman. Mechanical mechanisms of chromosome segregation. Cells, 10:465, 2 2021.
- [4] Nenad Pavin and Iva M. Tolić. Self-organization and forces in the mitotic spindle. Annual Review of Biophysics, 45:279–298, 7 2016.
- [5] Ehssan Nazockdast and Stefanie Redemann. Mechanics of the spindle apparatus. Seminars in Cell & Developmental Biology, 107:91–102, 11 2020.
- [6] Daniel Gerlich, Joël Beaudouin, Bernd Kalbfuss, Nathalie Daigle, Roland Eils, and Jan Ellenberg. Global chromosome positions are transmitted through mitosis in mammalian cells. Cell, 112:751–764, 3 2003.
- [7] Sjoerd J. Klaasen, My Anh Truong, Richard H. van Jaarsveld, Isabella Koprivec, Valentina Štimac, Sippe G. de Vries, Patrik Risteski, Snježana Kodba, Kruno Vukušić, Kim L. de Luca, Joana F. Marques, Elianne M. Gerrits, Bjorn Bakker, Floris Foijer, Jop Kind, Iva M. Tolić, Susanne M. A. Lens, and Geert J. P. L. Kops. Nuclear chromosome locations dictate segregation error frequencies. Nature, 607:604–609, 7 2022.
- [8] Ulrike S. Eggert, Timothy J. Mitchison, and Christine M. Field. Animal cytokinesis: From parts list to mechanisms. Annual Review of Biochemistry, 75:543–566, 6 2006.
- [9] Binyam Mogessie, Kathleen Scheffler, and Melina Schuh. Assembly and positioning of the oocyte meiotic spindle. Annual Review of Cell and Developmental Biology, 34:381–403, 10 2018.
- [10] William T Silkworth and Daniela Cimini. Transient defects of mitotic spindle geometry and chromosome segregation errors. Cell Division, 7:19, 2012.
- [11] Zuzana Holubcová, Martyn Blayney, Kay Elder, and Melina Schuh. Error-prone chromosome-mediated spindle assembly favors chromosome segregation defects in human oocytes. Science, 348:1143–1147, 6 2015.
- [12] Tamara Potapova and Gary Gorbsky. The consequences of chromosome segregation errors in mitosis and meiosis. Biology, 6:12, 2 2017.
- [13] Lin Liu, Rudolf Oldenbourg, James R. Trimarchi, and David L. Keefe. A reliable, noninvasive technique for spindle imaging and enucleation of mammalian oocytes. Nature Biotechnology, 18:223–225, 2 2000.
- [14] Aleksandar I. Mihajlović and Greg FitzHarris. Segregating chromosomes in the mammalian oocyte. Current Biology, 28:R895–R907, 8 2018.
- [15] William Conway, Robert Kiewisz, Gunar Fabig, Colm P Kelleher, Hai-Yin Wu, Maya Anjur-Dietrich, Thomas Müller-Reichert, and Daniel J Needleman. Self-organization of kinetochore-fibers in human mitotic spindles. eLife, 11, 7 2022.
- [16] H Sato, G W Ellis, and S Inoué. Microtubular origin of mitotic spindle form birefringence. demonstration of the applicability of wiener’s equation. Journal of Cell Biology, 67:501–517, 12 1975.
- [17] R. Oldenbourg, E.D. Salmon, and P.T. Tran. Birefringence of single and bundled microtubules. Biophysical Journal, 74:645–654, 1 1998.
- [18] Rudolf Oldenbourg. Polarized light microscopy: Principles and practice. Cold Spring Harbor Protocols, 2013:pdb.top078600, 11 2013.
- [19] Andrew DeBenedictis and Timothy J. Atherton. Shape minimisation problems in liquid crystals. Liquid Crystals, 43:2352–2362, 12 2016.
- [20] Pei-Xi Wang and Mark J. MacLachlan. Liquid crystalline tactoids: ordered structure, defective coalescence and evolution in confined geometries. Philosophical Transactions of the Royal Society A: Mathematical, Physical and Engineering Sciences, 376:20170042, 2 2018.
- [21] Anja Kuhnhold and Paul van der Schoot. Structure of nematic tactoids of hard rods. The Journal of Chemical Physics, 156:104501, 3 2022.
- [22] P.G. De Gennes and J. Prost. Physics of Liquid Crystals. Oxford Science Publications, 2 edition, 1993.
- [23] R D Williams. Two transitions in tangentially anchored nematic droplets. Journal of Physics A: Mathematical and General, 19:3211–3222, 11 1986.
- [24] Peter Prinsen and Paul van der Schoot. Shape and director-field transformation of tactoids. Physical Review E, 68:021701, 8 2003.
- [25] Dynamics of fluctuations in nematic liquid crystals. The Journal of Chemical Physics, 51:816–822, 7 1969.
- [26] Jan Brugués and Daniel Needleman. Physical basis of spindle self-organization. Proceedings of the National Academy of Sciences, 111:18496–18500, 12 2014.
- [27] Maximilian W. G. Schneider, Bryan A. Gibson, Shotaro Otsuka, Maximilian F. D. Spicer, Mina Petrovic, Claudia Blaukopf, Christoph C. H. Langer, Paul Batty, Thejaswi Nagaraju, Lynda K. Doolittle, Michael K. Rosen, and Daniel W. Gerlich. A mitotic chromatin phase transition prevents perforation by microtubules. Nature, 609:183–190, 9 2022.
- [28] J D Bernal and I Fankuchen. X-ray and crystallographic studies of plant virus preparations : I. introduction and preparation of specimens ii. modes of aggregation of the virus particles. The Journal of general physiology, 25:111–46, 9 1941.
- [29] Yu. A. Nastishin, H. Liu, T. Schneider, V. Nazarenko, R. Vasyuta, S. V. Shiyanovskii, and O. D. Lavrentovich. Optical characterization of the nematic lyotropic chromonic liquid crystals: Light absorption, birefringence, and scalar order parameter. Physical Review E, 72:041711, 10 2005.
- [30] Hamed Almohammadi, Sandra Martinek, Ye Yuan, Peter Fischer, and Raffaele Mezzenga. Disentangling kinetics from thermodynamics in heterogeneous colloidal systems. Nature Communications, 14:607, 2 2023.
- [31] Youngwoo Yi and Noel A. Clark. Orientation of chromonic liquid crystals by topographic linear channels: multi-stable alignment and tactoid structure. Liquid Crystals, 40:1736–1747, 12 2013.
- [32] Shuang Zhou, Andrey Sokolov, Oleg D. Lavrentovich, and Igor S. Aranson. Living liquid crystals. Proceedings of the National Academy of Sciences, 111:1265–1270, 1 2014.
- [33] Mikhail M Genkin, Andrey Sokolov, and Igor S Aranson. Spontaneous topological charging of tactoids in a living nematic. New Journal of Physics, 20:043027, 4 2018.
- [34] Philippe Poulin, Holger Stark, T. C. Lubensky, and D. A. Weitz. Novel colloidal interactions in anisotropic fluids. Science, 275:1770–1773, 3 1997.
- [35] Prerna Sharma, Andrew Ward, T. Gibaud, Michael F. Hagan, and Zvonimir Dogic. Hierarchical organization of chiral rafts in colloidal membranes. Nature, 513:77–80, 9 2014.
- [36] Farzan Vafa, Mark J. Bowick, M. Cristina Marchetti, and Boris I. Shraiman. Multi-defect dynamics in active nematics.
- [37] Vladimir Kesler, Boris Murmann, and H. Tom Soh. Going beyond the debye length: Overcoming charge screening limitations in next-generation bioelectronic sensors. ACS Nano, 14:16194–16201, 12 2020.
- [38] Sara Cuylen, Claudia Blaukopf, Antonio Z. Politi, Thomas Müller-Reichert, Beate Neumann, Ina Poser, Jan Ellenberg, Anthony A. Hyman, and Daniel W. Gerlich. Ki-67 acts as a biological surfactant to disperse mitotic chromosomes. Nature, 535:308–312, 7 2016.
- [39] David Oriola, Frank Jülicher, and Jan Brugués. Active forces shape the metaphase spindle through a mechanical instability. Proceedings of the National Academy of Sciences, 117:16154–16159, 7 2020.