Long versus Short Time Scales:
the Rough Dilemma and Beyond
Abstract
Using a large dataset on major FX rates, we test the robustness of the rough fractional volatility model over different time scales, by including smoothing and measurement errors into the analysis. Our findings lead to new stylized facts in the log-log plots of the second moments of realized variance increments against lag which exhibit some convexity in addition to the roughness and stationarity of the volatility. The very low perceived Hurst exponents at small scales is consistent with the rough framework, while the higher perceived Hurst exponents for larger scales leads to a nonlinear behavior of the log-log plot that has not been described by models introduced so far.
2010 Mathematics Subject Classification. 60F10, 91G99, 91B25.
Keywords: Fractional Brownian motion, rough volatility, realized variance, time series, intra-day data.
1 Introduction
It is well known that a constant volatility is not consistent with time series data nor implied volatility surfaces. Several stochastic volatility models have been introduced in the last decades in order to reproduce the stylized facts of time series observed for both historical and implied volatility, see e.g. Stein and Stein (1994), Heston (1993), Barndorff-Nielsen and Shephard (2001), Hagan et al. (2002), affine models like in Duffie et al. (2003), ARCH, GARCH, their non-parametric extensions Garcin and Goulet (2019), and many others. In a different (implied volatility) perspective, Dupire (1994) assumed that the volatility becomes a deterministic function of time and of the current state of the asset, thus leading to the local volatility approach, which provides a theoretically perfect reproduction of the implied volatility surface.
All these approaches adopt the classic Brownian framework for the noise of both the underlying and its volatility. Motivated by an apparent presence of long memory in the volatility process, see e.g. Lo (1991), some researchers (see e.g. Ding et al. (1993), Baillie (1996), Bollerslev and Mikkelsen (1996), Andersen and Bollerslev (1997), Breidt et al. (1998)…) modelled the log-volatility noise with a fractional Brownian motion, leading to the so called fractional stochastic volatility (FSV) model111A fractional Brownian motion (fBm) of Hurst exponent is a Gaussian process with a non trivial covariance function, namely a non Markovian process that allows for long or short memory, according to resp. or . The case corresponds to the classic (Markovian) Brownian motion. .
Comte and Renault (1998) suggested a model where the driving
fractional Brownian motion has Hurst parameter , in
order to take into account for the stylized fact suggesting that the volatility is a long memory process.
Their estimation procedure for the Hurst parameter was based on the method of Geweke and Porter-Hudak (1983), involving the slow decay of the autocorrelation function (which is supposed to be of power law with exponent less than one) and it reveals to be problematic, as the asymptotic behaviour of the
covariance function cannot be directly computed without assuming a specific functional form.
Recently, a new paradigm for the volatility process has been introduced by Gatheral et al. (2018), who affirmed a universal phenomenon: volatility is rough and cannot be described by a SDE driven by a classic Brownian motion. In particular, they showed that the autocorrelation function of the volatility does not behave as a power law, at least at the time scales ranging from one day till 2 months considered in their observation, so that they disentangled the question about the long memory of the volatility from the asymptotic behaviour of the autocorrelation function. Then, Gatheral et al. (2018) introduced a model, where the logarithm of the volatility is driven by a fractional Brownian motion (fBm) with a Hurst exponent that is empirically found to be very low, thus leading to rough trajectories for the volatility. For this reason, the approach is referred to as the rough fractional stochastic volatility model (RFSV). Using absolute moments estimation on a wide range of scales (from 1 day to approximatively 50 days), the Hurst exponent is found to be close to 0.14 both for the log-volatility of S&P 500 and the NASDAQ, together with other major indexes. The series of volatilities used in the seminal paper Gatheral et al. (2018) come from the realized variance estimates from the Oxford-Man Institute of Quantitative Finance Realized Library
222http://realized.oxford-man.ox.ac.uk/data/download. The Oxford-Man Institute’s Realized Library contains a selection of daily non-parametric estimates of volatility of financial assets, including realized variance and realized kernel estimates., between January 3, 2000 and March 31, 2014. In their approach, the daily squared volatility is estimated using the quadratic variations of the log-prices at a five-minute frequency (about 96 observations per day, in total about 3500 days). Another fundamental result in Gatheral et al. (2018) states that the estimation of the Hurst exponent is robust across time, scales and markets (equity indexes and FX). Before this empirical evidence of low Hurst exponents, based on series of historical volatilities, Alòs et al. (2007) suggested that values of below should reproduce another stylized fact regarding implied volatilities, namely the short-date skew.
One may wonder if the results of Gatheral et al. (2018) depend on the particular estimation procedure adopted. There are indeed different ways to compute the volatility proxies (see e.g. the Fourier-based estimators for the realized variance in Cuchiero and Teichmann (2015) or the Parkinson estimator Parkinson (1980) that one can adopt when the realized variance is not available), or methods that even circumvent the absolute moment estimation procedure, like the Whittle-type estimation methods used in Fukasawa et al. (2019) to find directly the Hurst exponent. However, it is possible to show that all these methods lead to qualitatively similar results. We will show this and investigate daily time series on equity indexes using the Parkinson estimator in a forthcoming paper.
We thus observe two branches of the literature of fractional volatility leading to opposite conclusions:
-
•
The traditional econometric approach, which studies the speed of the decay of the autocovariance function, concludes that there is long memory.
-
•
The rough volatility approach, in which the Hurst exponent is estimated from scaling properties of the series, uses thus estimators from literature of econophysics and of the statistics of stochastic processes. It concludes that there is no long memory.
In these two approaches, the tools are not the same, the range of scales analysed may differ, and the conclusions diverge.
A paper that somehow adopts both approaches is Bennedsen et al. (2016), where the authors present a two-factor stochastic volatility model which is rough at the short time scales, but it presents stationarity at longer time scales, according to the traditional approach that considers the autocovariance function. This mixing effect leads to an effective Hurst parameter varying on different observation time scales. In particular, the authors find a Hurst parameter for the S&P 500 index ranging from few cents up to 0.2, as the observation time scale grows from one minute to few hundreds minutes. It is worth noticing that Bennedsen et al. (2016) do consider just intra-day data: it would be interesting to see if their model is able to reproduce the stylized facts that we empirically observe also for longer time scales with daily data as we are going to describe.
Despite some technical issues arising from the fact that a volatility process driven by a fractional Brownian motion is not a semi-martingale (and the corresponding integrals require particular care), rough volatility models have been largely investigated in recent theoretical and empirical literature, to the point that today one can find more than one hundred papers on the subject333See e.g. the papers on the website https://sites.google.com/site/roughvol/home.. Surprisingly, the empirical investigation basically relies on the dataset from the Oxford-Man Institute’s Realized Library,
which is indeed very useful, but far to be the most complete.
The paper has two main contributions:
the first is a modification of Gatheral et al. (2018)’s method taking errors
into account, and the second is to report some findings from FX data.
As volatility is unobserved, we include the estimation error into the analysis. In fact, what we observe is only noisy volatility. We model two types of noise, coming from measurement and smoothing (arising from the fact that we replace the unobserved spot variance with the integrated variance estimator). We quantify the impact of all these noises in the estimation of the Hurst exponent and we filter out their effects. What remains after the filtering still deviates from the straight line behaviour predicted by the rough volatility model paradigm.
In particular, we extend previous empirical studies to a wider range of time scales, beyond the ones investigated in Gatheral et al. (2018), in order to check whether data are consistent with the scaling properties predicted by fractional volatility models. The most striking difference with these models is a strong convexity of the log-log plot. In other words, the Hurst exponent perceived at small scales is lower than the Hurst exponent perceived at larger scales. We also include the mean reversion of the volatility in our investigation: when we consider large time scales, we expect to be able to observe the stationarity features that were precluded in the previous studies, since the time windows investigated so far were too small compared to the mean reversion frequency.
In order to be able to observe such mean reversion effect, we obviously need long time series for the underlyings.
Our results show that the presence of only one fBm is not enough in order to meet all the stylized facts, convexity and stationarity, empirically observed in our dataset. The main conclusion is that, by broadening the ranges of scales, we highlight new stylized facts about the scaling of volatility processes that cannot be reproduced by the usual rough volatility model driven by a fractional Brownian motion.
The paper is organised as follows: in Section 2, we review Gatheral et al. (2018) and other preceding studies on the estimation of the Hurst parameter, such as Fukasawa et al. (2019) that pointed out some source of spurious roughness. Then, we propose a modification that includes the measurement and smoothing errors, with some reasoning supported by a simulation study. We re-examin the analysis of Gatheral et al. (2018) by including errors in Section 3, where we propose some ways to filter out the errors. Finally, in Section 4 we perform an empirical analysis on FX for a large dataset and we provide evidence of new stylized facts that are not present in past literature. Section 5 concludes.
2 Estimation of the Hurst exponent
2.1 Absolute moments estimation of the Hurst exponent
Consider the dynamics of a price process that evolves according to the SDE
| (1) |
where is a standard Brownian motion defined in a probability space that satisfies the usual technical conditions. The process is assumed to be a semimartingale in order to avoid arbitrage opportunities.
The volatility price process is not directly observable, one can only deduce indirectly its properties through some observable proxies like the realized variance process, defined as
| (2) |
where is a piecewise constant process which jumps at every sampling time of to the observed value of at the time. If there is no measurement error and the sampling frequency goes to infinity we have that
in probability, which justifies the choice of (2) for a proxy of the realized variance process, as well as its square root for the daily spot volatility, in the case where corresponds to the length of one day.
In Gatheral et al. (2018), the authors performed a linear regression in order to fit the empirical absolute moment of order of the log-volatility, defined as
| (3) |
They found a good fit, for different values of , with the function
| (4) |
for a very small value of .
This special scaling property, together with some empirical stylized facts on the Gaussian nature of the log-variance (see e.g. Andersen et al. (2003)), induced Gatheral et al. (2018) to assume a particular SDE for the log-volatility of the form
| (5) |
where is a constant and is a fractional Brownian motion with Hurst parameter .
In fact, a fractional Brownian motion (fBm) of Hurst exponent and scale parameter has stationary increments that satisfy
| (6) |
where denotes the Gamma function, see Kolmogorov (1940); Mandelbrot and van Ness (1968).
Turning things around, we define the absolute empirical moment of order of the increments of a process (playing the role of the log-volatility process), in a time interval for a given scale :444 In reality, we are using a version of with overlapping increments. This allows us to slightly increase the convergence of this empirical absolute moment Lo and MacKinlay (1988).
| (7) |
Using equation (6), it follows that is proportional to if is a fBm as increments are stationary. This is the basis for estimators of Hurst exponents, see e.g. Benassi et al. (1998); Garcin (2017). In particular, we can compute such empirical absolute moments for a great number of scales, and the estimator of is then times the slope of the regression of on Coeurjolly (2005). As a consequence, when plotting as a function of (also called log-log plot), we should get a straight line if is a fBm.
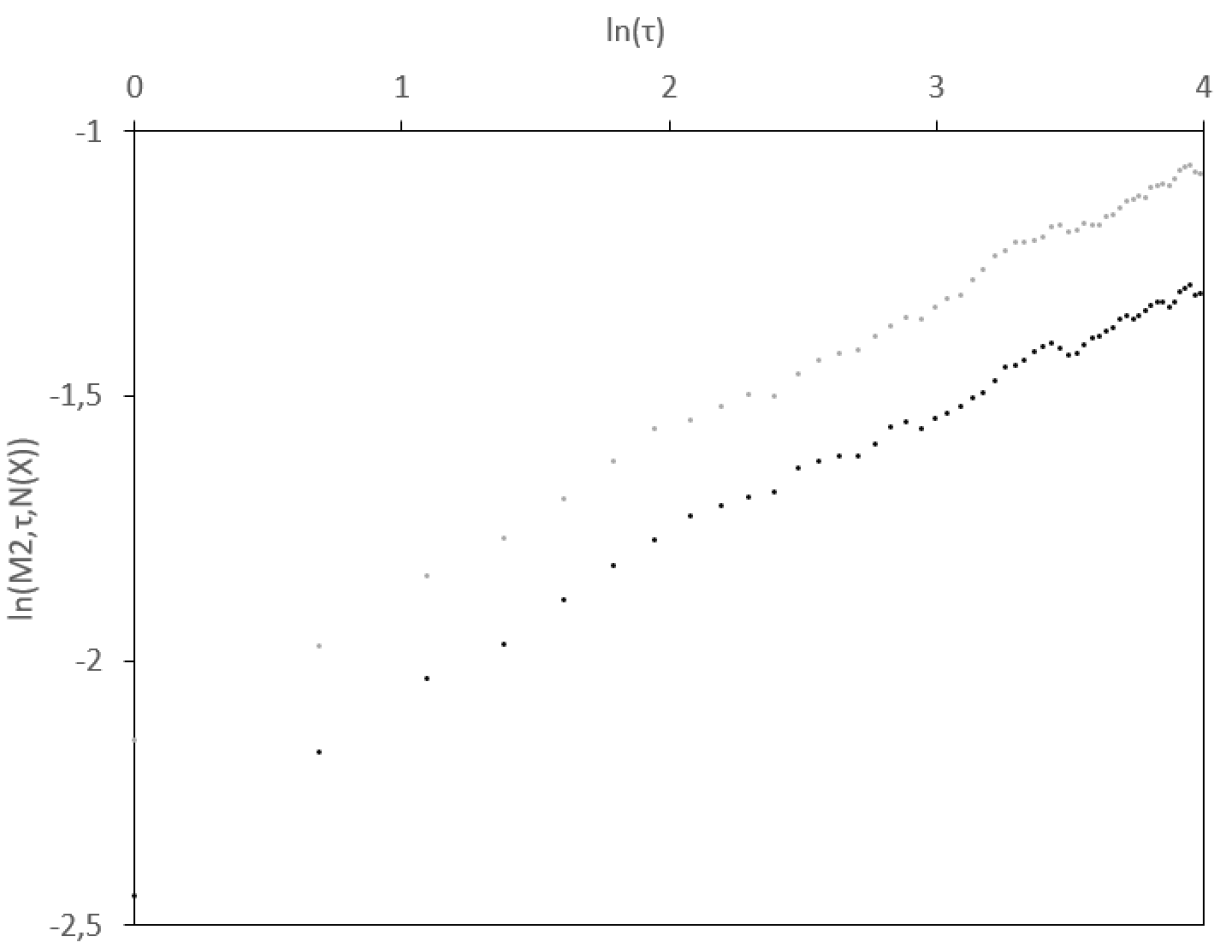
When restricting the analysis to small scales (say up to 2.5 months), one obtains such a straight line for log-log plot of realized volatilities, as first underlined by Gatheral et al. (2018). We reproduce this empirical observation in Figure 1, with two stock indices and data from the Oxford-Man Institute’s Realized Library.
Note that the estimate is in contrast with past literature on fractional volatility like Comte and Renault (1998), where the long memory was associated to . In particular, means that the volatility path is rougher than semimartingales, and is consistent to a power law for the term structure of implied volatility skew empirically observed in option markets, see Gatheral et al. (2018) and references therein.
2.2 Impact of the mean-reversion at large scales
An empirical stylized fact for the volatility is that it should be a stationary process, for both mathematical tractability and financial interpretability mostly at large times. In order to be consistent with a stationarity assumption, the rough volatility model in Gatheral et al. (2018) extends equation (5) to the case where the log-volatility follows a fractional Ornstein-Uhlenbeck process (fOU, see Cheridito et al. (2003)) with a very long reversion time scale, so that the effect of this mean reversion is invisible at the scales of the study (time scales considered are between one day and two months). However, when dealing with scales longer than two months, we should expect a deviation from the linear behaviour in the log-log plot for stationarized fBm processes (for example a fOU or the inverse Lamperti transform of a fBm, see e.g. Cheridito et al. (2003); Garcin (2019); Šapina et al. (2020)). We illustrate the phenomenon in the simple case where , namely the second absolute moment for the fBm, that can be rewritten as follows:
Now, for large scales, the first two terms become similar and independent of . If the third term, the covariance, is a decreasing function wrt (decreasing to ), then becomes an increasing function that flattens for large . As a consequence, the function behaves as a straight line for small values of , but as the time scale increases, the slope decreases gradually until reaching zero and we observe a concave behaviour for large scales. In conclusion, if we include the stationary volatility stylized fact into account, we should observe a potential decrease in the slope of the straight line in the log-log plot, or equivalently a smaller Hurst exponent for larger scales.
2.3 Spurious roughness and noisy volatility
It is well known that it is possible to simulate a spurious effect of roughness in the volatility paths just by playing with the drift of the volatility process, in particular by introducing a strong mean reversion effect, see for example Figure 2 in Fukasawa et al. (2019) or Rogers (2019). There is indeed another easy way to generate spurious roughness, namely by adding noise into the observations, as also pointed out by Fukasawa et al. (2019). In fact, what we measure is not volatility but just noisy volatility. In this subsection, we first provide a motivational example where we show that the presence of an additive noise may lead to a spurious roughness effect in a simulation study, where parameters are in line with empirical findings of the historical series that we shall consider in our empirical investigation. We then show how to quantify the impact of the noises in the estimation of the Hurst exponent in order to filter out the bias.
We assume that the log-price follows an Ito process with stochastic variance . Let be the estimated volatility of day , obtained using for example the realized volatility. These estimators provide us with a noisy version of the true and unobserved volatility, . We assume an additive model of measurement noise555Note that here we assume an additive model for the variance, not for the volatility. We can justify this choice by the additive nature of the variance, which makes it possible to apply the central limit theorem and to get an asymptotic distribution of the measurement error Rootzen (1980); Jacod and Protter (1998); Barndorff-Nielsen and Shephard (2002).:
| (8) |
where and where the are i.i.d. centered random variables.
Moreover, we consider the simple case where the variance of the log-prices follows a geometric Brownian motion:
| (9) |
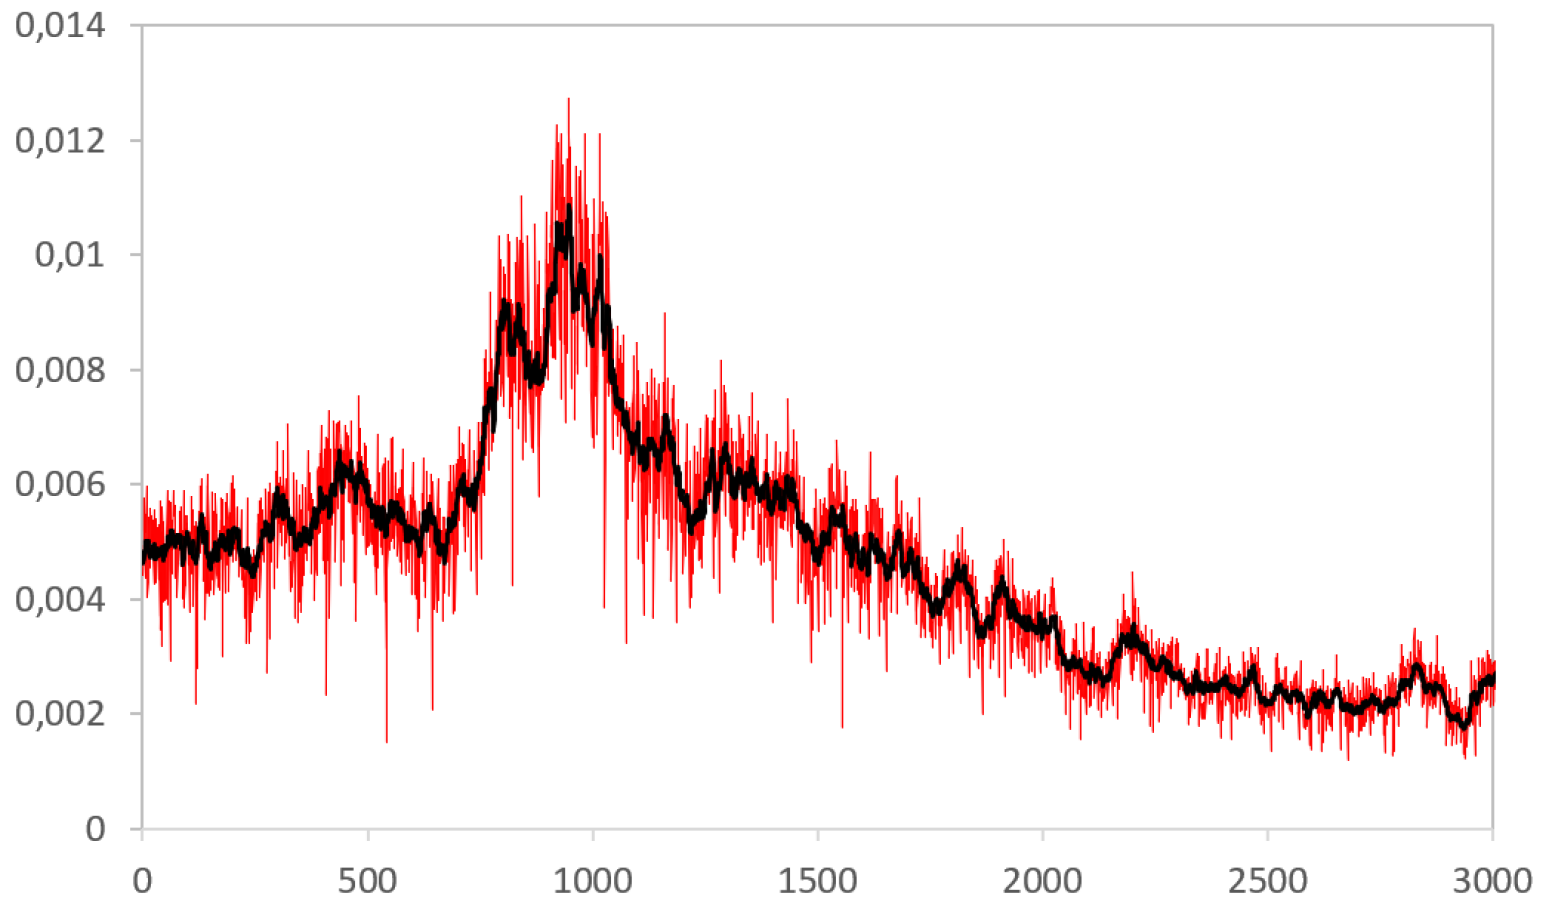
Endowed with the estimation of the parameters and for (9), we simulate the model (8) for different values of the standard deviation of the noise and it turns out that for certain values of the noise variance, a spurious roughness effect appears naturally, in line with Fukasawa et al. (2019): Figure 2 shows a typical spurious rough simulated path for a volatility satisfying (9).
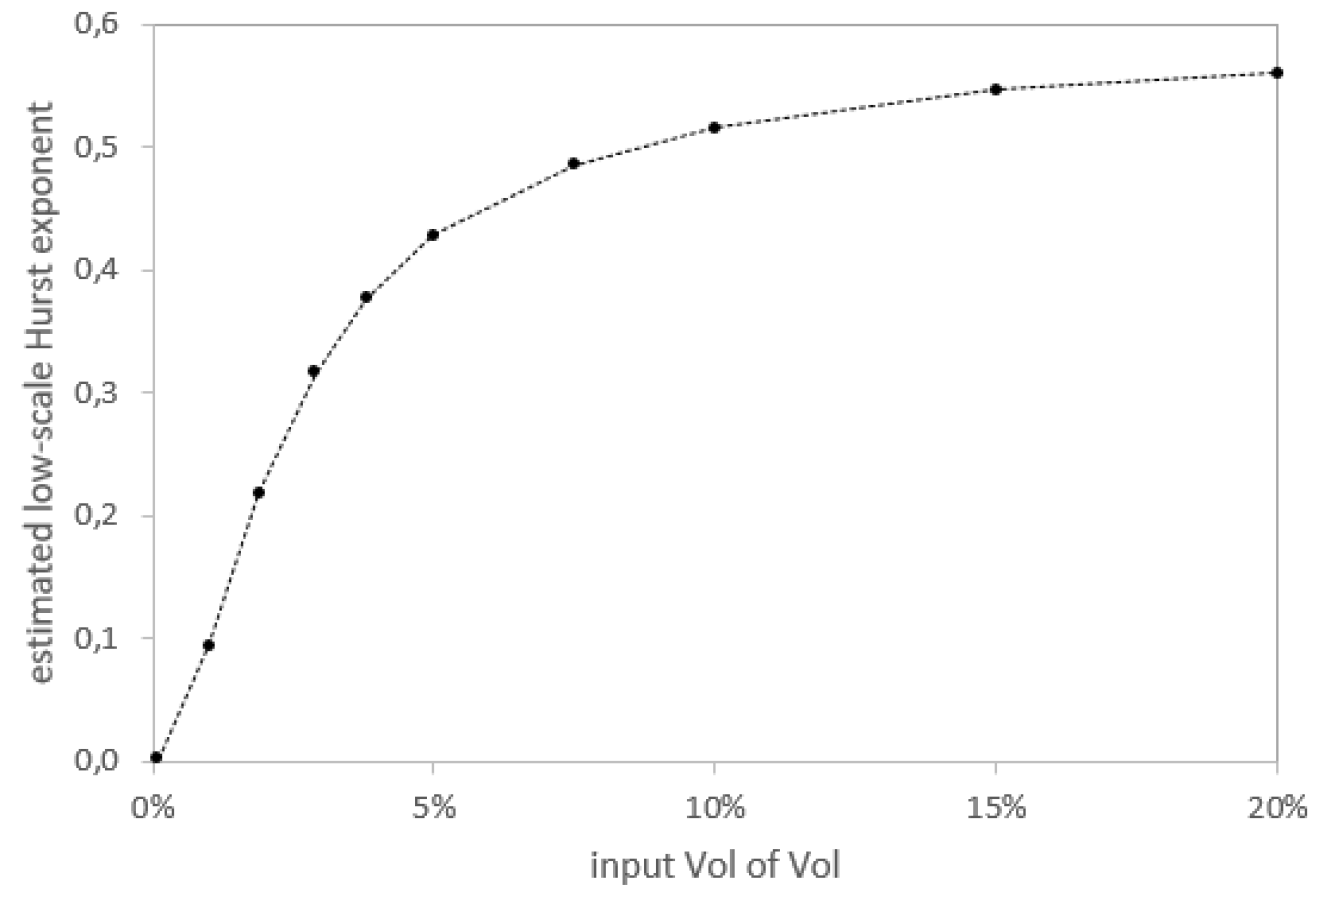
This result strongly depends on the input volatility of the volatility (and on the model too, which is here limited to the geometric Brownian motion for the variance process). In particular, we used the same vol of vol for all the simulations, which is the vol of vol relevant for EUR/USD. With higher vol of vol, the impact of the noise in the estimation of the Hurst exponent is decreased, as one can see in Figure 3.
In conclusion, a spurious roughness effect may appear in the presence of a noise. It will be therefore important to measure the standard deviation of the noise in order to filter out the bias from the estimation of the Hurst exponent.
2.4 Theoretical noise of the volatility proxy
In this subsection we focus on the first source of bias in the estimates, namely the measurement error, coming from the fact that the volatility process is not observable.
We can calculate the realized variance at a on-day scale for a given day, using log-returns:
The realized variance is an approximation of the integrated variance:
If the log-price follows an Ito process, from e.g. Rootzen (1980); Jacod and Protter (1998); Barndorff-Nielsen and Shephard (2002), we know the asymptotic distribution of the difference between the realized variance and the integrated variance, conditionally to the volatility process :
That is, asymptotically, is a centered Gaussian variable of variance . By neglecting the variations of in a day, we approximate the variance of the in equation (8) by . For FX rates, sampled every minute, we have .
2.5 A second type of noise: the smoothing effect
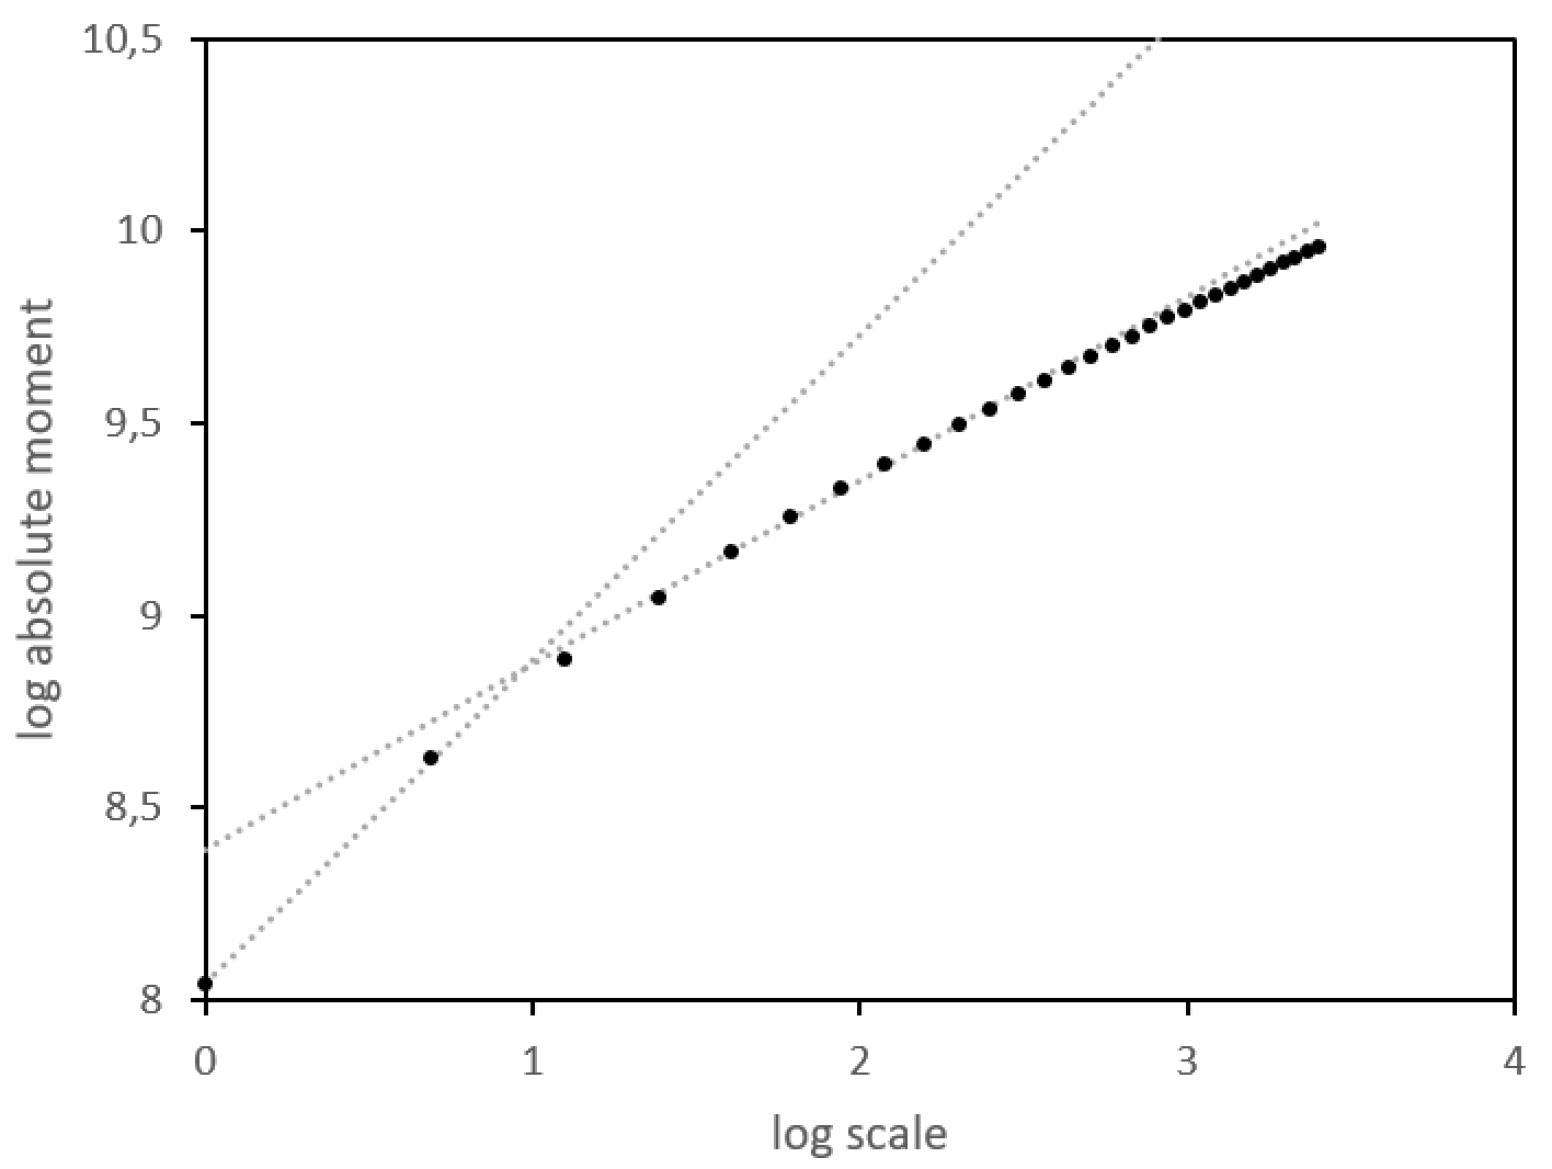
Motivated by the inaccuracy of the Hurst estimation, we now focus on the noise that comes from the fact that we try to estimate the Hurst exponent of the volatility process by applying estimation methods for the integrated volatility. Therefore, when we compute the variance of an increment of the realized volatility in the estimation of the Hurst exponent, for a given scale , we are in fact computing the integrated variance of the increment of the volatility process for a scale varying between minus one day and plus one day. This is referred to as to the smoothing error, namely the bias introduced by taking the integral instead of the spot (unobservable) argument, see also Appendix 3 in Gatheral et al. (2018), where methods and equations are similar to what we’re going to show in this subsection. In particular, in what follows, we show that this smoothing effect tends to overestimate the Hurst exponent. It may also explain why, in the Nasdaq log-log plots obtained by Gatheral et al. (2018), the slope of straight line is slightly higher for the lowest log-scales, what is illustrated in Figure 4.
Proposition 2.1.
Let the variance process follow a fBm of Hurst exponent and variance . Let the realized variance for days and observations per day be defined by:
Then, the variance of an increment of duration of is:
For , we also have the asymptotic expression:
| (10) |
where
| (11) |
Proof.
We write first the straightforward decomposition:
Then, using the fact that , according to the fBm assumption, we get:
Noting that in the above equation and that , we finally obtain:
From this result, we conclude for the asymptotic case:
∎
The asymptotic version of the realized variance is the integrated variance . In Proposition 2.1, we get an expression for the variance of its increments which is consistent with the one provided by Gatheral et al. (2018) and which is more concise than the equivalent expression obtained for the realized variance.
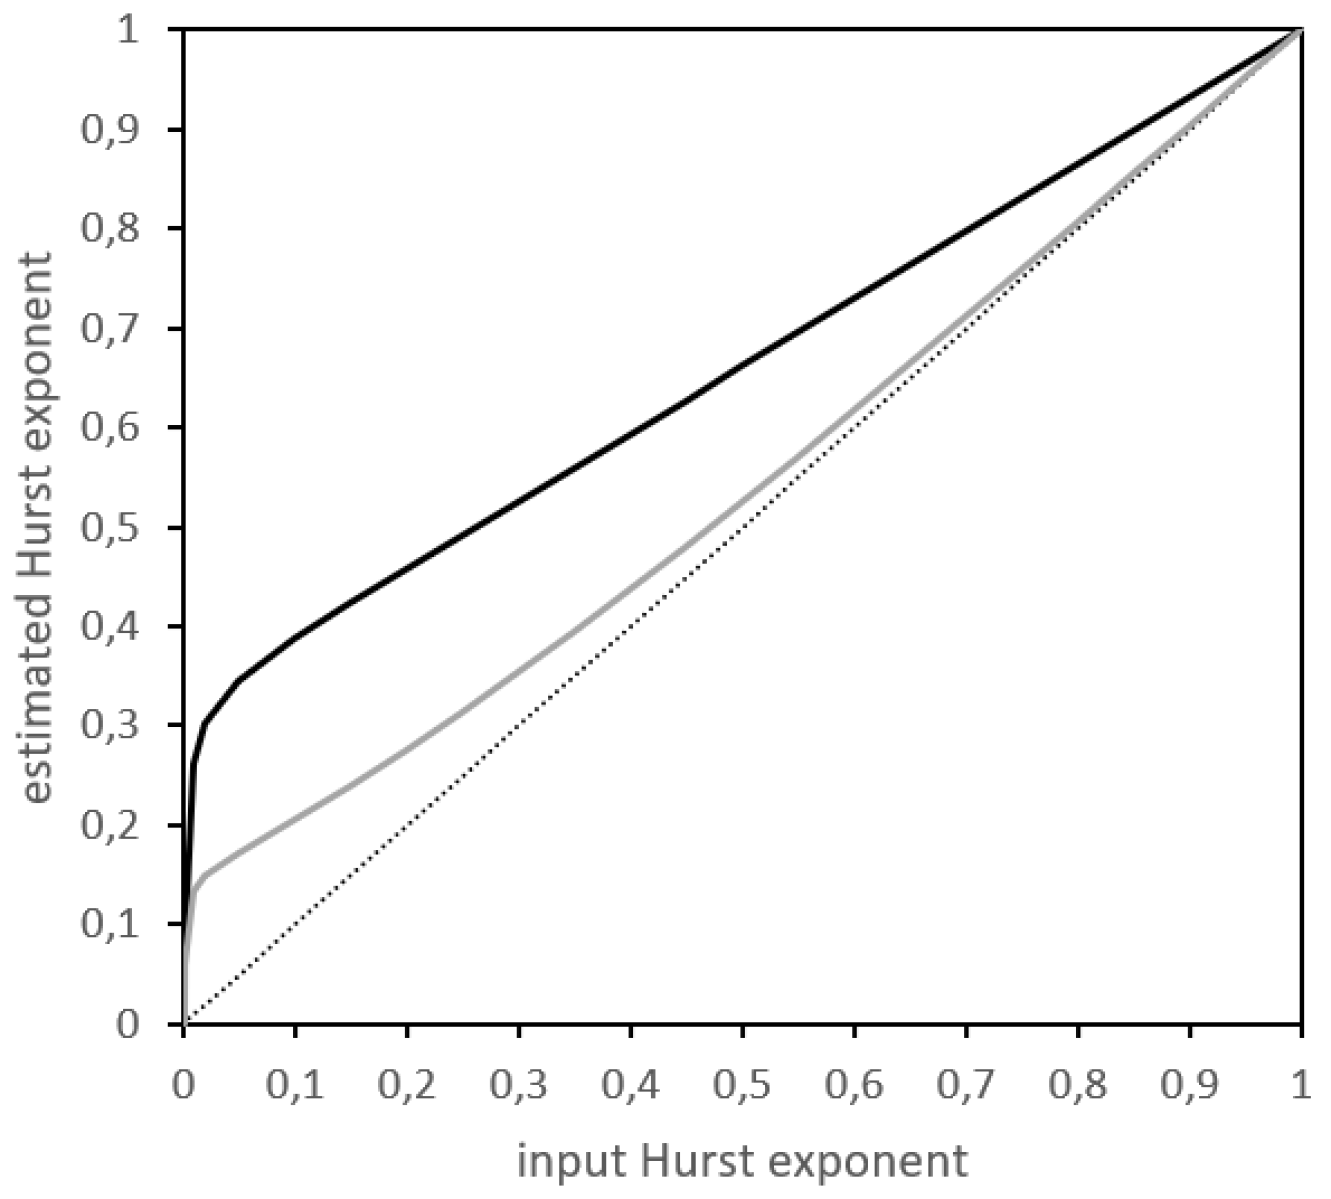
As one can see in Figure 5, though the bias is limited for higher values of , it is very significant for lower Hurst exponents.
Remark 2.1.
There is also a third type of error, namely the microstructure noise, coming from decimalization, absence of distinction between bid and ask, price formation and other issues typicically faced in intraday data (see e.g. Robert and Rosenbaum (2011a, b) and references therein). This microstructure noise affects the price at each observation in a roughly similar manner as the measurement noise already analysed. It tends to overestimate the variance process. In order to limit the impact of the microstructure noise, one can consider higher time steps for estimating the integrated variance. In line with the empirical literature, a 5-minute or even a 1-minute frequency turns out to limit the impact of the microstructure noise in the FX market (Bubák et al., 2011; Lallouache and Abergel, 2013; Kuck and Maderitsch, 2019), so we will neglect this error in our empirical analysis.
3 Filtering the noises
In this section, we are only working with moments of order 2, with an increment duration such that :
| (12) |
We want to filter the measurement noise and the smoothing error. More precisely, for the measurement noise we simply correct the bias in the estimation of all the absolute moments in the log-log plot for the variance, and for the smoothing error we correct the multiplicative error in the moment appearing in equation (10). To put it simply, we are looking for the moments of increments of , but as we cannot observe we work instead with , thus introducing the smoothing error. In addition, is approximated by , whose difference with is the measurement noise.
The way the noise is to be filtered strongly depends on the model one assumes for the volatility dynamic. In the next two subsections, we present two filtering methods based on two competing models. The first one is consistent with the RFSV approach. The second model uses the same underlying dynamic, a fBm, but applies it to the variance process instead of the volatility process. This approach is more consistent with dynamics inspired by the ARCH process, which are traditionally invoked in econometrics.
3.1 The log-volatility as a fBm
The first model we consider if the RFSV model Gatheral et al. (2018): , where is a fBm of Hurst exponent and . With this assumption, the theoretical log-log plot may differ from a straight line because of measurement noise and smoothing error. We present a method to filter these noises from the log-log plot. If the RFSV model depicted all the scaling features of the spot volatility series, the filtered plot should result in a straight line.
The log-log plot of the log-volatility should be based on . However, we only observe . Thanks to the successive approximations explained below, we get the following relation between and :
| (13) |
where and is defined in equation (11).
-
•
The approximation between the first and the second line is based on a first-order Taylor expansion of the logarithm, around an arbitrary value :
In addition to the error left by the Taylor expansion, another source of error may appear in the equations above and in all this section regarding the difference between the empirical moments, , and the theoretical ones. However, for long time series as ours, the difference is small with respect to other approximations and is equal to zero in average.
-
•
The approximation between the second and the third line is based on equation (10), that is , and thus filters the smoothing error, assuming that follows a fBm of Hurst exponent . In fact, the assumption that follows a fBm, which is the assumption in line with the rough volatility model of Gatheral et al. (2018), leads to the same approximation thanks to the first-order Taylor expansion of the logarithm introduced above, as , which can be seen by following the same argument as in Proposition B.1 of Fukasawa et al. (2019) who quantified the difference between the log of integrated variance and the integral of log variance.
-
•
The approximation between the third and the fourth line is based on the same kind of Taylor expansion than between the first and the second line.
-
•
The approximation between the fourth and the fifth line exploits the measurement noise between and . We have seen that if the log-price follows an Ito process, then where is asymptotically a centered Gaussian variable of variance . Thus, as an approximation, we consider that , with . According to Theorem H.1 of Fukasawa et al. (2019), the are independent variables, also independent of the , then:
(14) where we go from the first to the second line thanks to the fact that and are identically distributed, then to the third line because they are iid and to the last line by a Taylor expansion for the second moment of the logarithm of a random variable.
In equation (13), we filter successively the measurement noise by translating each absolute moment by a value of . Then, we filter the smoothing error by dividing the result by , with a properly chosen , consistent with the rough framework.
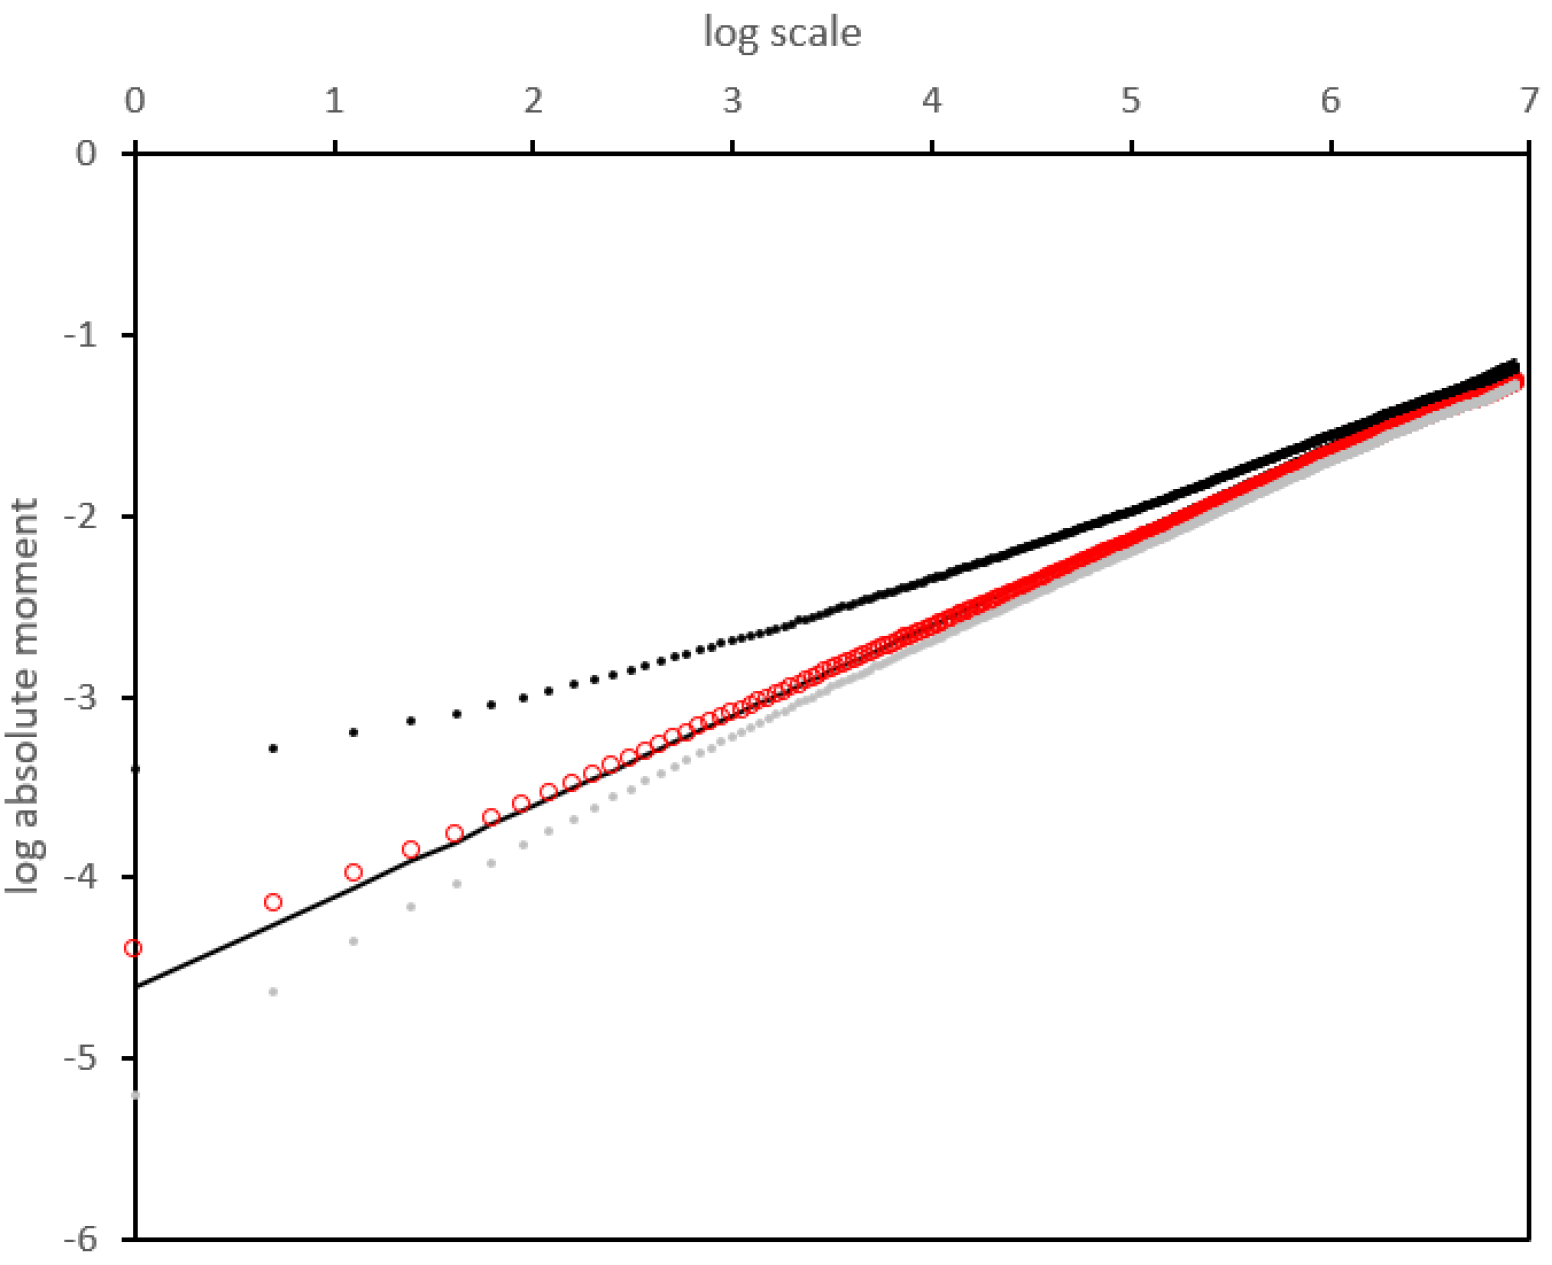
We show on a theoretical example, illustrated in Figure 6, that, despite all the approximations cited above, the filtering method we propose is fairly accurate.
3.2 The log-variance as a fBm
If, instead of the RFSV model assumed in the subsection above, the log-variance follows a fBm, the approximations are then transformed into the following, when using the realized variance proxy:
The main difference with the model in which the log-volatility is an fBm is a factor 4 in the filter of the measurement noise.
4 Empirical results for exchange rates
In this section we implement the empirical absolute moment regressions for volatilities of the most liquid exchange rates. We base our analysis on a real data set from Interactive Brokers. It gathers high-frequency rates between the 18th December 2006 and the 19th June 2019, sampled at a one-minute step, for a total of more than 4.6 millions data for each of the following pairs: EUR/USD, EUR/GBP, EUR/JPY, EUR/CAD, EUR/AUD, GBP/USD, GBP/JPY, USD/JPY, AUD/USD, and AUD/JPY. From these rates, we estimate daily volatilities, using the 1,440 observations in each day. We thus have for each series 3,206 consecutive observations of daily volatility that will be estimated by the realized volatility, defined as the square root of the average quadratic one-minute log-variation. We display the results in Figure 7 and Table 1.
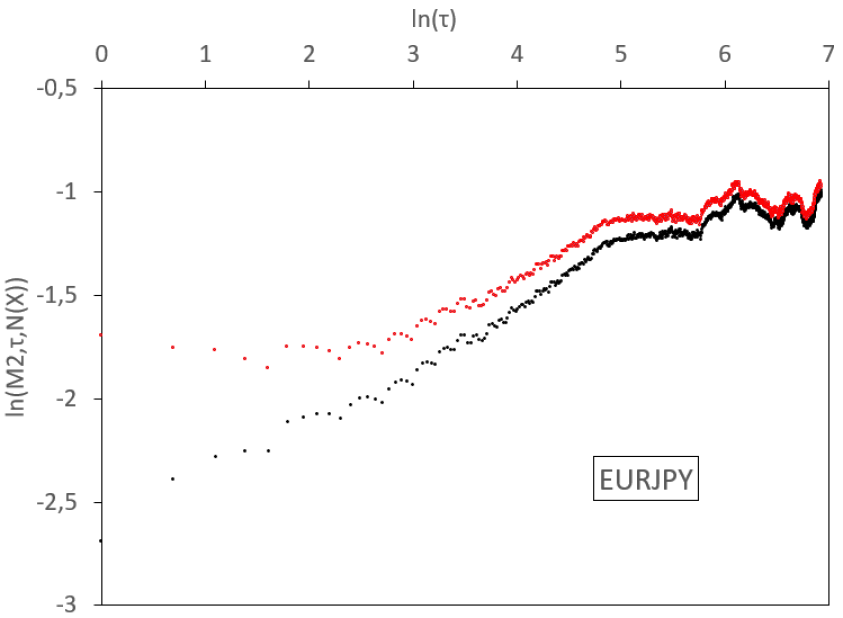
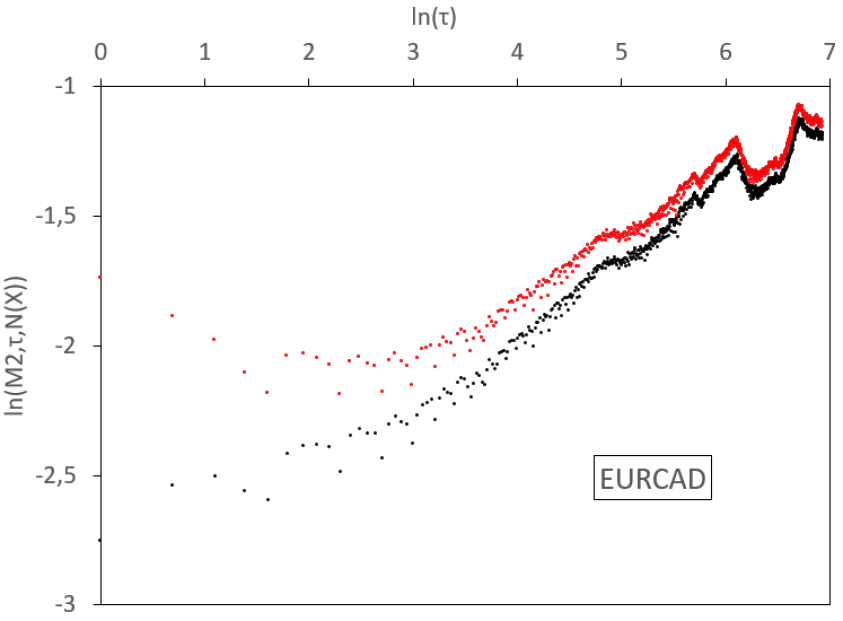
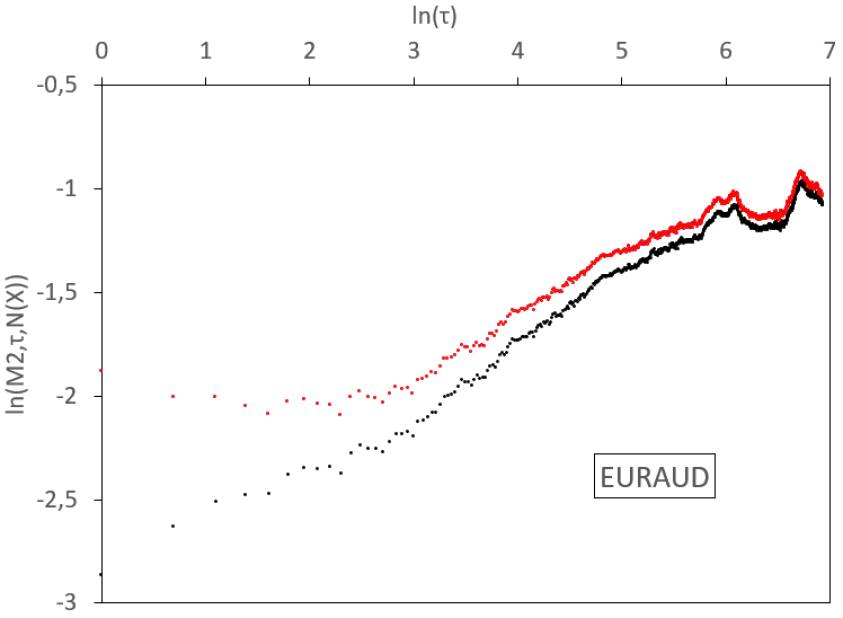
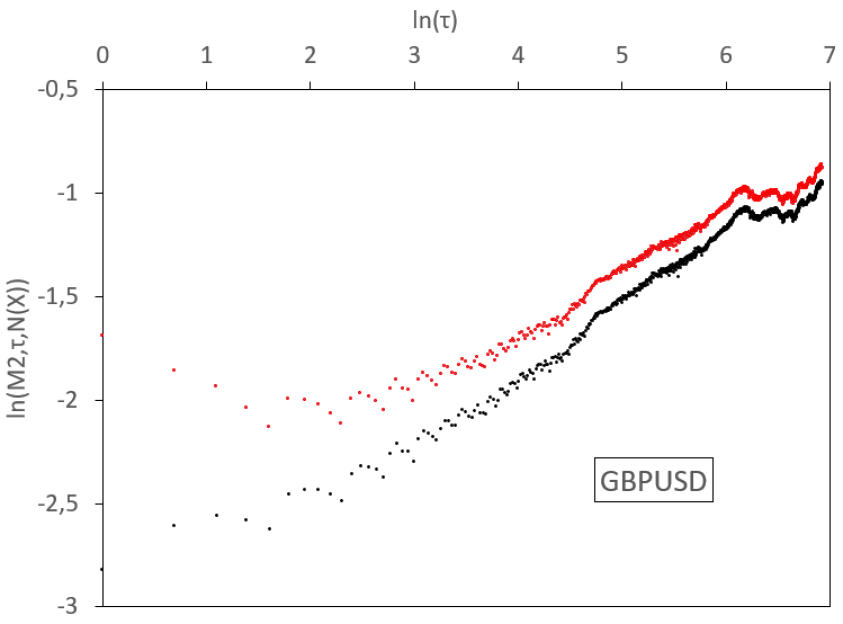
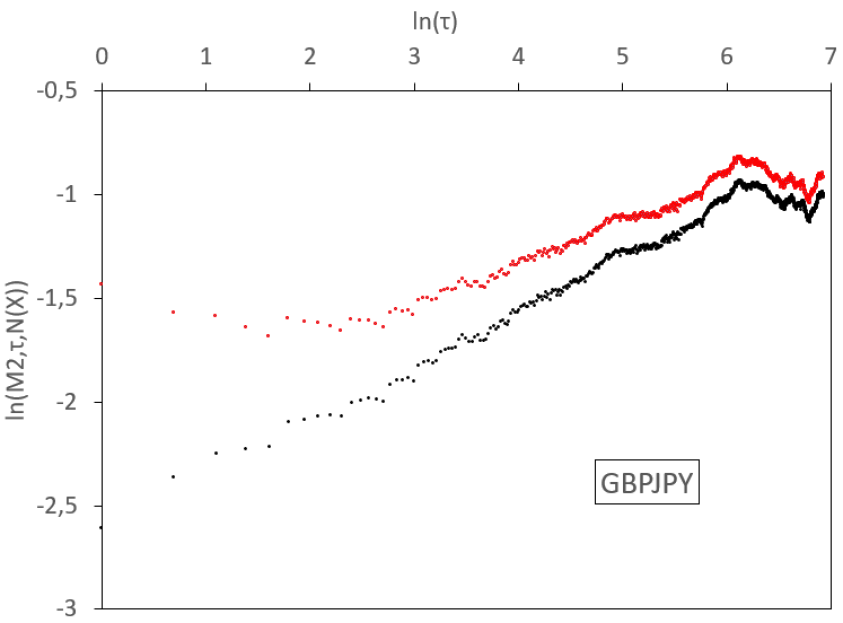
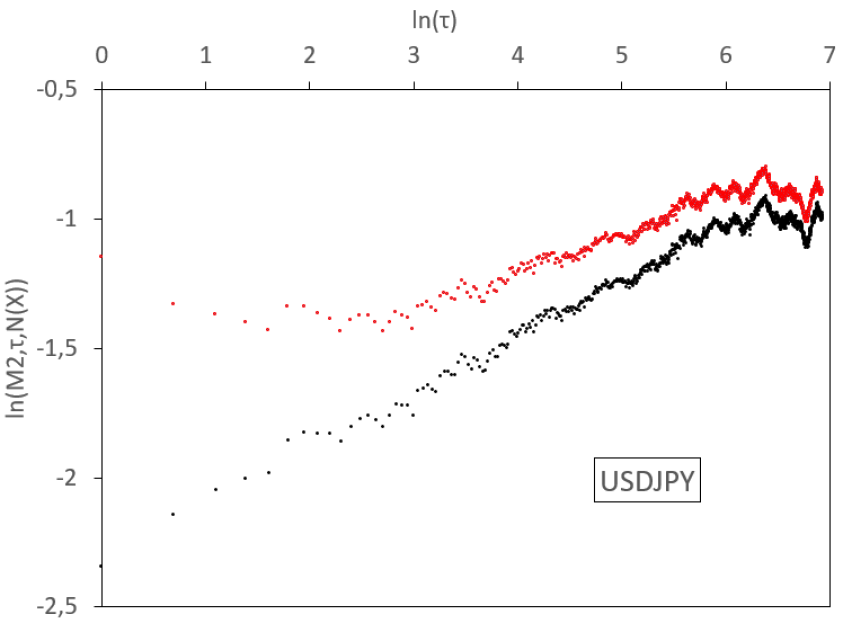
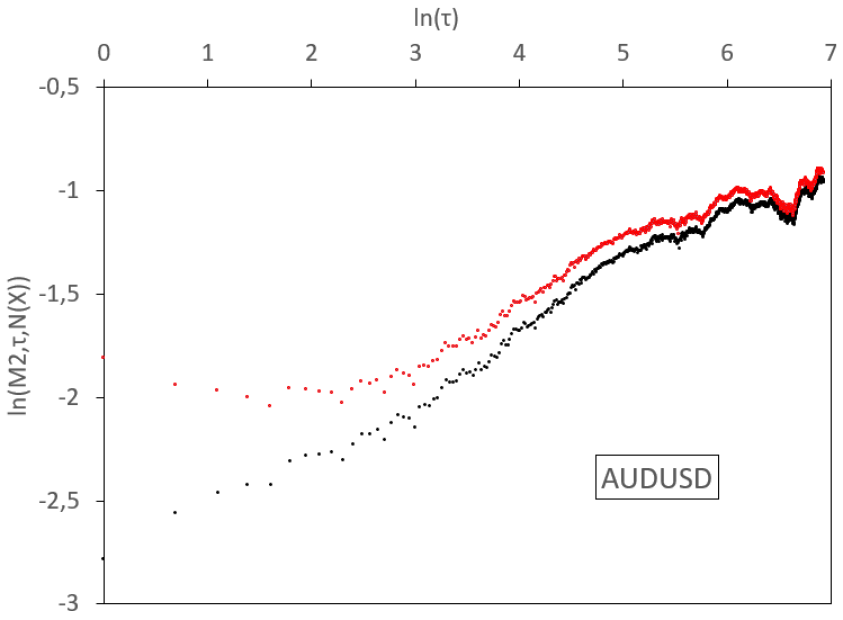
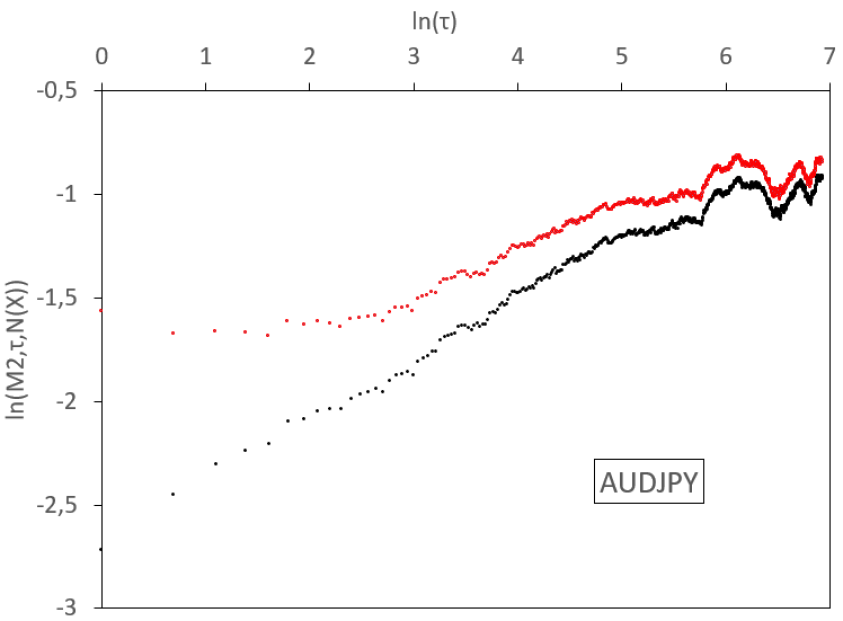
In Figure 7, we observe various regimes for the volatility process, depending on the time scale. In general, for log-scales between 0 and 3 (that is to say between 1 day and 3 weeks), a linear regression of small slope holds for empirical absolute moments. Between 3 and a higher abscissa which depends on the rate considered (so between 3 weeks and a time horizon , which is located between 4.5 months and 12 months), the slope steepens. Above this long time horizon , the slope flattens and, at scales which depend again on the sample, aberrant oscillations appear, due to the limited size of the sample. Therefore, we observe a threefold behaviour of the dynamics: for small time scales (1 day till 3 weeks) we get a small Hurst exponent, at higher scales (3 weeks till ) we have a higher Hurst exponent, and for very large scales (above ) we observe stationarity.
| Scale | Small scales | Large scales |
|---|---|---|
| EUR/USD | 0.075 | 0.244 |
| EUR/GBP | 0.086 | 0.217 |
| EUR/JPY | 0.117 | 0.190 |
| EUR/CAD | 0.068 | 0.184 |
| EUR/AUD | 0.106 | 0.192 |
| GBP/USD | 0.093 | 0.157 |
| GBP/JPY | 0.112 | 0.148 |
| USD/JPY | 0.098 | 0.144 |
| AUD/USD | 0.108 | 0.196 |
| AUD/JPY | 0.135 | 0.152 |
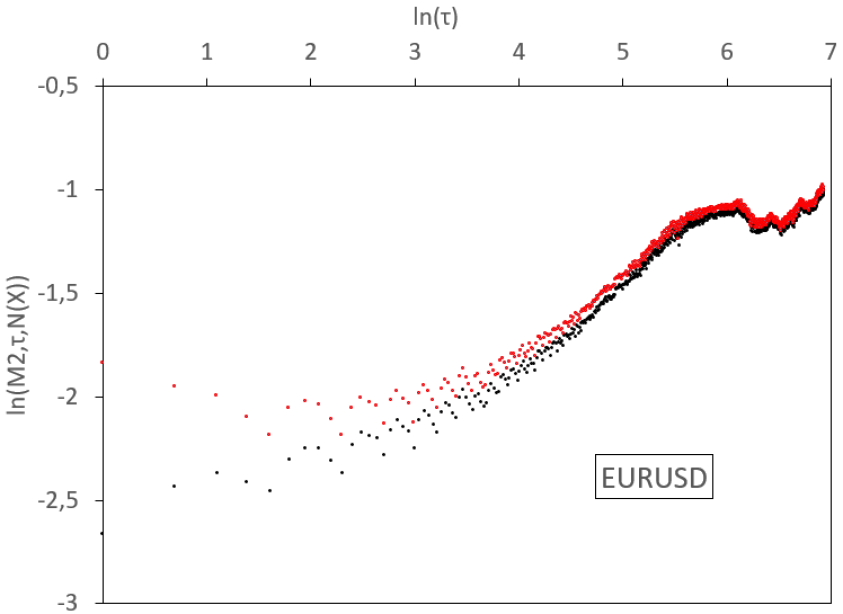
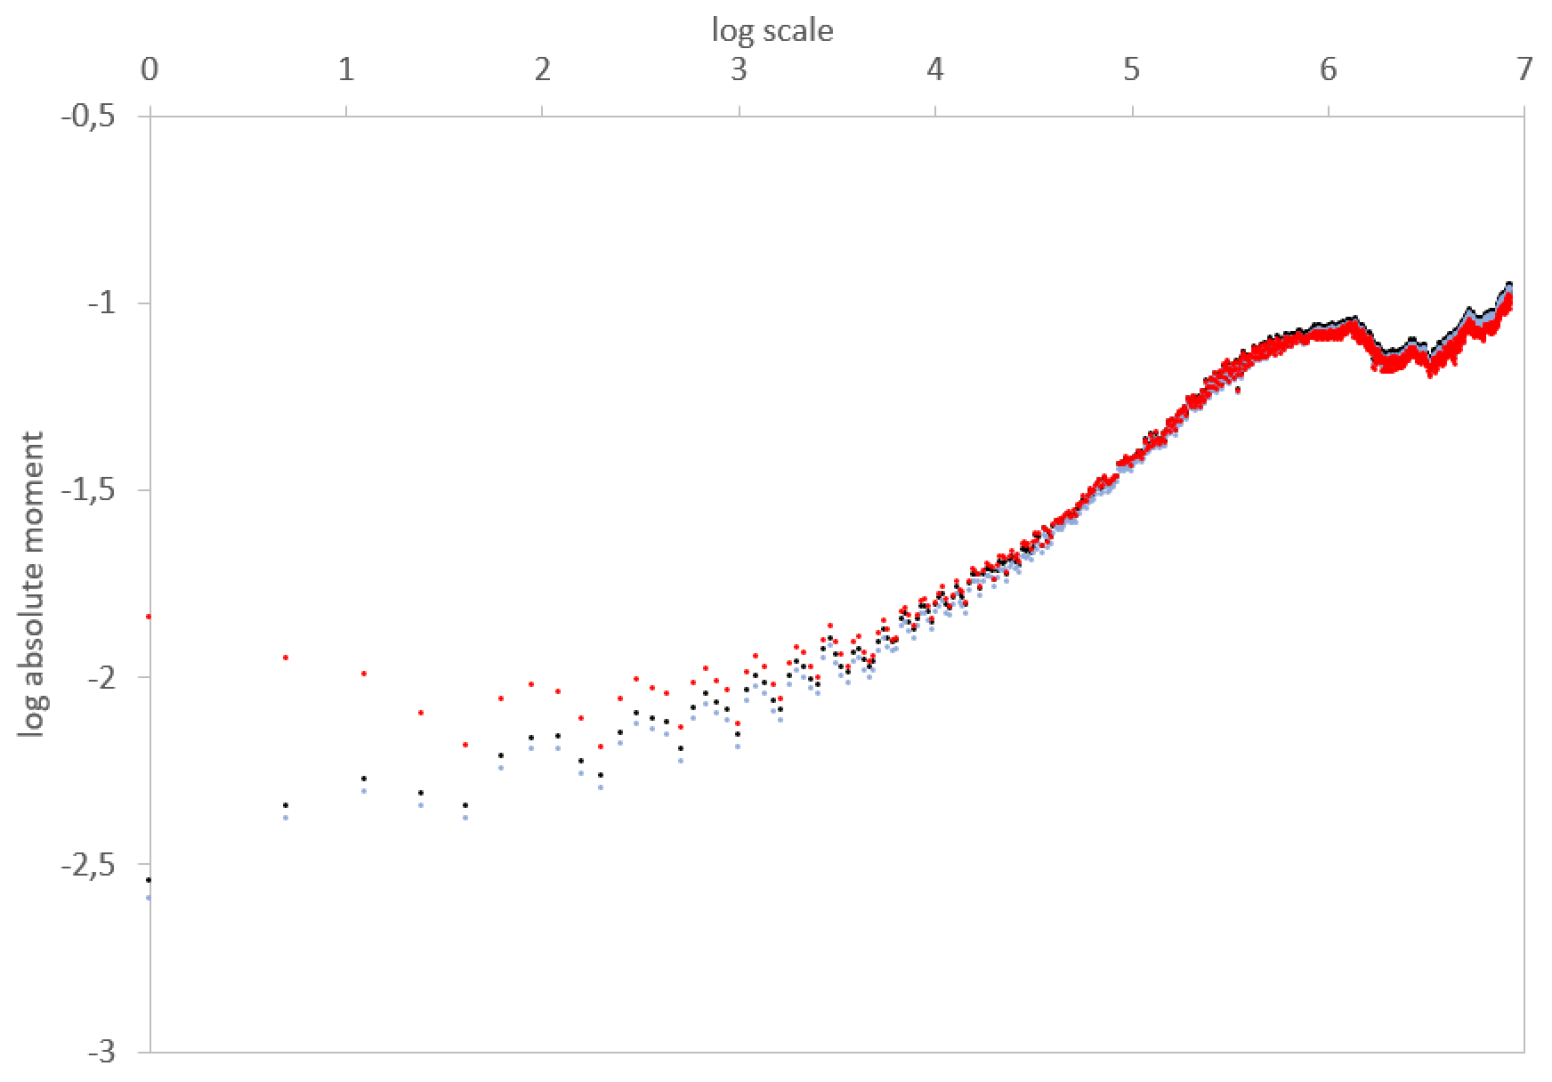
Now we turn our attention to the measurement noise and the smoothing error. We apply the methodology described in the previous section and we filter these noises from the observations. We display the results for the EUR/USD time series in Figure 8, with the successive application of filters.
The filtering of the measurement noise steepens the log-log plot (grey curve). With a 5-minute time step in the computation of realized variance, this effect is slight. Like for the initial curve, we observe convexity when the measurement noise is filtered: higher estimated Hurst exponent for low-frequency increments than for high-frequency increments of volatility. The second filter is about the smoothing error. It accentuates the convexity (red curve). We conclude that the filtered log-log plot still shows convexity. The fBm assumption, for which we should have the same slope of the log-log plot for all scales, is not enough to explain the observations.
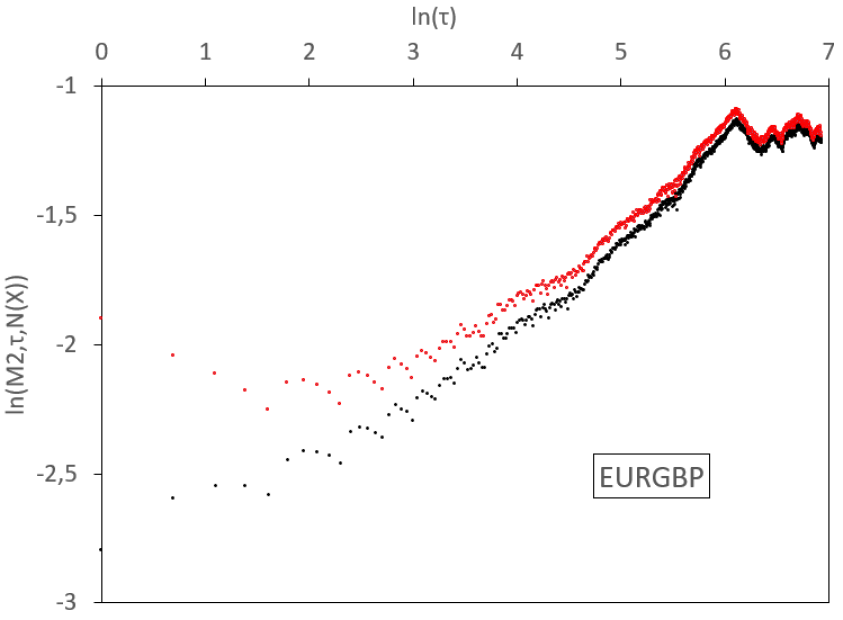
We display similar results for all the studied FX rates in Figure 7. We consider a 1-minute time step in the computation of the realized variance. For FX rates, this amounts to 1440 observations each day and the corresponding measurement noise is almost invisible. We therefore do not decompose the noise filtering in this figure and simply display the raw (black) and fully filtered (red) curves. Once again, we observe convexity in the raw and filtered log-log plots.
These results deserve some comments, since the filtering relies on some approximations:
-
•
Taylor expansions of the logarithm.
-
•
Identification of the empirical moments to the theoretical ones.
-
•
For the filtering of the smoothing error, we assume that the distortion of the log-log plot is the one consistent with a model in which the variance follows an fBm, rather than the rough volatility model that assumes instead that the log-volatility is an fBm. Nevertheless, the smoothing error tends to make the log-plot more concave because the increments of duration of the realized variance mitigates increments of the spot variance of duration with increments of shorter duration, for which the covariance is much stronger. However, we still observe that, even without this approximative filtering, the log-plot is convex in our empirical findings, see Figure 8. On top of that, we have conducted the same analysis as above on FX rates, by replacing proxies of volatility by proxies of variance. The filtered version is very similar, with still a clear convexity: the slope of the log-log plot increases with the time scale. We have not displayed the log-log plots of empirical variance processes in this paper since they are very close to the ones we obtained for the volatility. It supplements our findings of the previous subsection: neither the volatility nor the variance seems to follow a fBm, according to both raw and filtered log-log plots.
-
•
The filtering function for the smoothing error depends on an parameter. But the value of the true Hurst exponent is unknown and should be the output of the filtering, not the input. In Figures 7 and 8, we have input an equal to the large-scale perceived Hurst exponent before denoising666 We thus take into account the fact that the perceived at large scales is less affected by noise than the at small scales., as displayed in Table 1, for instance for EUR/USD. But whatever the value of , the filtered log-log plot (red) shows a stronger convexity than the grey curve, which is also convex. The lower the input in the function , the stronger this convexity. If the true dynamic was an fBm of Hurst exponent , the filtered log-log plot, with as input of , should be a straight line of slope . Since no results in such a straight line, the fBm cannot describe on its own the dynamic of log-volatilities.
Remark 4.1.
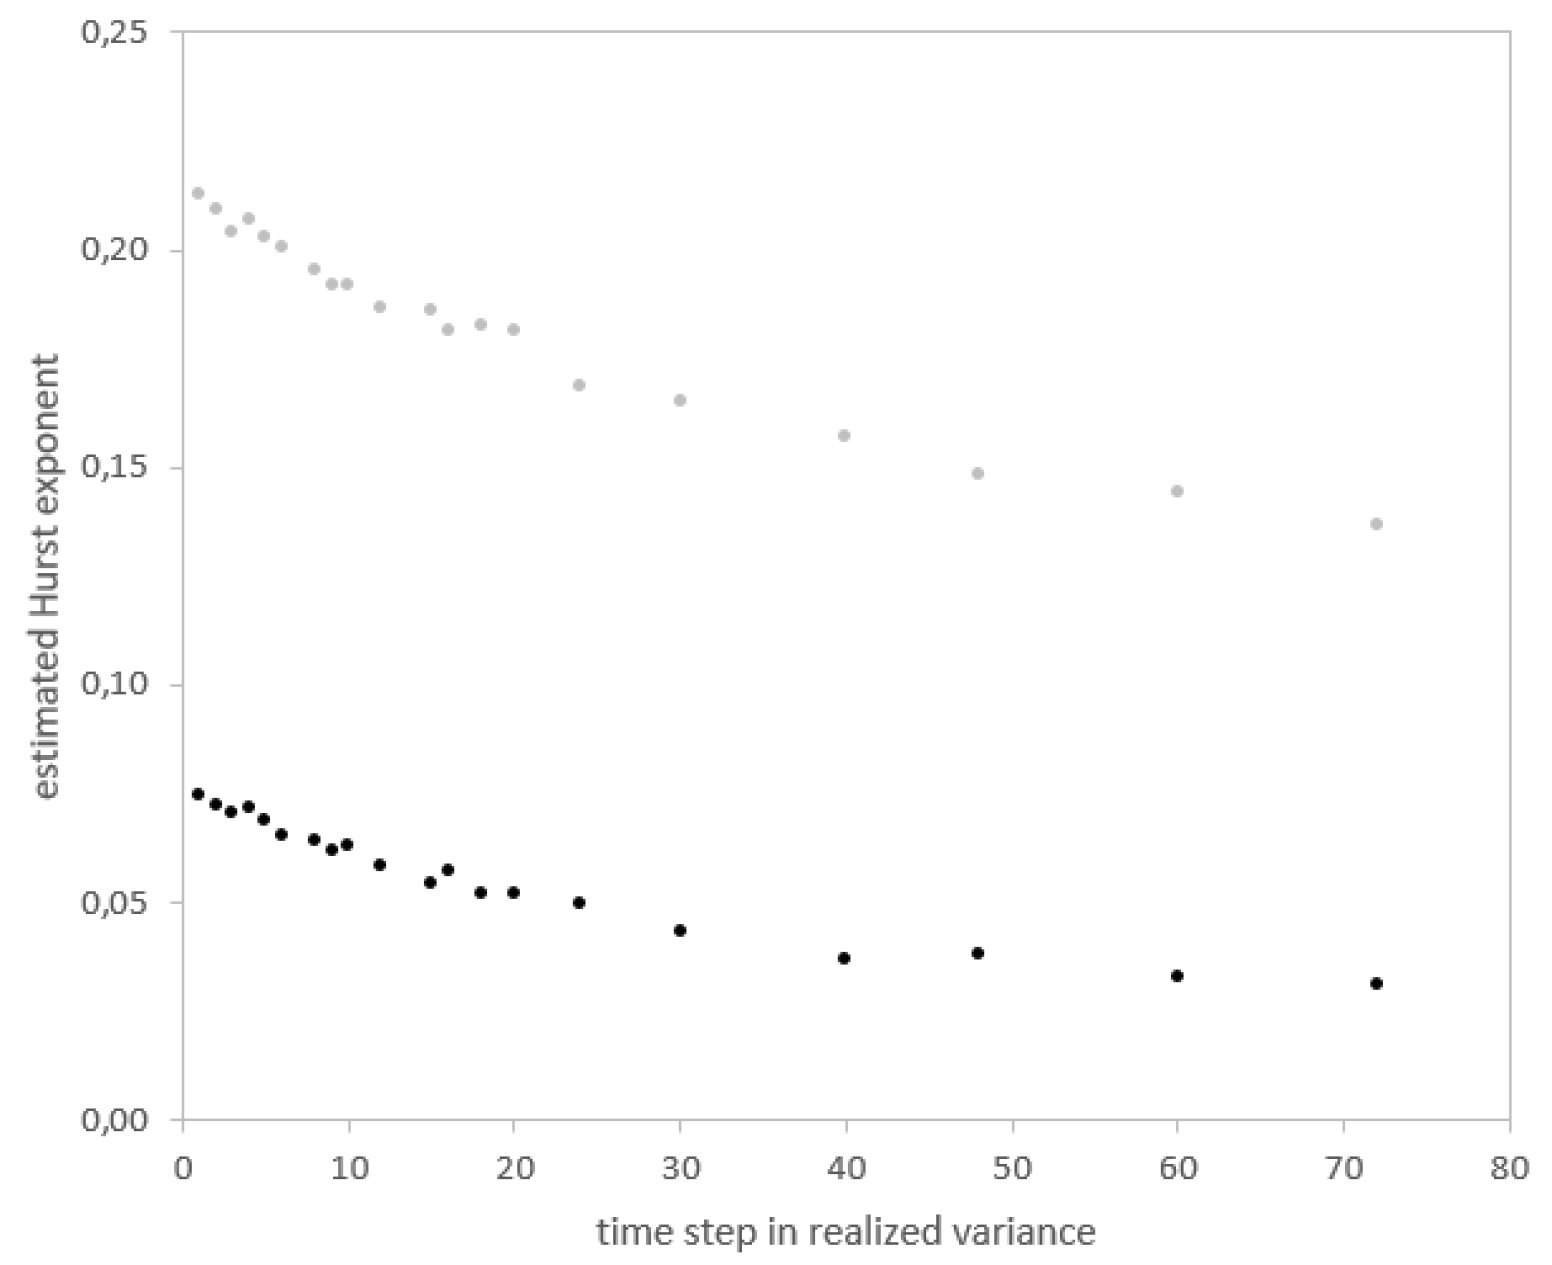
When the time step used in the realized variance increases, the measurement noise increases as well. As a consequence, the slope of the log-log plot decreases (because of the greater impact of the noise in the estimation of the Hurst exponent), as one can see in Figure 9, but empirically the global shape of the log-log plot remains unchanged, still showing convexity. In other words, the choice of the number of time steps in the computation of the realized variance has empirically a limited impact on the estimation of the Hurst exponent in our dataset.
5 Conclusion
In this paper we performed a extensive empirical investigation on a large dataset of exchange rates. Our findings are twofold: first, we confirmed that the estimation of the Hurst exponent is indeed below 0.5 for time scales close to the ones considered in past literature, e.g. in Gatheral et al. (2018). However, when larger time scales are considered (which is possible thanks to the size of our dataset), we face a violation of the stationarity assumption of the increments of the fBm driving the volatility process, in contrast with the rough volatility paradigm. In fact, in the log-log plot we observe a convexity effect that cannot be explained even by taking into account the different types of noises in the estimation procedures. As a consequence, we consider this convexity effect as a new stylized fact of the market that any advanced volatility model should be able to reproduce.
References
- Alòs et al. [2007] E. Alòs, J.A. León, and J. Vives. On the short-time behavior of the implied volatility for jump-diffusion models with stochastic volatility. Finance and stochastics, 11(4):571–589., 2007.
- Andersen and Bollerslev [1997] T.G. Andersen and T. Bollerslev. Intraday periodicity and volatility persistence in financial markets. Journal of empirical finance, 4(2):115–158, 1997.
- Andersen et al. [2003] T.G. Andersen, T. Bollerslev, F.X. Diebold, and P. Labys. The distribution of realized exchange rate volatility. Journal of the American Statistical Association, 96:42–55, 2003.
- Baillie [1996] R.T. Baillie. Long memory processes and fractional integration in econometrics. Journal of econometrics, 73(1):5–59, 1996.
- Barndorff-Nielsen and Shephard [2001] O.E. Barndorff-Nielsen and N. Shephard. Non-Gaussian Ornstein-Uhlenbeck-based models and some of their uses in financial economics. Journal of the Royal Statistical Society: Series B (Statistical Methodology), 63(2):167–241, 2001.
- Barndorff-Nielsen and Shephard [2002] O.E. Barndorff-Nielsen and N. Shephard. Econometric analysis of realized volatility and its use in estimating stochastic volatility models. Journal of the Royal Statistical Society: Series B (Statistical Methodology), 64(2):253–280, 2002.
- Benassi et al. [1998] A. Benassi, S. Cohen, and J. Istas. Identifying the multifractional function of a Gaussian process. Statistics and probability letters, 39(4):337–345, 1998.
- Bennedsen et al. [2016] M. Bennedsen, A. Lunde, and M.S. Pakkanen. Decoupling the short- and long-term behavior of stochastic volatility. arXiv preprint, 1610.00332, 2016.
- Bollerslev and Mikkelsen [1996] T. Bollerslev and H.O. Mikkelsen. Modeling and pricing long memory in stock market volatility. Journal of econometrics, 73(1):151–184, 1996.
- Breidt et al. [1998] F.J. Breidt, N. Crato, and P. De Lima. The detection and estimation of long memory in stochastic volatility. Journal of econometrics, 83(1-2):325–348, 1998.
- Bubák et al. [2011] V. Bubák, E. Kočenda, and F. Žikeš. Volatility transmission in emerging European foreign exchange markets. Journal of banking & finance, 35(11):2829–2841, 2011.
- Cheridito et al. [2003] P. Cheridito, H. Kawaguchi, and M. Maejima. Fractional Ornstein-Uhlenbeck processes. Electronic journal of probability, 8(3):1–14, 2003.
- Coeurjolly [2005] J.-F. Coeurjolly. Identification of multifractional Brownian motion. Bernoulli, 11(6):987–1008, 2005.
- Comte and Renault [1998] F. Comte and E. Renault. Long memory in continuous-time stochastic volatility models. Mathematical finance, 8(4):291–323, 1998.
- Cuchiero and Teichmann [2015] C. Cuchiero and J. Teichmann. Fourier transform methods for pathwise covariance estimation in the presence of jumps. Stochastic processes and their applications, 125(1):116–160, 2015.
- Ding et al. [1993] Z. Ding, C.W. Granger, and R.F. Engle. A long memory property of stock market returns and a new model. Journal of empirical finance, 1(1):83–106, 1993.
- Duffie et al. [2003] D. Duffie, D. Filipovic, and W. Schachermayer. Affine processes and applications in finance. The Annals of Applied Probability, 13(3):984–1053, 2003.
- Dupire [1994] B. Dupire. Pricing with a smile. Risk, 7:18–20, 1994.
- Fukasawa et al. [2019] M. Fukasawa, T. Takabatake, and R. Westphal. Is volatility rough? arXiv preprint, 1905.04852, 2019.
- Garcin [2017] M. Garcin. Estimation of time-dependent Hurst exponents with variational smoothing and application to forecasting foreign exchange rates. Physica A: statistical mechanics and its applications, 483:462–479, 2017.
- Garcin [2019] M. Garcin. Hurst exponents and delampertized fractional Brownian motions. International journal of theoretical and applied finance, 22(5):1950024, 2019.
- Garcin and Goulet [2019] M. Garcin and C. Goulet. Non-parametric news impact curve: a variational approach. Soft computing, 24(18):13797–13812, 2019.
- Gatheral et al. [2018] J. Gatheral, T. Jaisson, and M. Rosenbaum. Volatility is rough. Quantitative finance, 18(6):933–949, 2018.
- Geweke and Porter-Hudak [1983] J. Geweke and S. Porter-Hudak. The estimation and application of long memory time series models. Journal of time series analysis, 4(4):221–238, 1983.
- Hagan et al. [2002] P.S. Hagan, D. Kumar, A. Lesniewski, and D.E. Woodward. Managing smile risk. Wilmott Magazine, 1:84–108, 2002.
- Heston [1993] S.L. Heston. A closed-form solution for options with stochastic volatility with applications to bond and currency options. The Review of Financial Studies, 6(2):327–343, 1993.
- Jacod and Protter [1998] J. Jacod and P. Protter. Asymptotic error distributions for the euler method for stochastic differential equations. The Annals of Probability, 26(1):267–307, 1998.
- Kolmogorov [1940] A. Kolmogorov. The Wiener spiral and some other interesting curves in Hilbert space. Doklady akad. nauk SSSR, 26(2):115–118, 1940.
- Kuck and Maderitsch [2019] K. Kuck and R. Maderitsch. Intra-day dynamics of exchange rates: New evidence from quantile regression. Quarterly review of economics and finance, 71:247–257, 2019.
- Lallouache and Abergel [2013] M. Lallouache and F. Abergel. Empirical properties of the foreign exchange interdealer market. arXiv preprint, 1307.5440, 2013.
- Lo [1991] A.W. Lo. Long-term memory in stock market prices. Econometrica, 59(5):1279–1313, 1991.
- Lo and MacKinlay [1988] A.W. Lo and A.C. MacKinlay. Stock market prices do not follow random walks: Evidence from a simple specification test. Review of Financial Studies, 1(1):41–66, 1988.
- Mandelbrot and van Ness [1968] B. Mandelbrot and J. van Ness. Fractional Brownian motions, fractional noises and applications. SIAM review, 10(4):422–437, 1968.
- Parkinson [1980] M. Parkinson. The extreme value method for estimating the variance of the rate of return. Journal of business, 53(1):61–65, 1980.
- Robert and Rosenbaum [2011a] C.Y. Robert and M. Rosenbaum. A new approach for the dynamics of ultra-high-frequency data: The model with uncertainty zones. Journal of Financial Econometrics, 9(2):344–366, 2011a.
- Robert and Rosenbaum [2011b] C.Y. Robert and M. Rosenbaum. Volatility and covariation estimation when microstructure noise and trading times are endogenous. Mathematical Finance, 22(1):133–164, 2011b.
- Rogers [2019] L.C.G. Rogers. Things we think we know. Preprint, available at https://www.skokholm.co.uk/lcgr/downloadable-papers/, 2019.
- Rootzen [1980] H. Rootzen. Limit distributions for the error in approximations of stochastic integrals. The Annals of Probability, 8(2):241–251, 1980.
- Stein and Stein [1994] E. Stein and J. Stein. Stock price distributions with stochastic volatility: An analytic approach. The Review of Financial Studies, 4(4):727–752, 1994.
- Šapina et al. [2020] M. Šapina, M. Garcin, K. Kramarić, K. Milas, D. Brdarić, and M. Pirić. The Hurst exponent of heart rate variability in neonatal stress, based on a mean-reverting fractional Lévy stable motion. Fluctuation and noise letters, 19(3):2050026, 2020.